
















Copyright: ©Author(s) 2027.
World J Gastroenterol. Jan 14, 2027; 33(2): 123092
Published online Jan 14, 2027. doi: 10.3748/wjg.123092
Published online Jan 14, 2027. doi: 10.3748/wjg.123092
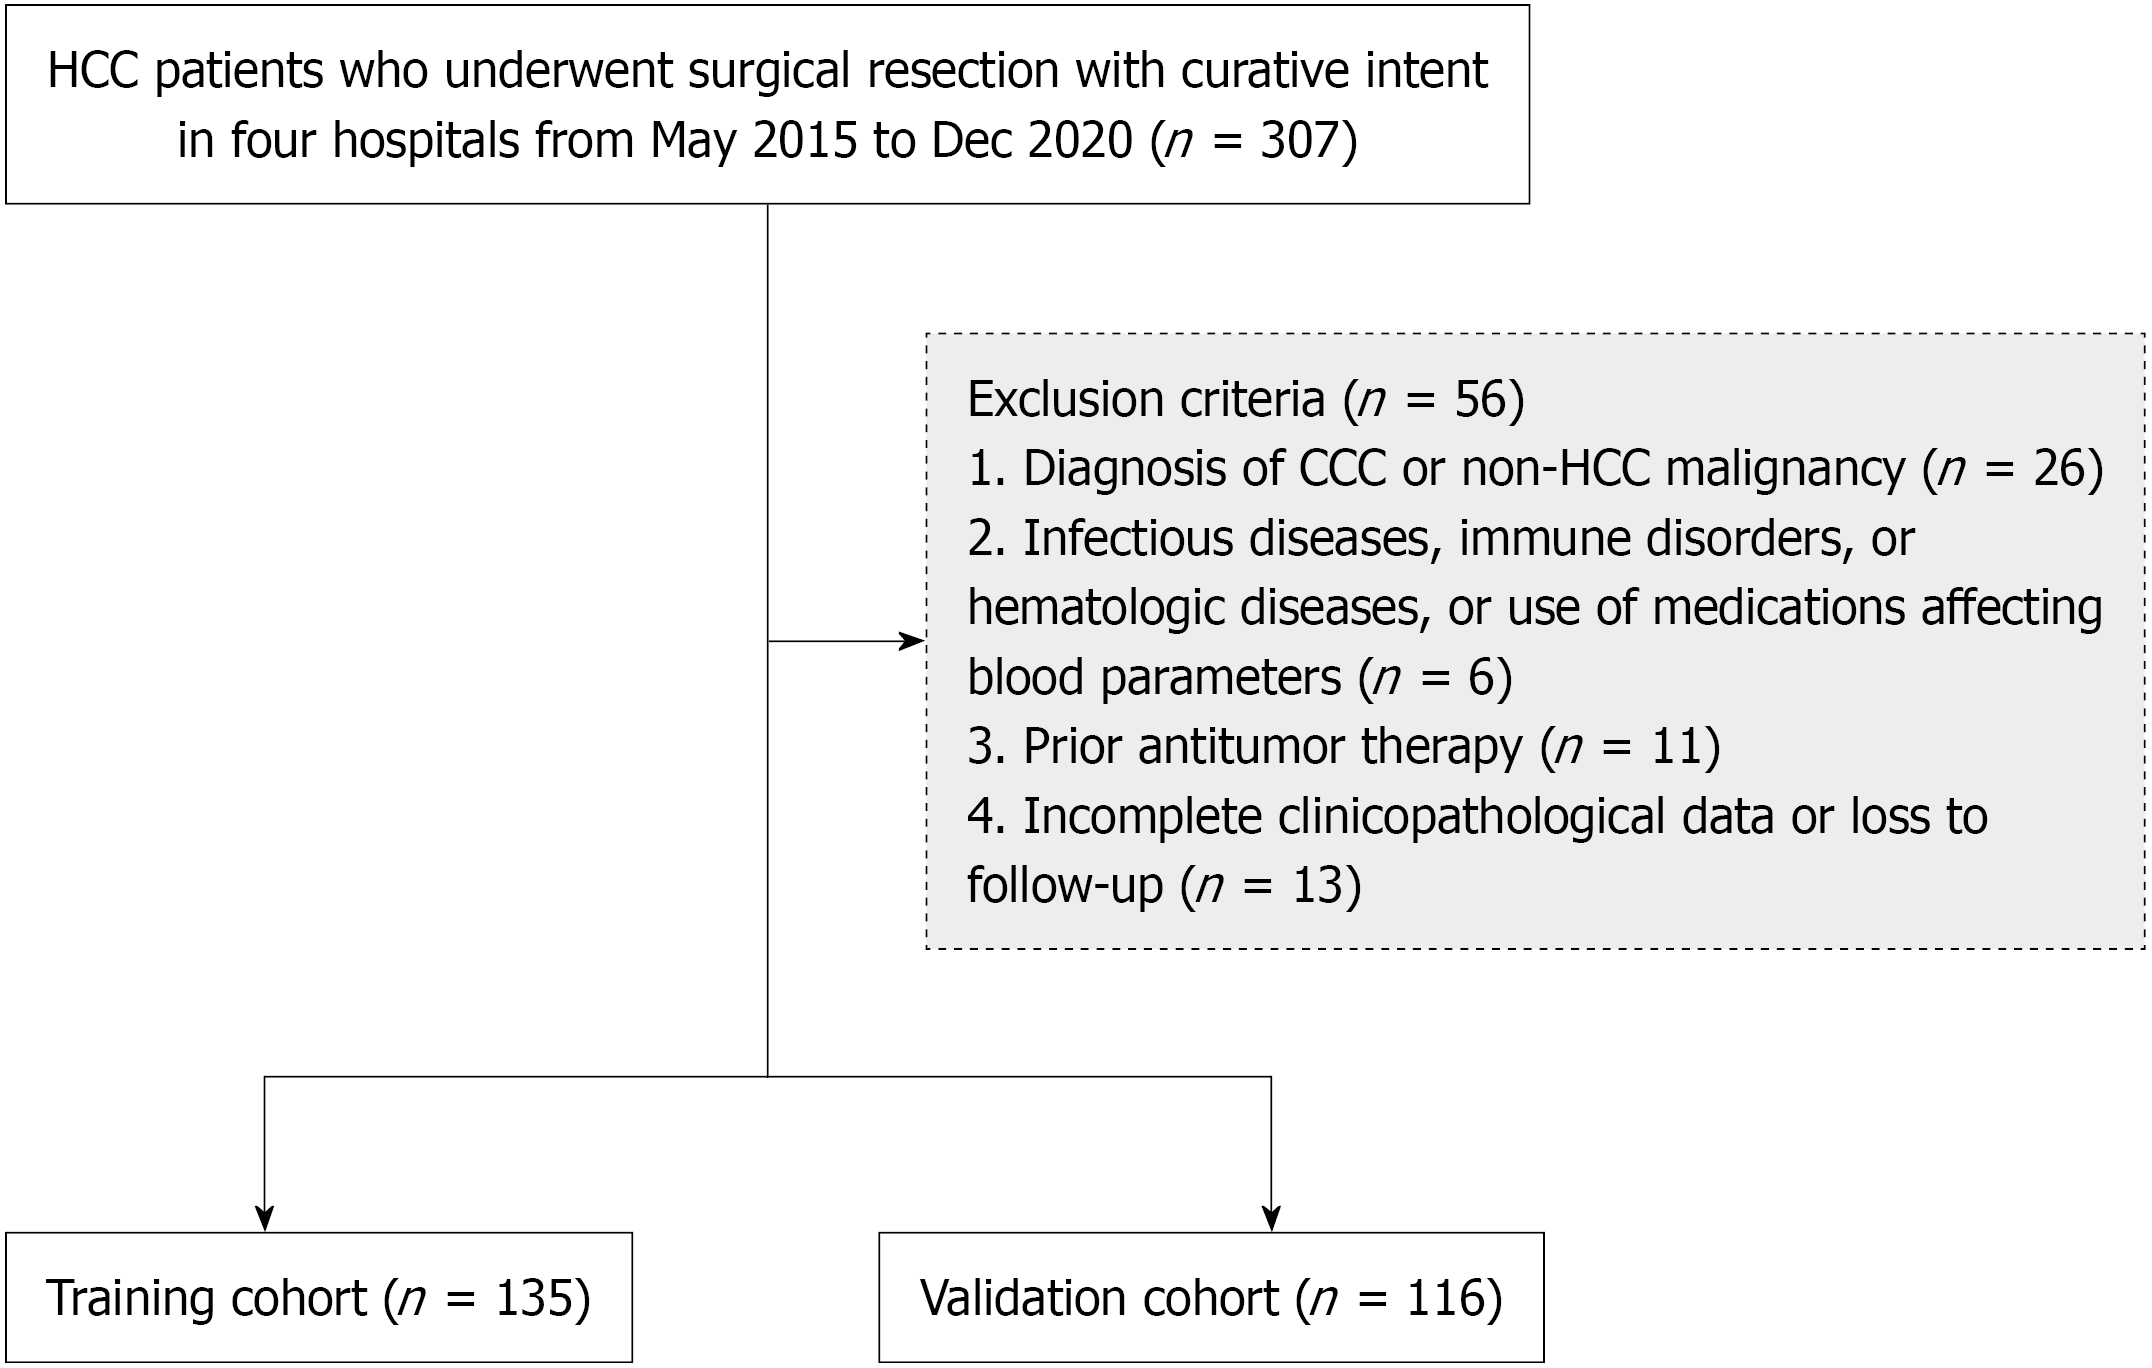
Figure 1 The flowchart of hepatocellular carcinoma patient enrollment.
HCC: Hepatocellular carcinoma; CCC: Cholangiocarcinoma.
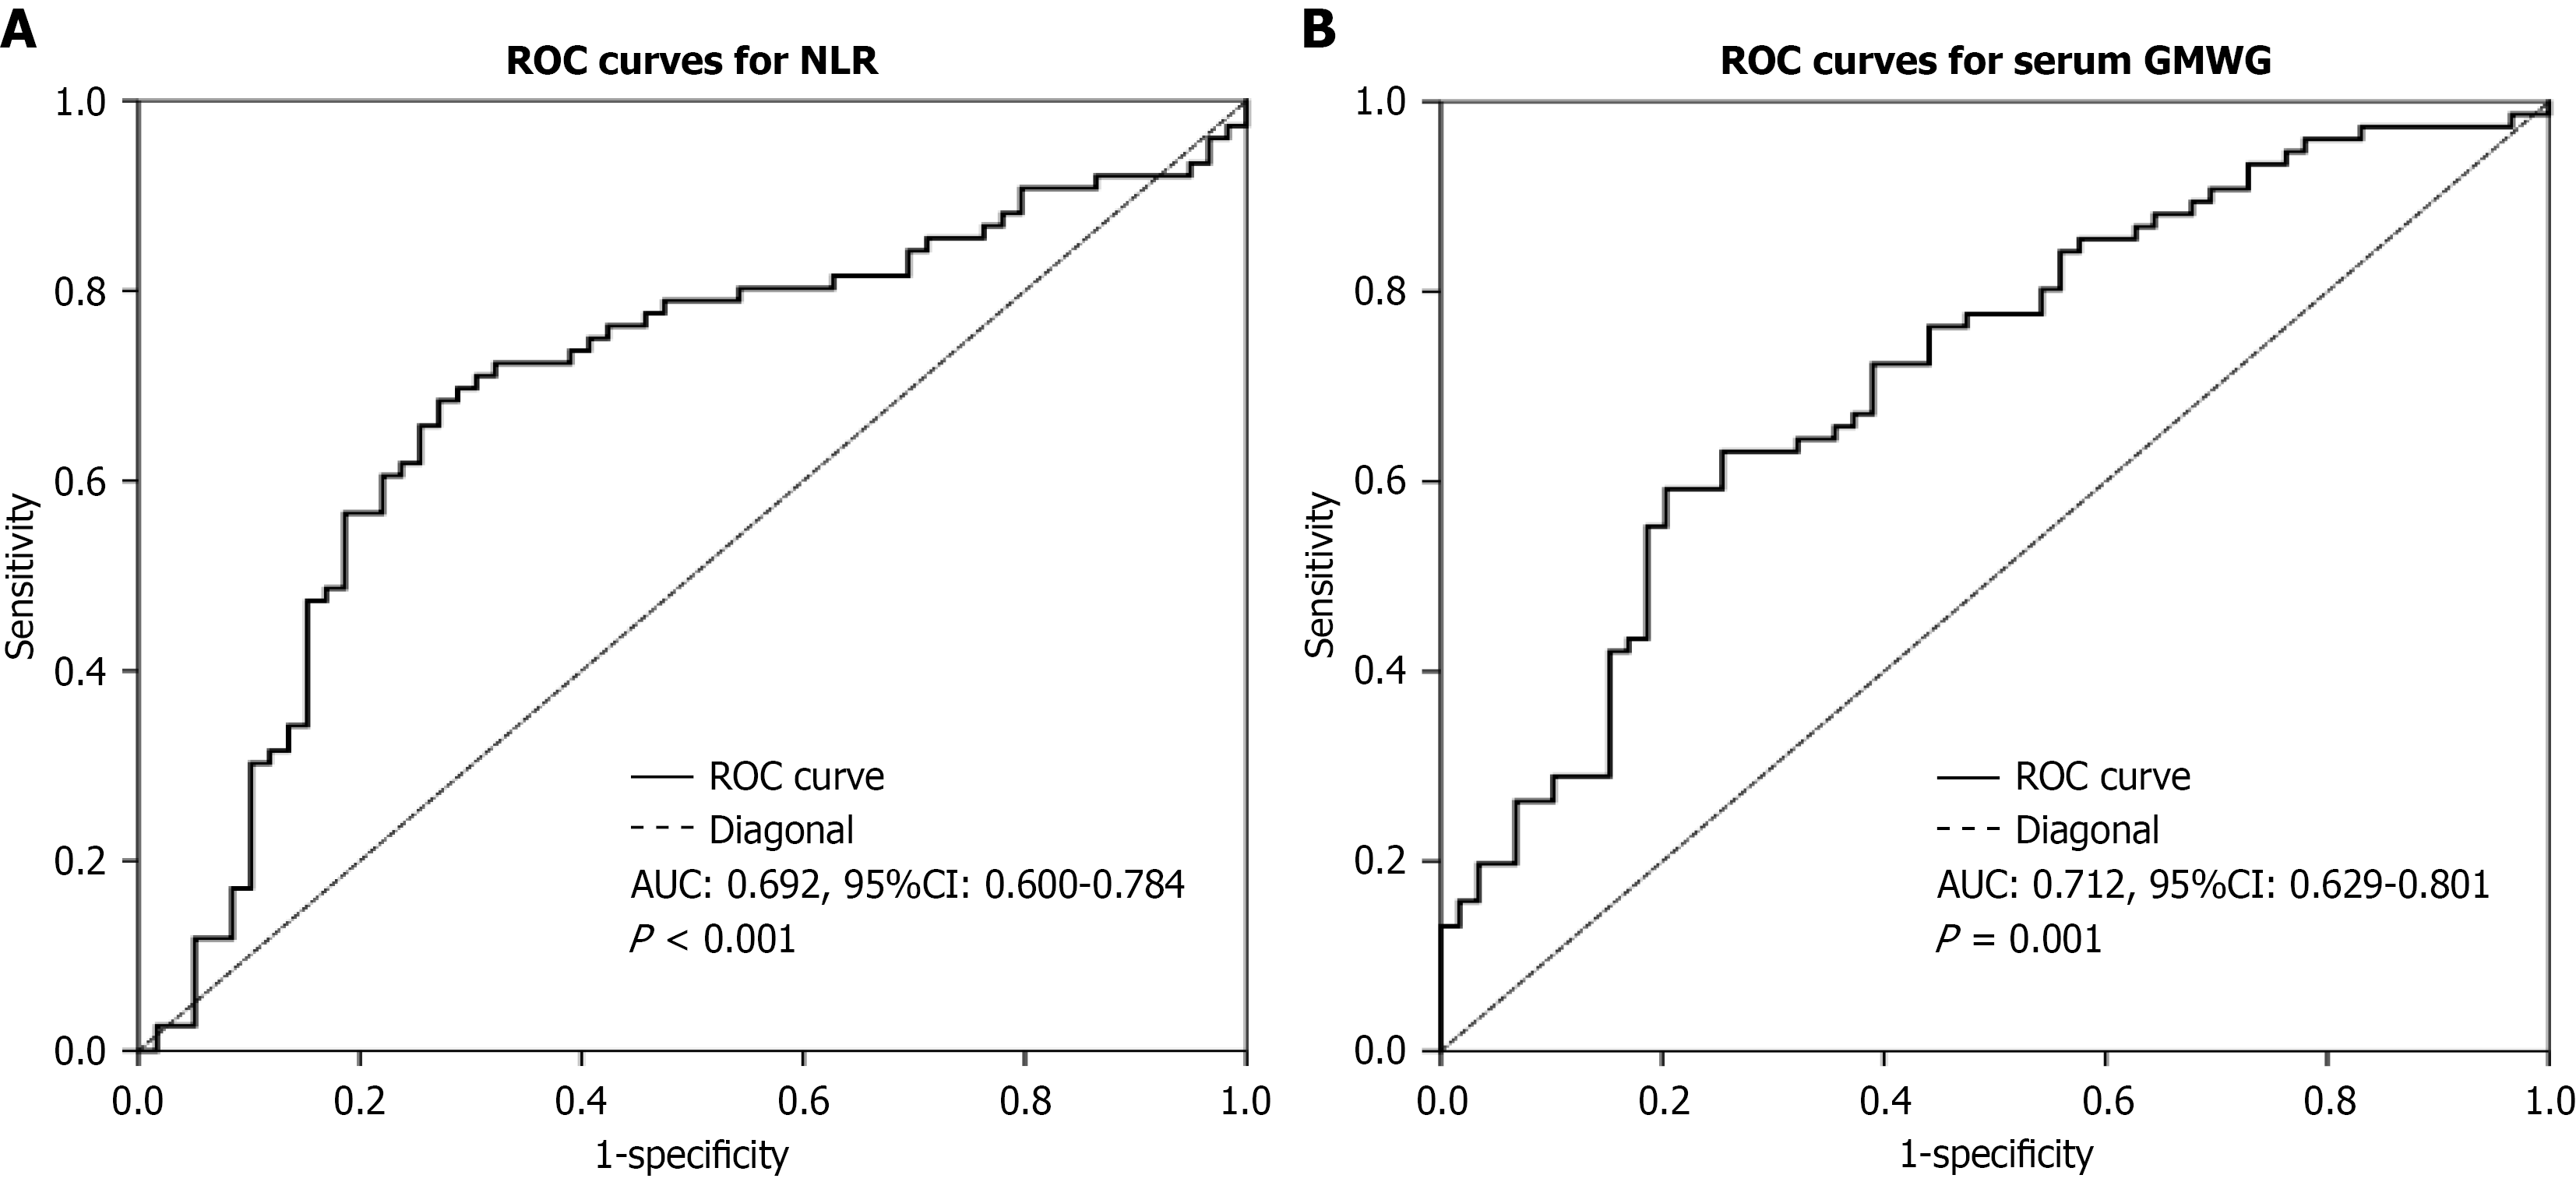
Figure 2 The receiver operating characteristic curves for determining cutoff values of neutrophil-to-lymphocyte ratio and gamma-glutamyl transpeptidase and white blood cells for predicting overall survival in the training cohort.
A: Neutrophil-to-lymphocyte ratio; B: Gamma-glutamyl transpeptidase and white blood cells. ROC: Receiver operating characteristic; NLR: Neutrophil-to-lymphocyte ratio; GMWG: Gamma-glutamyl transpeptidase and white blood cells; AUC: Area under the curve; CI: Confidence interval.
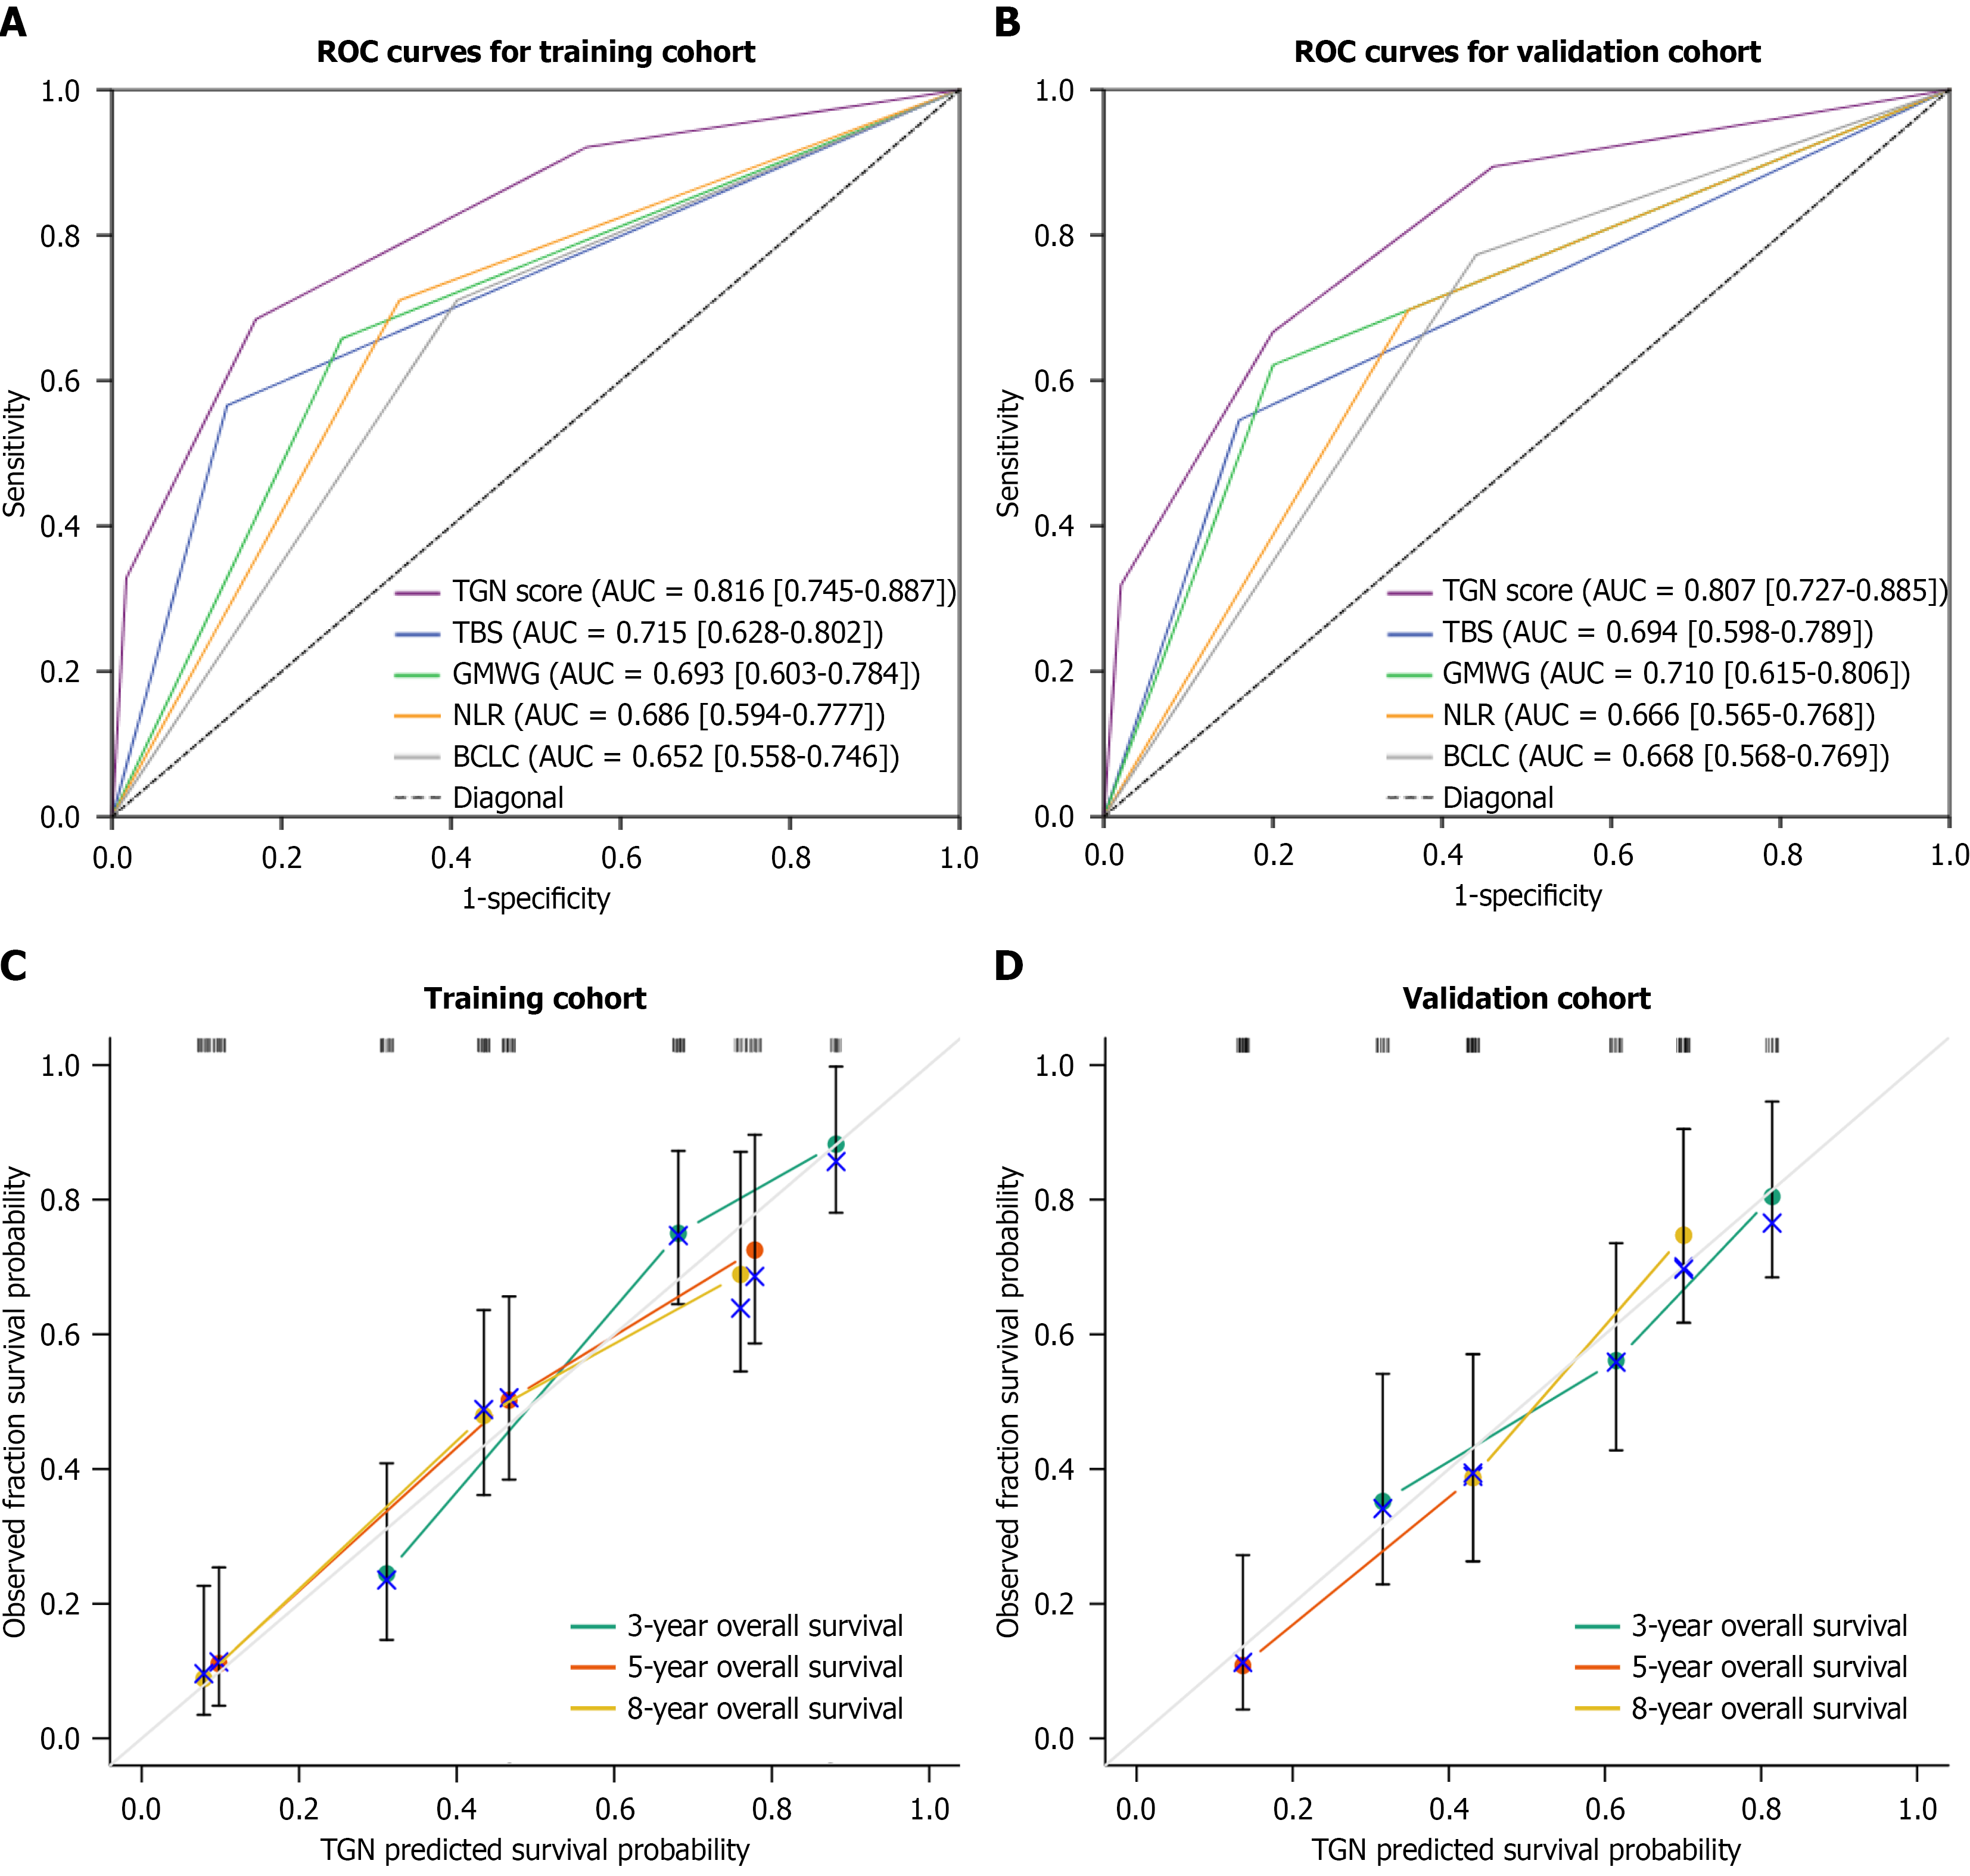
Figure 3 Prediction performance of the TGN scoring model based on receiver operating characteristic curve analysis and calibration curve analysis.
Area under the curve values of the TGN scoring model, tumor burden score, gamma-glutamyl transpeptidase and white blood cells, neutrophil-to-lymphocyte ratio, and Barcelona Clinic Liver Cancer in the training and validation cohorts. Calibration curves demonstrated high concordance between TGN predicted and observed overall survival at 3, 5, and 8 years in the training and validation cohorts. A: Area under the curve of training cohort; B: Area under the curve of validation cohort; C: Calibration curve of training cohort; D: Calibration curve of validation cohort. ROC: Receiver operating characteristic; TBS: Tumor burden score; GMWG: Gamma-glutamyl transpeptidase and white blood cells; NLR: Neutrophil-to-lymphocyte ratio; BCLC: Barcelona Clinic Liver Cancer; AUC: Area under the curve.
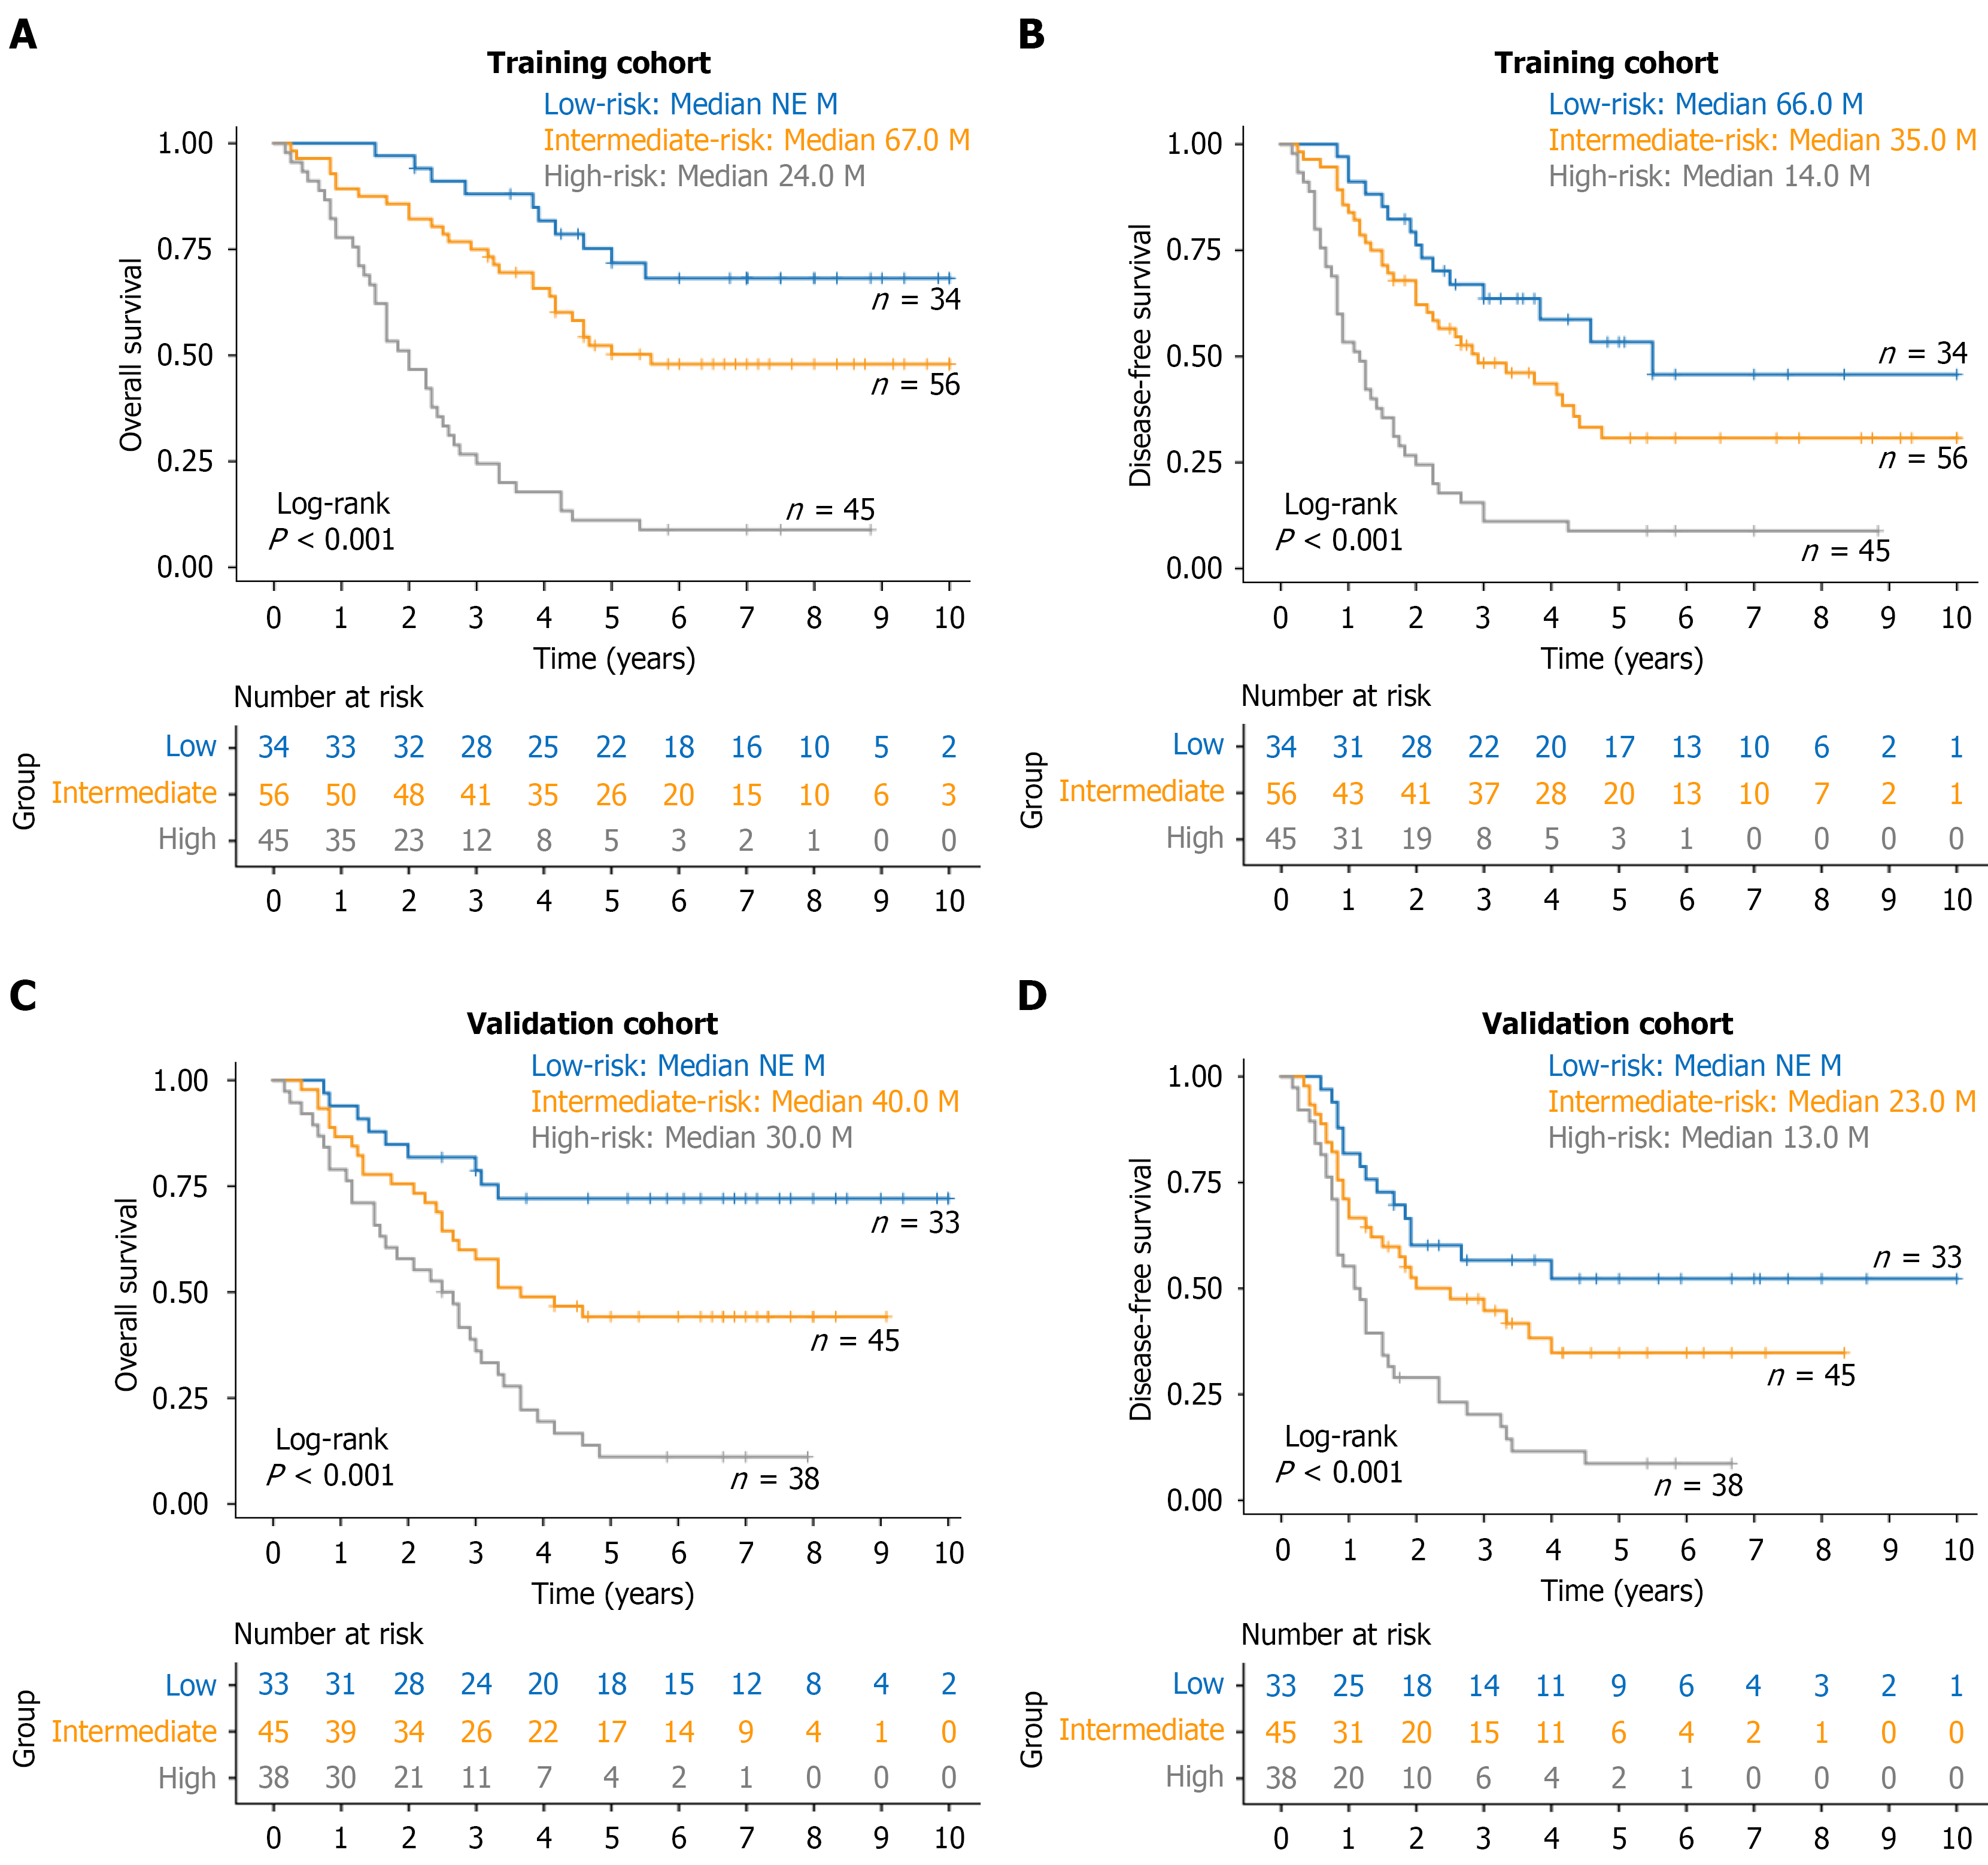
Figure 4 Prediction of overall survival and disease-free survival based on the TGN scoring model.
Kaplan-Meier curves illustrated overall survival and disease-free survival differences stratified by the TGN model, which classified patients into low-, intermediate-, and high-risk groups. Median survival and log-rank P values between groups were shown. A and B: Training cohort; C and D: Validation cohort. NE: Not evaluable; M: Months.
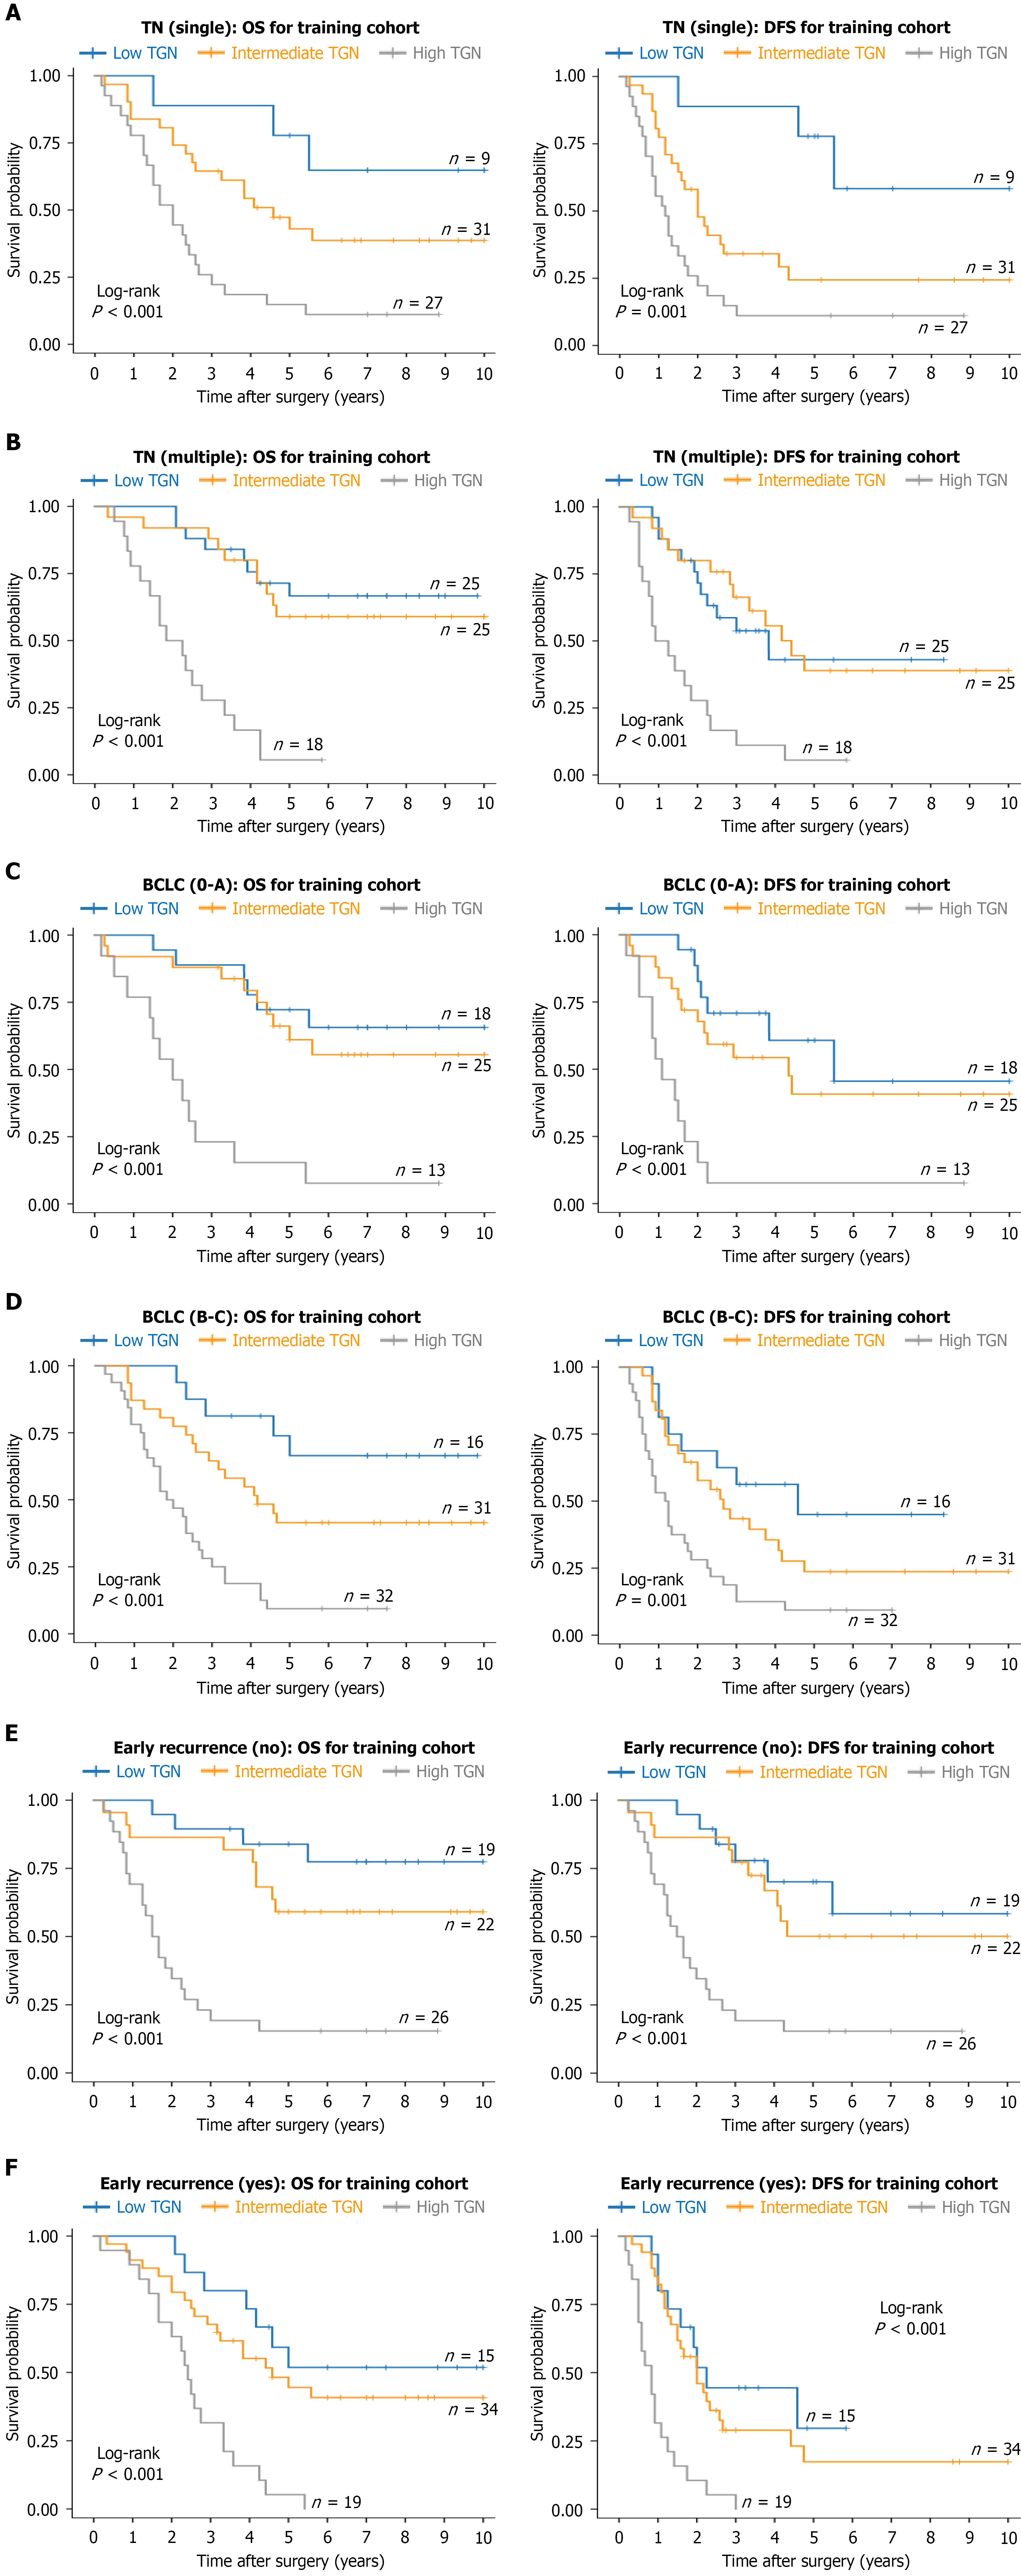
Figure 5 Subgroup analyses of survival based on clinical characteristics in the training cohort.
The TGN score demonstrated excellent discriminative performance across all subgroups. A: Single tumor [log-rank, overall survival (OS): P < 0.001, disease-free survival (DFS): P = 0.001]; B: Multiple tumors (log-rank, OS: P < 0.001, DFS: P < 0.001); C: Barcelona Clinic Liver Cancer stage (0-A) (log-rank, OS: P < 0.001, DFS: P < 0.001); D: Barcelona Clinic Liver Cancer stage (B-C) (log-rank, OS: P < 0.001, DFS: P = 0.001); E: Without early recurrence (log-rank, OS: P < 0.001, DFS: P < 0.001); F: Early recurrence (log-rank, OS: P < 0.001, DFS: P < 0.001). TN: Tumor number; OS: Overall survival; DFS: Disease-free survival; BCLC: Barcelona Clinic Liver Cancer.
- Citation: Liao MJ, Zhou Y, Wang ZL, Wang XX, Ai X, Song LN, Fei R, Cong X, Liu F, Zhu PP, Chen HS, Liao WJ, Rao HY. Development and validation of a prognostic prediction model for alpha-fetoprotein-negative hepatocellular carcinoma with microvascular invasion after surgery. World J Gastroenterol 2027; 33(2): 123092
- URL: https://www.wjgnet.com/1007-9327/full/v33/i2/123092.htm
- DOI: https://dx.doi.org/10.3748/wjg.123092