
















Copyright: ©Author(s) 2027.
World J Gastroenterol. Jan 14, 2027; 33(2): 122397
Published online Jan 14, 2027. doi: 10.3748/wjg.122397
Published online Jan 14, 2027. doi: 10.3748/wjg.122397
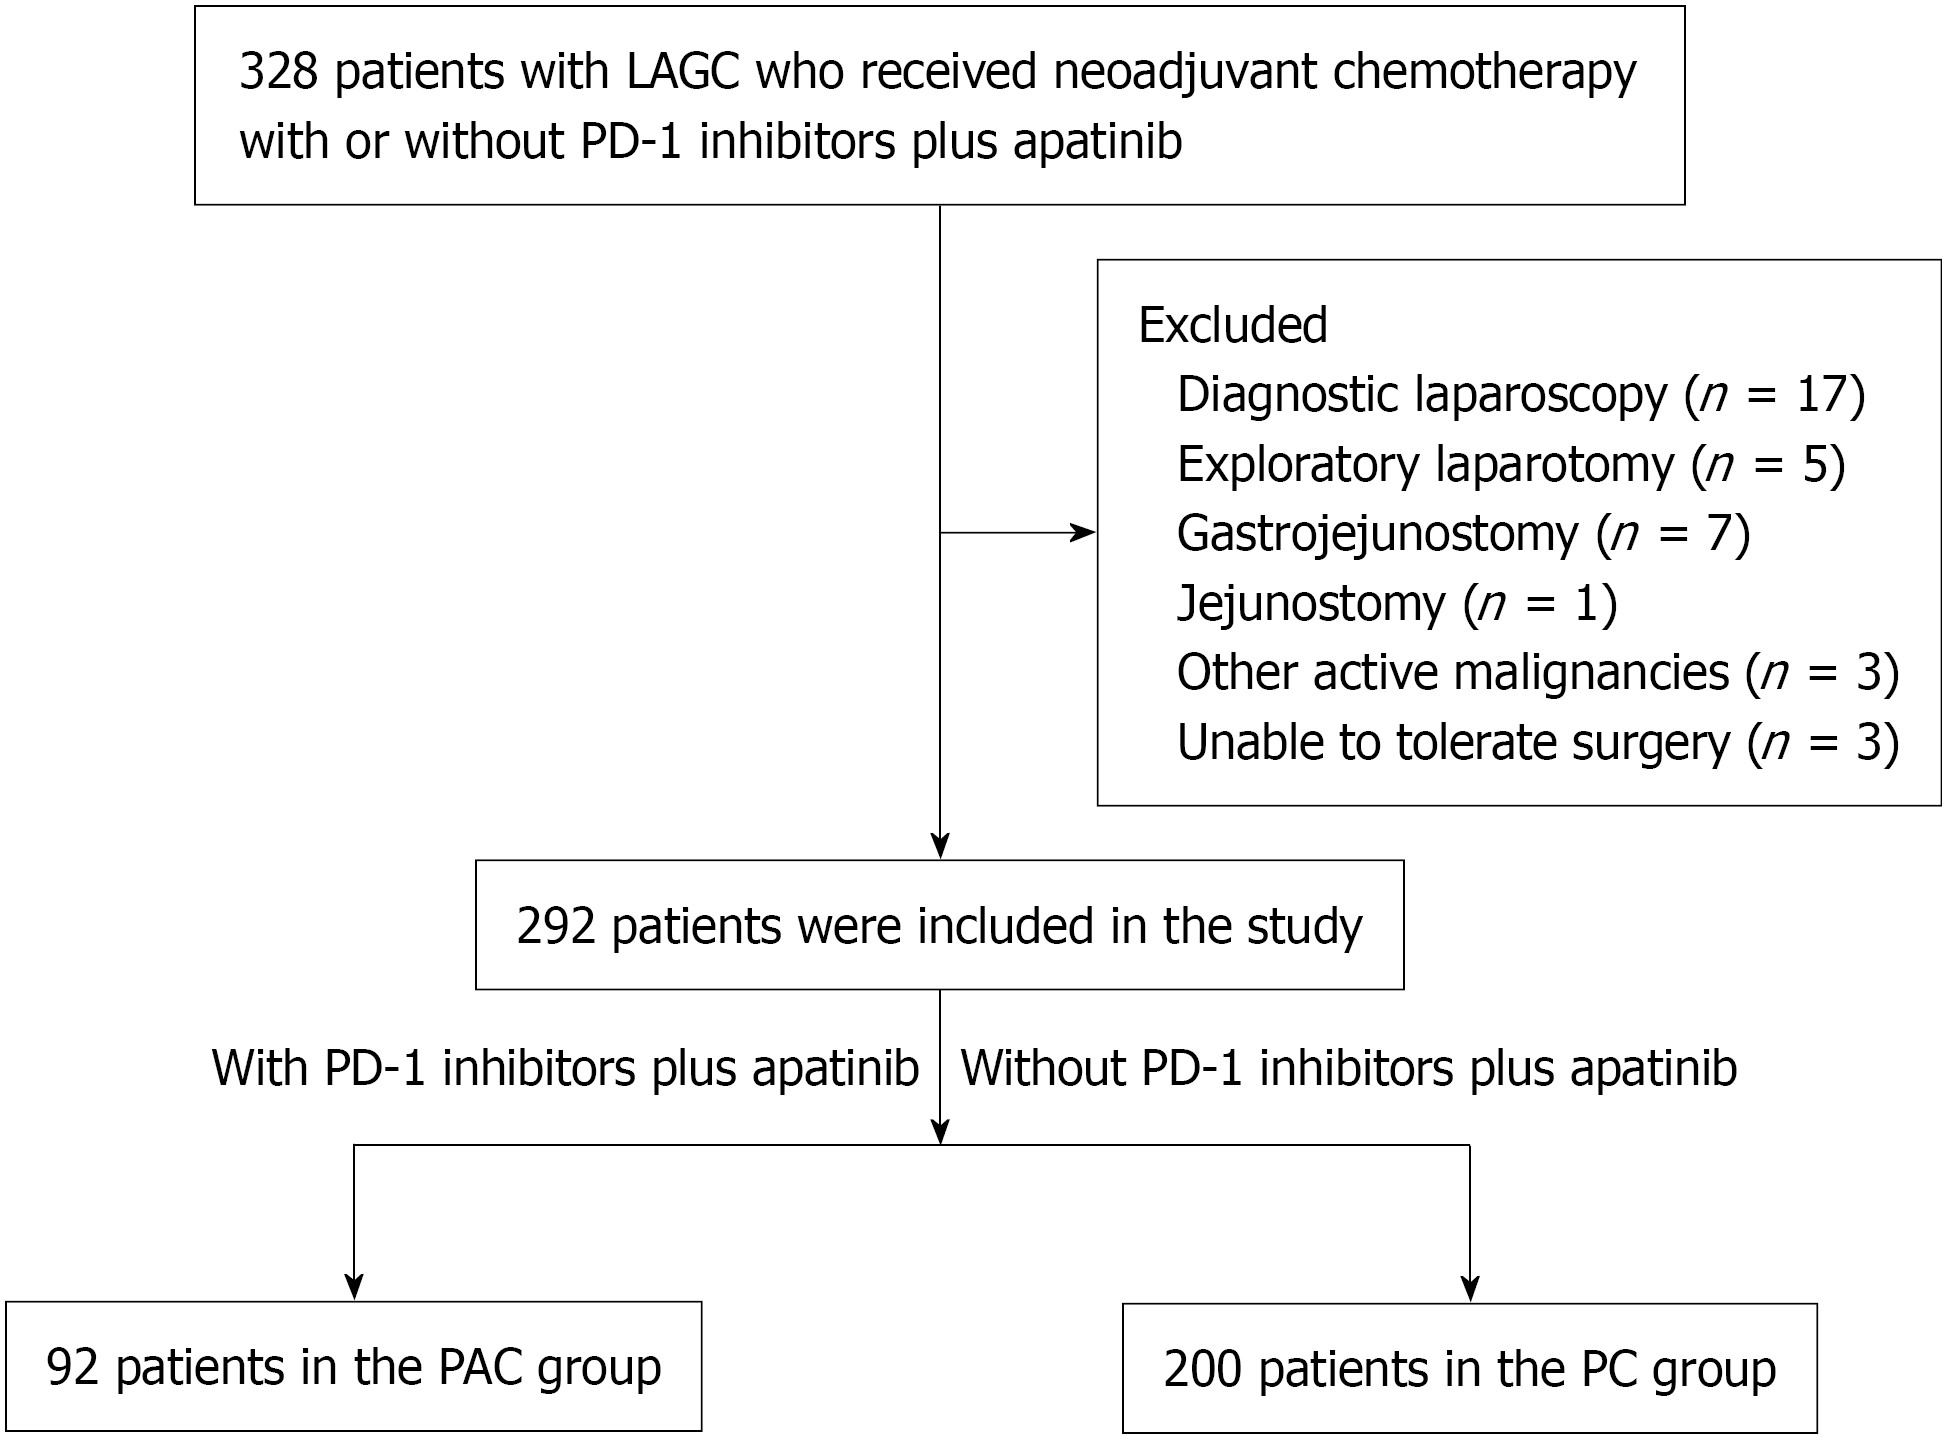
Figure 1 Flow diagram of the patient in the study.
LAGC: Locally advanced gastric cancer; PD-1: Programmed cell death protein-1; PAC: Programmed cell death protein-1 inhibitors plus apatinib and chemotherapy; PC: Preoperative chemotherapy.
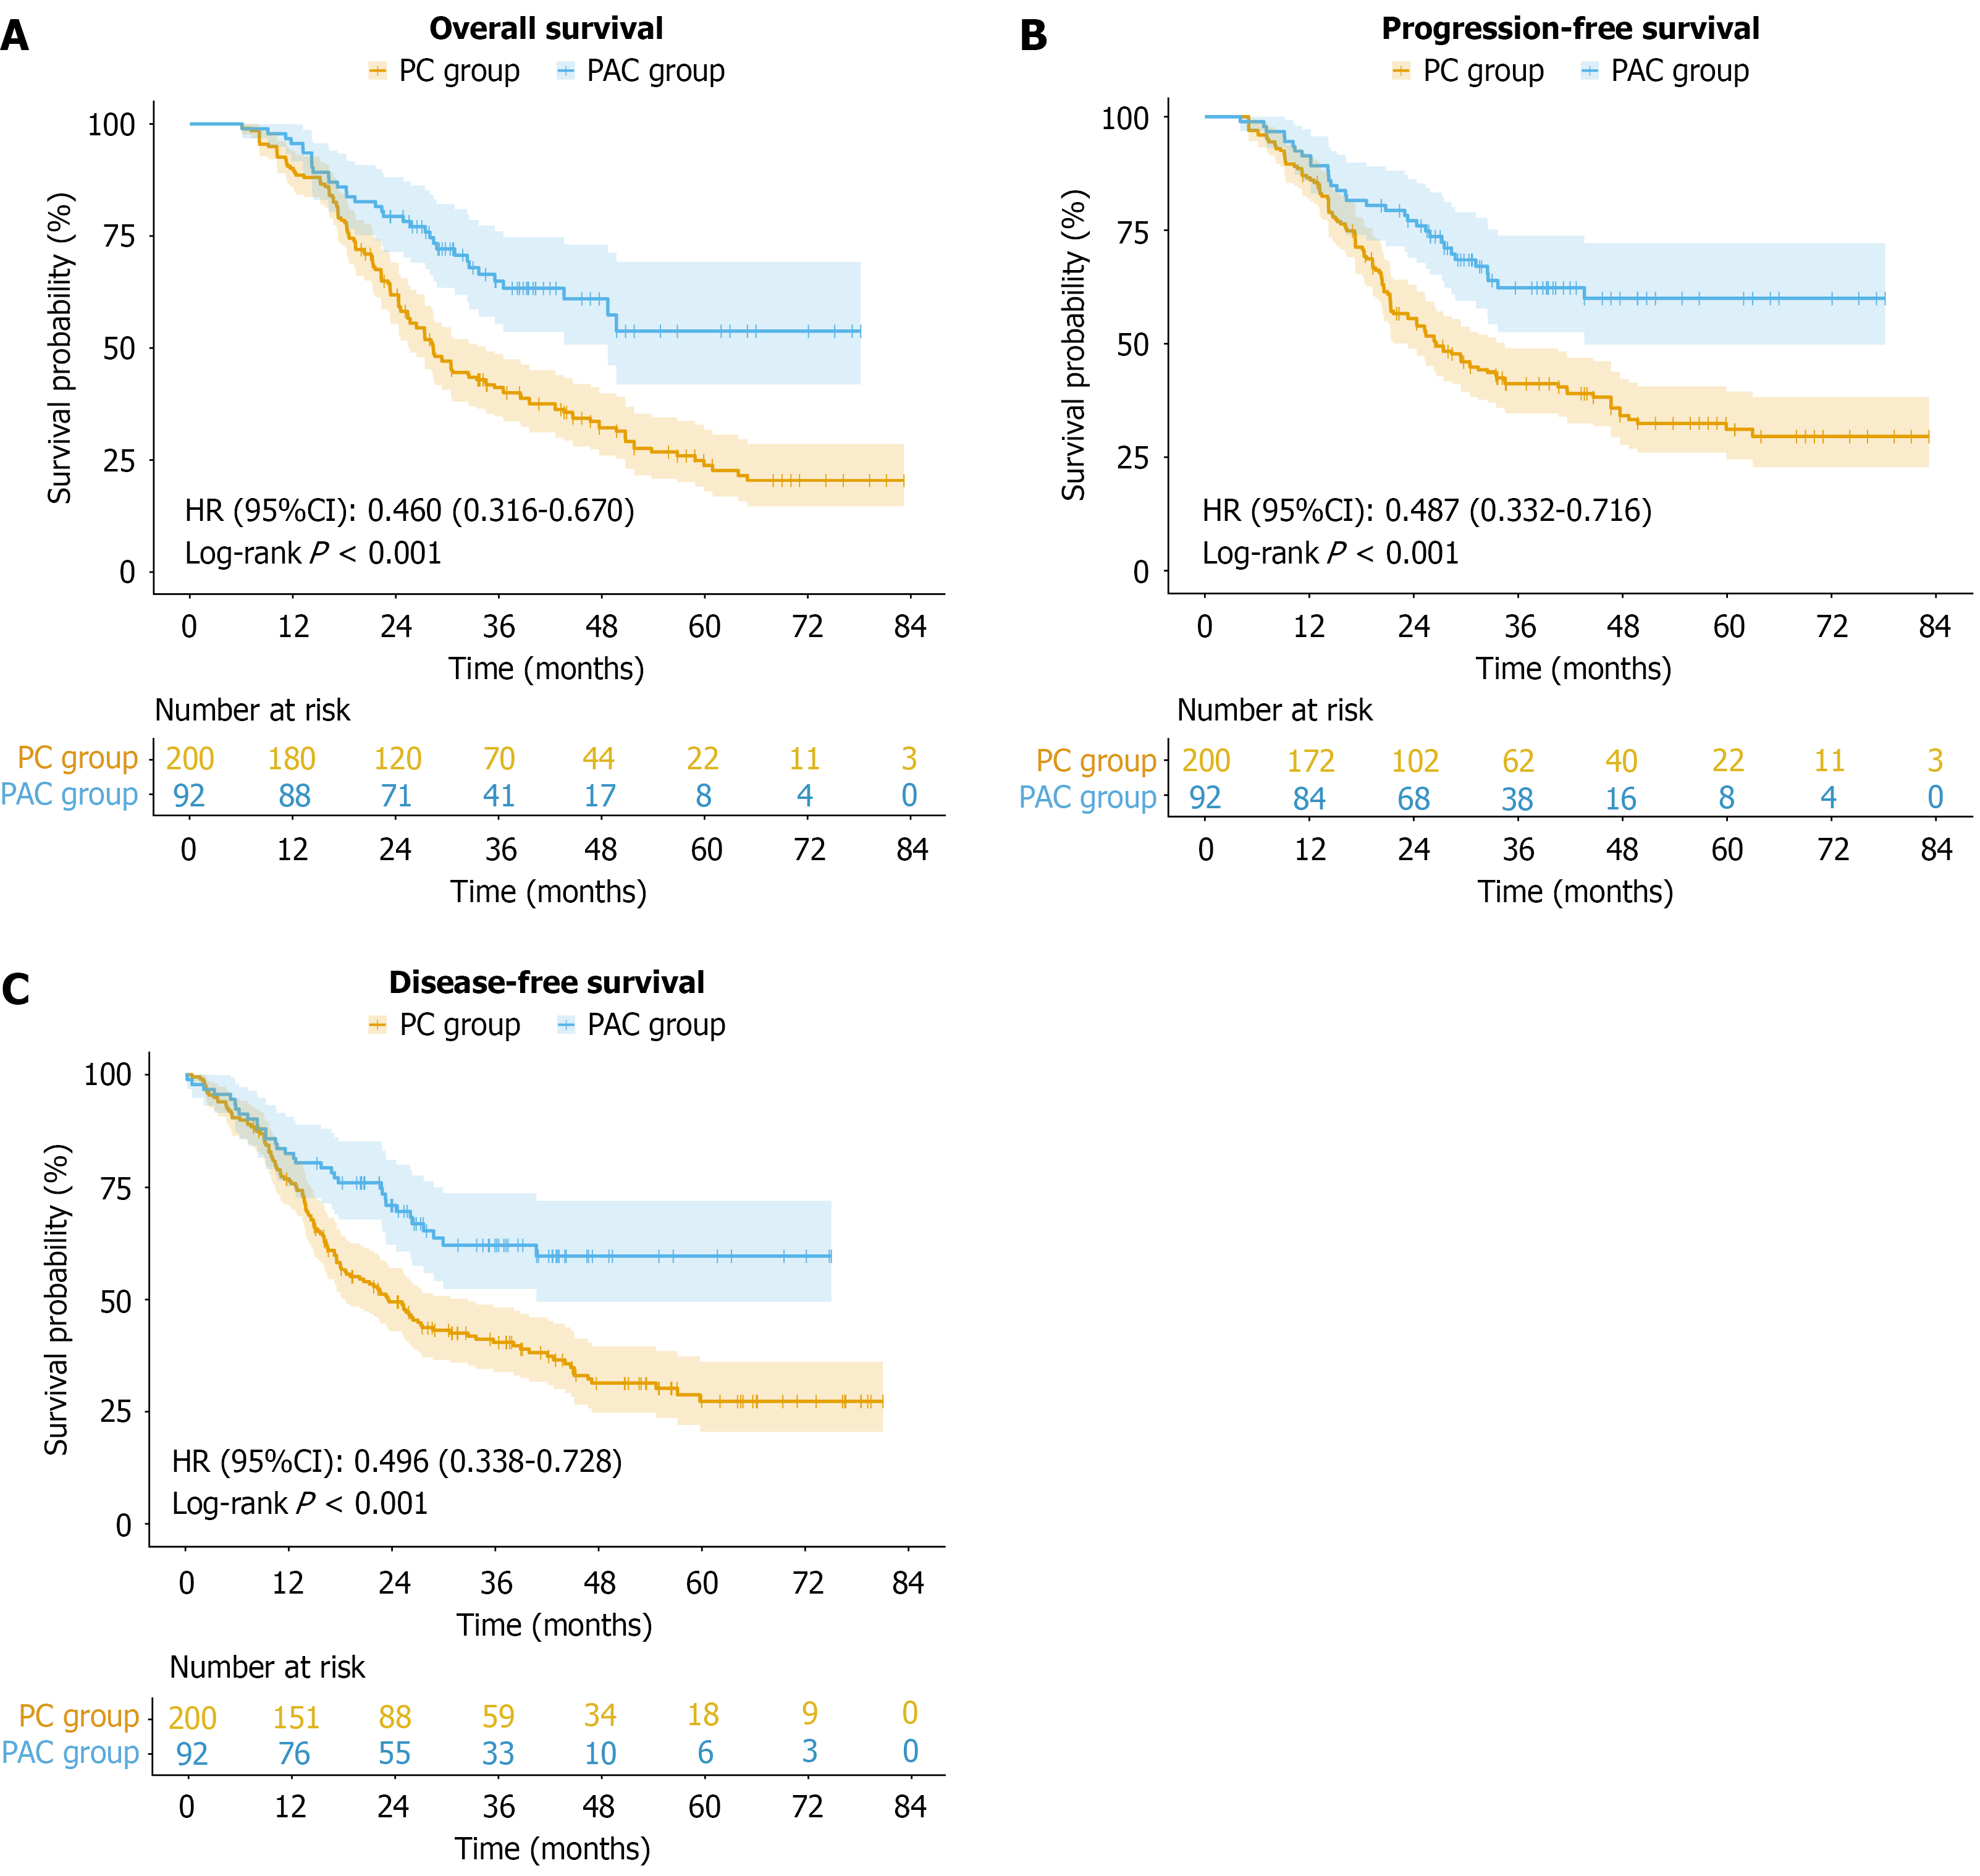
Figure 2 Kaplan-Meier survival curves.
A: Comparison of overall survival between the programmed cell death protein-1 inhibitors plus apatinib and chemotherapy (PAC) group and preoperative chemotherapy (PC) group; B: Comparison of progression-free survival between the PAC group and PC group; C: Comparison of disease-free survival between the PAC group and PC group. PAC: Programmed cell death protein-1 inhibitors plus apatinib and chemotherapy; PC: Preoperative chemotherapy; HR: Hazard ratio; CI: Confidence interval.
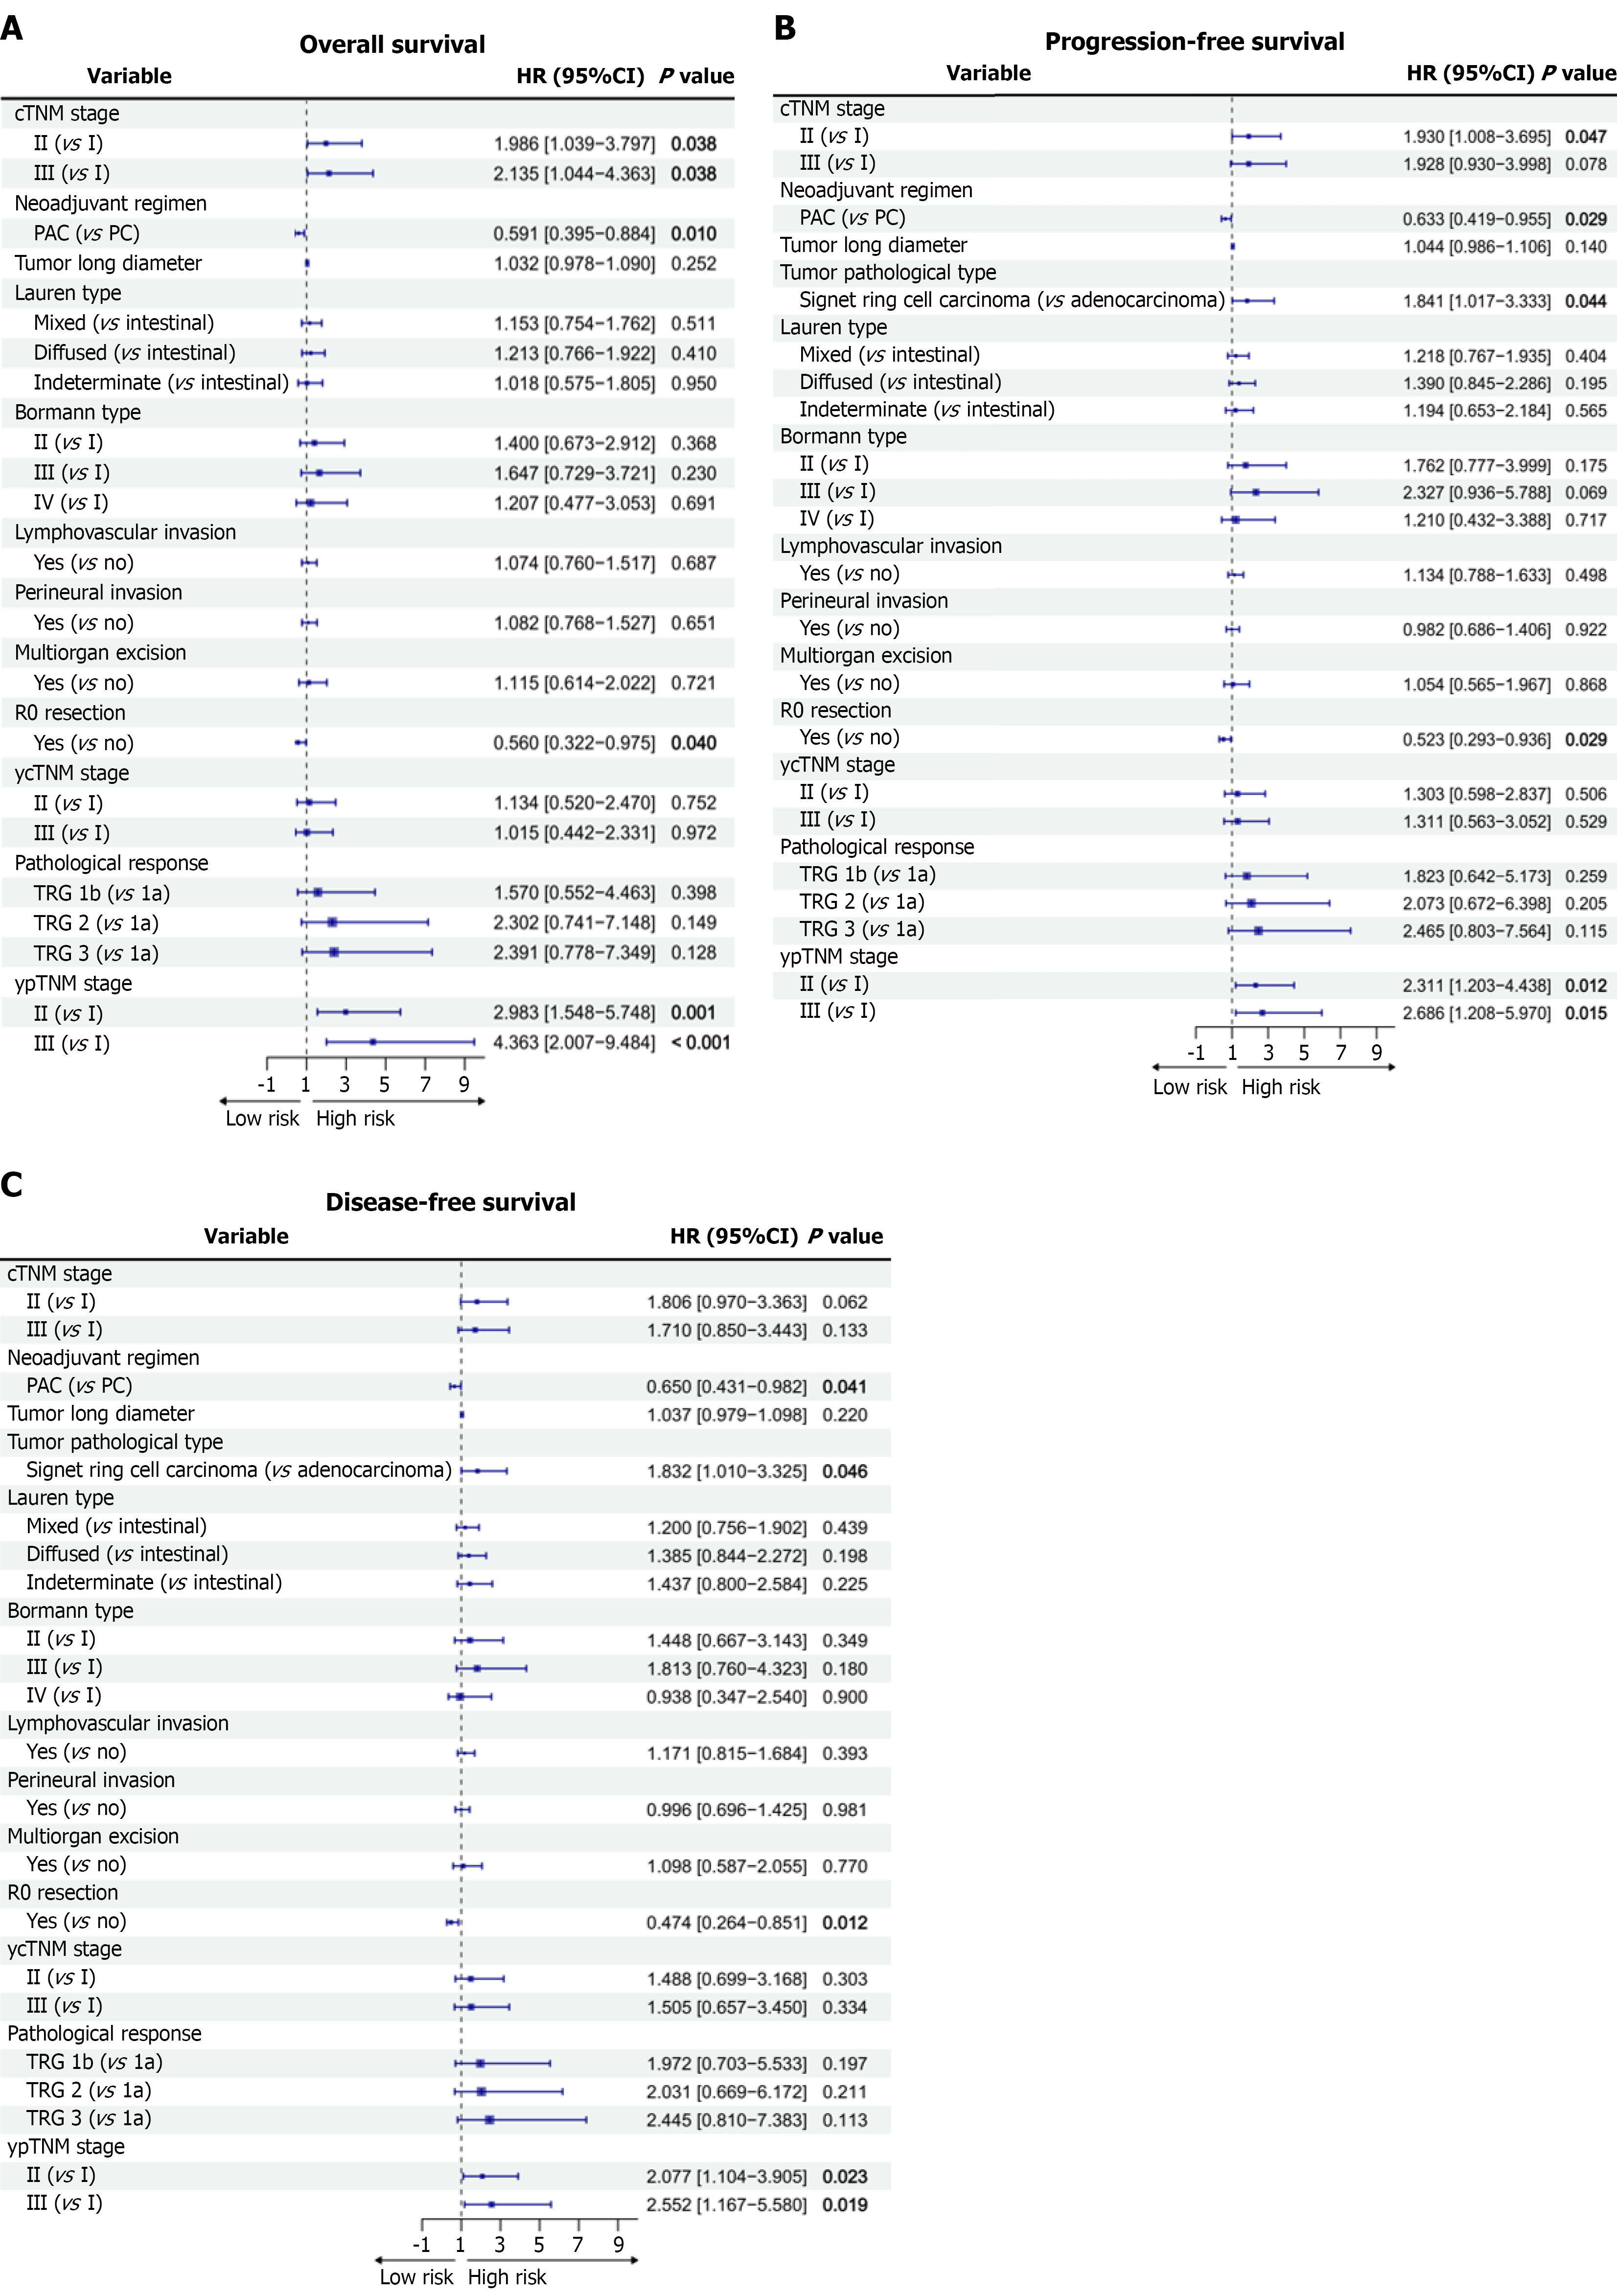
Figure 3 Multivariate Cox regression analyses of independent prognostic factors for survival outcomes.
A: Forest plot displayed hazard ratios and 95% confidence intervals for overall survival; B: Forest plot displayed hazard ratios and 95% confidence intervals for progression-free survival; C: Forest plot displayed hazard ratios and 95% confidence intervals for disease-free survival. PAC: Programmed cell death protein-1 inhibitors plus apatinib and chemotherapy; HR: Hazard ratio; CI: Confidence interval.
- Citation: Cheng ZW, Wei M, Zhang Y, Liang YZ, Cao WB, Zhao RD, Yan ZB, Sun GR, Cui XH, Yu WB. Surgical safety and efficacy of neoadjuvant immunotherapy plus apatinib and chemotherapy in locally advanced gastric cancer. World J Gastroenterol 2027; 33(2): 122397
- URL: https://www.wjgnet.com/1007-9327/full/v33/i2/122397.htm
- DOI: https://dx.doi.org/10.3748/wjg.122397