
















Copyright: ©Author(s) 2027.
World J Gastroenterol. Jan 14, 2027; 33(2): 122338
Published online Jan 14, 2027. doi: 10.3748/wjg.122338
Published online Jan 14, 2027. doi: 10.3748/wjg.122338
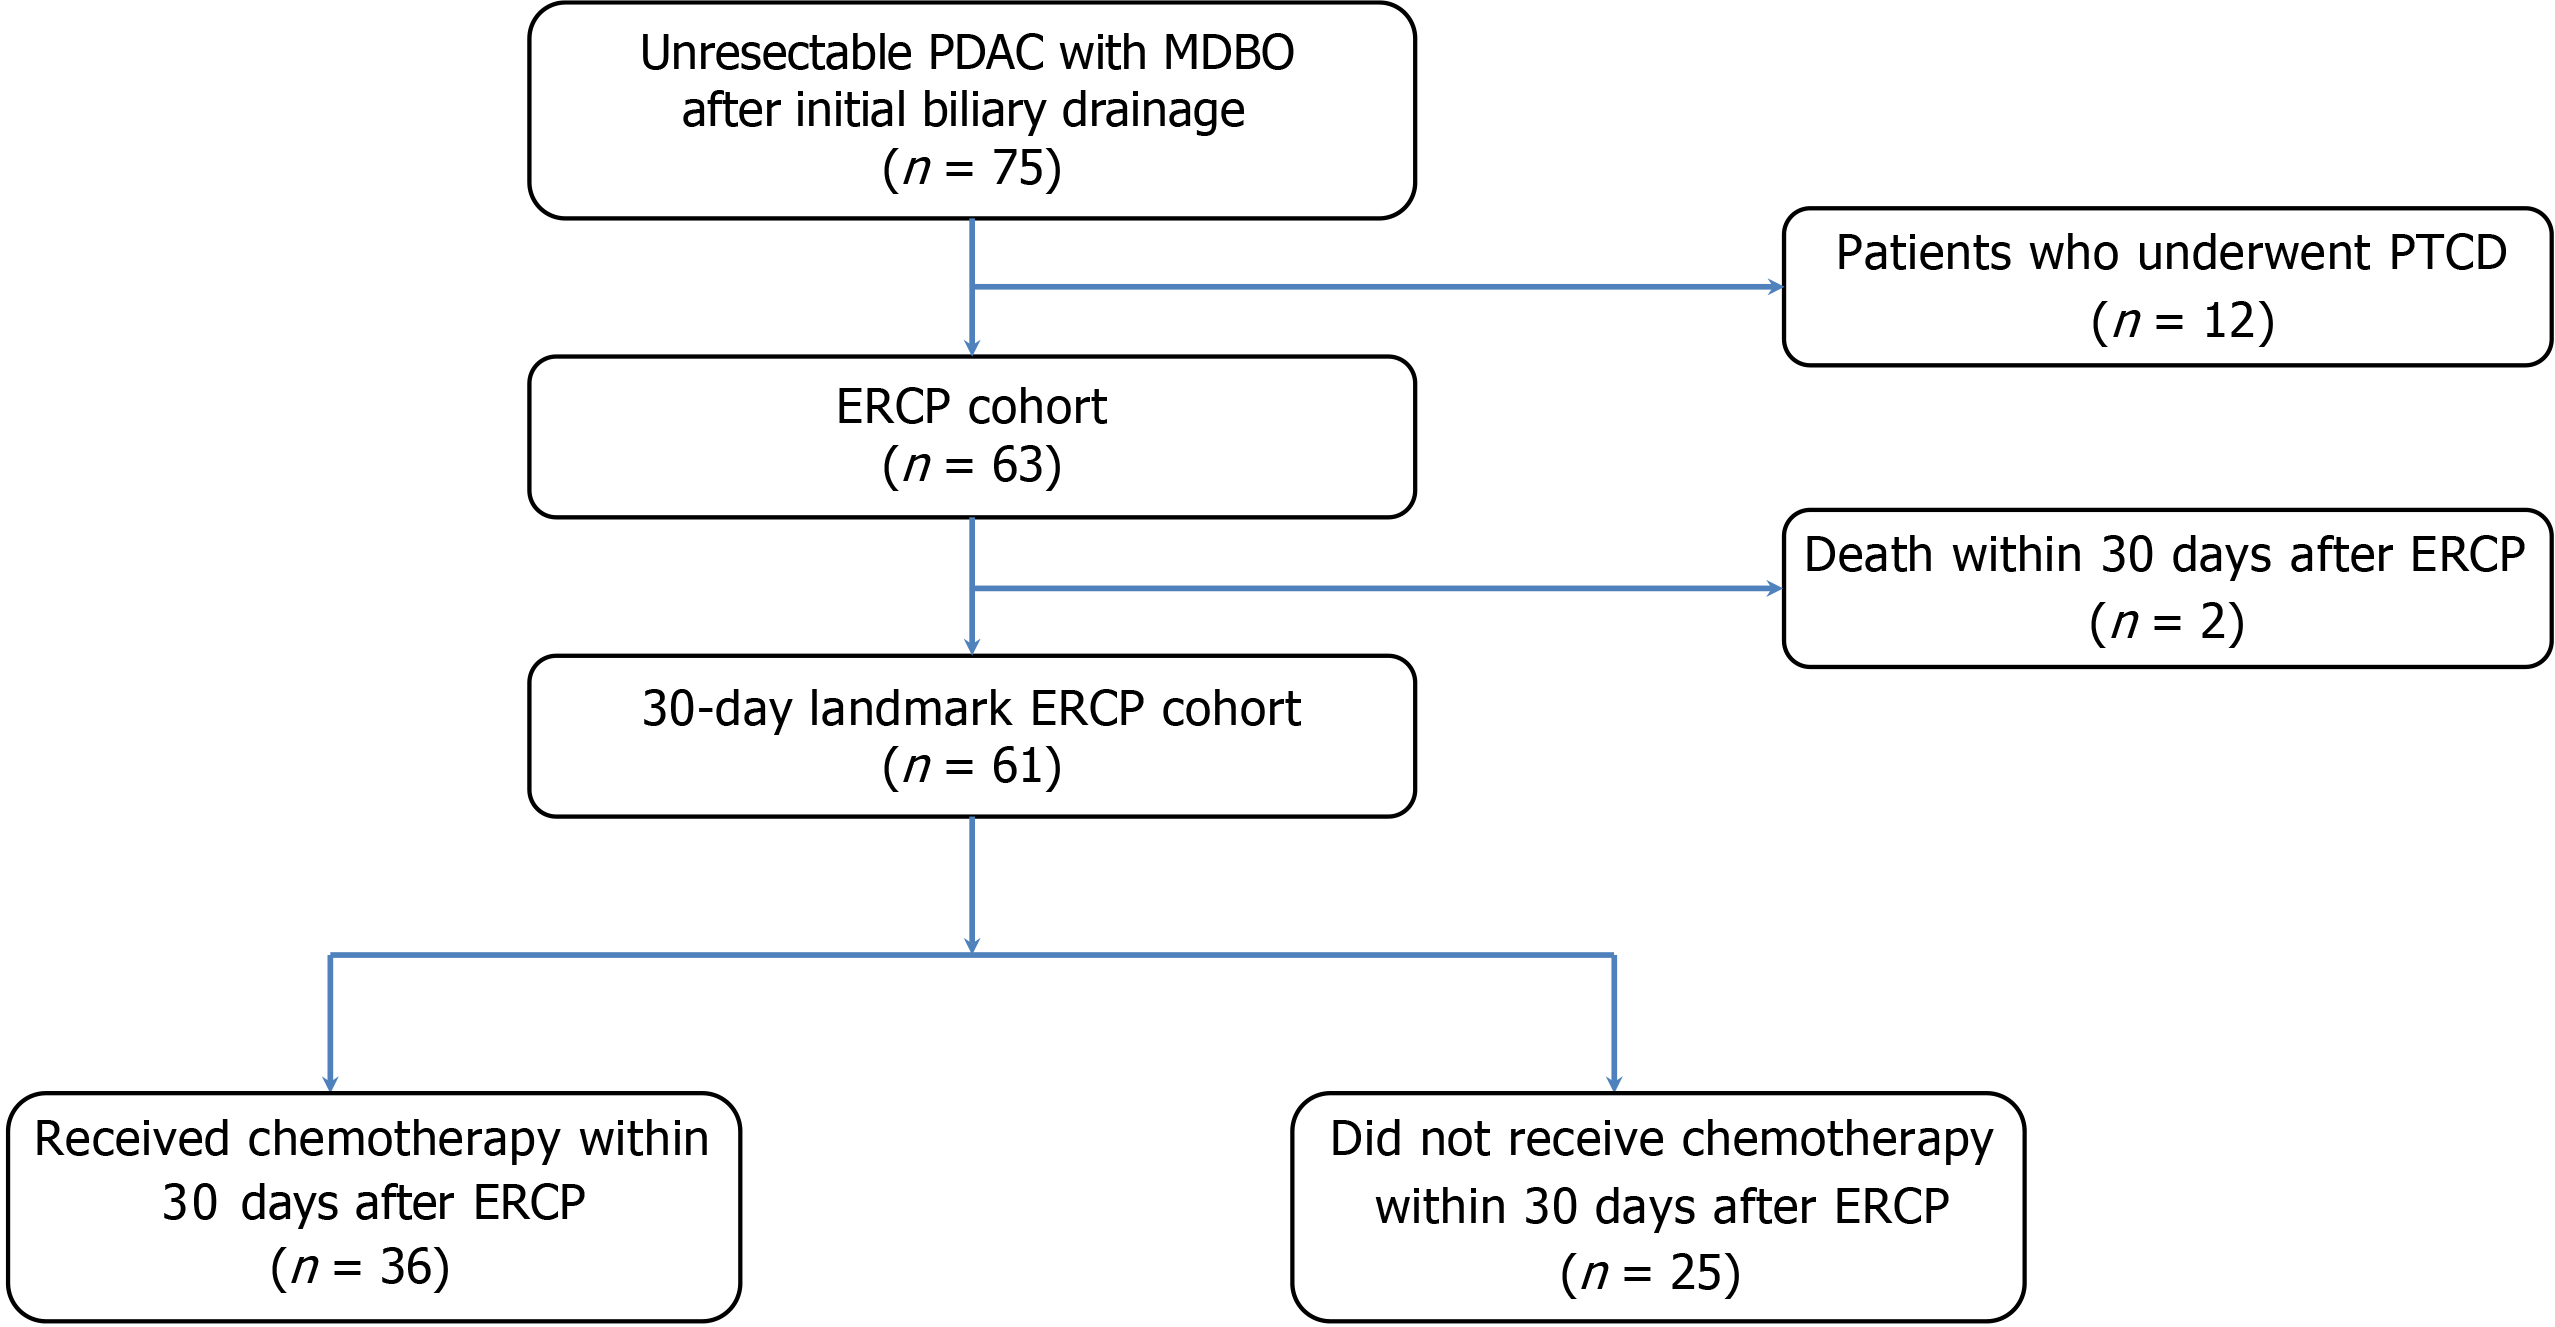
Figure 1 Study flowchart.
Flowchart of patient screening, exclusion, and cohort construction. Patients with advanced pancreatic ductal adenocarcinoma and malignant distal biliary obstruction were screened. The chart shows the overall endoscopic retrograde cholangiopancreatography (ERCP) cohort and the final 30-day landmark ERCP cohort, which was further classified according to whether chemotherapy was initiated within 30 days after index ERCP. PDAC: Pancreatic ductal adenocarcinoma; MDBO: Malignant distal biliary obstruction; PTCD: Percutaneous transhepatic cholangial drainage; ERCP: Endoscopic retrograde cholangiopancreatography.
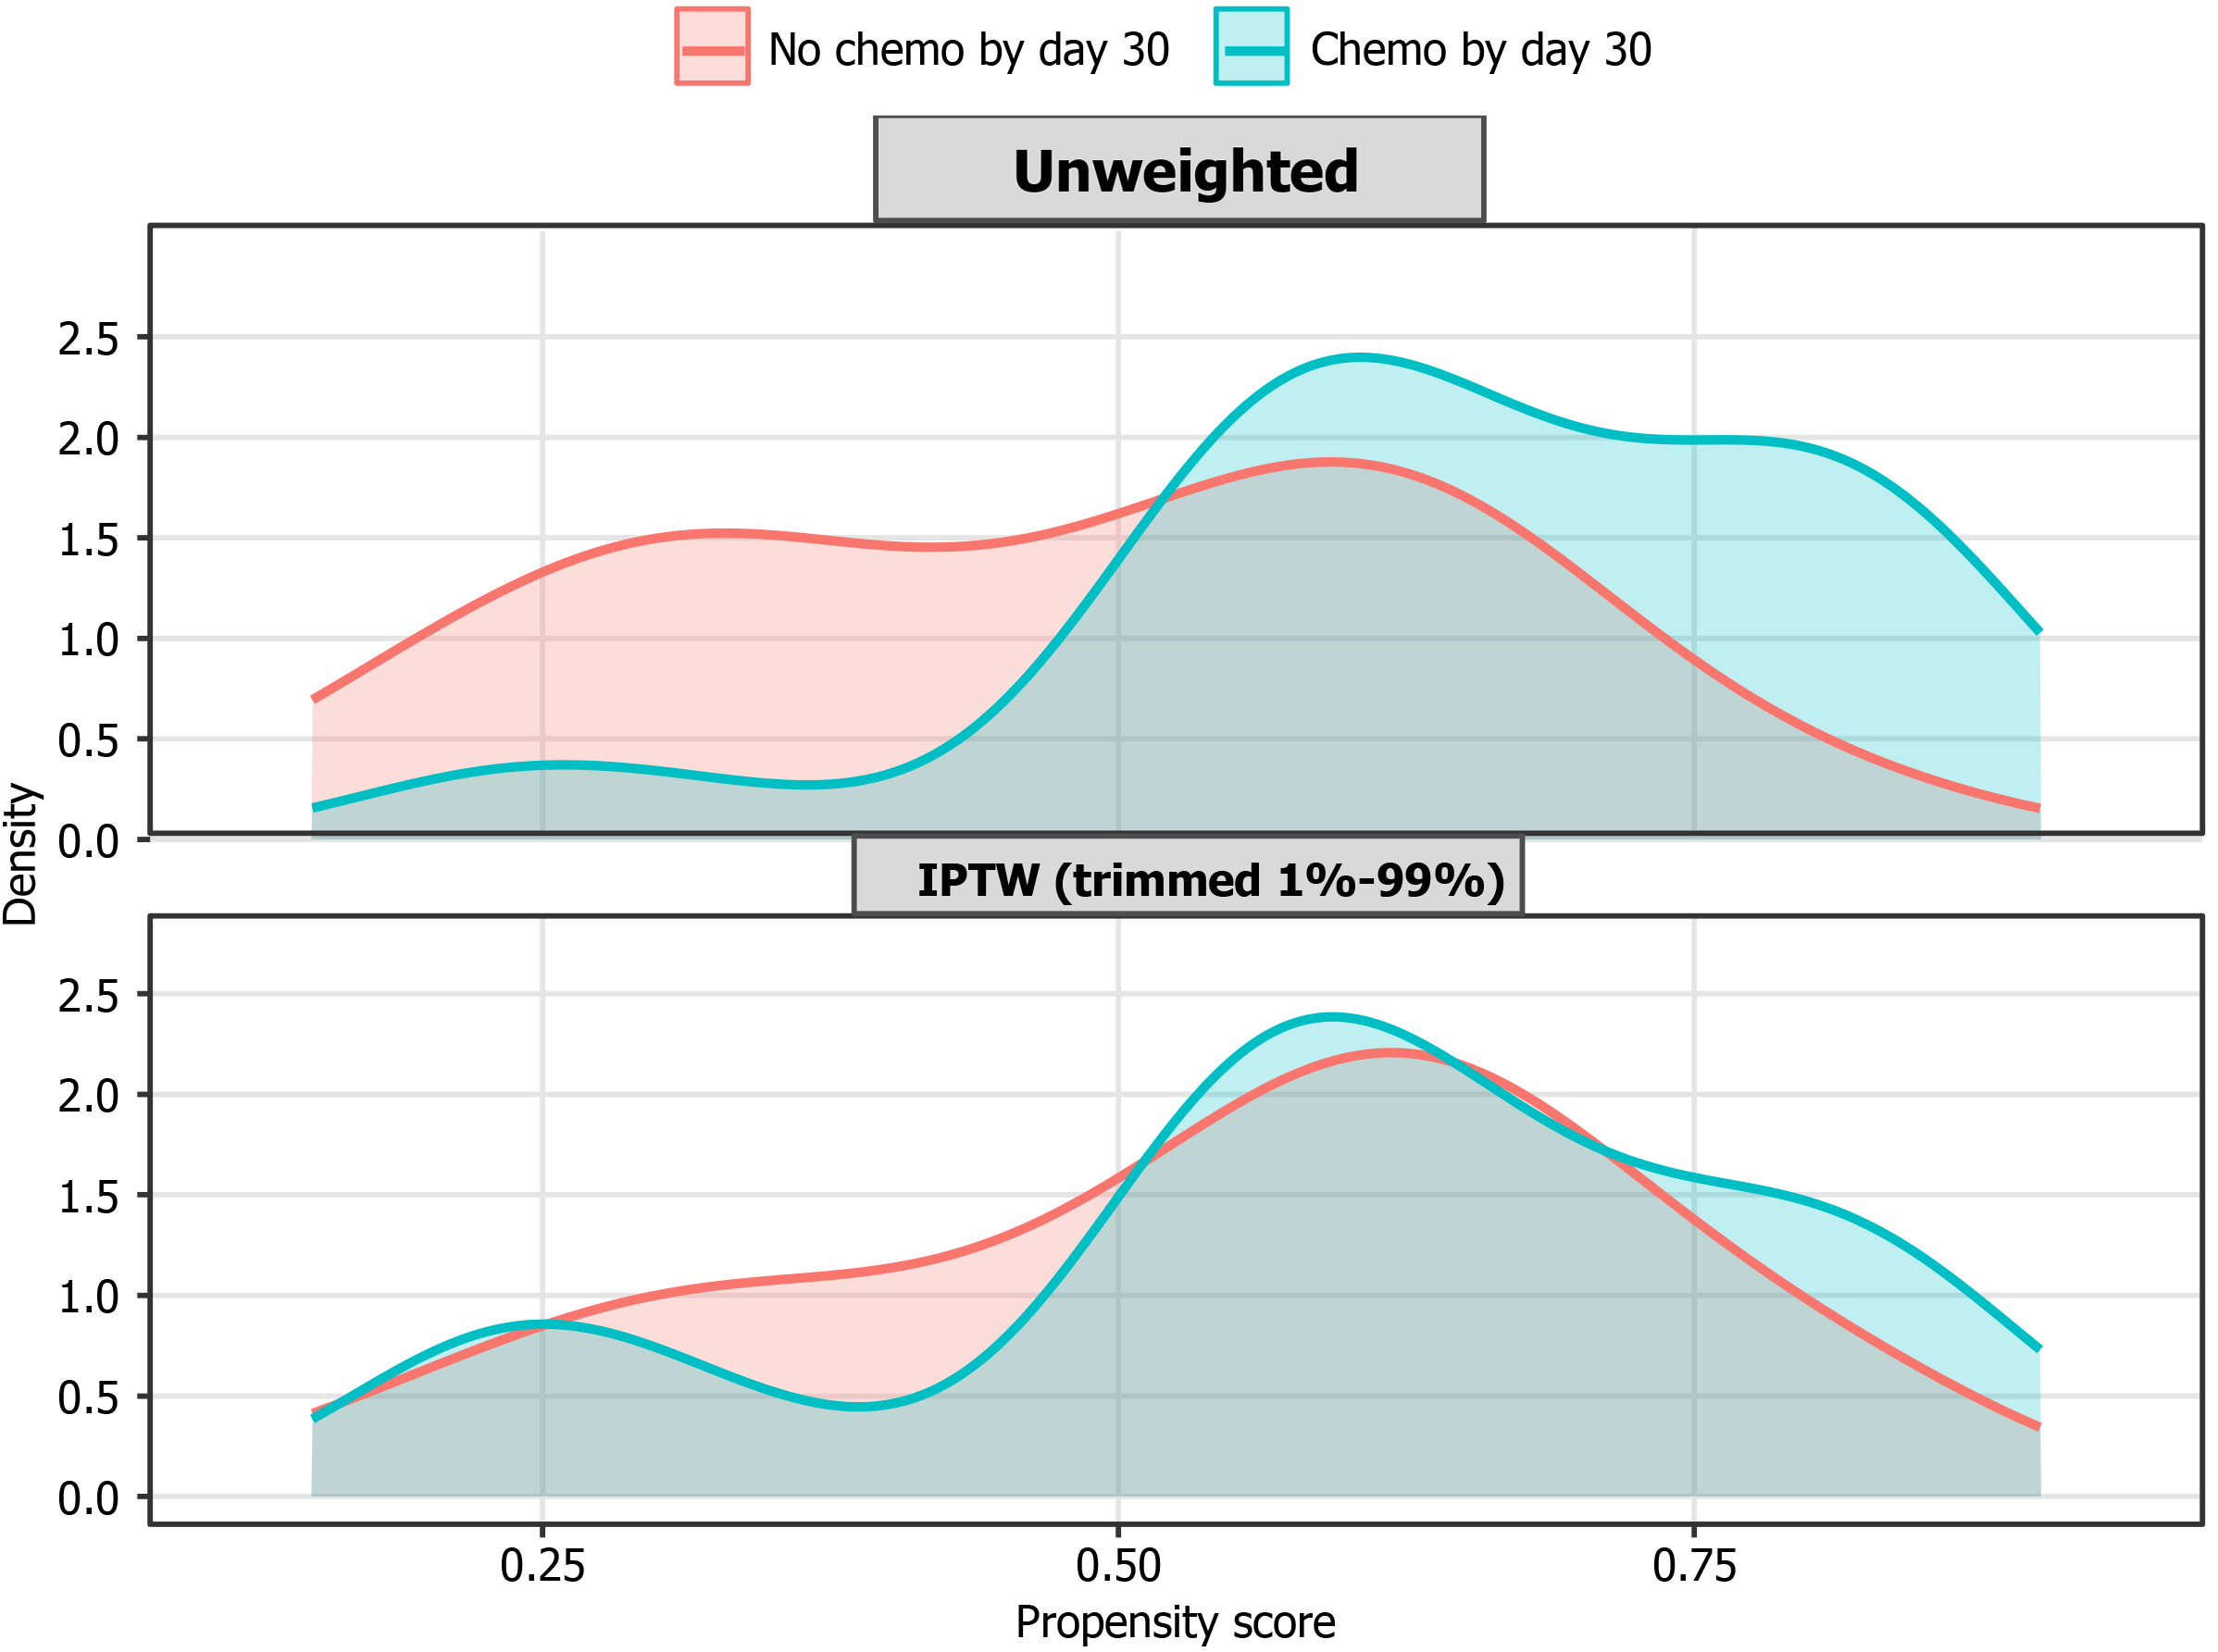
Figure 2 Propensity score distributions before and after inverse probability of treatment weighting.
Density plots showing the propensity score distributions of the no-chemo-by-day-30 group and the chemo-by-day-30 group before weighting and after stabilized inverse probability of treatment weighting with 1% and 99% truncation. It is presented to show the overlap of the propensity score distributions between groups. IPTW: Inverse probability of treatment weighting.
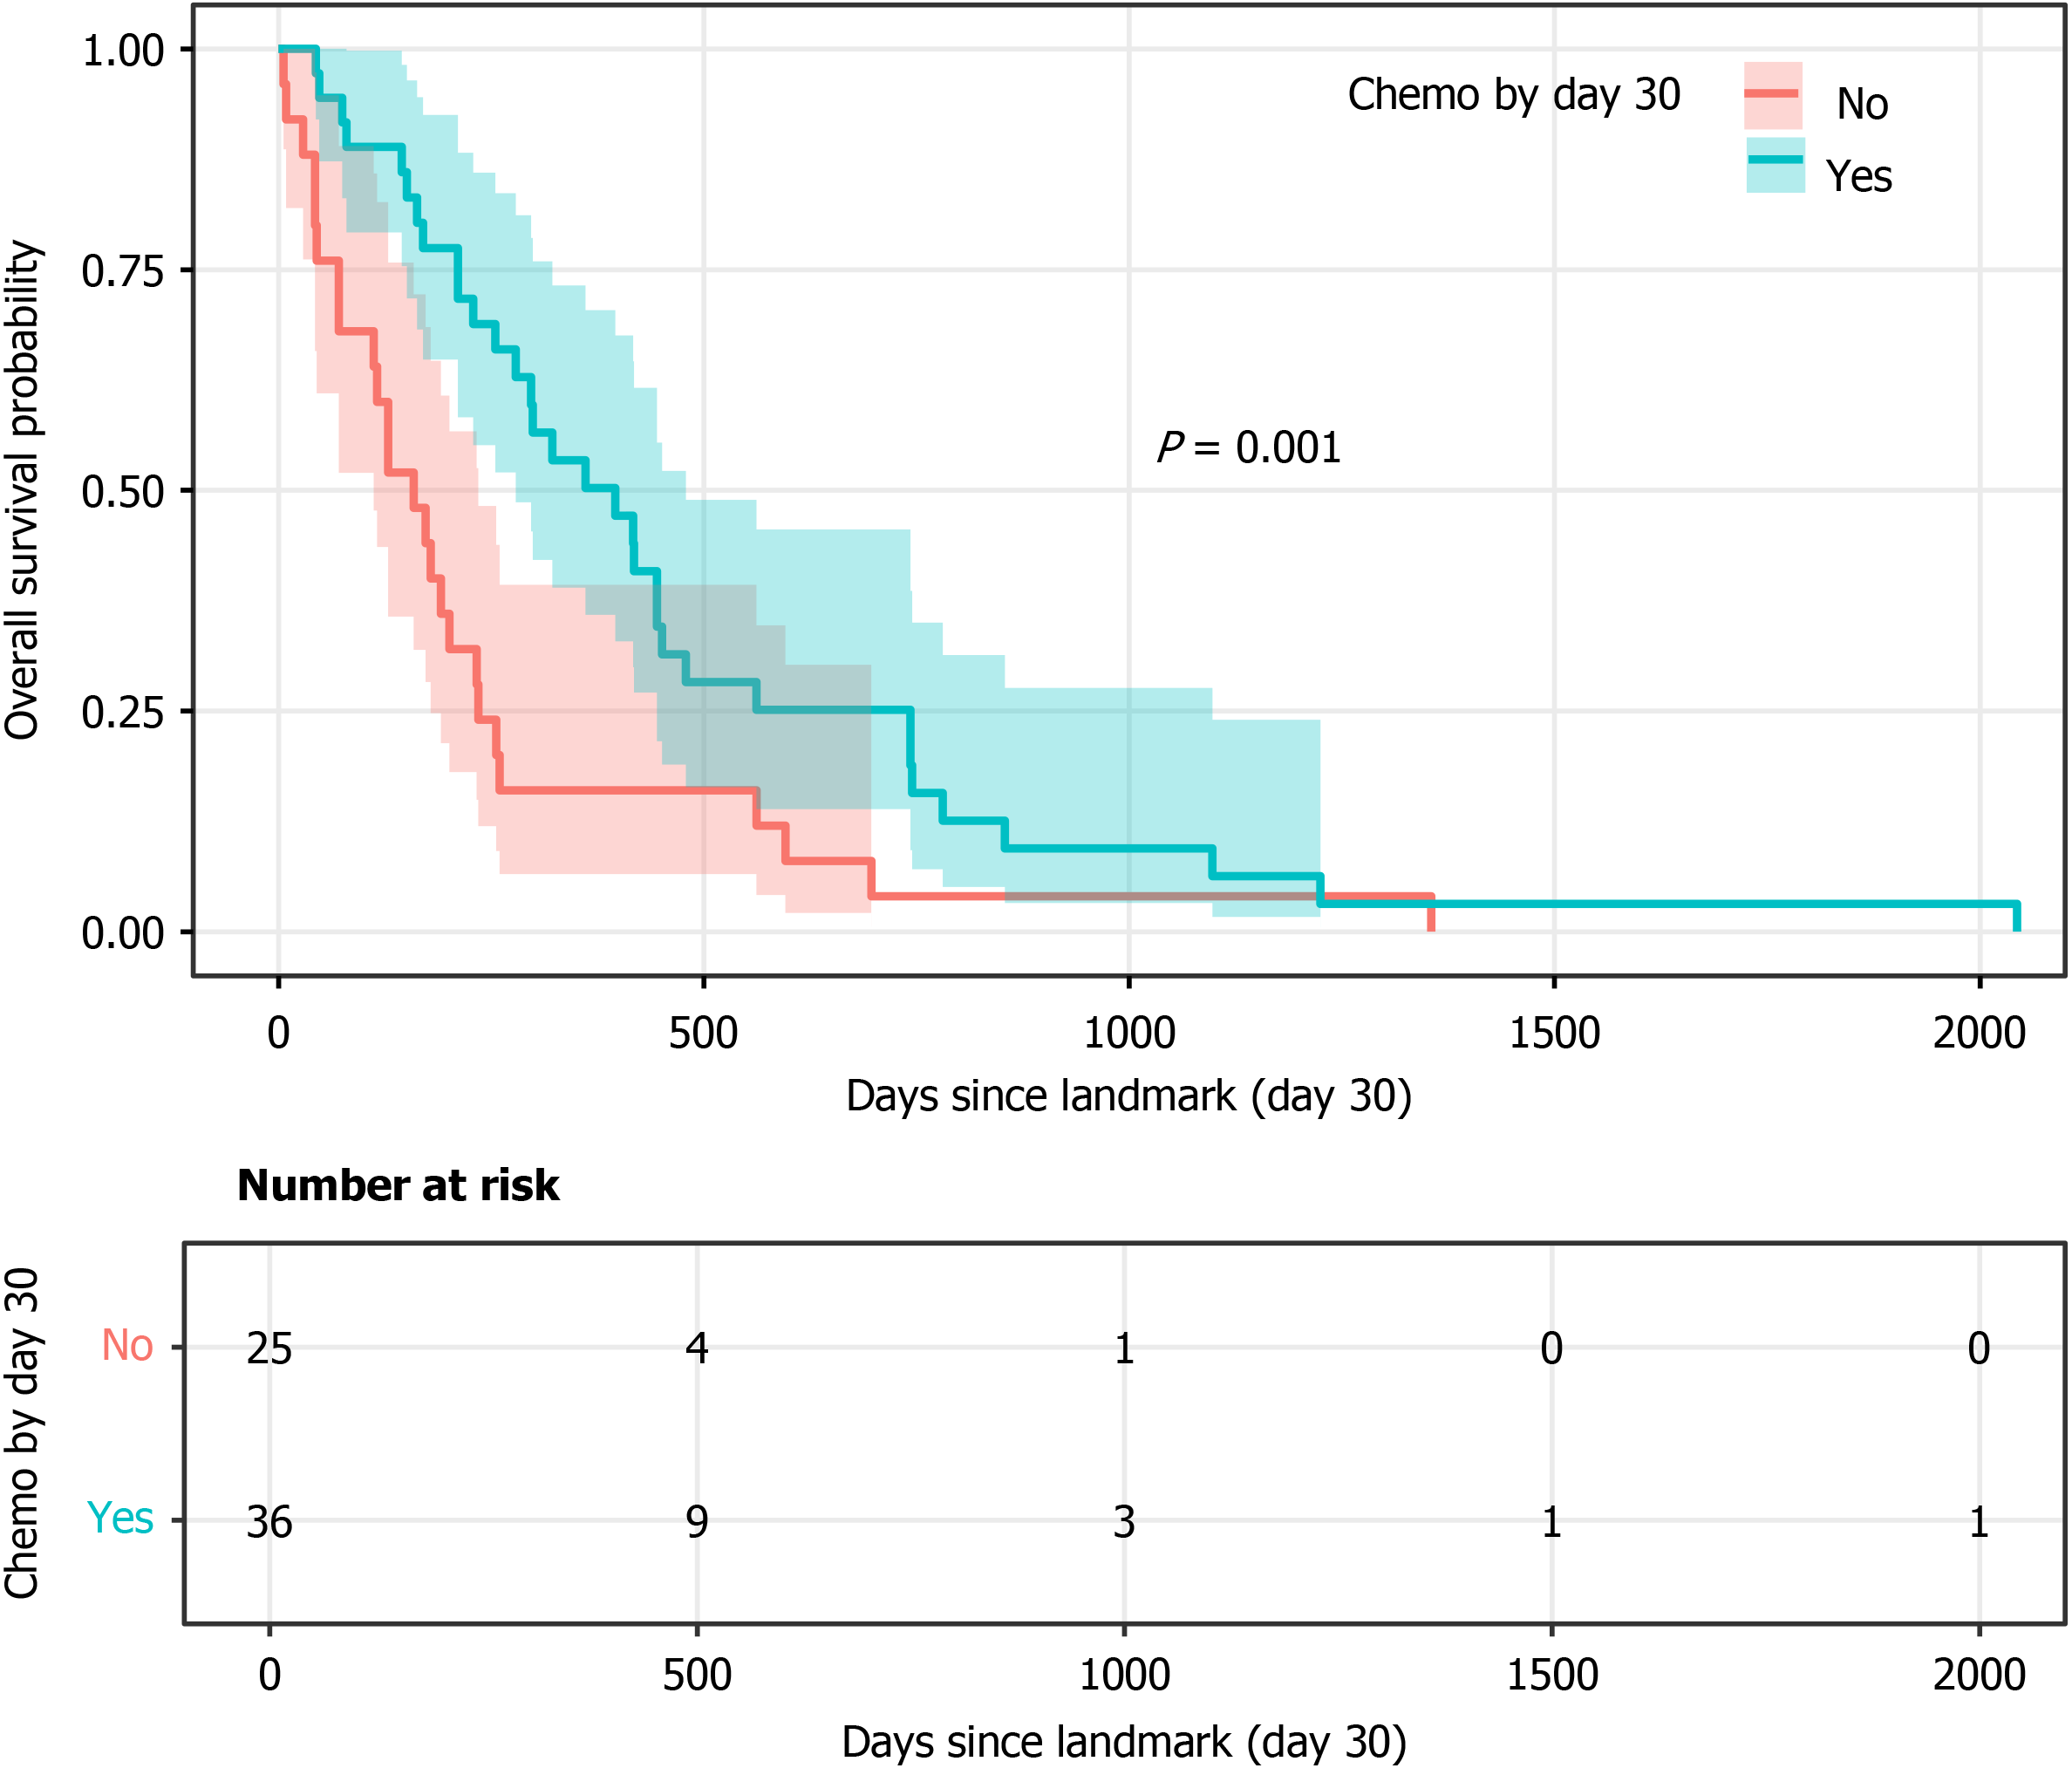
Figure 3 Landmark overall survival Kaplan-Meier curves.
Kaplan-Meier curves for landmark overall survival in the 30-day landmark endoscopic retrograde cholangiopancreatography (ERCP) cohort, stratified by whether chemotherapy was initiated within 30 days after ERCP. Landmark overall survival was calculated from day 30 after index ERCP. Shaded areas indicate 95%CIs. Numbers at risk are shown below the X-axis.
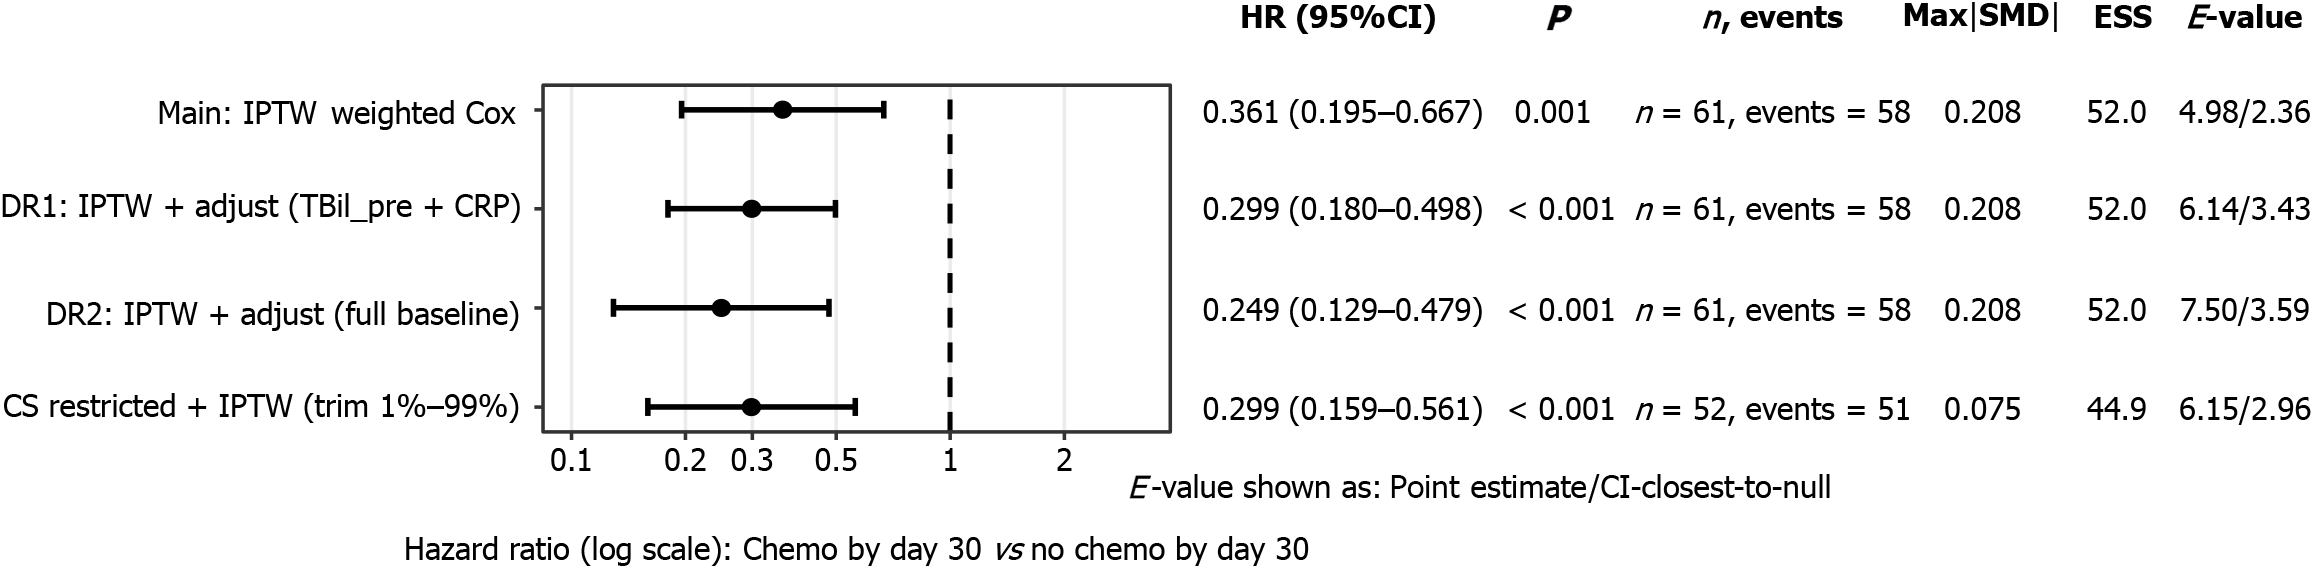
Figure 4 Robustness and sensitivity forest plot.
Forest plot showing hazard ratios and 95%CIs for the association between chemotherapy initiation within 30 days after endoscopic retrograde cholangiopancreatography and landmark overall survival across the primary weighted Cox model and prespecified sensitivity analyses, including doubly robust adjustment and common-support restriction. IPTW: Inverse probability of treatment weights; HR: Hazard ratio; SMD: Standardized mean difference; ESS: Effective sample size; DR: Doubly robust; TBil: Total bilirubin; CRP: C-reactive protein; CS: Common-support.
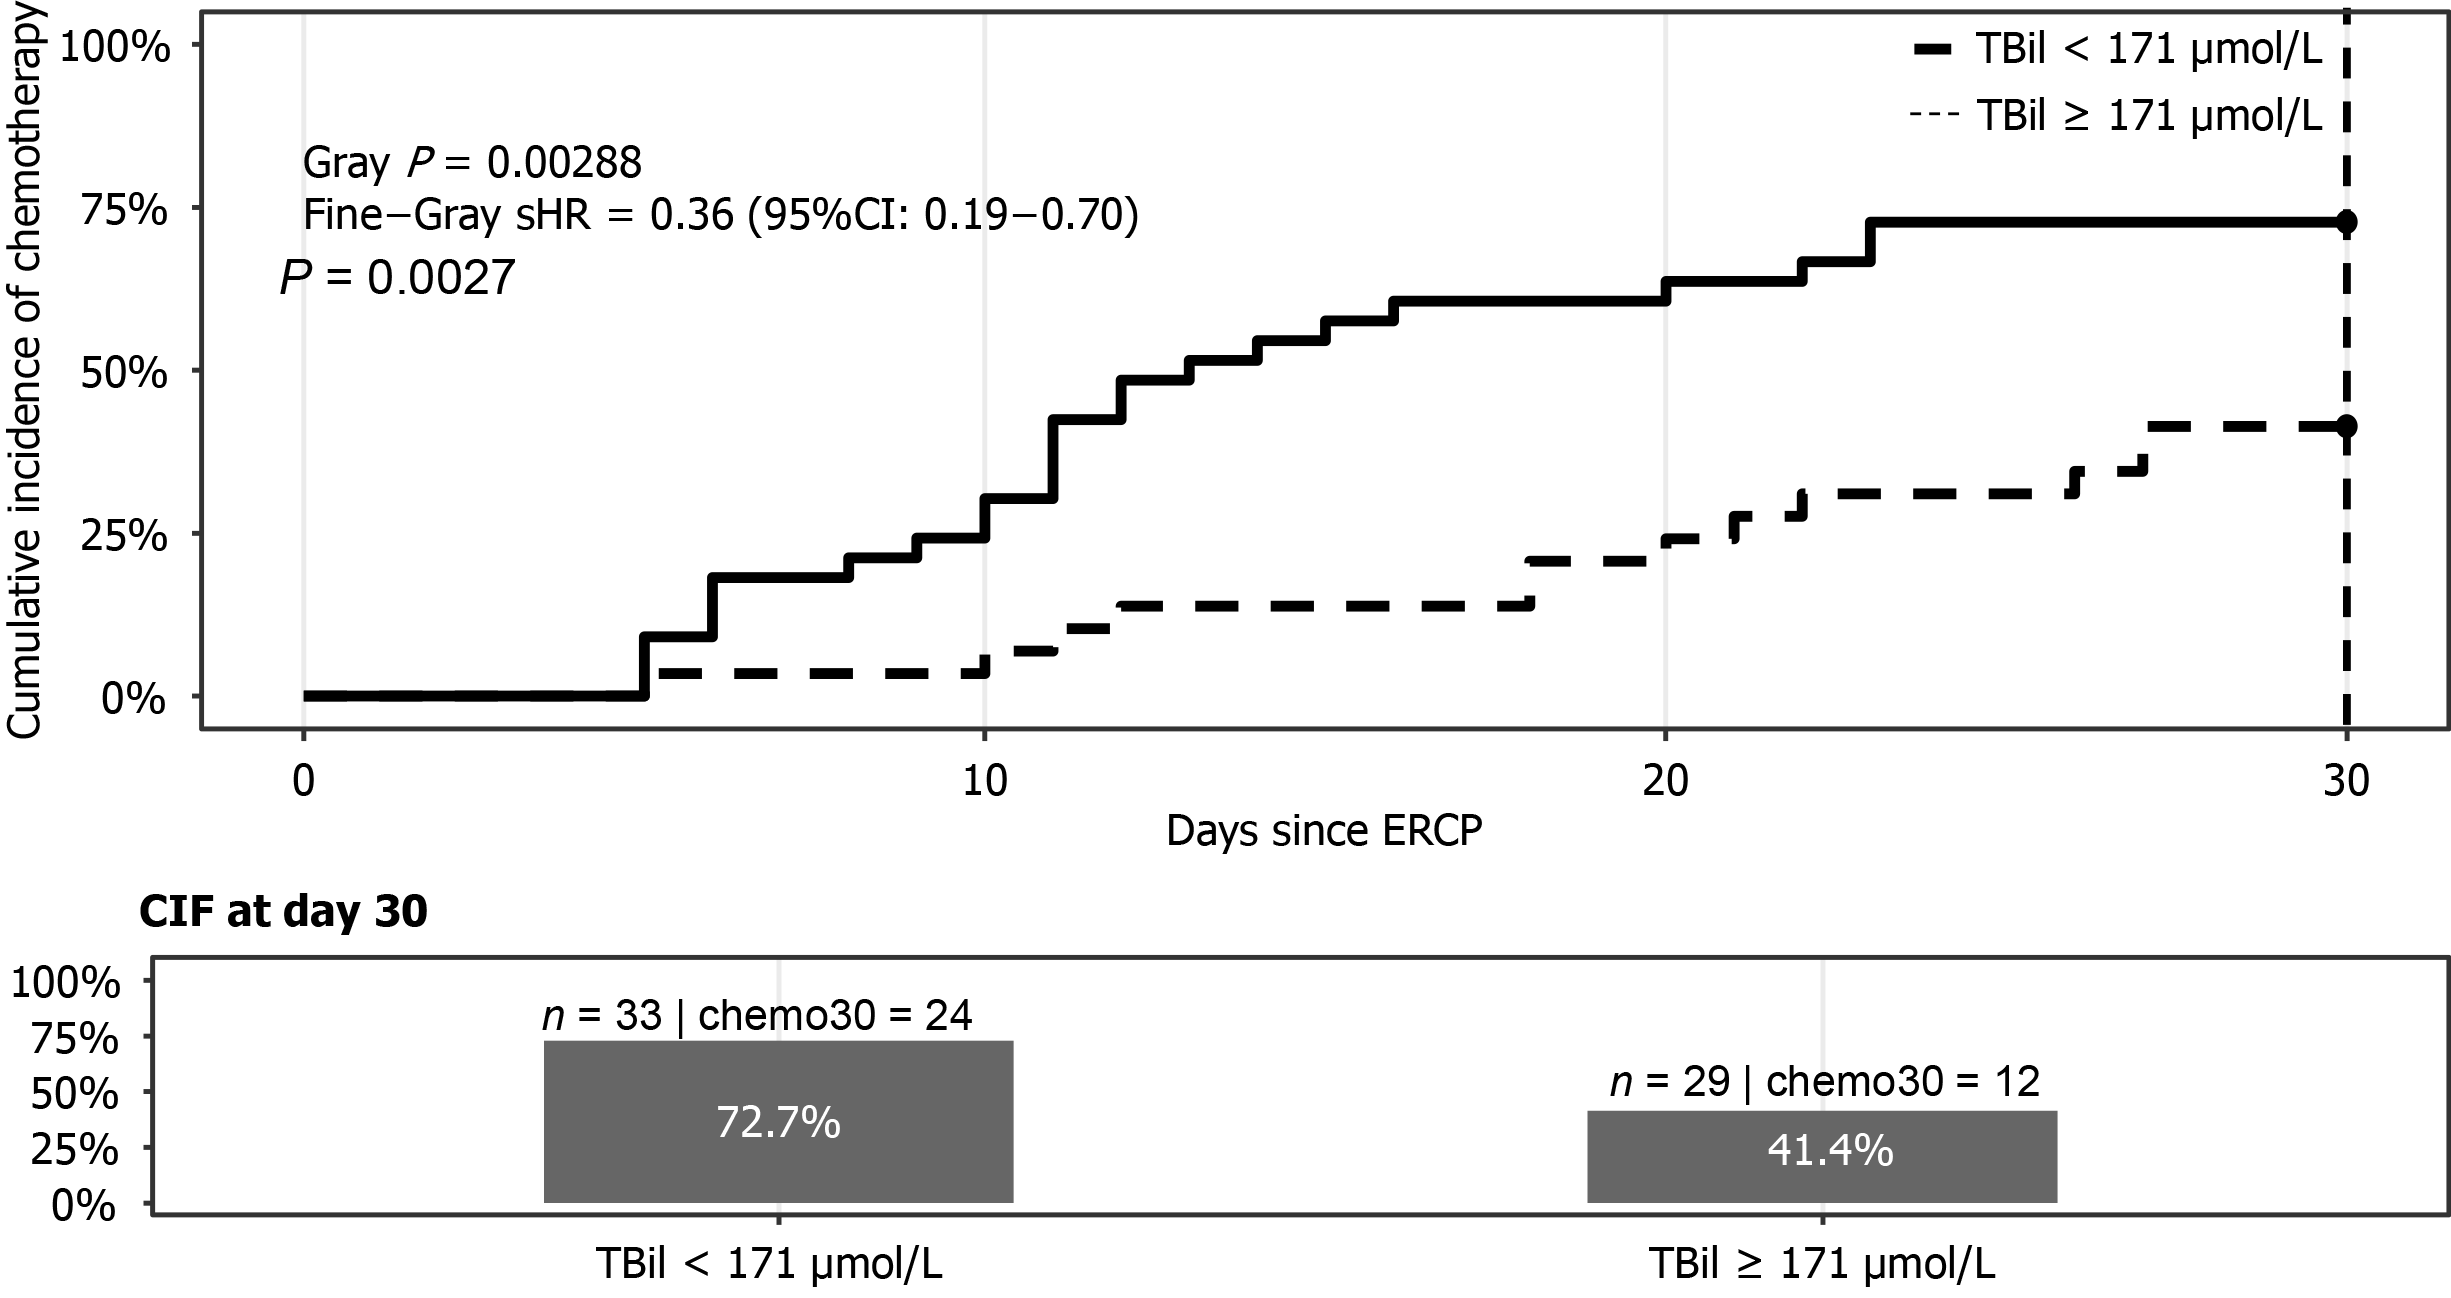
Figure 5 Cumulative incidence function of chemotherapy initiation by bilirubin group.
Cumulative incidence function curves for chemotherapy initiation within 30 days after endoscopic retrograde cholangiopancreatography according to baseline total bilirubin group defined by the 171 μmol/L threshold. Death before chemotherapy initiation was treated as a competing event. The lower panel shows the day-30 cumulative incidence and the number of patients and chemotherapy events in each group. CIF: Cumulative incidence function; sHR: Subdistribution hazard ratio; ERCP: Endoscopic retrograde cholangiopan
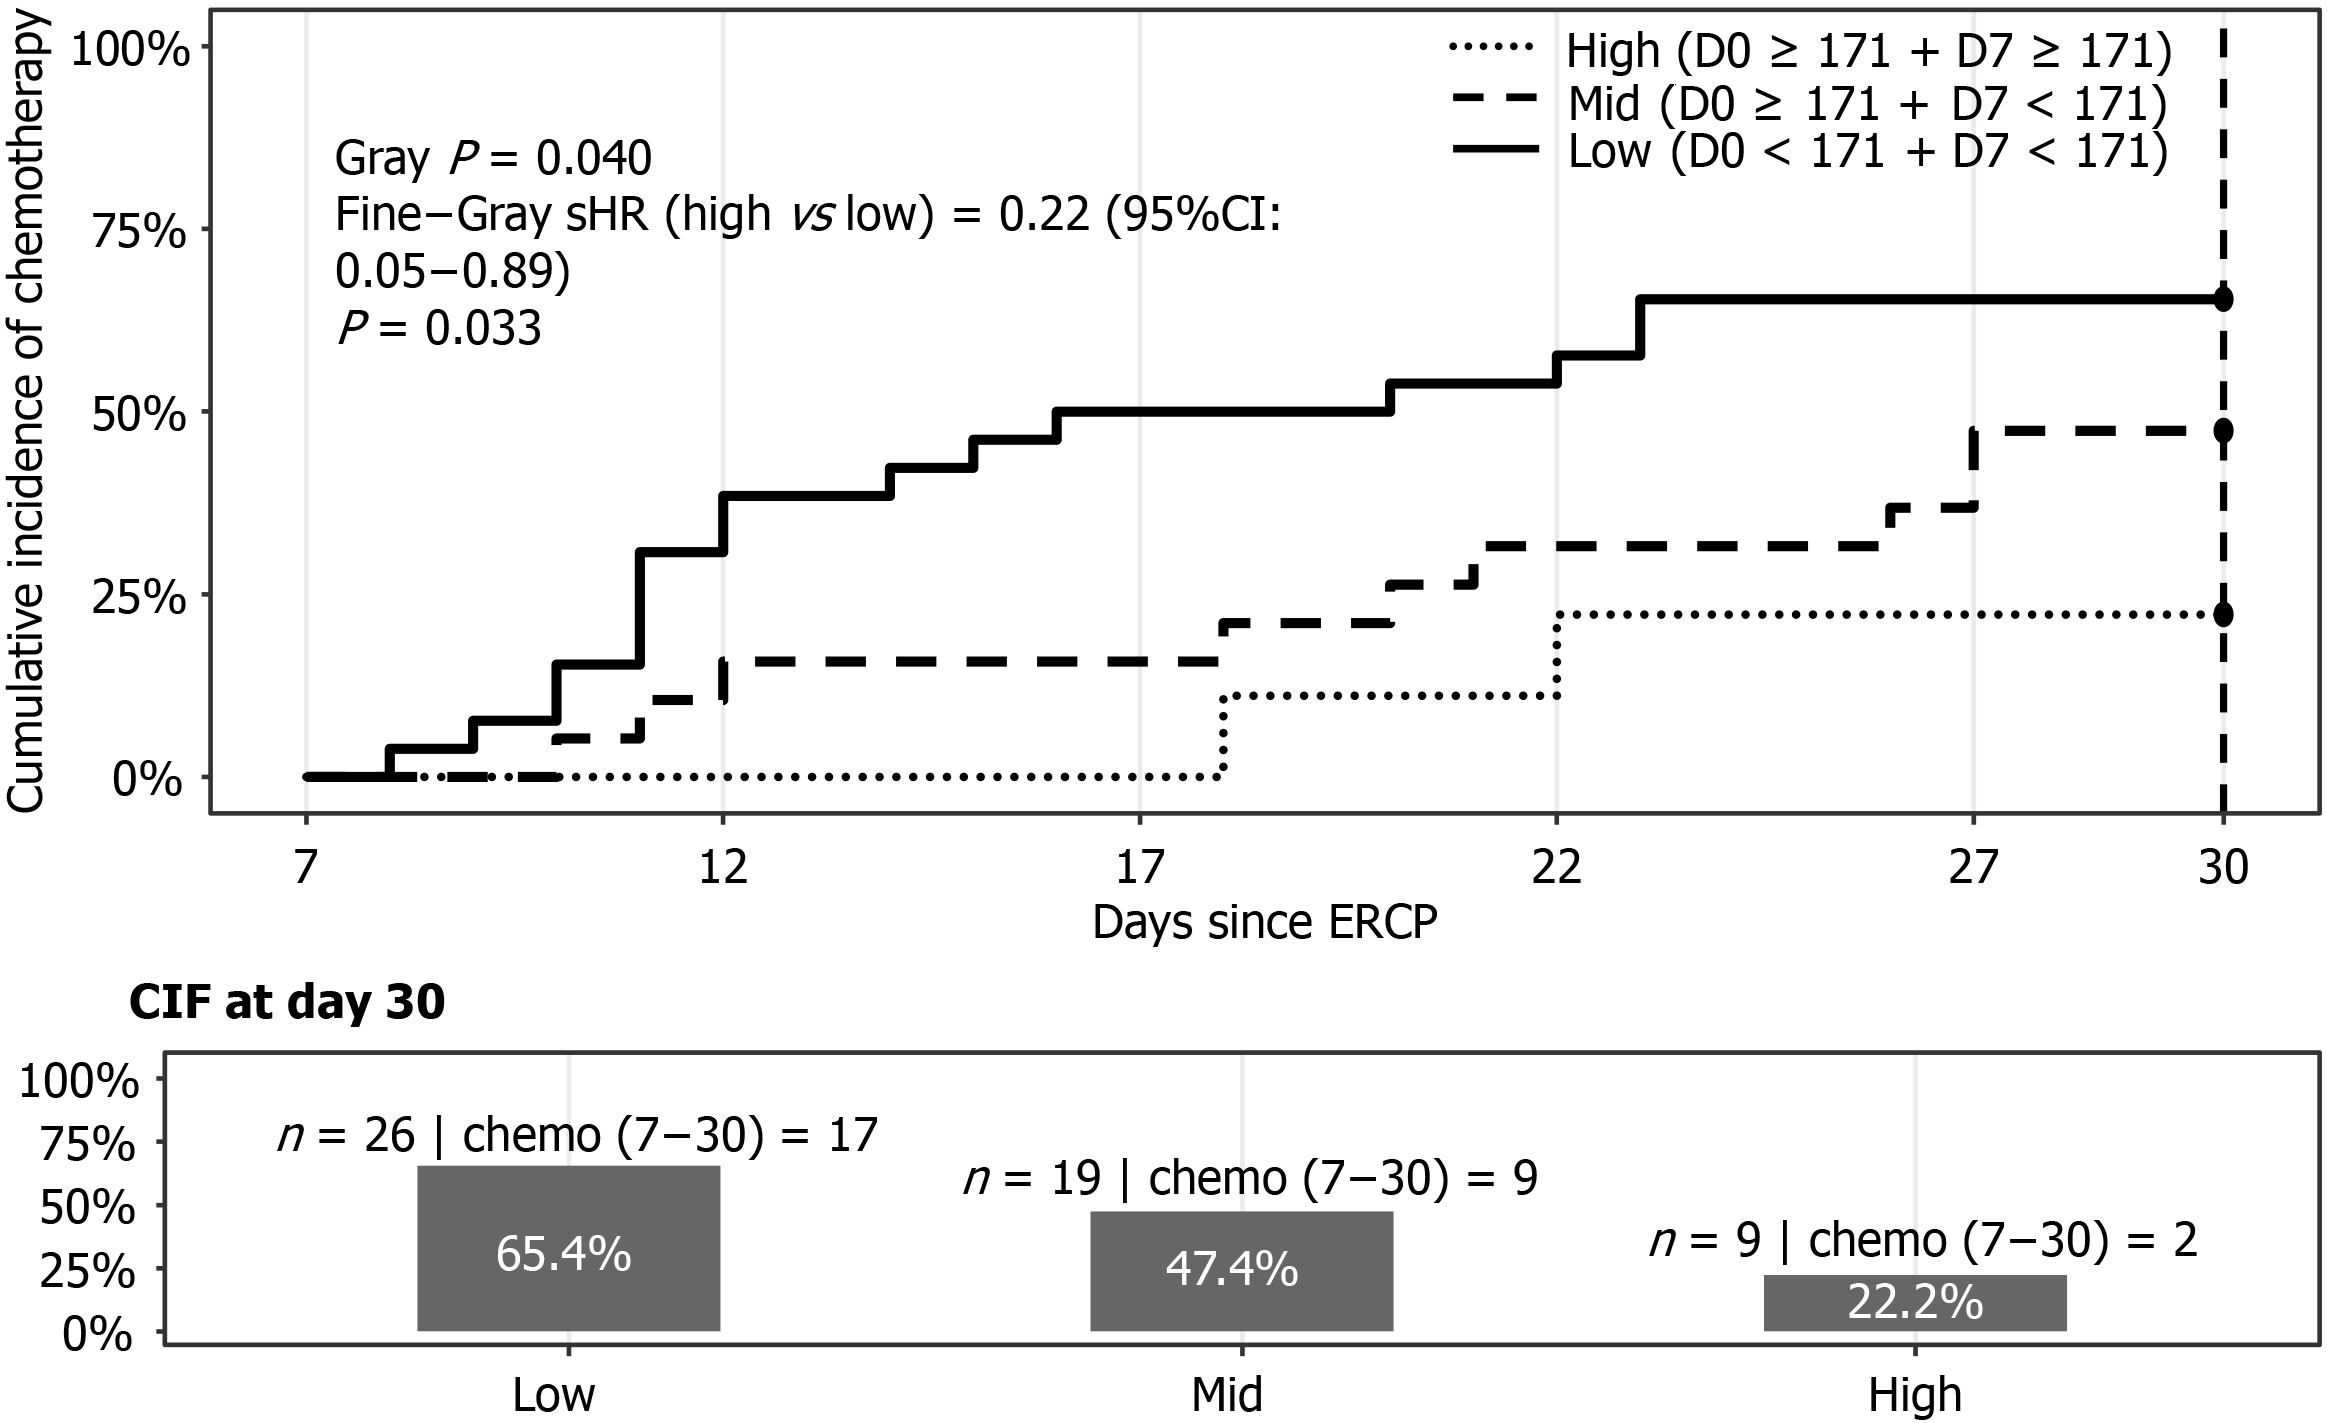
Figure 6 Dynamic bilirubin trajectory and day 7-30 chemotherapy accessibility.
Cumulative incidence function curves for chemotherapy initiation during days 7-30 after endoscopic retrograde cholangiopancreatography according to dynamic bilirubin trajectory groups defined by baseline and day-7 total bilirubin relative to the 171 μmol/L threshold. Death before chemotherapy initiation was treated as a competing event. The lower panel shows the day-30 cumulative incidence and the number of patients and chemotherapy events in each group. CIF: Cumulative incidence function; sHR: Subdistribution hazard ratio; ERCP: Endoscopic retrograde cholangiopancreatography.
- Citation: Liao YX, Cao MY, Chen YF, Yang Q, Lin SY, Li Y, Weng J, Huang XX, Gao XY, Wang GB, Li JJ, Shan HB. Early chemotherapy after endoscopic retrograde cholangiopancreatography and survival in advanced pancreatic cancer with biliary obstruction. World J Gastroenterol 2027; 33(2): 122338
- URL: https://www.wjgnet.com/1007-9327/full/v33/i2/122338.htm
- DOI: https://dx.doi.org/10.3748/wjg.122338