
















Copyright: ©Author(s) 2027.
World J Gastroenterol. Jan 7, 2027; 33(1): 124236
Published online Jan 7, 2027. doi: 10.3748/wjg.124236
Published online Jan 7, 2027. doi: 10.3748/wjg.124236
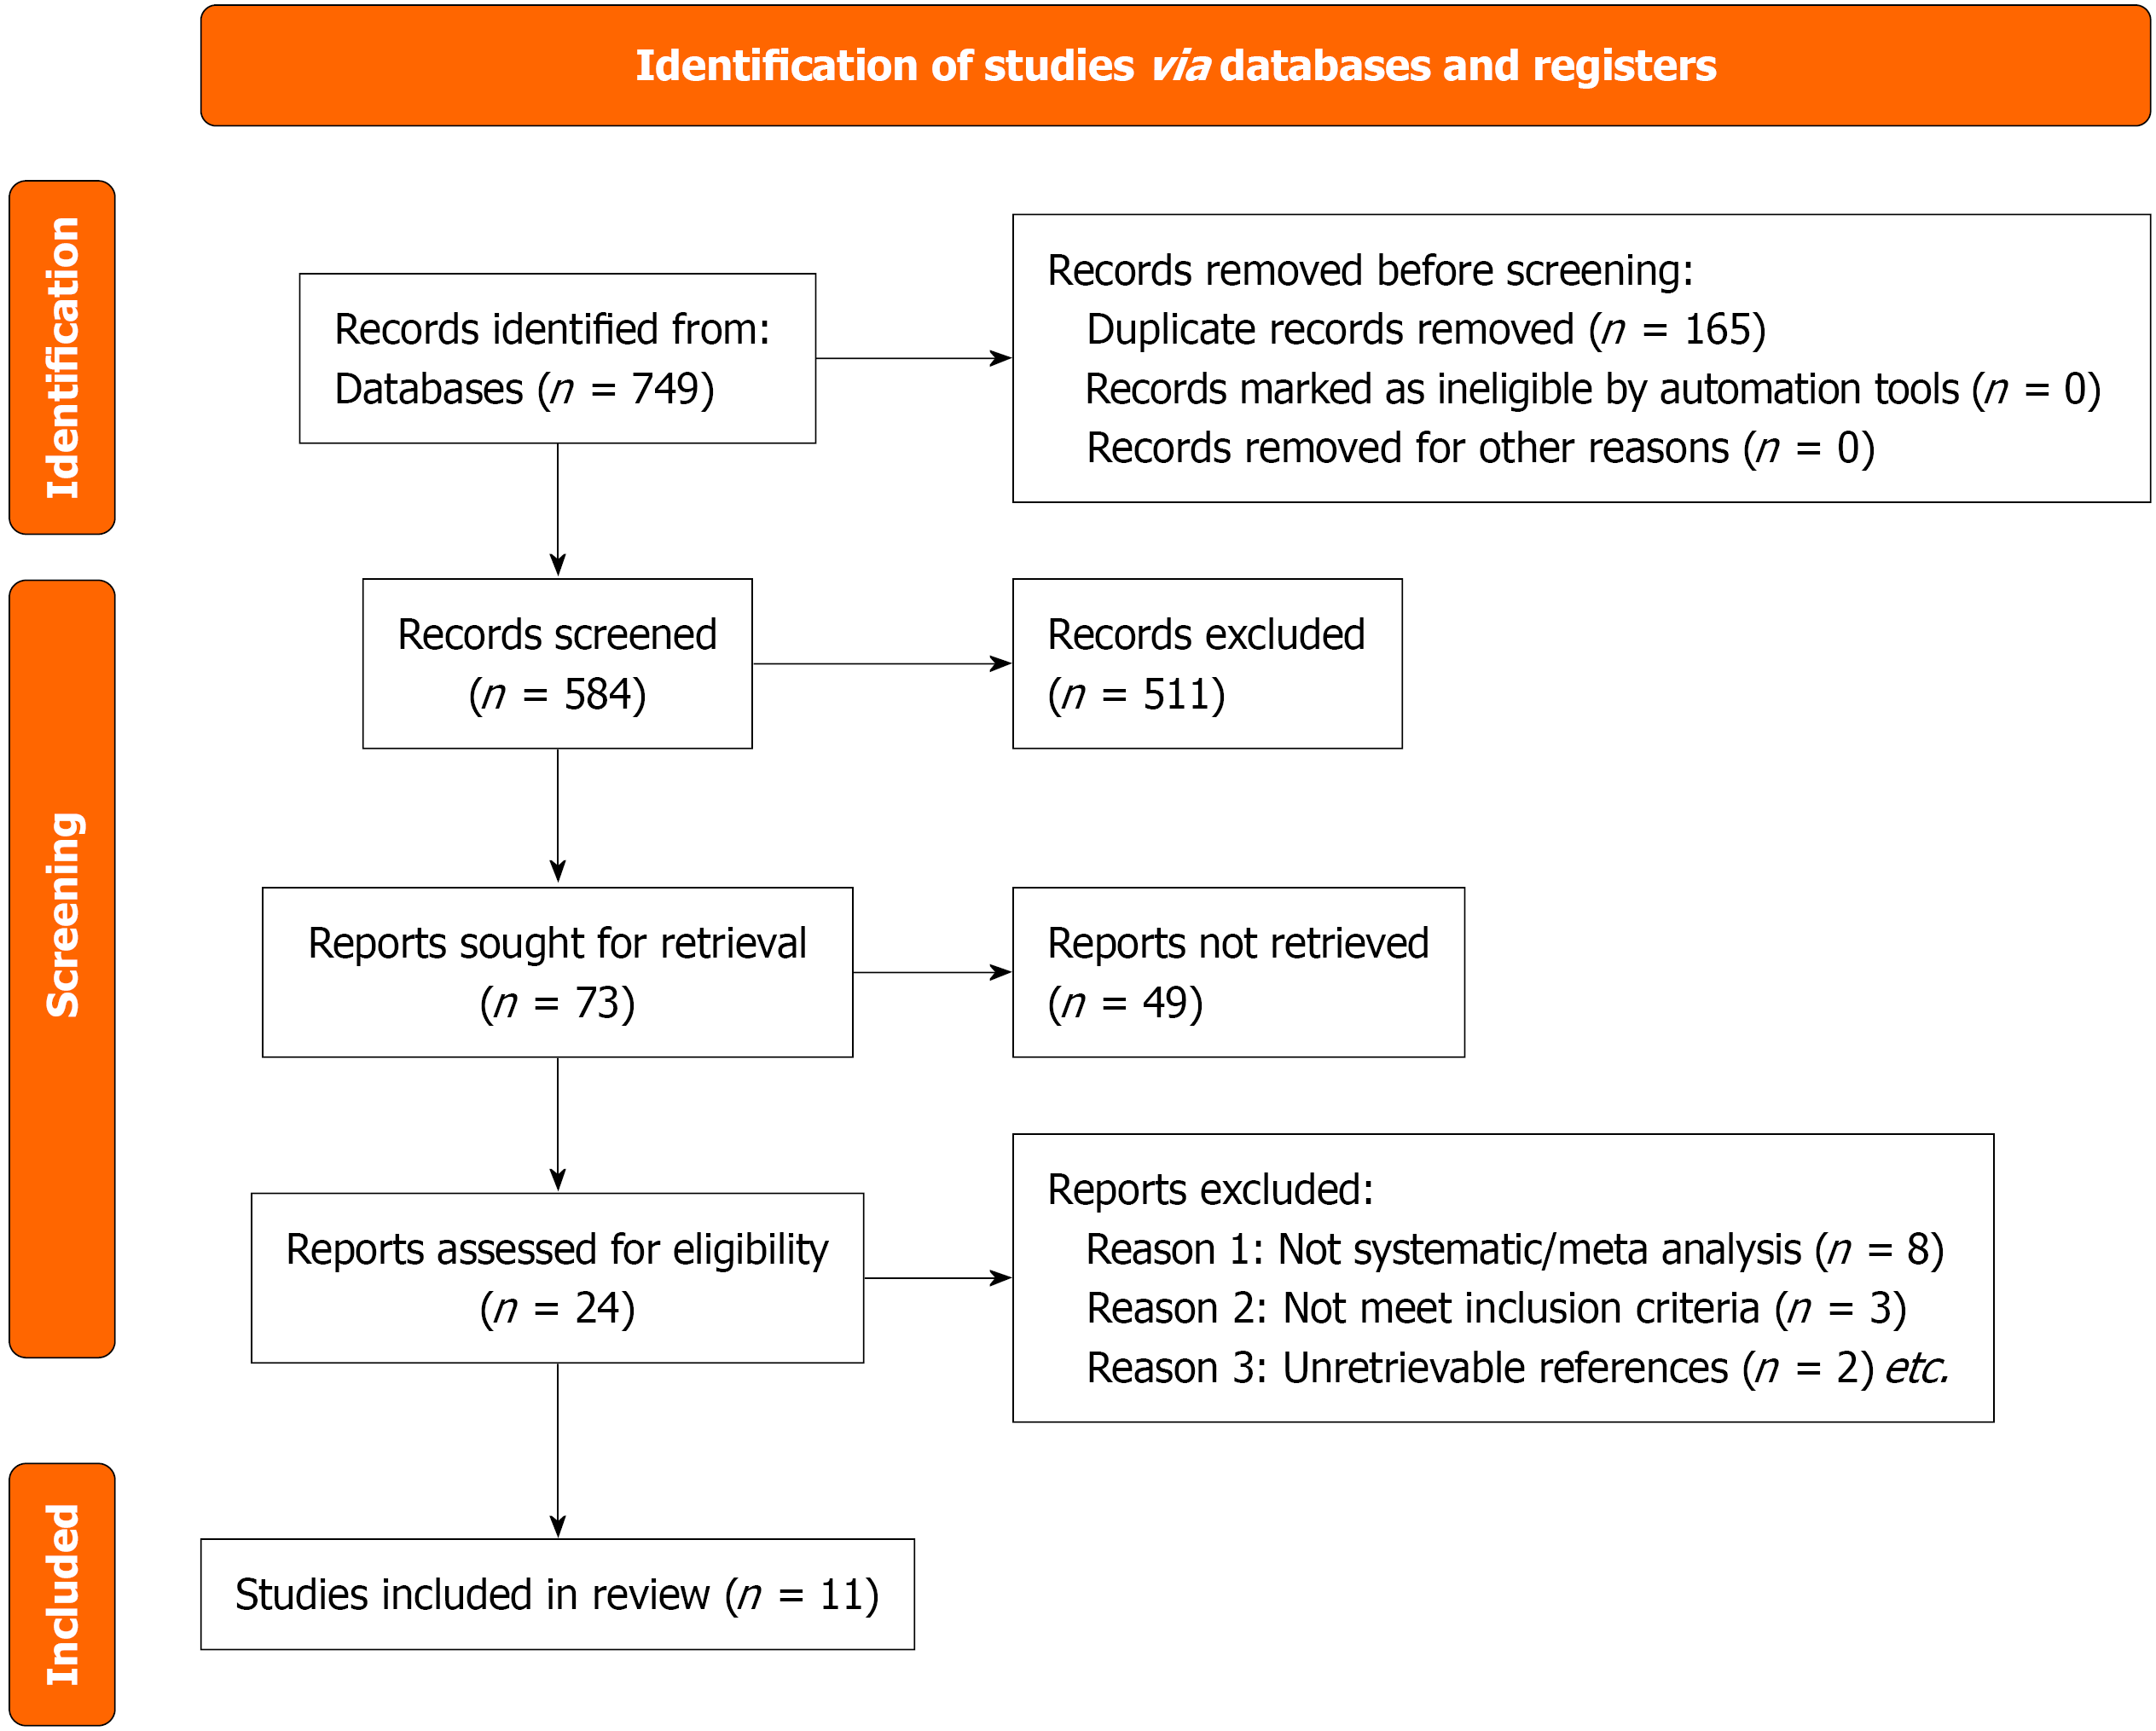
Figure 1
Preferred reporting items for systematic reviews and meta-analyses flow diagram of the study selection process for the umb
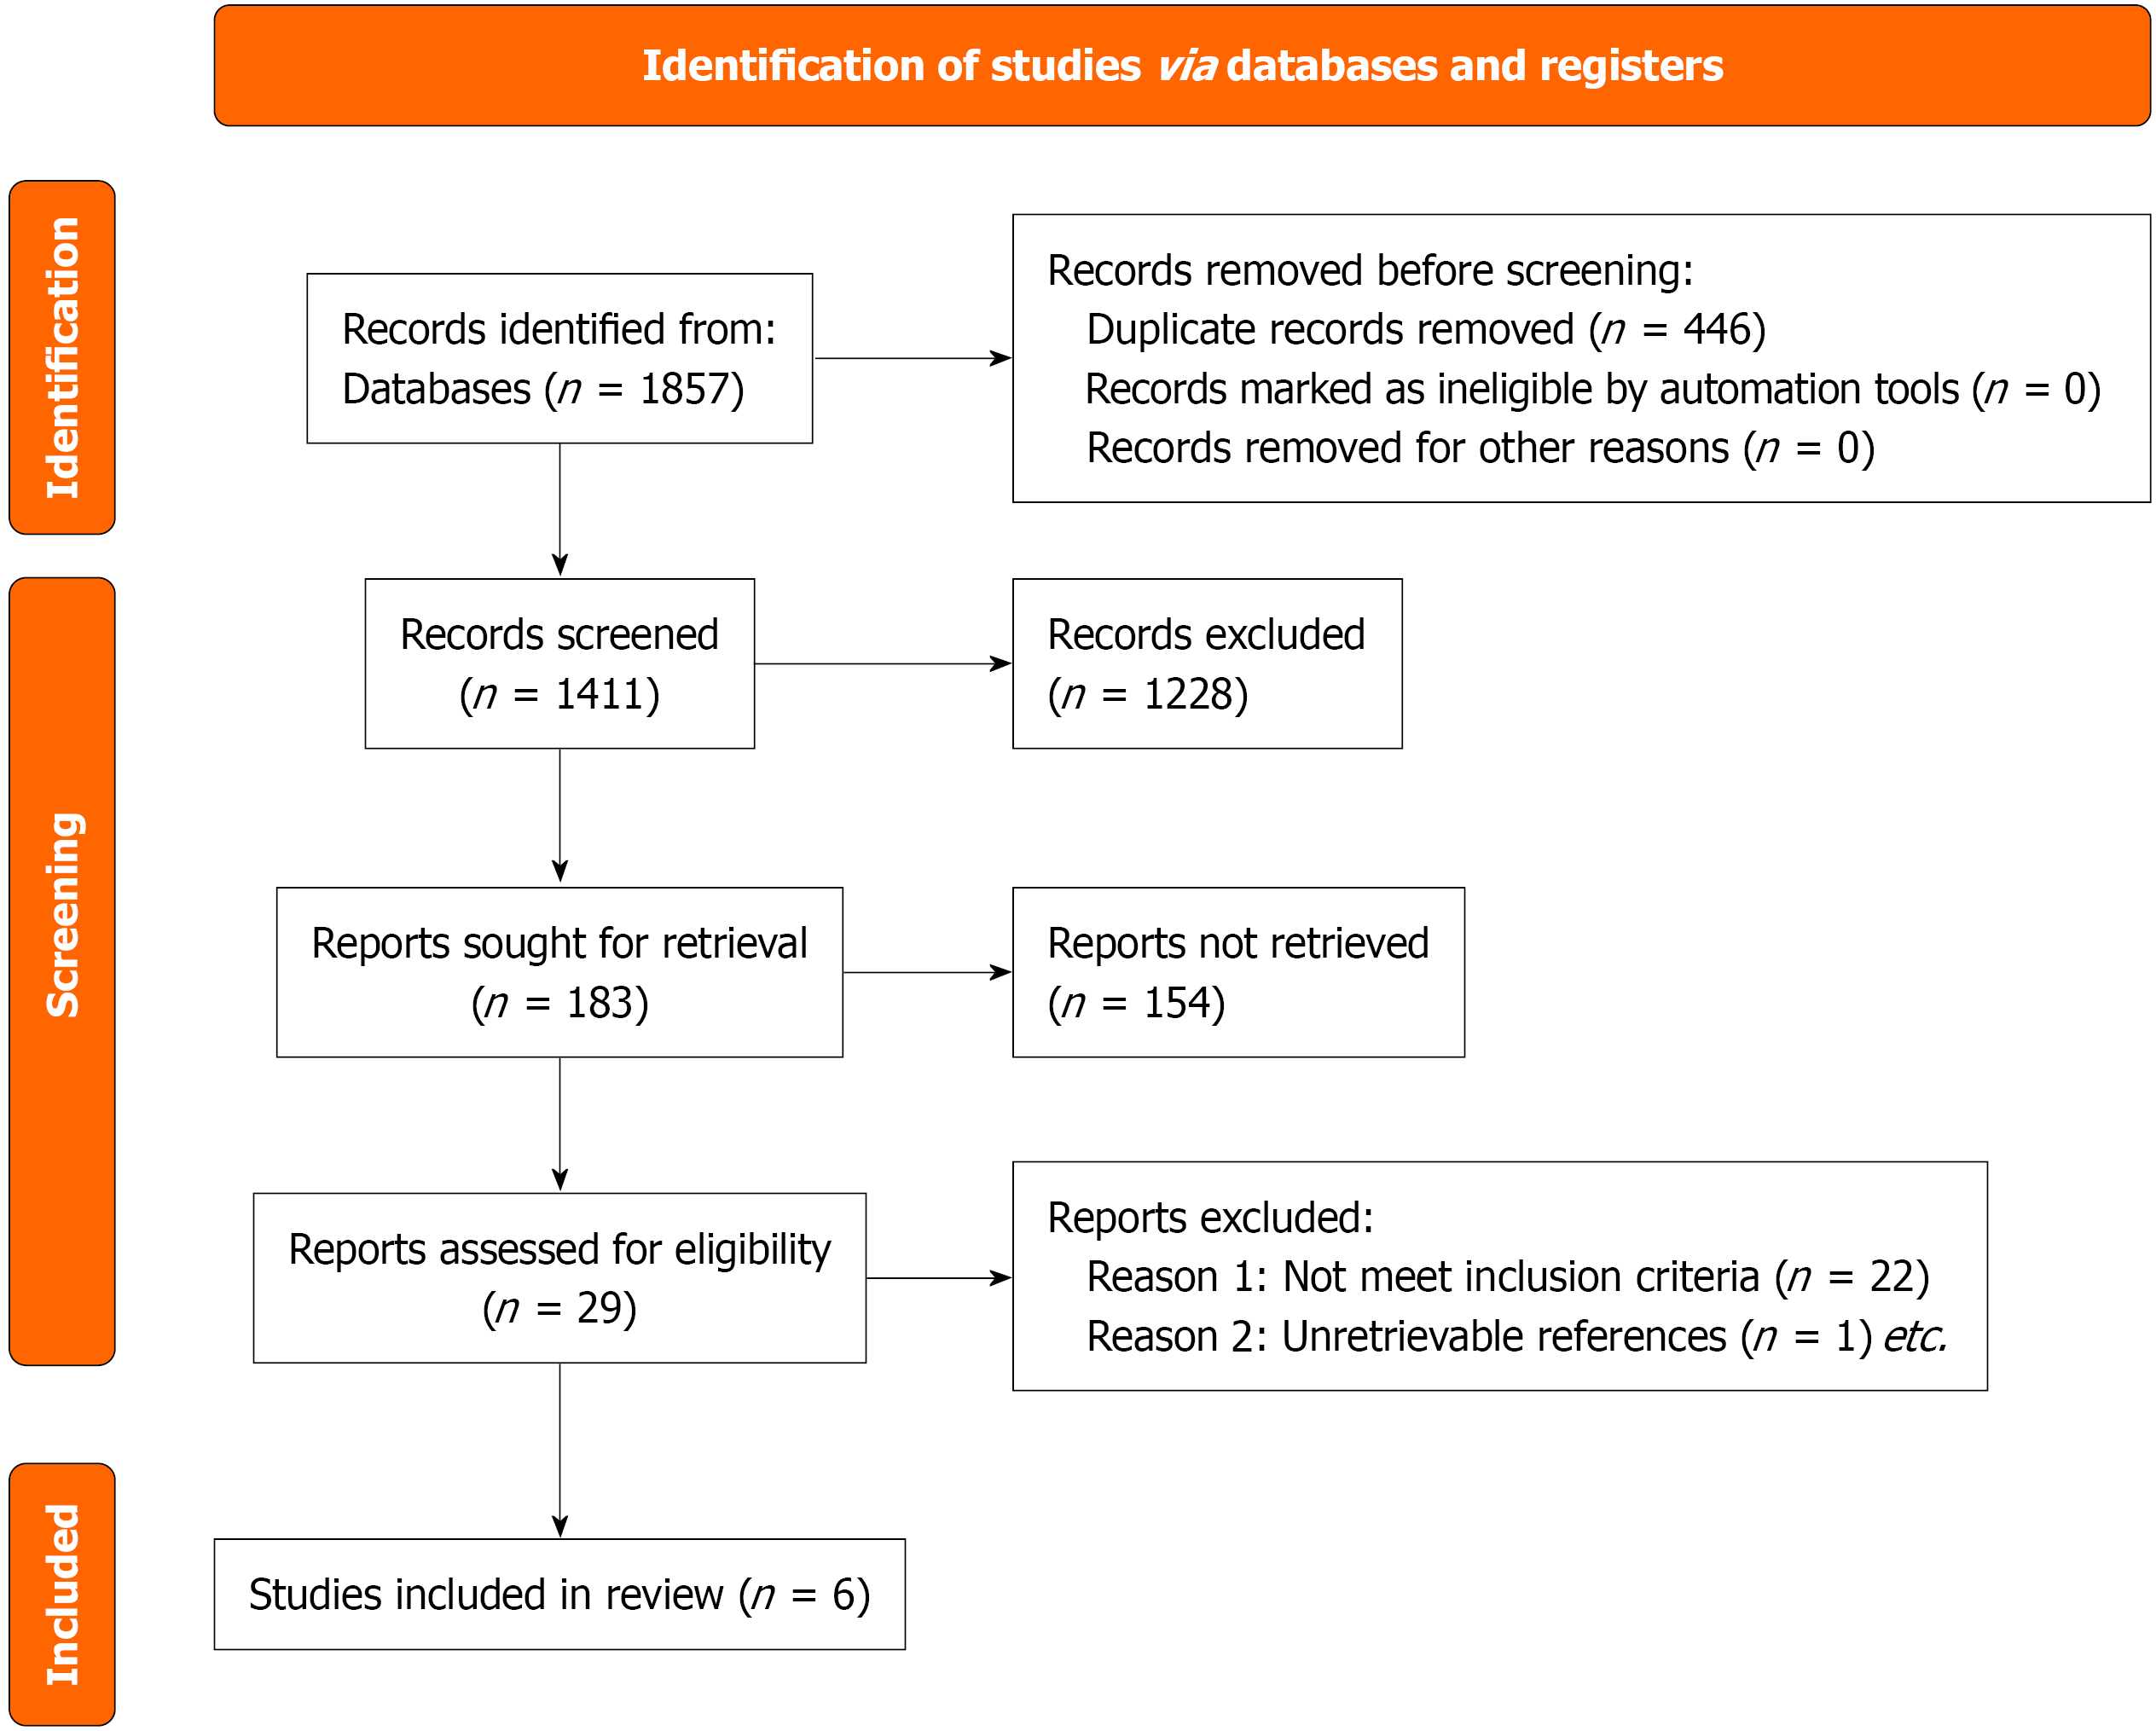
Figure 2
Preferred reporting items for systematic reviews and meta-analyses flow diagram of the study selection process for the pro
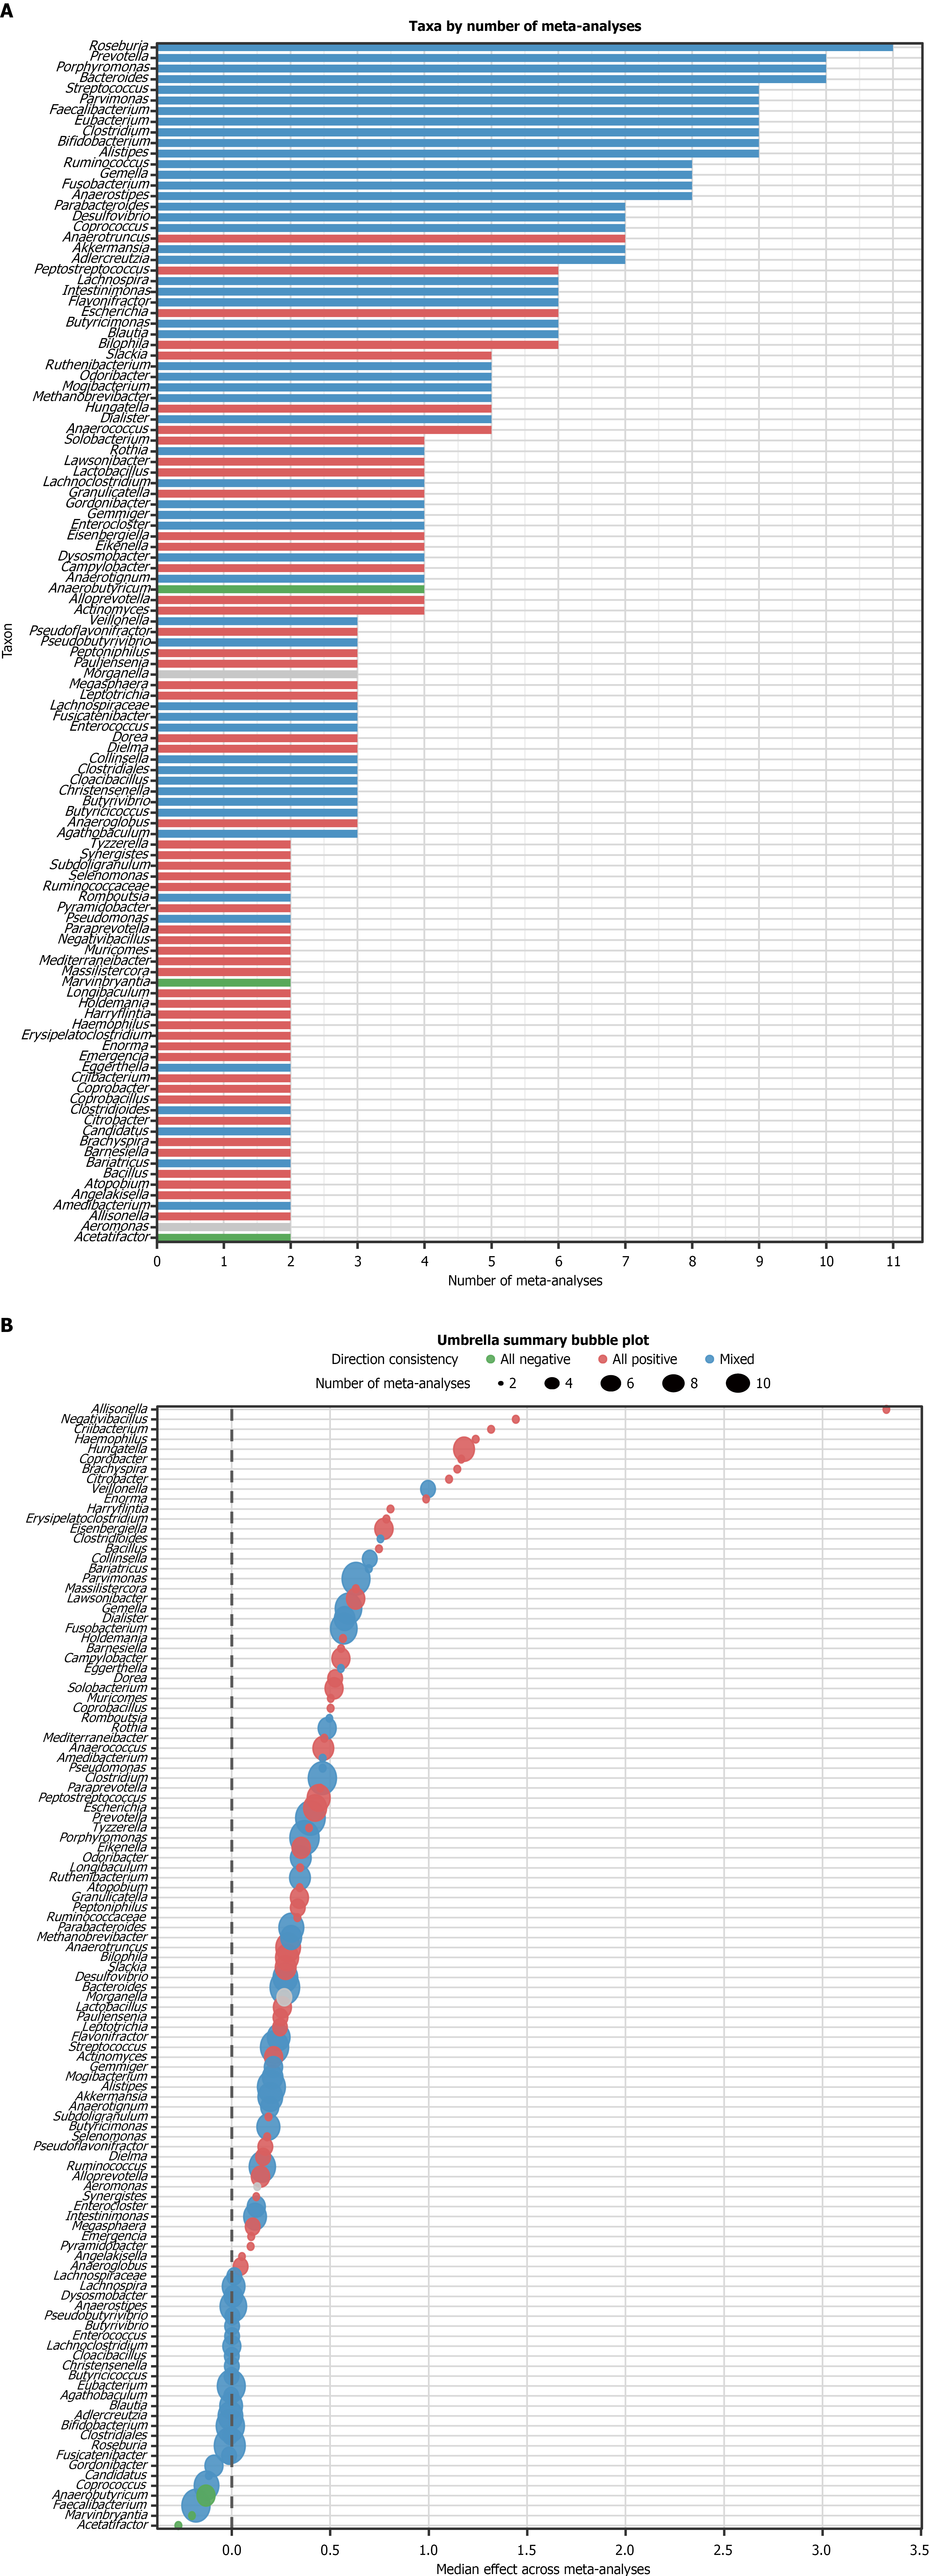
Figure 3 Umbrella review analysis of gut microbiota genera associated with colorectal cancer.
A: Consistency classification and reporting frequency of microbial genera (k); B: Median effect sizes of the genera reported in the meta-analyses. The error bars represent interquartile ranges, and the bubble size reflects the number of included meta-analyses.
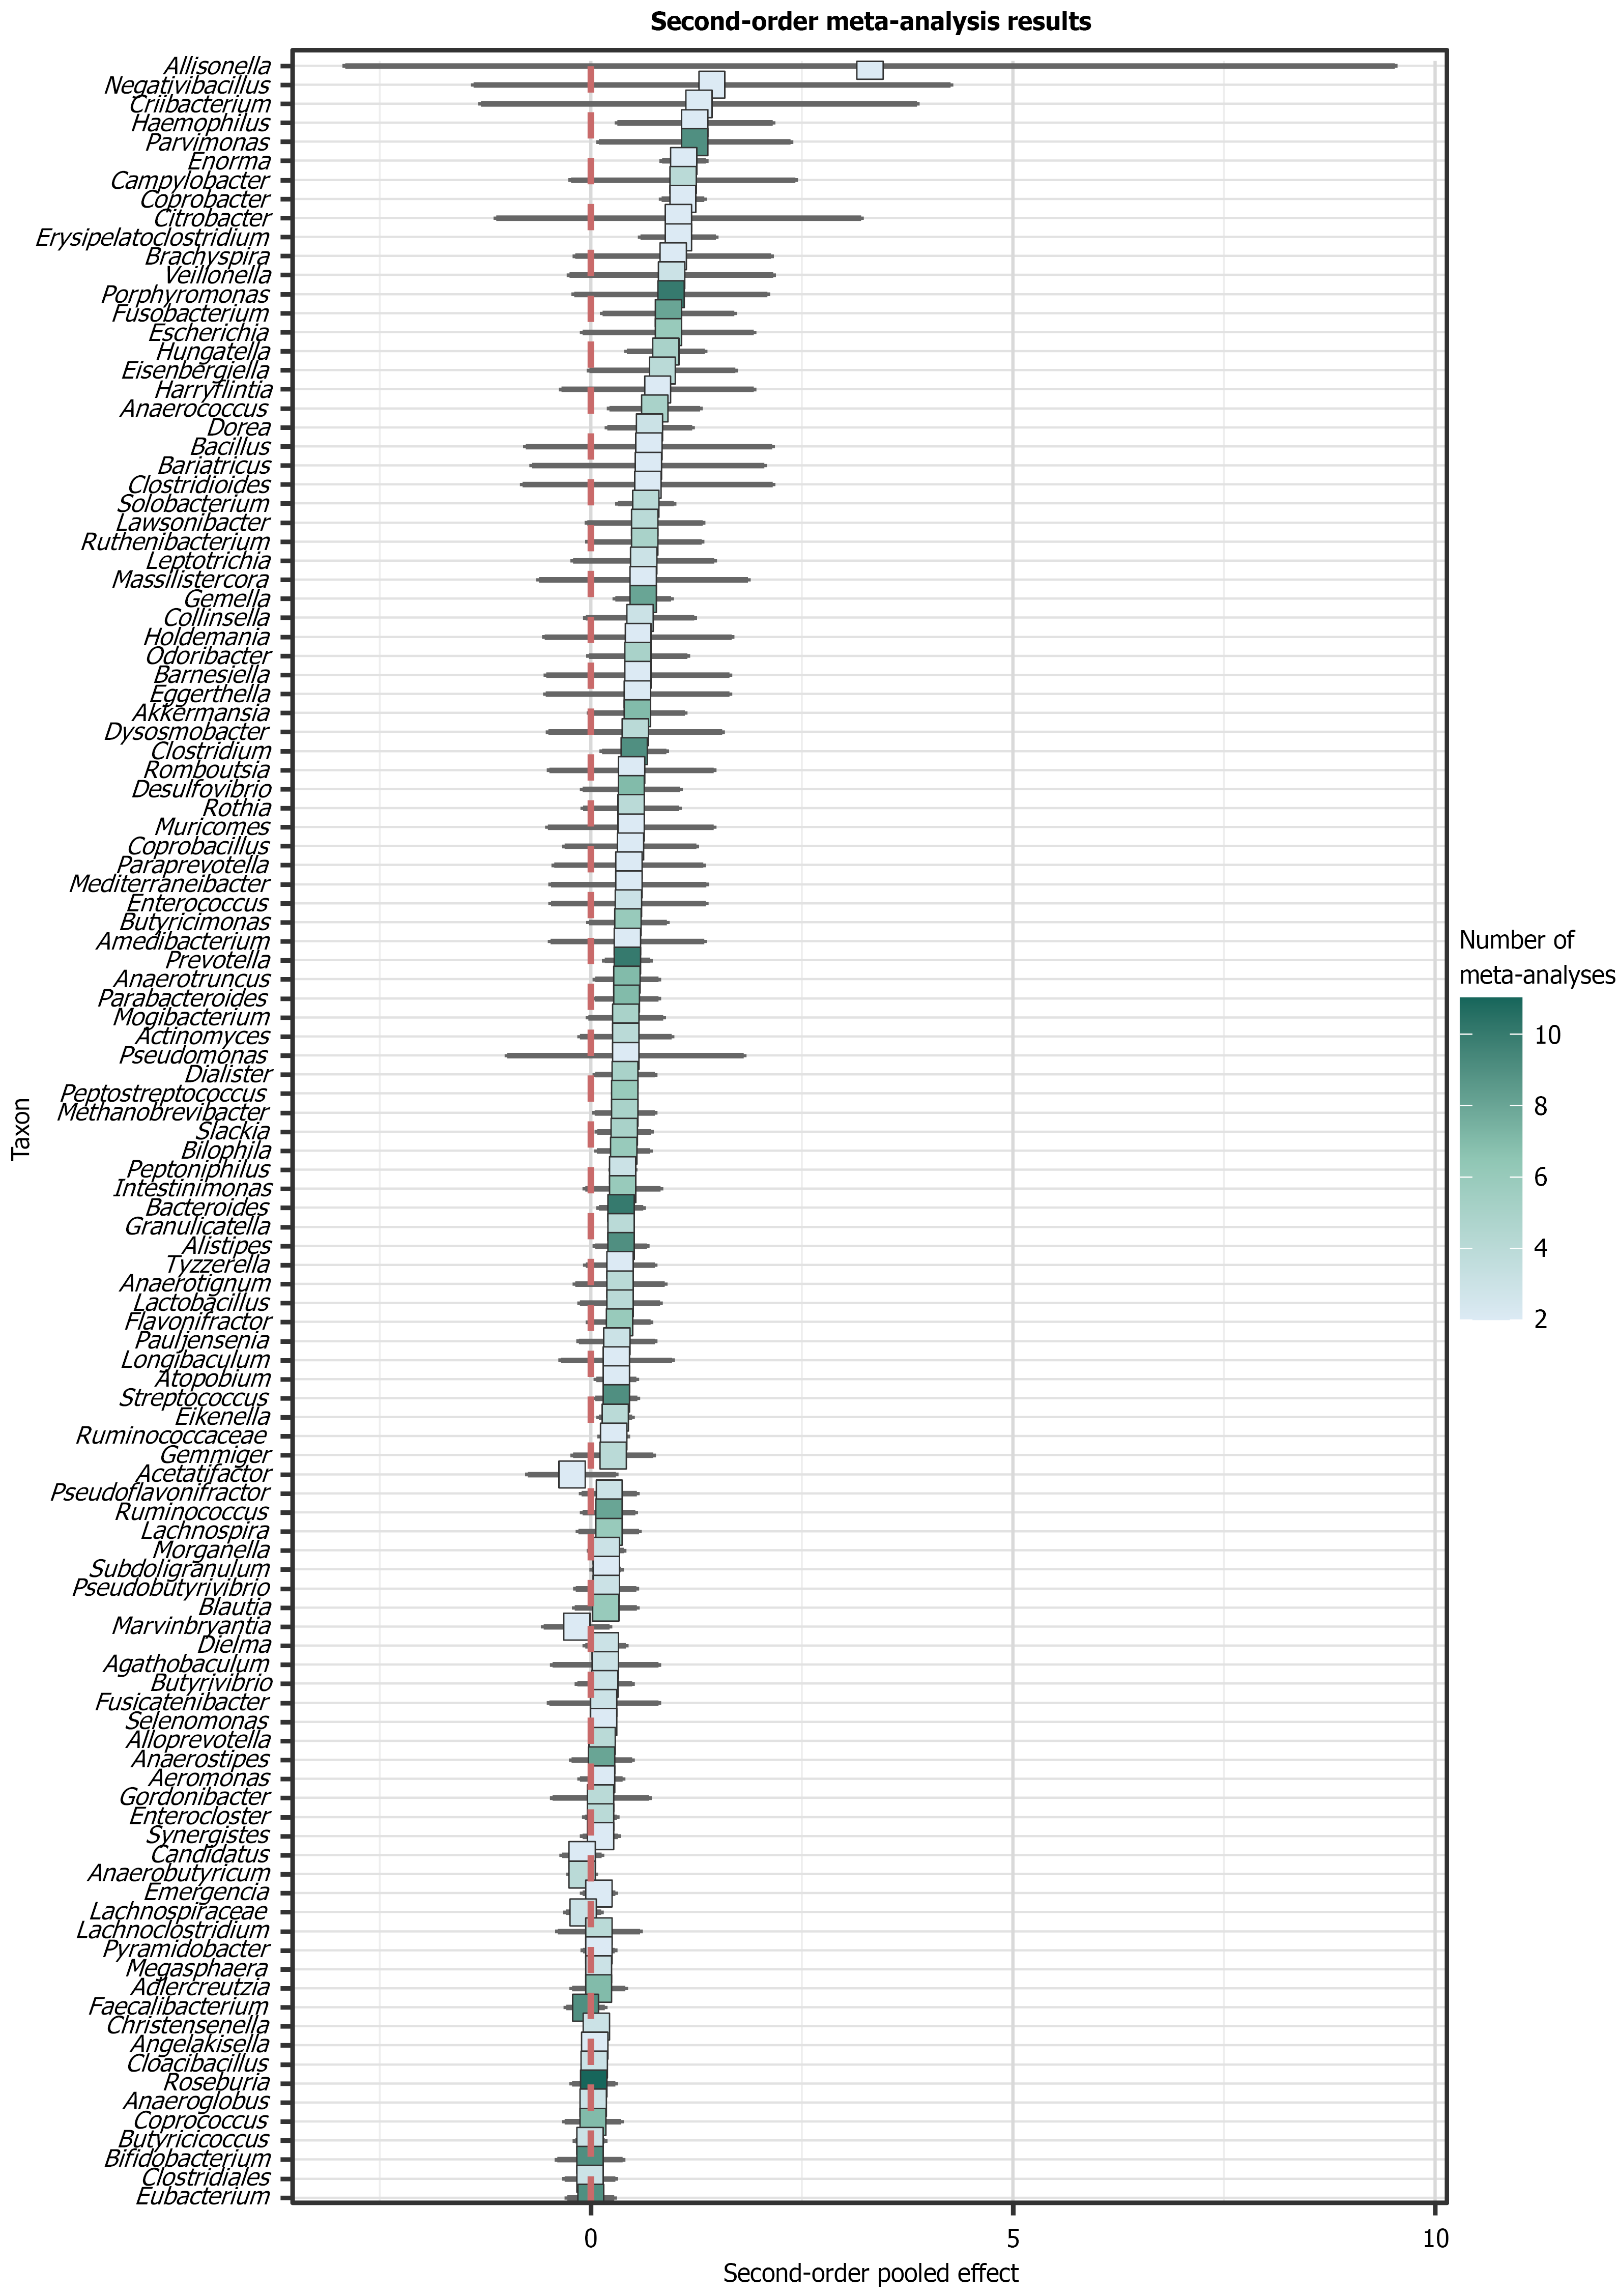
Figure 4 Forest plot of the second-order meta-analysis for gut microbiota genera associated with colorectal cancer risk.
Pooled effect sizes with 95% confidence intervals are shown for genera that were reported in at least two independent meta-analyses (k ≥ 2). Taxa are ordered by the magnitude of the effect size. The color intensity corresponds to the number of meta-analyses included for each genus.
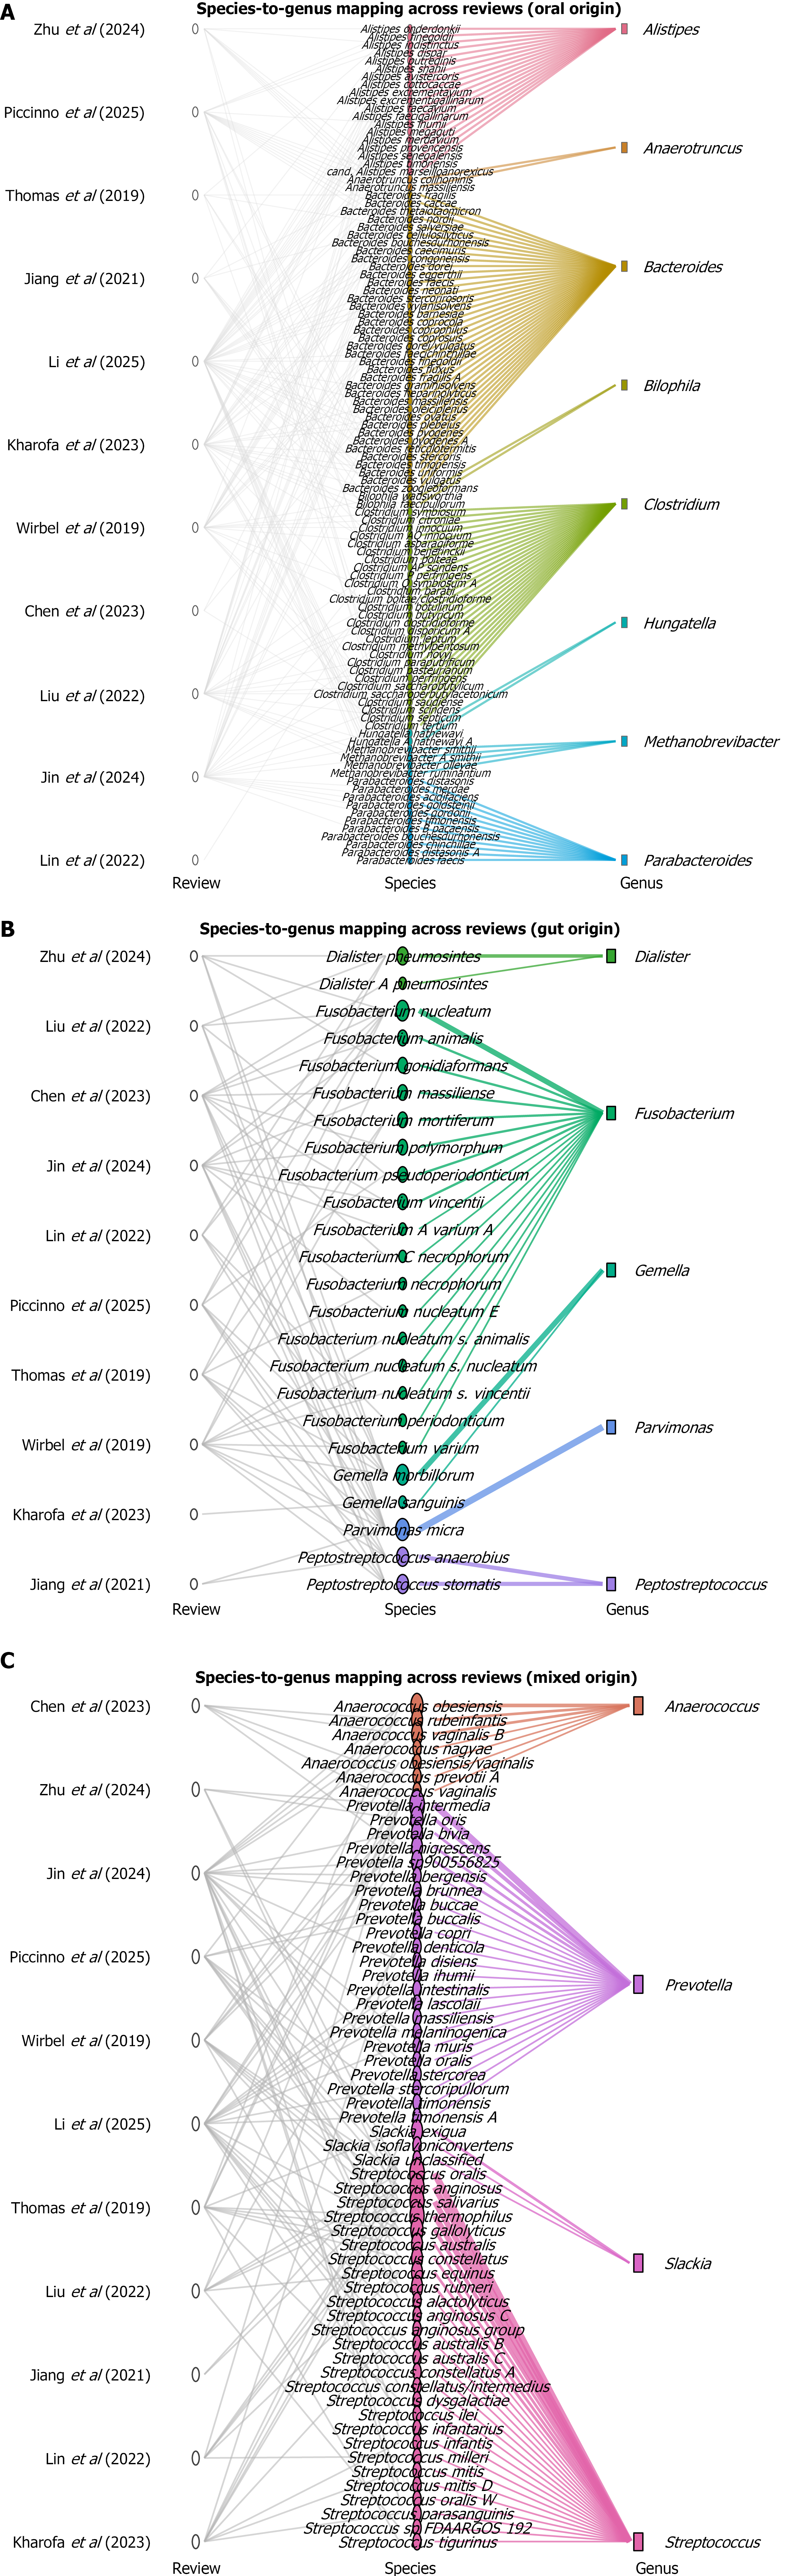
Figure 5 Species-level taxonomic mapping of gut microbiota genera significantly associated with colorectal cancer (P ≤ 0.
05, k ≥ 5). A: Oral-derived genera; B: Gut-derived genera; C: Mixed-derived genera (oral and gut).
Figure 6 RoB2 risk of bias summary for the included intervention studies.
A: Domain-level and overall RoB2 judgments for each study; B: Proportion of studies judged at each risk of bias level for each item, presented as percentages across all included studies.
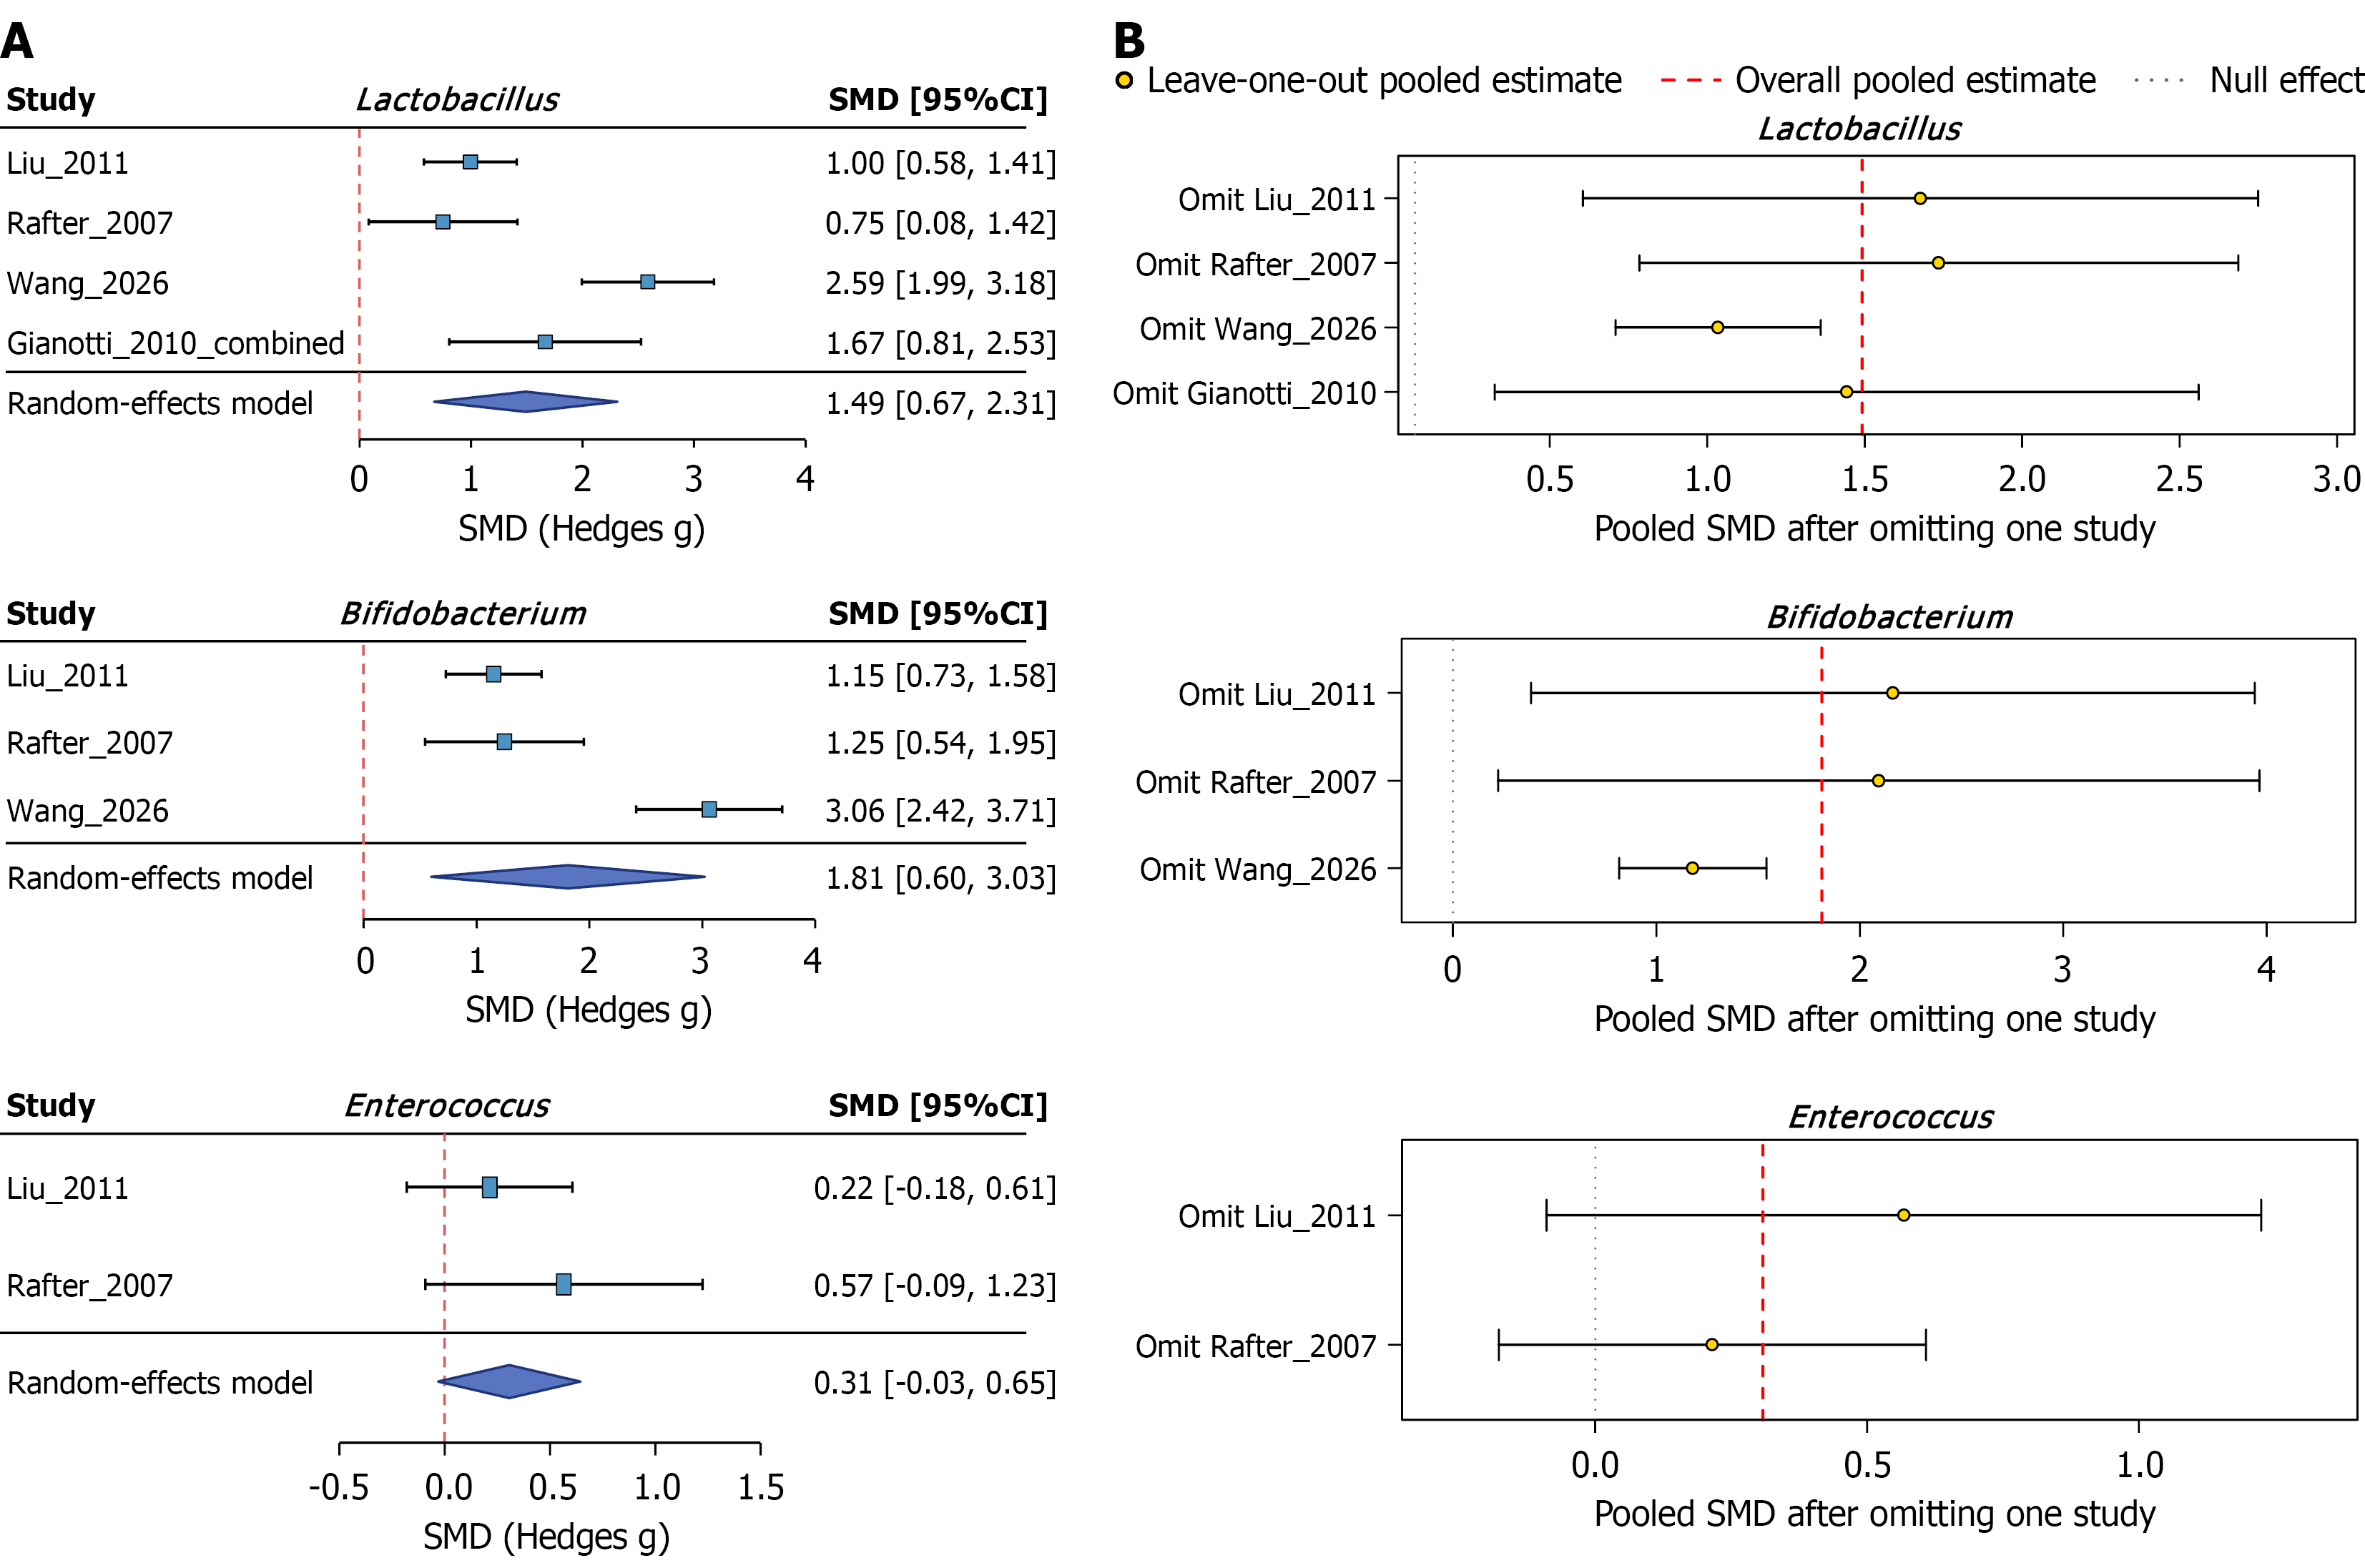
Figure 7 Forest plots and leave-one-out sensitivity analyses of probiotic/synbiotic effects on the gut microbiota in colorectal cancer patients.
Forest plots show pooled standardized mean differences with 95% confidence intervals. A: Forest plots of eligible quantitative meta-analyses by taxon; B: Leave-one-out sensitivity analysis. SMD: Standardized mean differences; CI: Confidence interval.
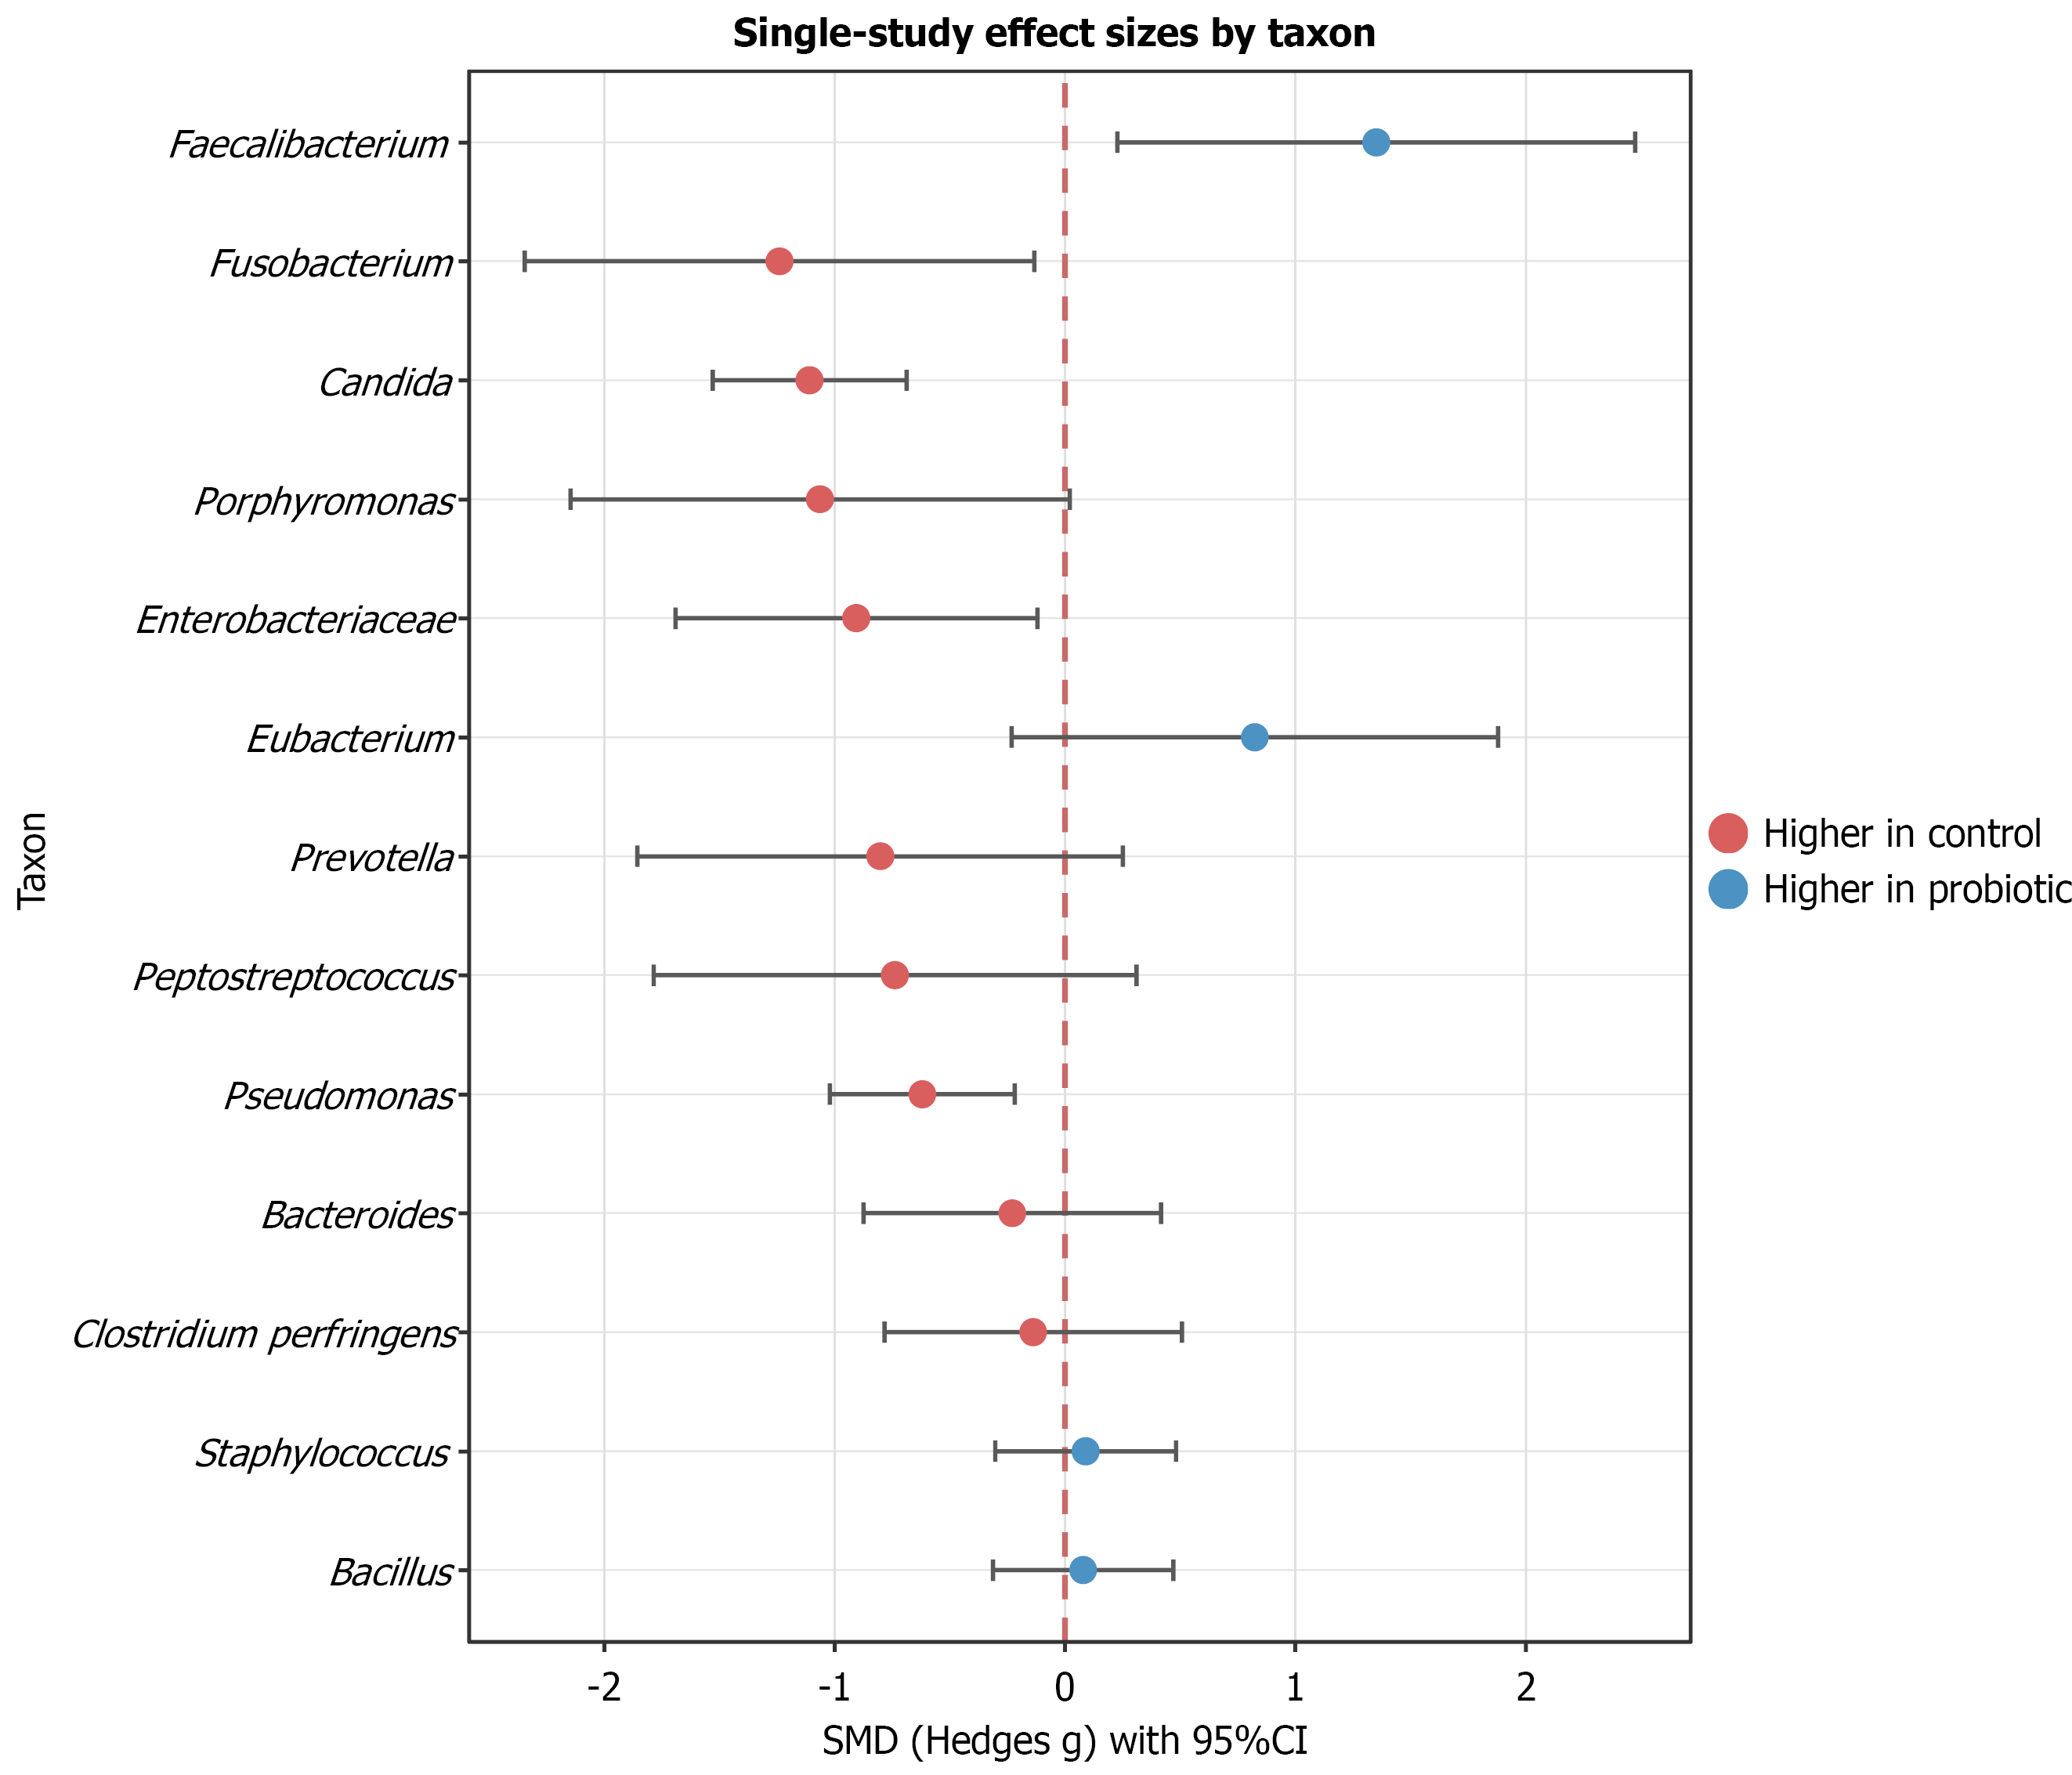
Figure 8 Individual-study standardized mean differences for microbial taxa reported in single intervention studies.
Standardized mean differences with 95% confidence intervals are shown for taxa reported in single studies (k = 1). SMD: Standardized mean differences; CI: Confidence interval.
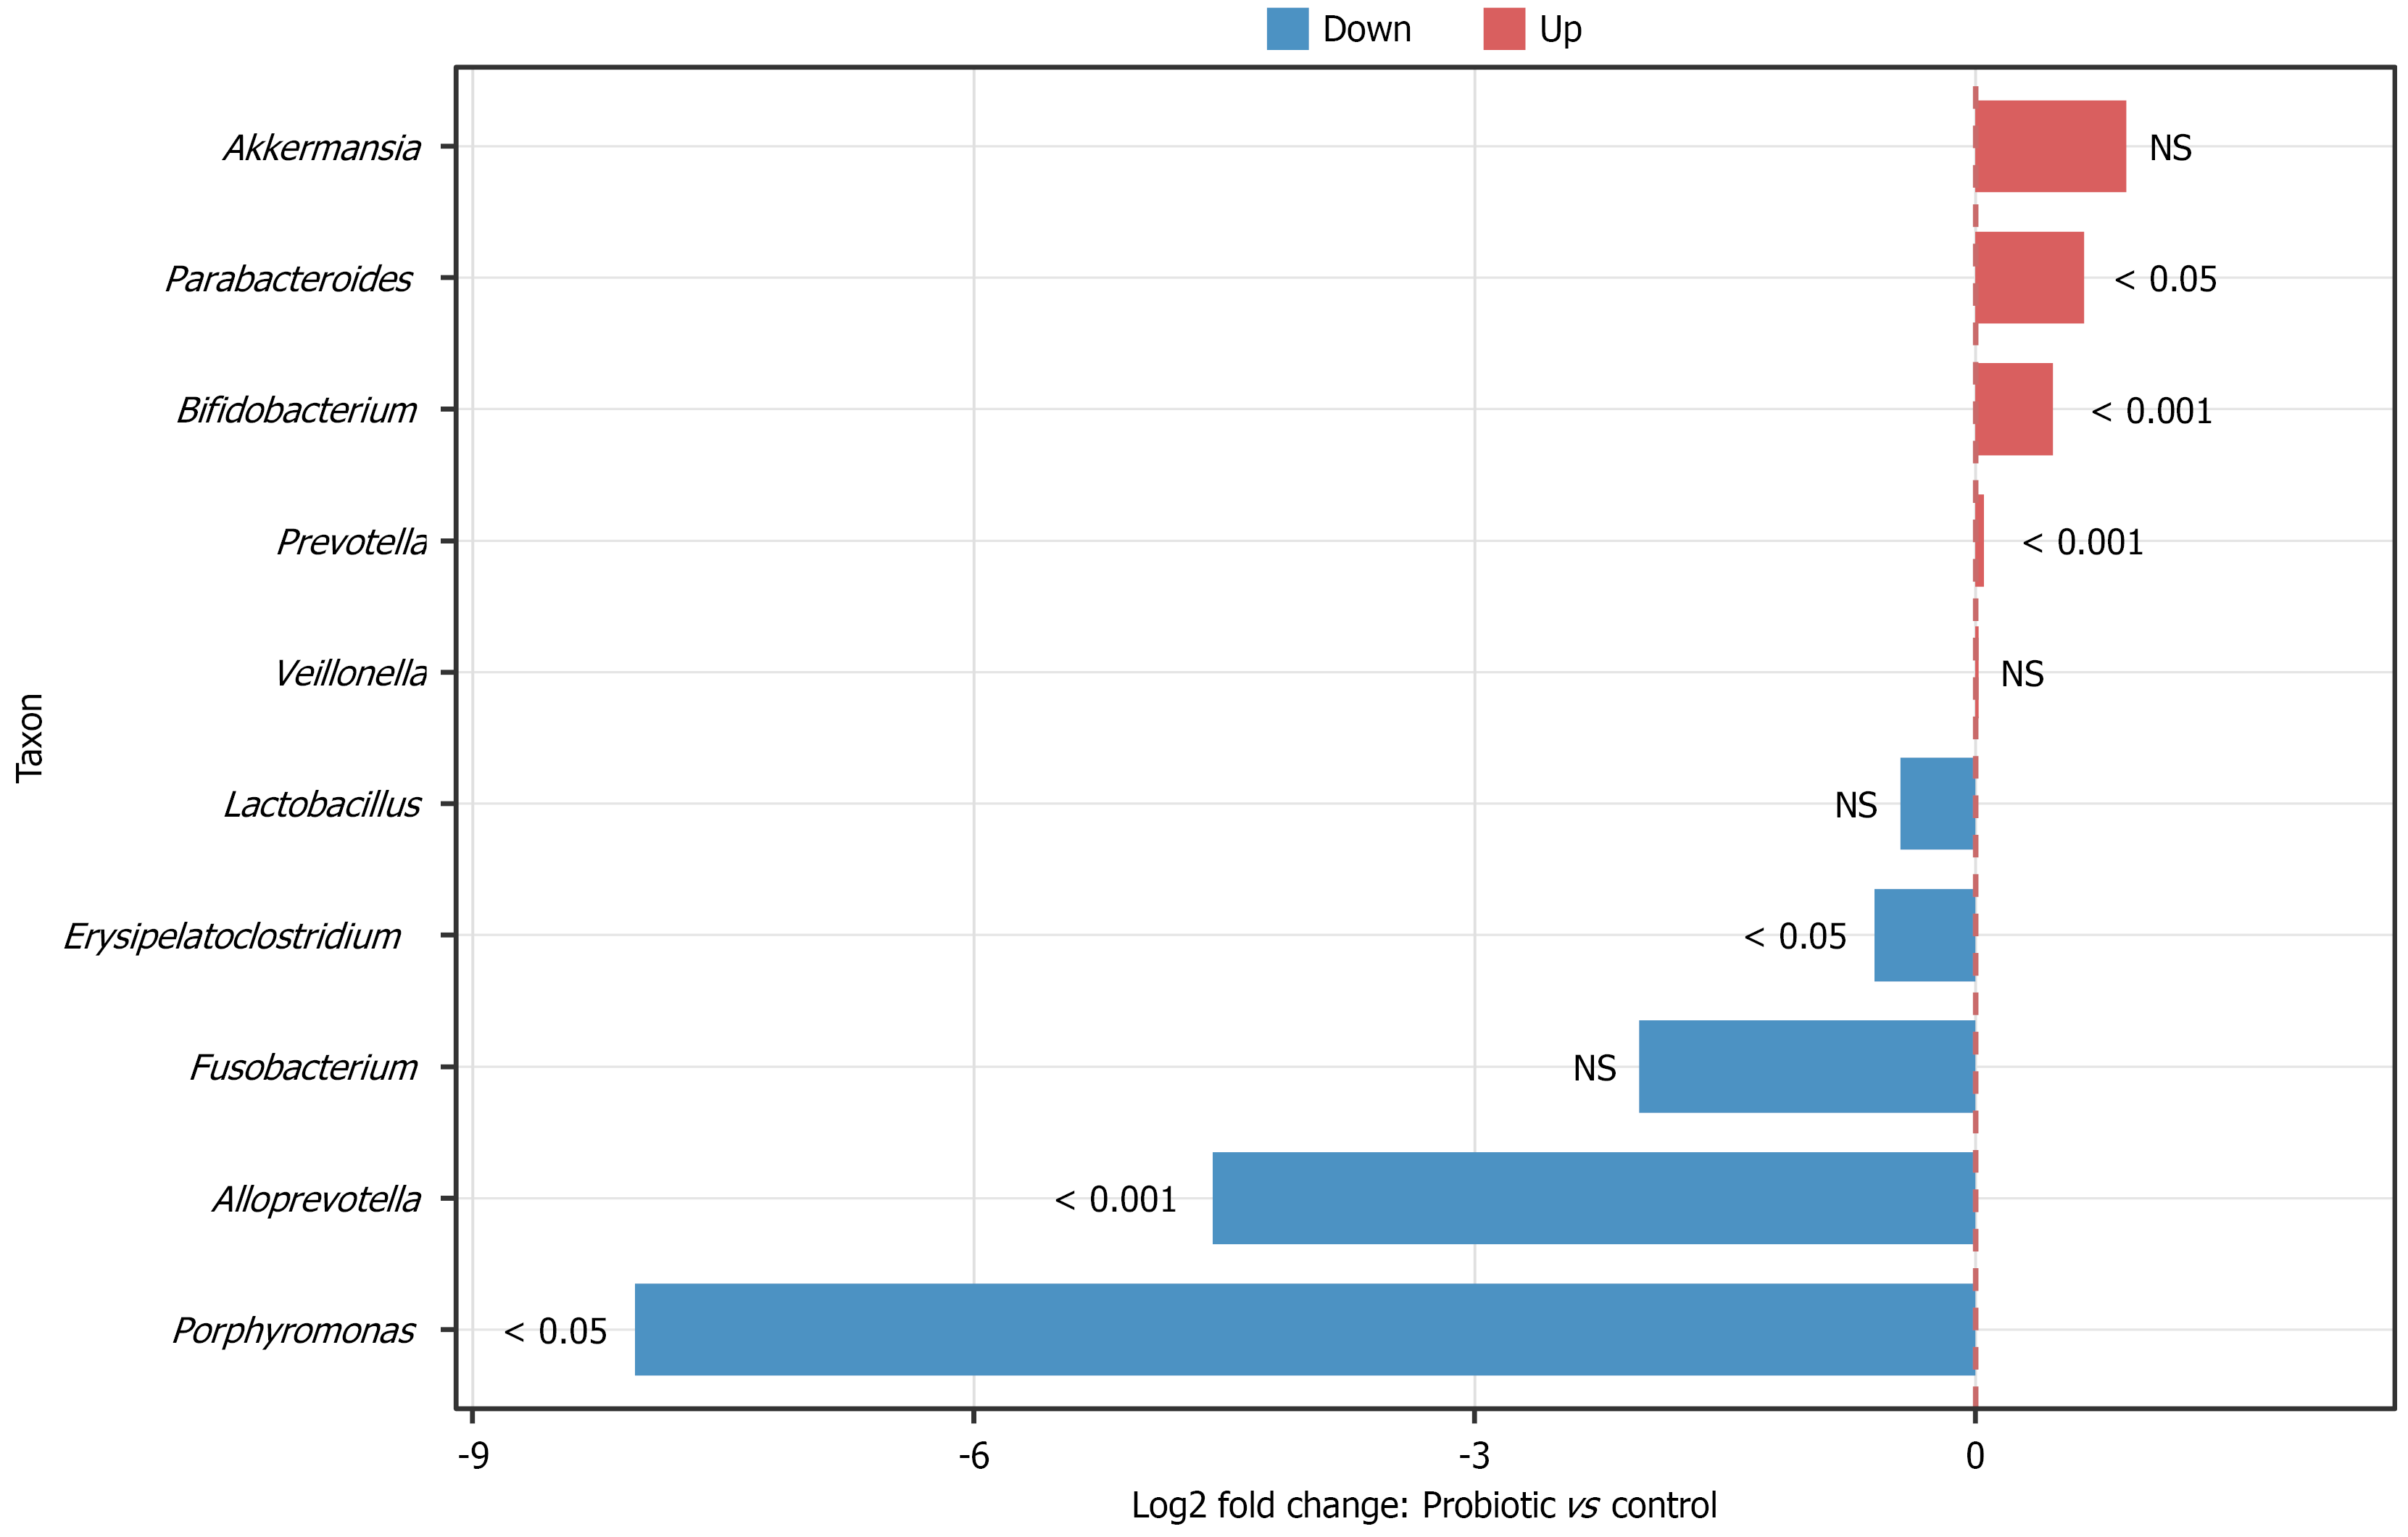
Figure 9 Qualitative summary of microbiota changes in the study of Park et al[26].
Red and blue indicate increased and decreased relative abun
- Citation: Zeng LX, Jiang YC, Wang YQ, Ye F, Ouyang Y, Zhao ZM, Wu QB, Cheng HB. Gut microbiota signatures in colorectal cancer: Evidence synthesis from umbrella review and probiotic intervention studies. World J Gastroenterol 2027; 33(1): 124236
- URL: https://www.wjgnet.com/1007-9327/full/v33/i1/124236.htm
- DOI: https://dx.doi.org/10.3748/wjg.124236