
















Copyright: ©Author(s) 2027.
World J Gastroenterol. Jan 7, 2027; 33(1): 123989
Published online Jan 7, 2027. doi: 10.3748/wjg.123989
Published online Jan 7, 2027. doi: 10.3748/wjg.123989
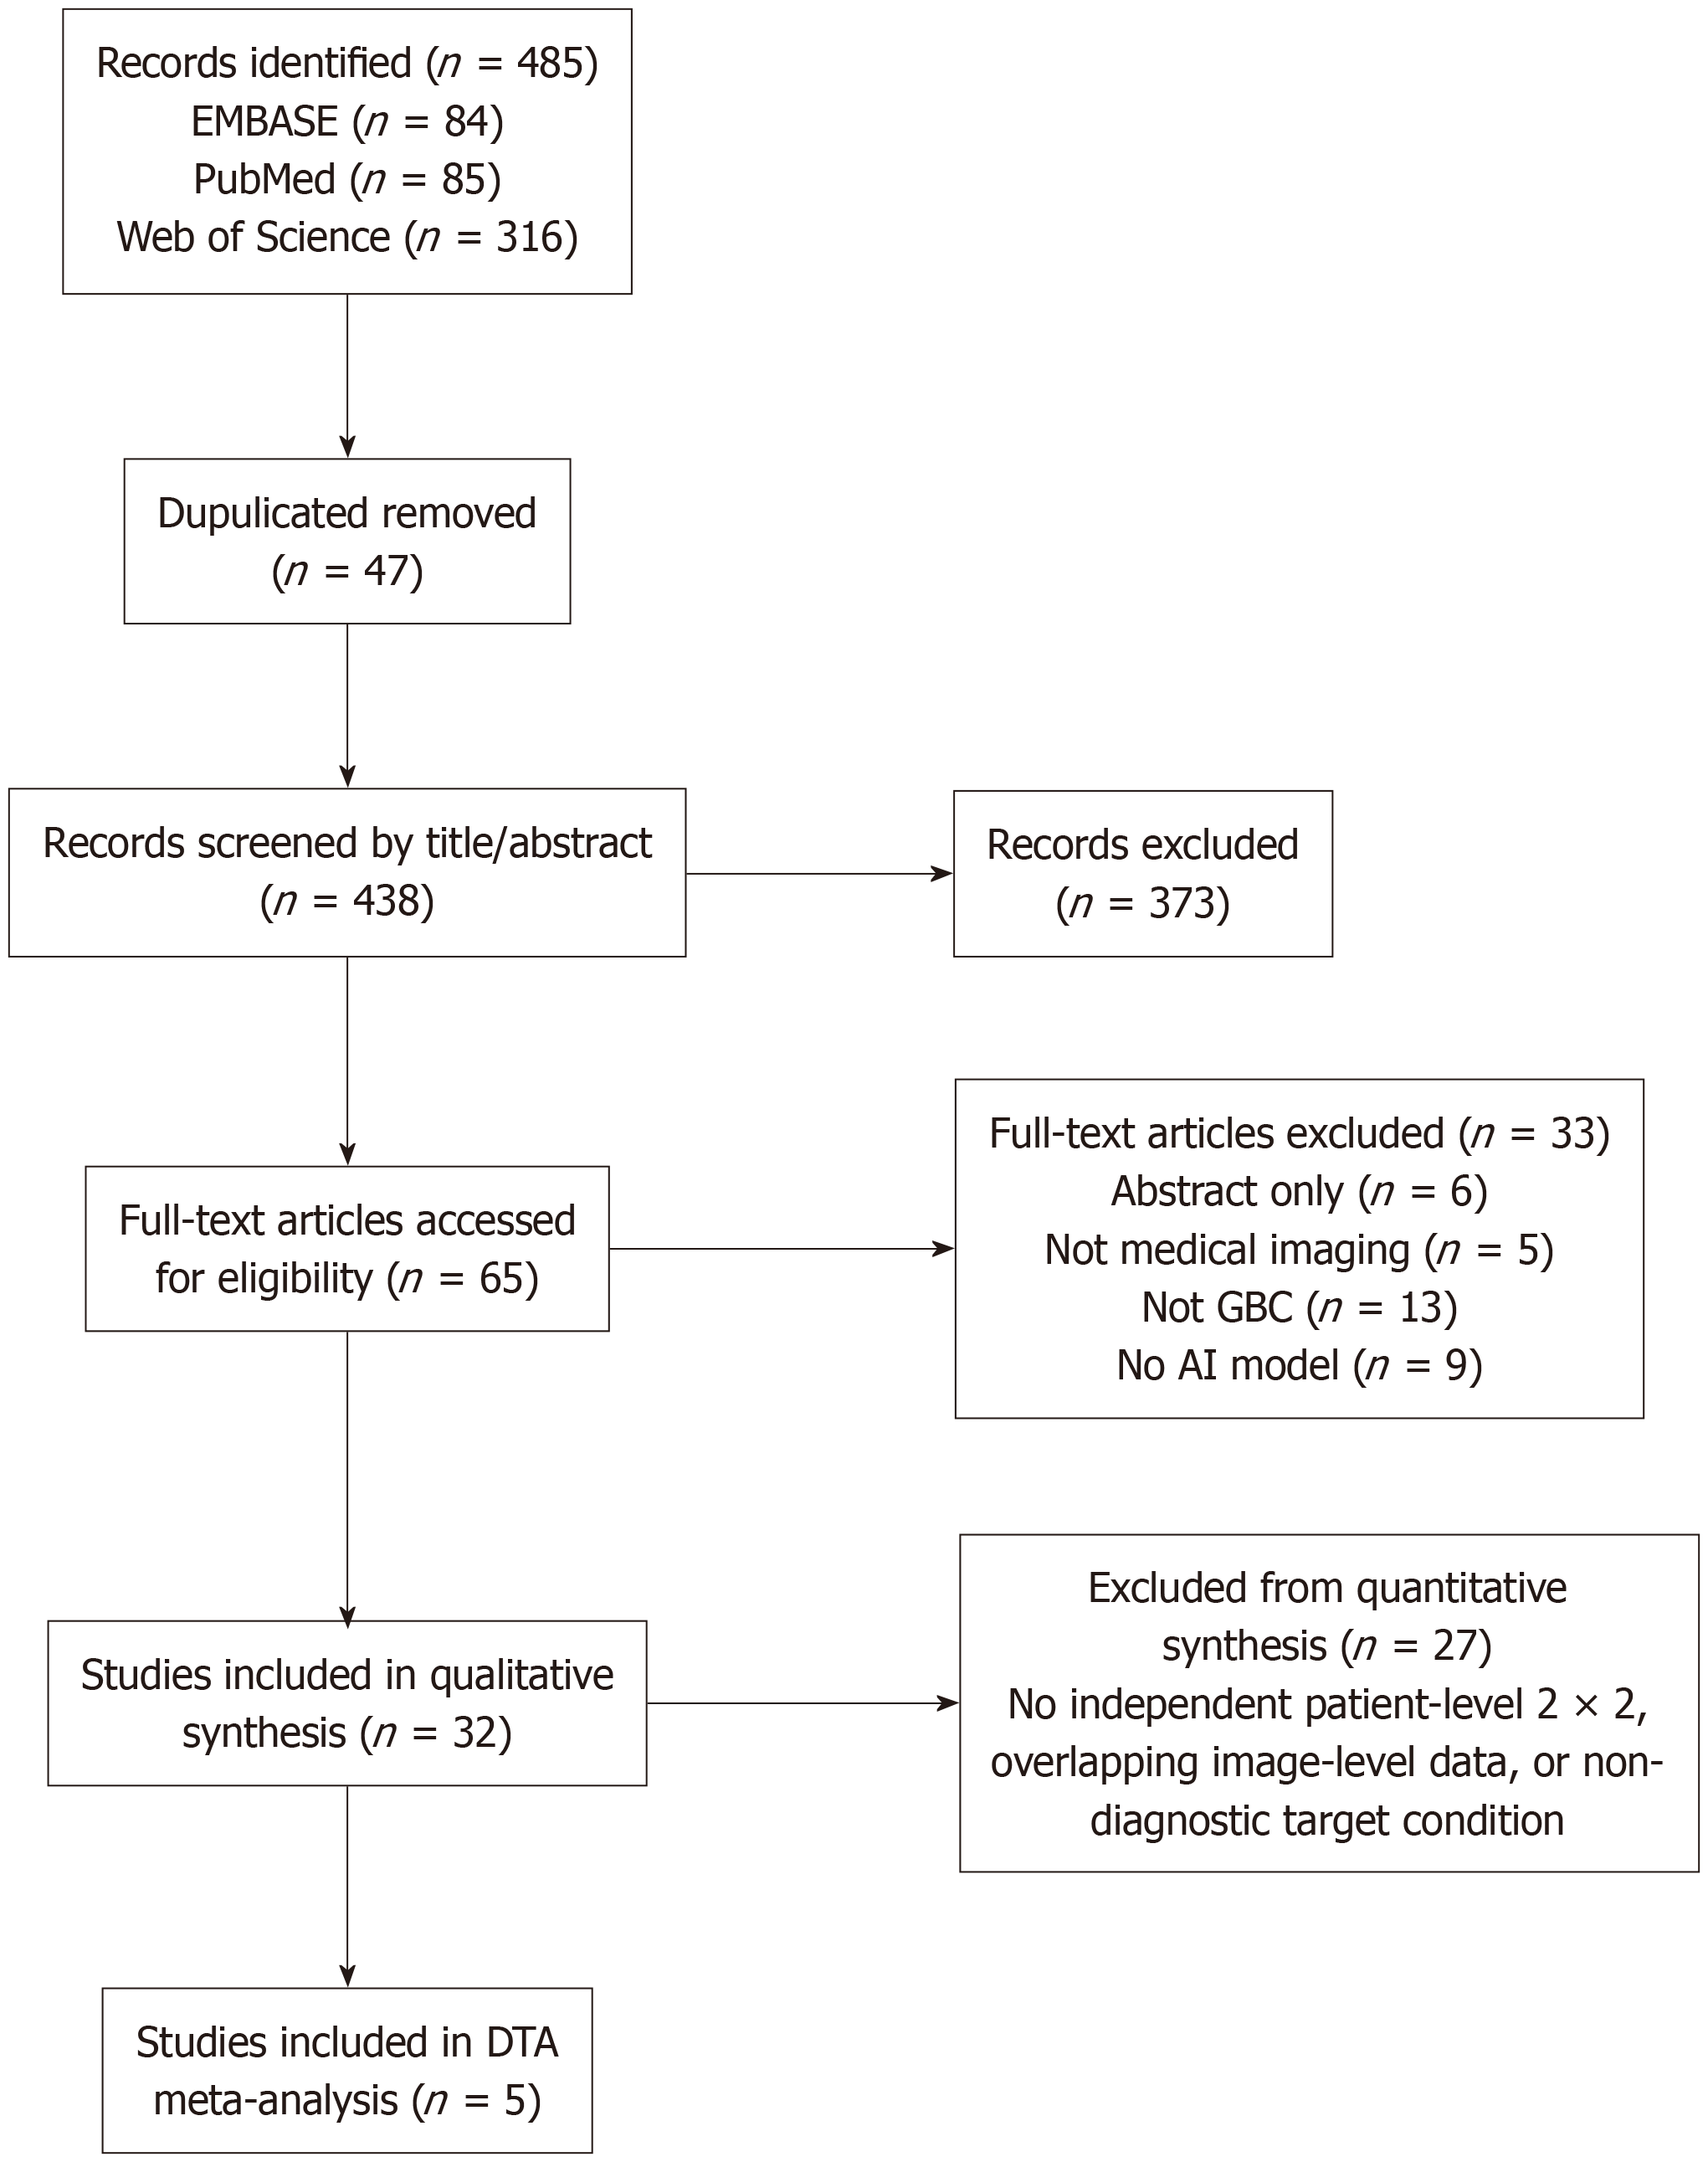
Figure 1 Study selection flow.
The diagram follows PRISMA 2020 flow-logic and distinguishes qualitative inclusion from quantitative diagnostic test accuracy eligibility. DTA: Diagnostic test accuracy; GBC: Gallbladder cancer; AI: Artificial intelligence.
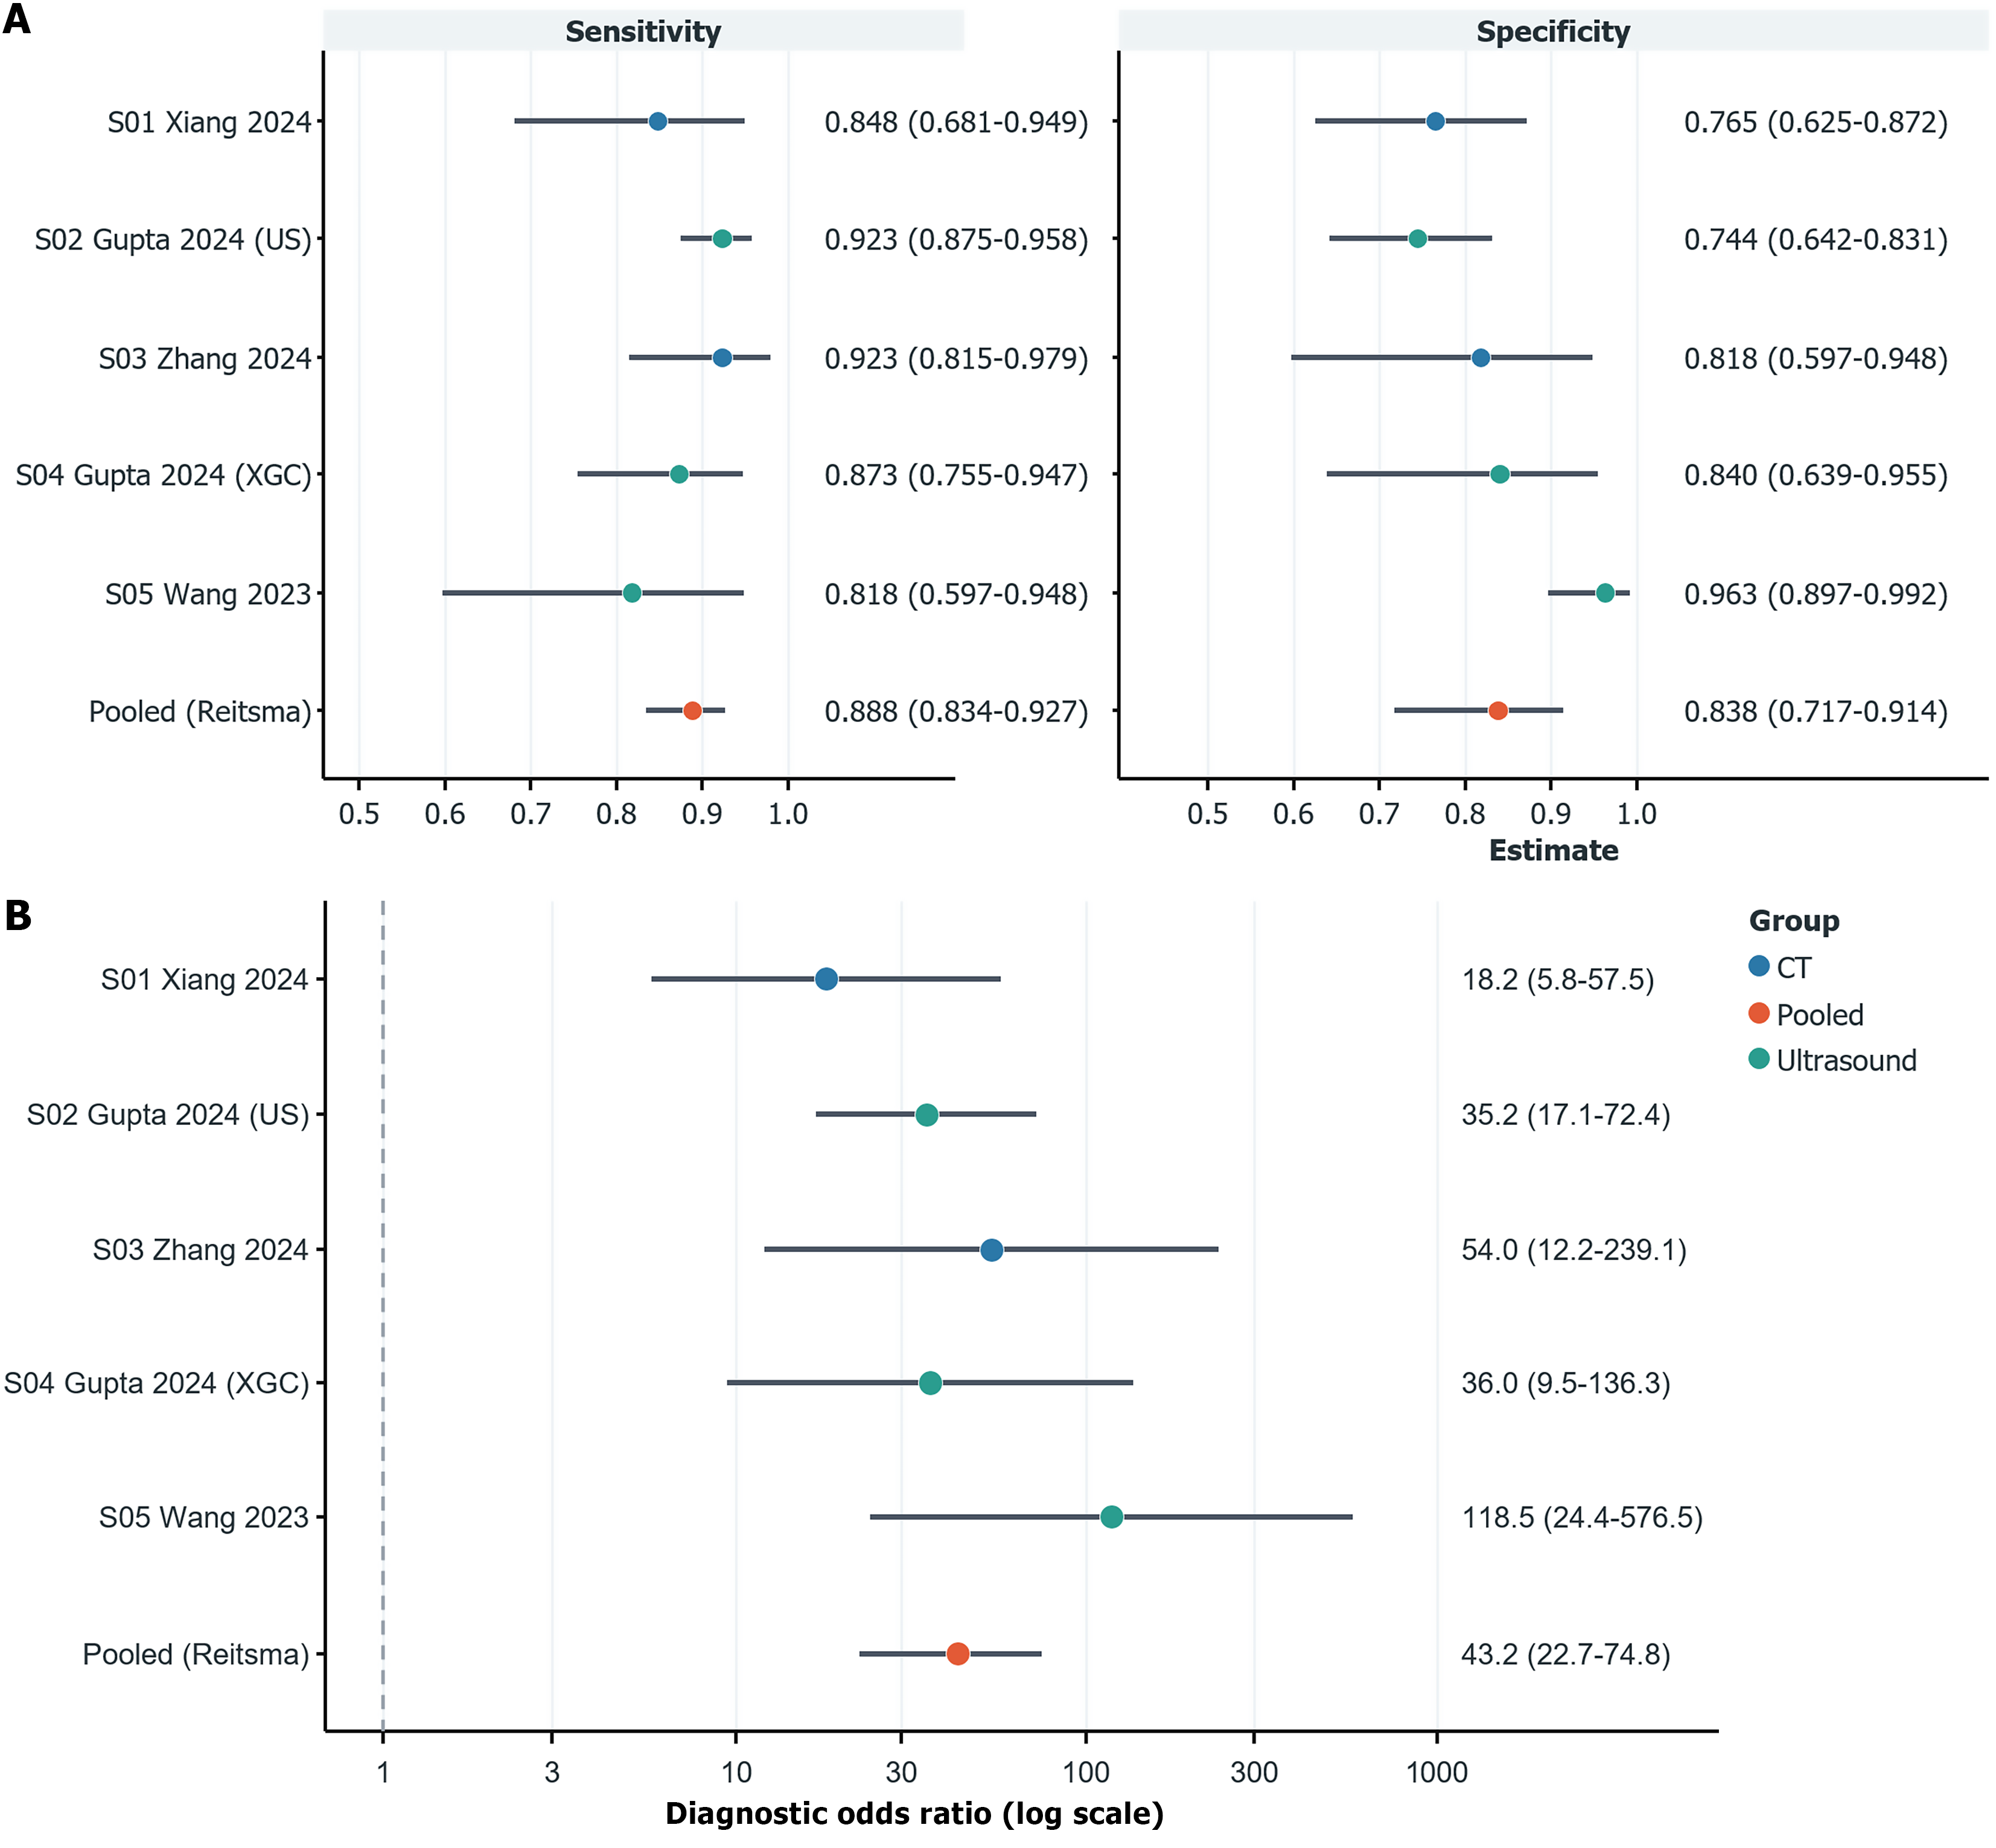
Figure 2 Forest plots of diagnostic test performance.
A: Forest plot of sensitivity and specificity. Individual-study intervals are exact binomial 95% confidence intervals. The pooled estimate was derived from the Reitsma bivariate random-effects model based on five datasets; B: Diagnostic odds ratio (DOR) forest plot. Estimates are shown on a logarithmic scale. The pooled DOR was derived from the bivariate summary-point simulation; the dashed reference line represents DOR = 1. US: Ultrasonography; CT: Computed tomography; XGC: Xanthogranulomatous cholecystitis.
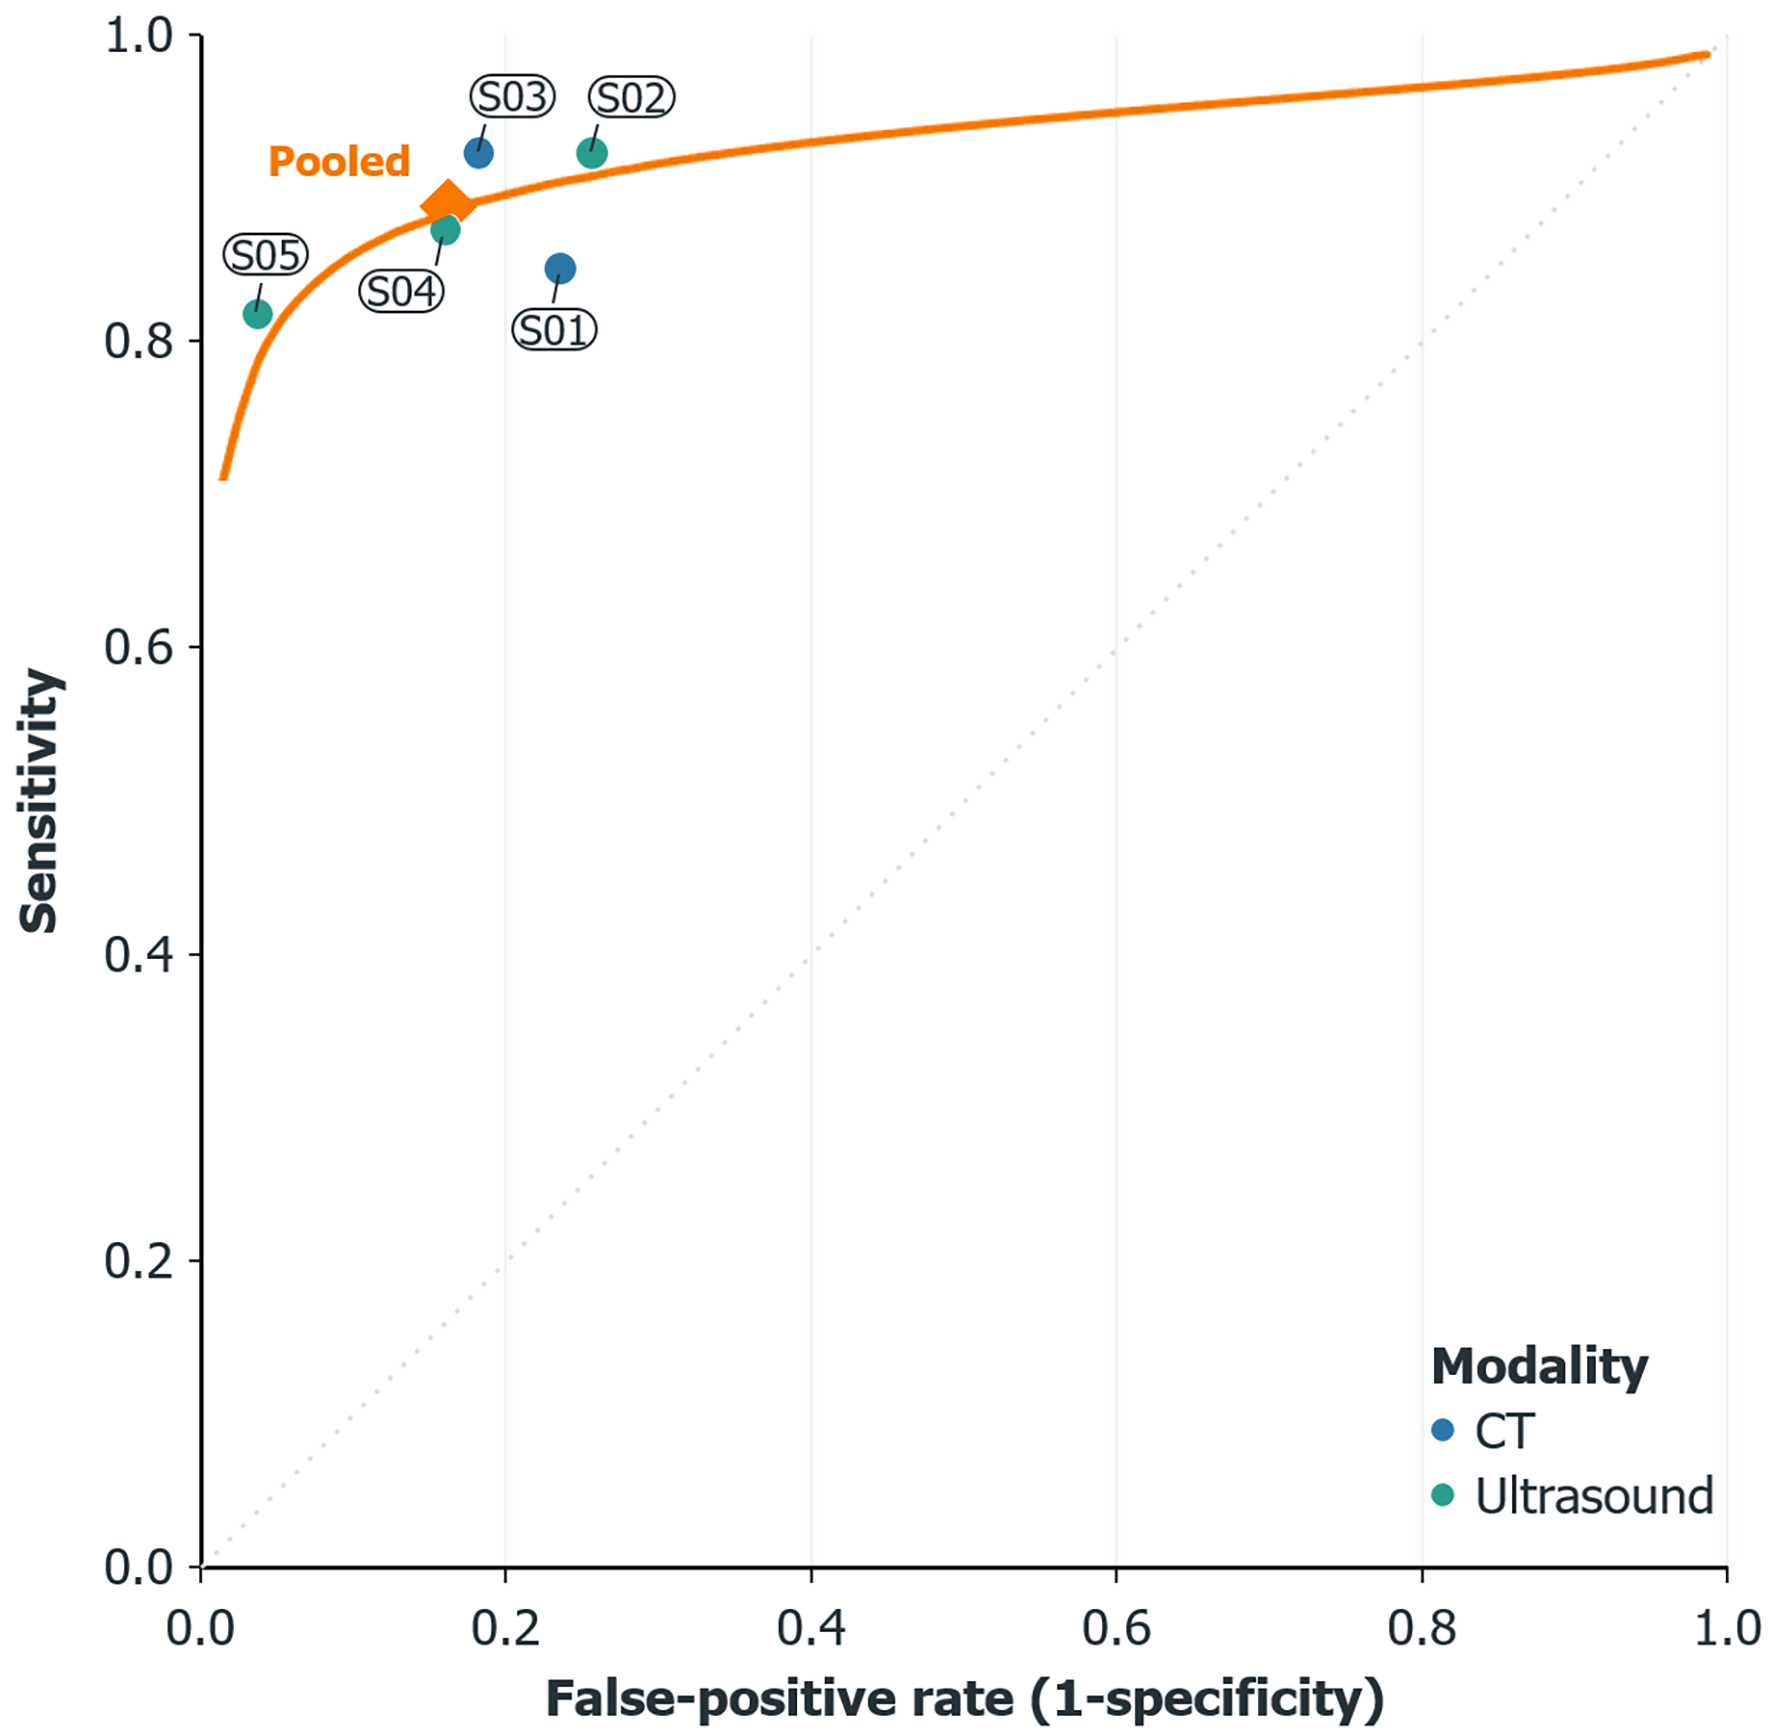
Figure 3 Summary receiver operating characteristic curve from the Reitsma bivariate model.
Model uncertainty is reported in the text rather than drawn as contours because k = 5. Study points are plotted in receiver operating characteristic space, and the summary point is shown as a red diamond. Confidence and prediction contours were omitted to avoid overinterpreting model-based uncertainty from five datasets. CT: Computed tomography.
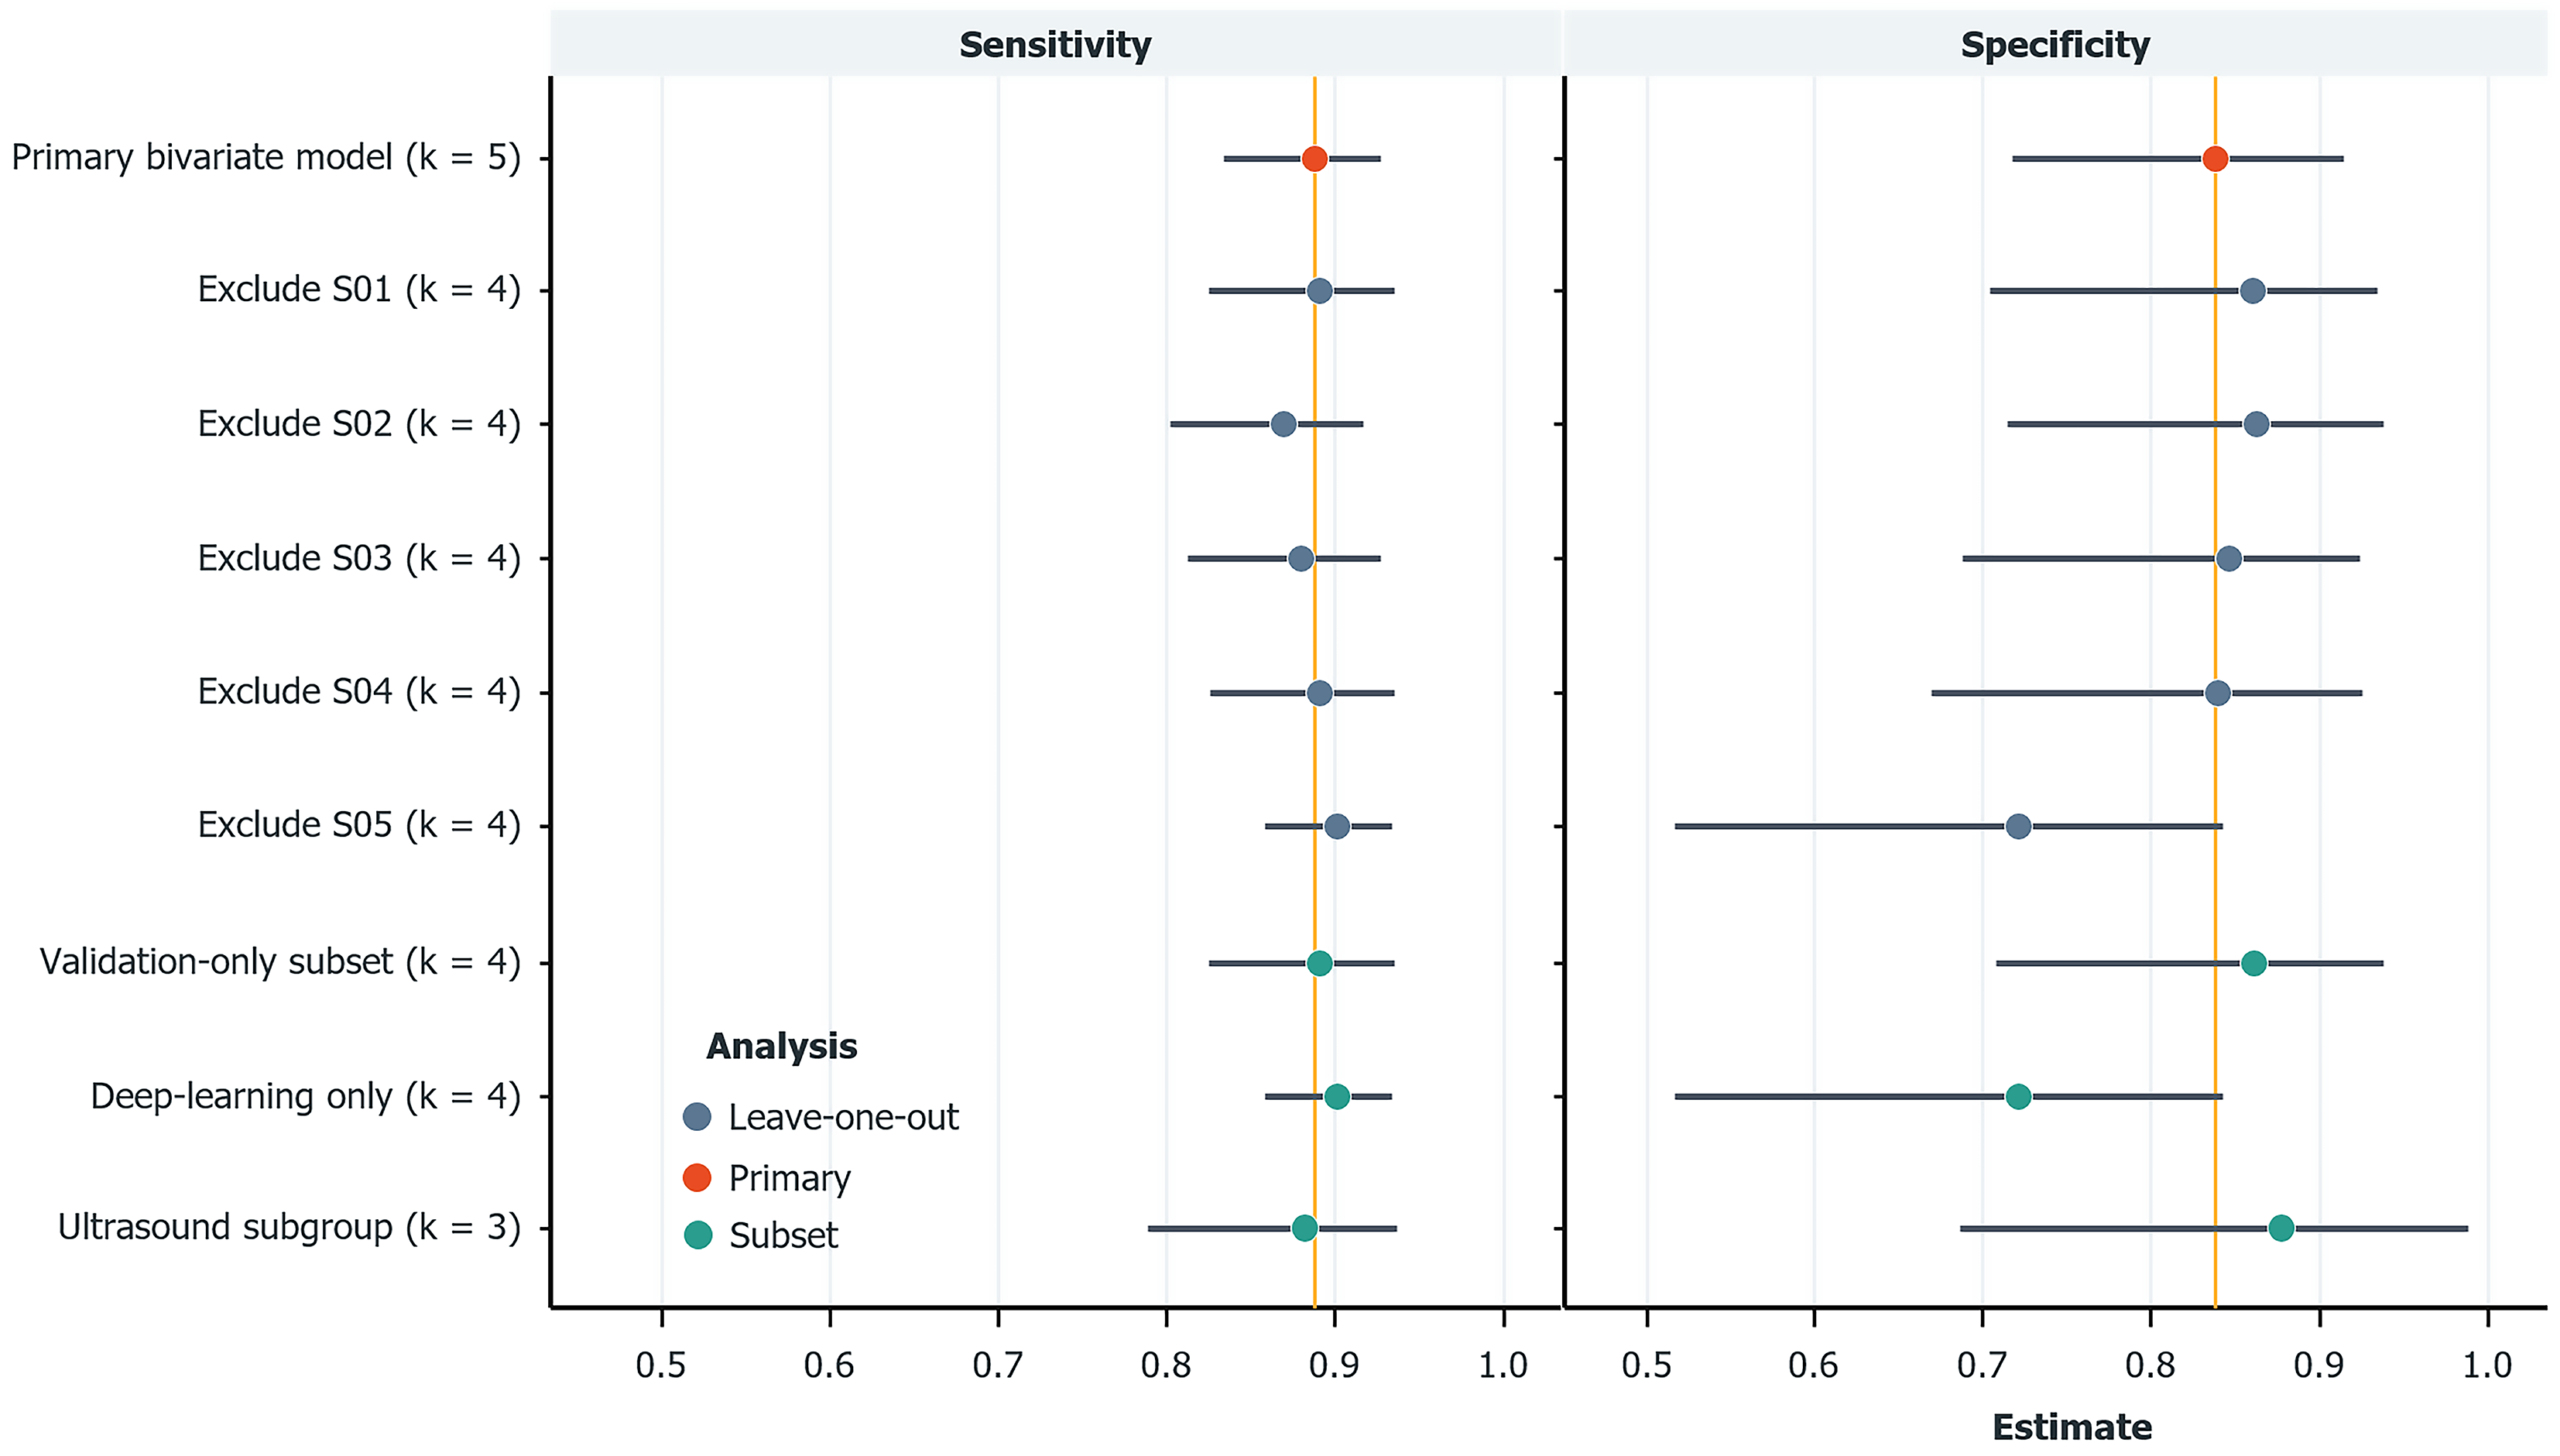
Figure 4 Robustness analyses.
Pooled sensitivity and specificity are shown after leave-one-out exclusions and selected dataset restrictions. Numbers indicate contributing datasets; vertical orange lines mark the primary pooled estimates.
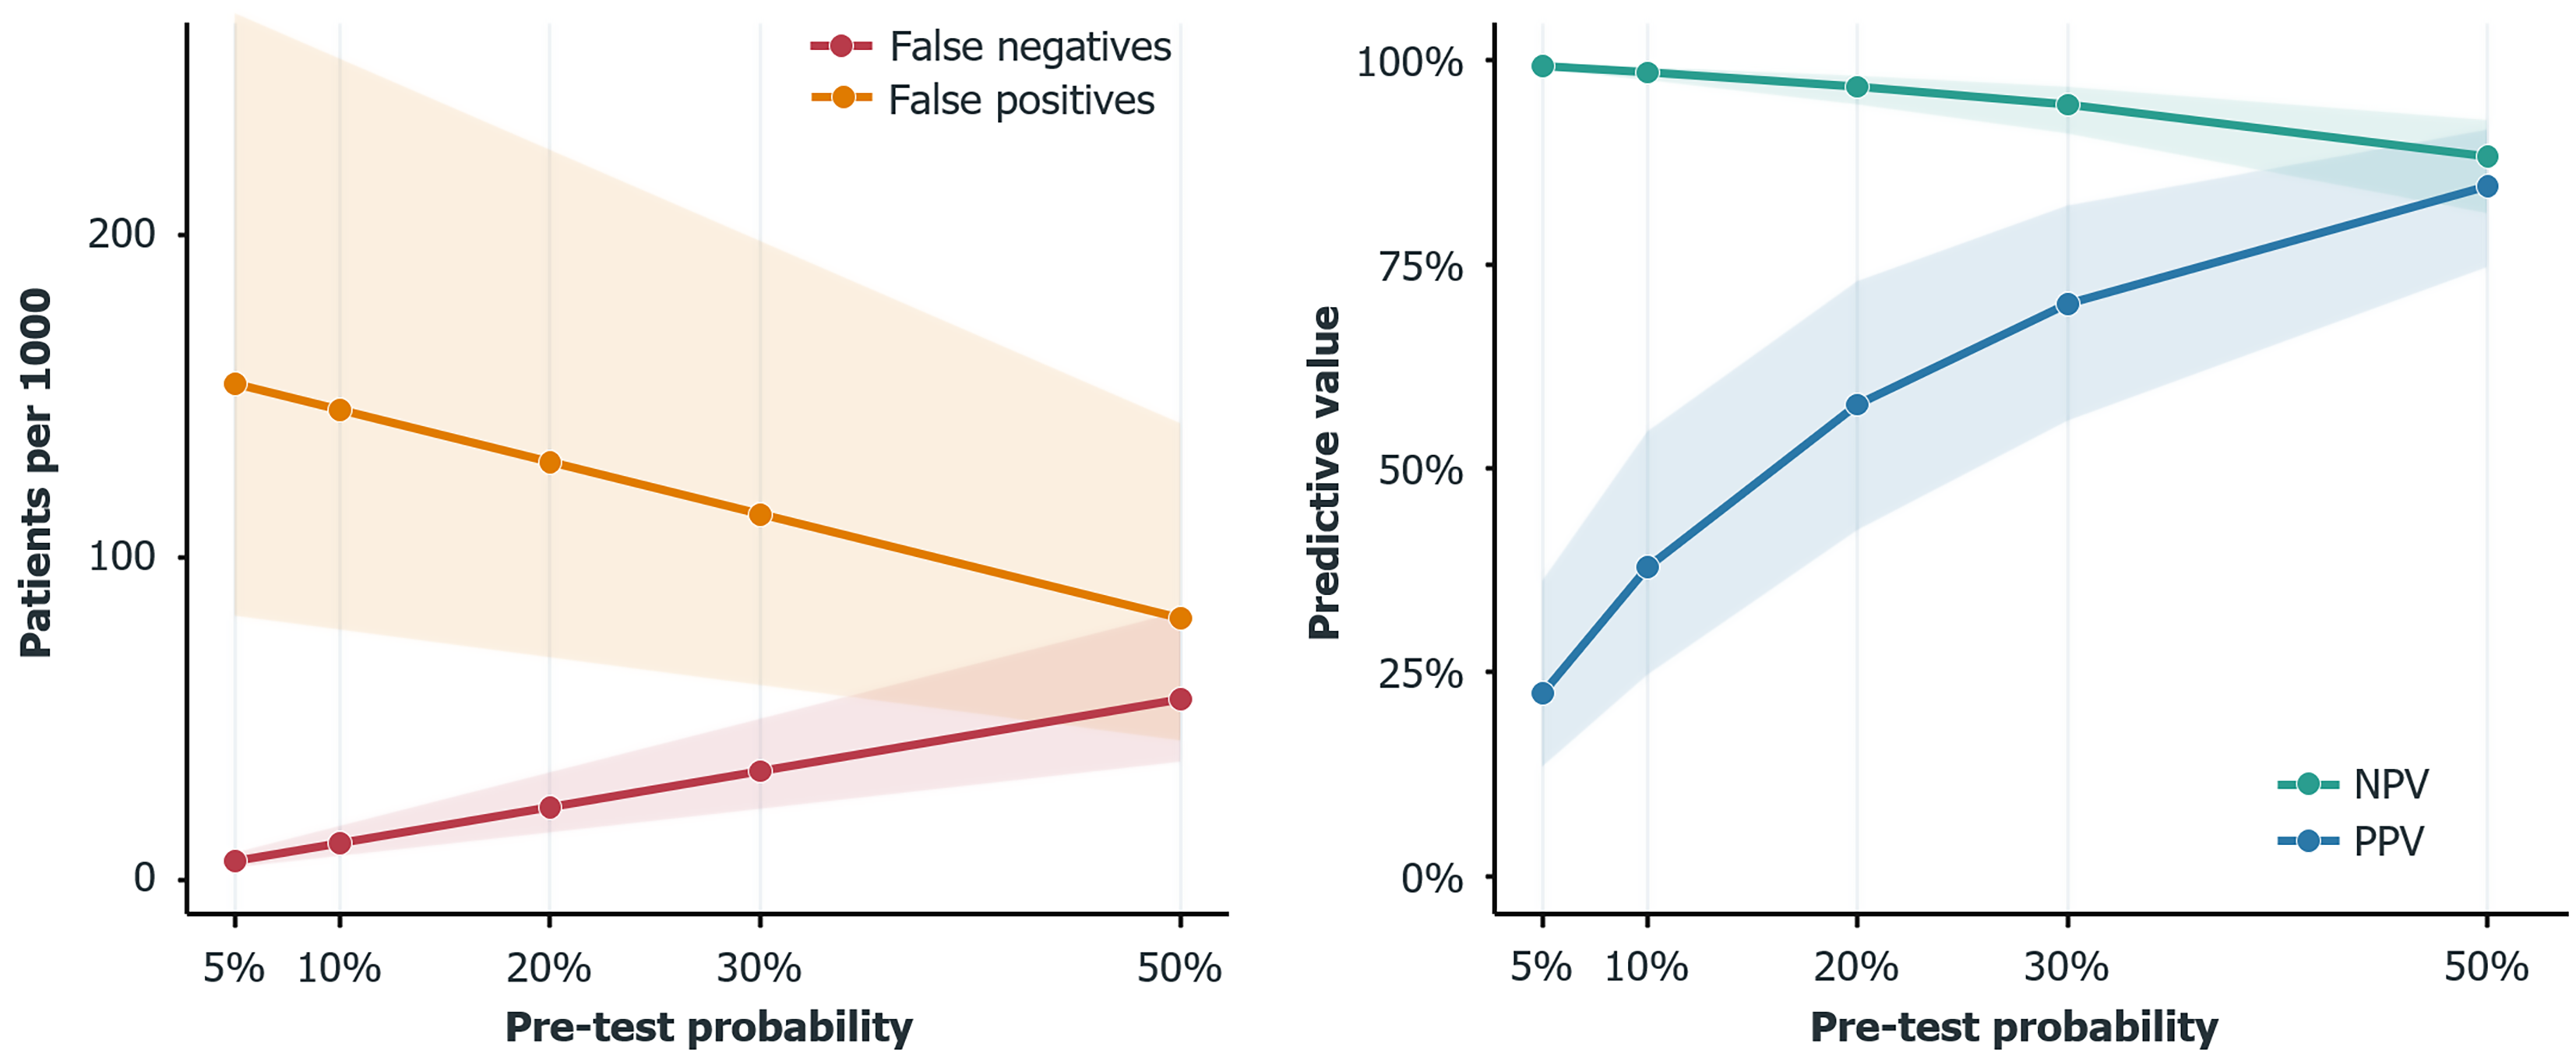
Figure 5 Clinical impact projection.
False negatives, false positives, positive predictive value, and negative predictive value per 1000 tested patients are shown across illustrative pre-test probabilities. Shaded ranges use marginal 95% confidence intervals; scenarios are illustrative and are not prevalence estimates.
- Citation: Zhu JY, Lin H, Zhao JW, Yang ZY. Artificial intelligence for imaging-based detection of gallbladder cancer: A systematic review and diagnostic test accuracy meta-analysis. World J Gastroenterol 2027; 33(1): 123989
- URL: https://www.wjgnet.com/1007-9327/full/v33/i1/123989.htm
- DOI: https://dx.doi.org/10.3748/wjg.123989