
















Copyright: ©Author(s) 2027.
World J Gastroenterol. Jan 7, 2027; 33(1): 123034
Published online Jan 7, 2027. doi: 10.3748/wjg.123034
Published online Jan 7, 2027. doi: 10.3748/wjg.123034
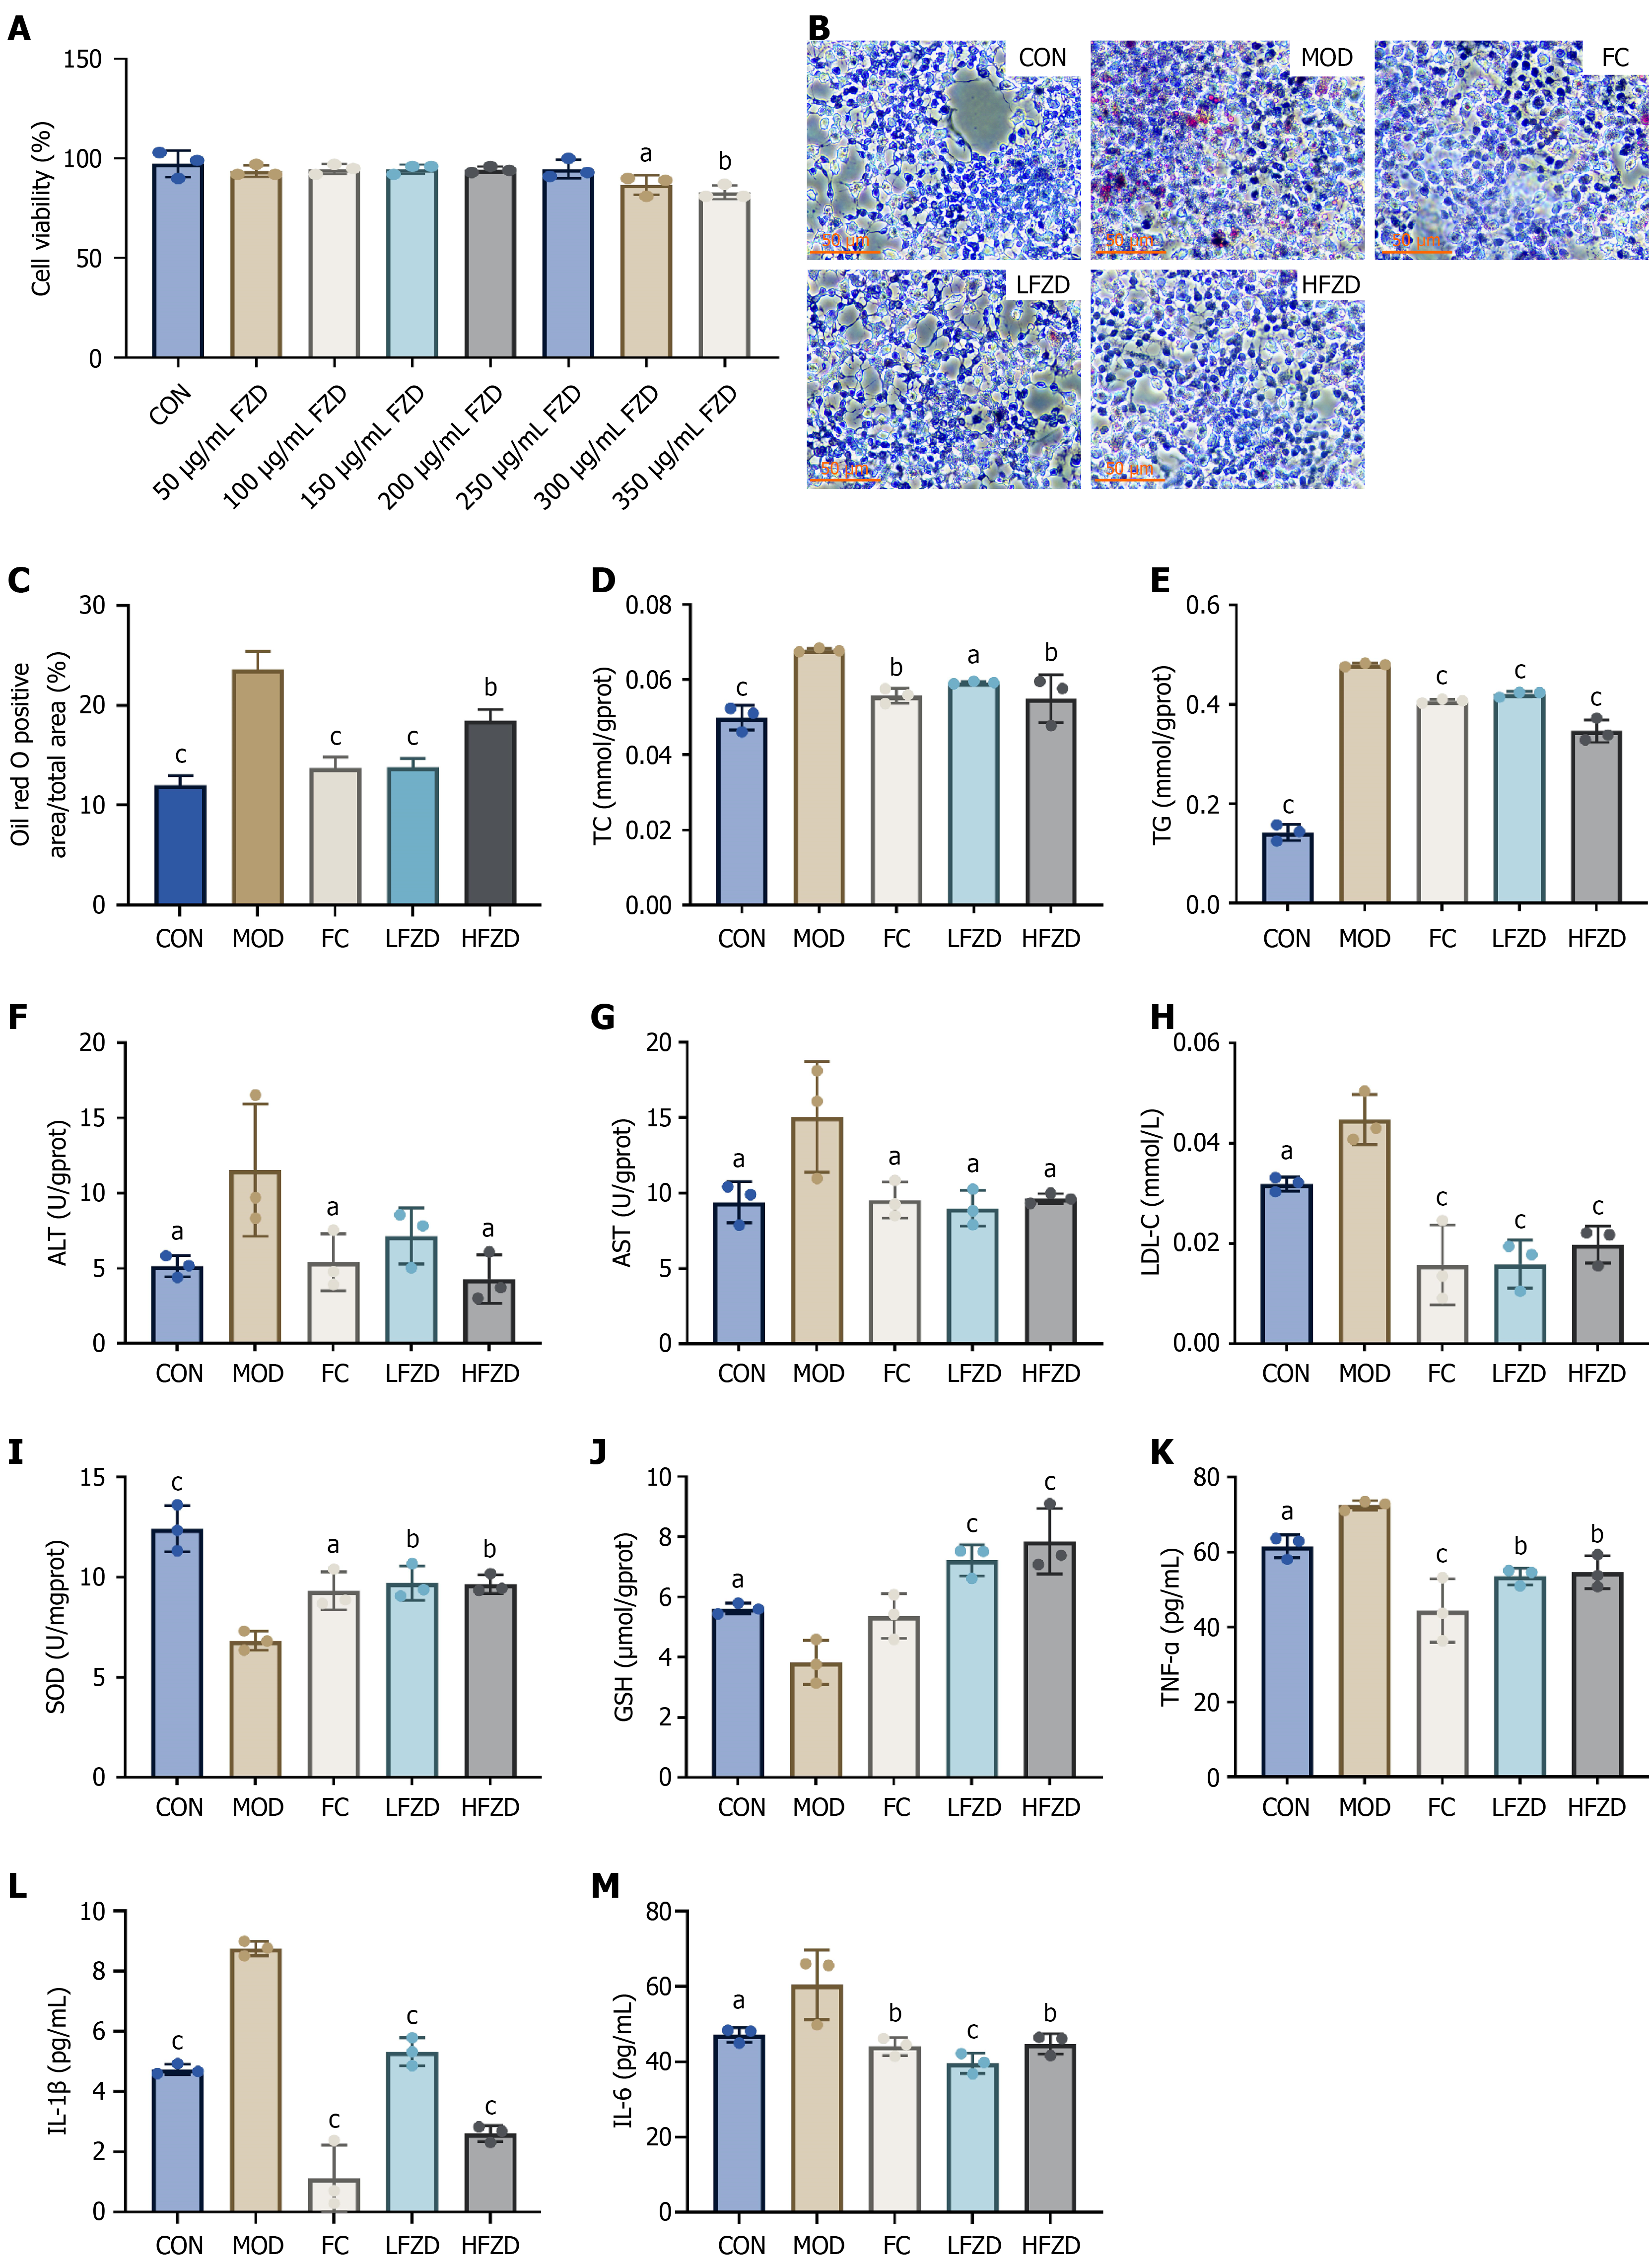
Figure 1 Effect of Fuling Zexie decoction on free fatty acid-induced HepG2 cells.
A: Viability of HepG2 cells at 50-350 μg/mL concentrations of Fuling Zexie decoction; B: Oil red O stained sections (scale bar = 50 μm); C: Analysis of relative lipid droplet content; D-M: Total cholesterol (D), triglyceride (E), alanine aminotransferase (F), aspartate aminotransferase (G), low-density lipoprotein cholesterol (H), superoxide dismutase (I), glutathione (J), tumor necrosis factor-α (K), interleukin (IL)-1β (L), IL-6 (M) levels in the free fatty acid-induced HepG2 cells. Data were obtained from 3 independent measurements. aP < 0.05. bP < 0.01. cP < 0.001. All P values vs the model group. CON: Control group; MOD: Model group; FC: Fenofibrate capsules group; FZD: Fuling Zexie decoction group; HFZD: High-dose Fuling Zexie decoction group; LFZD: Low-dose Fuling Zexie decoction group; TC: Total cholesterol; TG: Triglyceride; ALT: Alanine aminotransferase; AST: Aspartate aminotransferase; LDL-C: Low-density lipoprotein cholesterol; SOD: Superoxide dismutase; GSH: Glutathione; TNF: Tumor necrosis factor; IL: Interleukin.
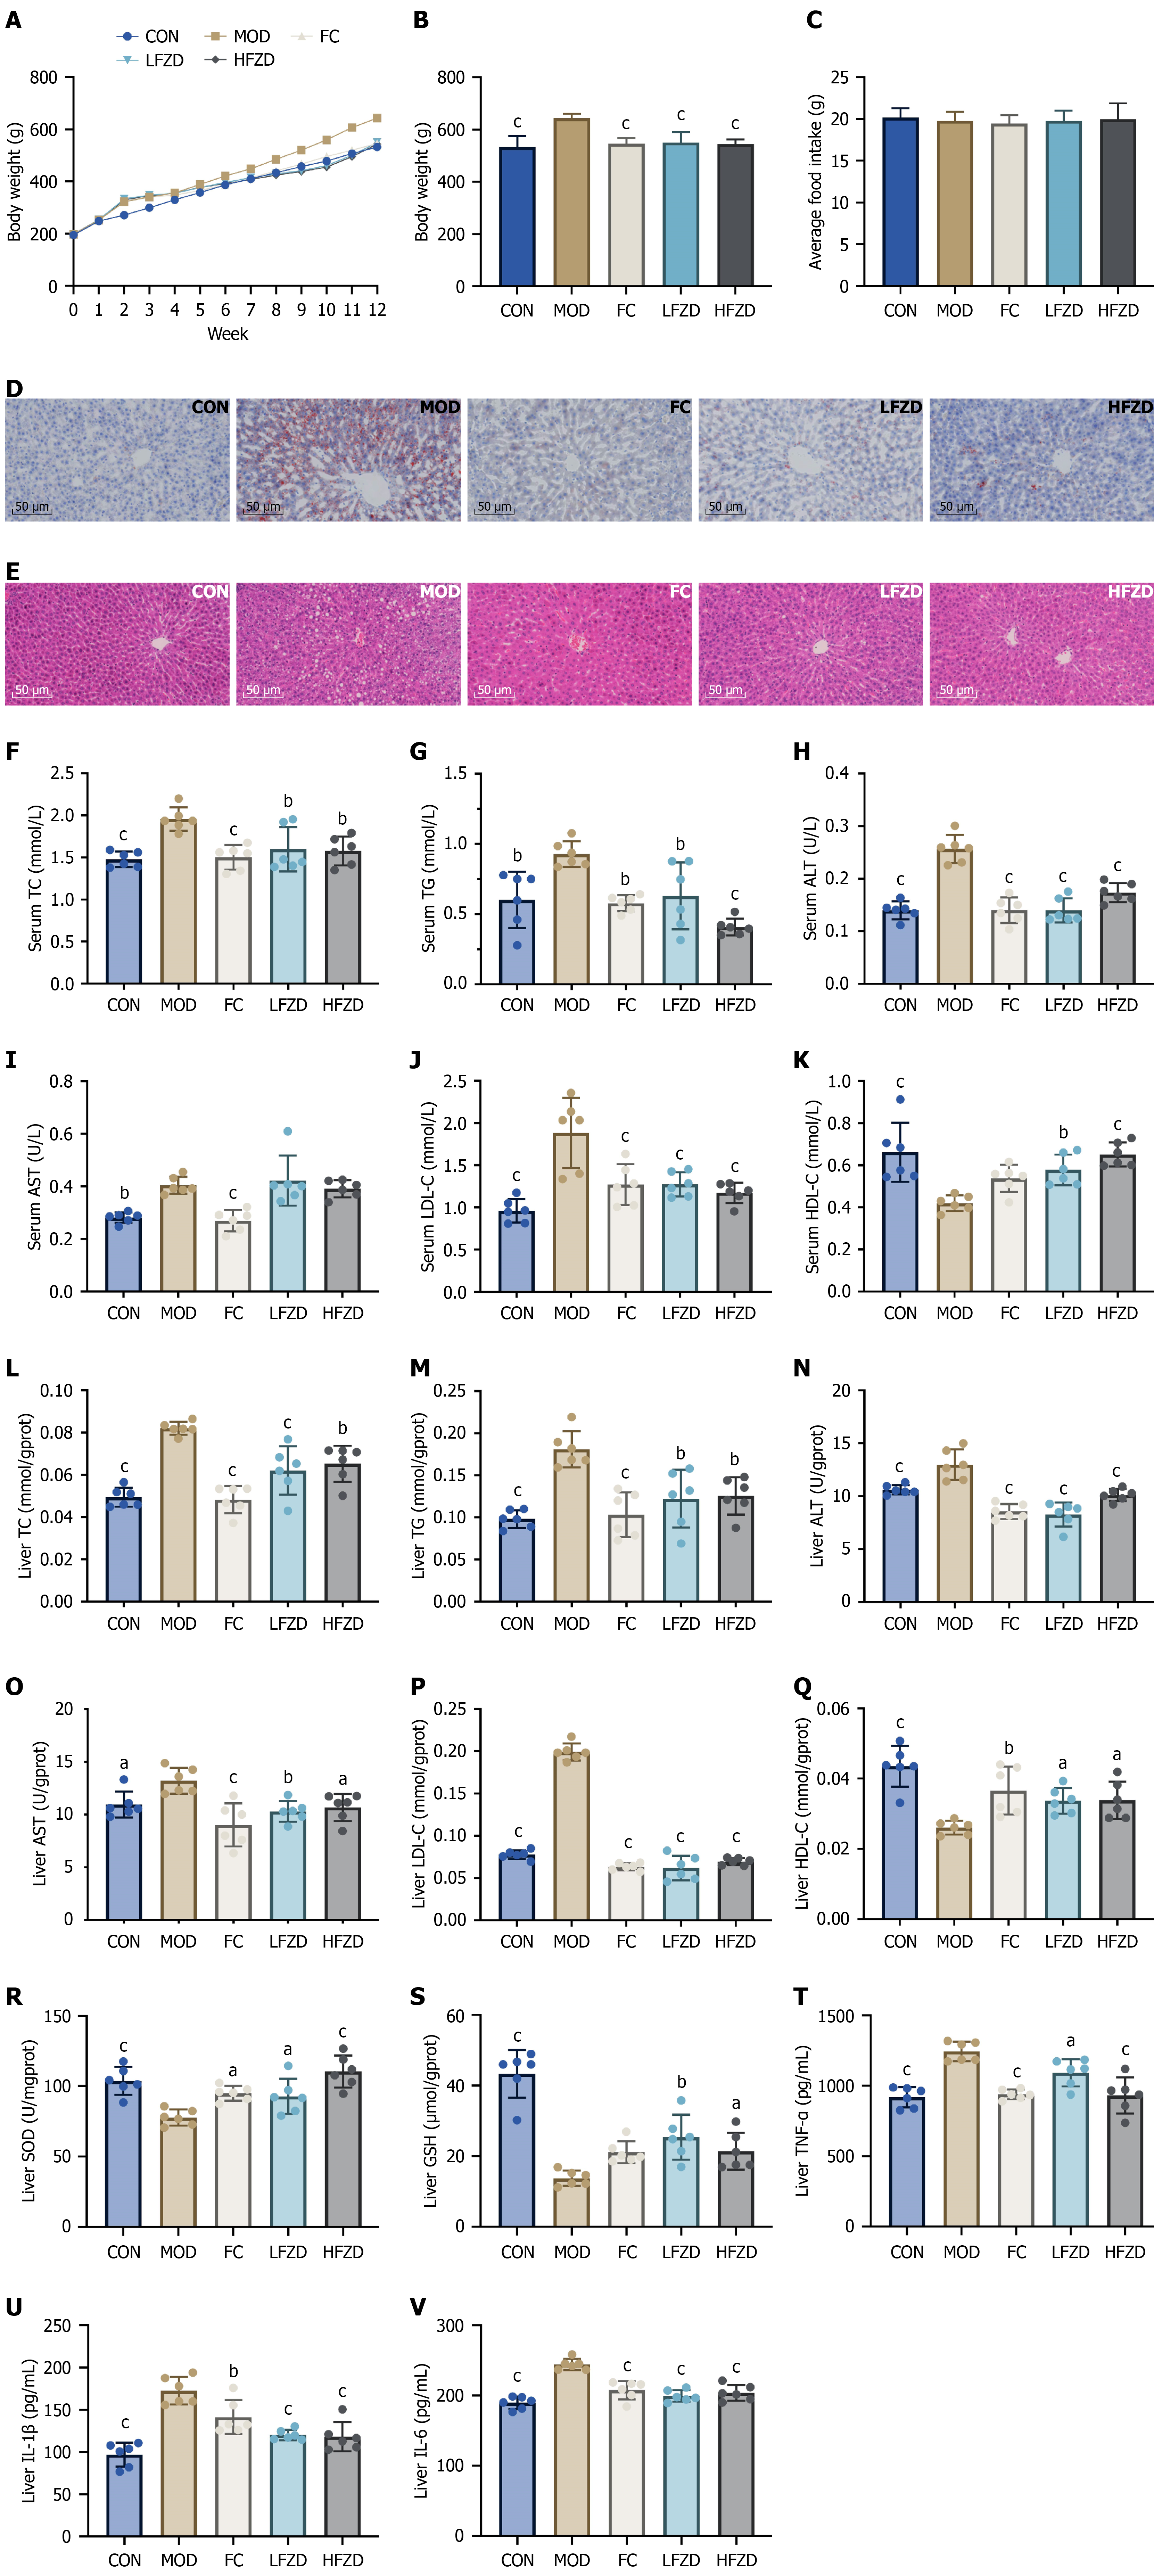
Figure 2 Effect of Fuling Zexie decoction on high-fat diet-induced metabolic dysfunction-associated steatotic liver disease in rats.
A: Body weight; B: Body weight in last week; C: Average daily food intake; D: Oil red O stained sections (scale bar = 50 μm); E: Hematoxylin and eosin stained sections (scale bar = 50 μm); F-K: Total cholesterol (F), triglyceride (G), alanine aminotransferase (H), aspartate aminotransferase (I), low-density lipoprotein cholesterol (J), High-density lipoprotein cholesterol (K) levels in the serum; L-V: Total cholesterol (L), triglyceride (M), alanine aminotransferase (N), aspartate aminotransferase (O), low-density lipoprotein cholesterol (P), High-density lipoprotein cholesterol (Q), superoxide dismutase (R), glutathione (S), tumor necrosis factor-α (T), interleukin (IL)-1β (U), IL-6 (V) levels in the liver, n = 6 in each group, and the results are expressed as mean ± SD. aP < 0.05. bP < 0.01. cP < 0.001. All P values vs the model group. CON: Control group; MOD: Model group; FC: Fenofibrate capsules group; HFZD: High-dose Fuling Zexie decoction group; LFZD: Low-dose Fuling Zexie decoction group; TC: Total cholesterol; TG: Triglyceride; ALT: Alanine aminotransferase; AST: Aspartate aminotransferase; LDL-C: Low-density lipoprotein cholesterol; HDL-C: High-density lipoprotein cholesterol; SOD: Superoxide dismutase; GSH: Glutathione; TNF: Tumor necrosis factor; IL: Interleukin.

Figure 3 Metabolome profiling of Fuling Zexie decoction in the serum, liver, and urine in rats with metabolic dysfunction-associated steatotic liver disease.
A: Principal component analysis score plots; B-D: Orthogonal least partial squares discriminant analysis plot and permutation test plot of serum (B), liver (C), and urine (D); E: Volcano plot of differential metabolite expression; F: Bubble plot of metabolic pathway enrichment analysis. CON: Control group; MOD: Model group; FC: Fenofibrate capsules group; FZD: Fuling Zexie decoction group; QC: Quality control group; ESI+: Positive ion mode; ESI-: Negative ion mode; PC: Principal component; VIP: Variable importance in projection; FC: Fold change; KEGG: Kyoto Encyclopedia of Genes and Genomes; ESI: Electrospray ionization.
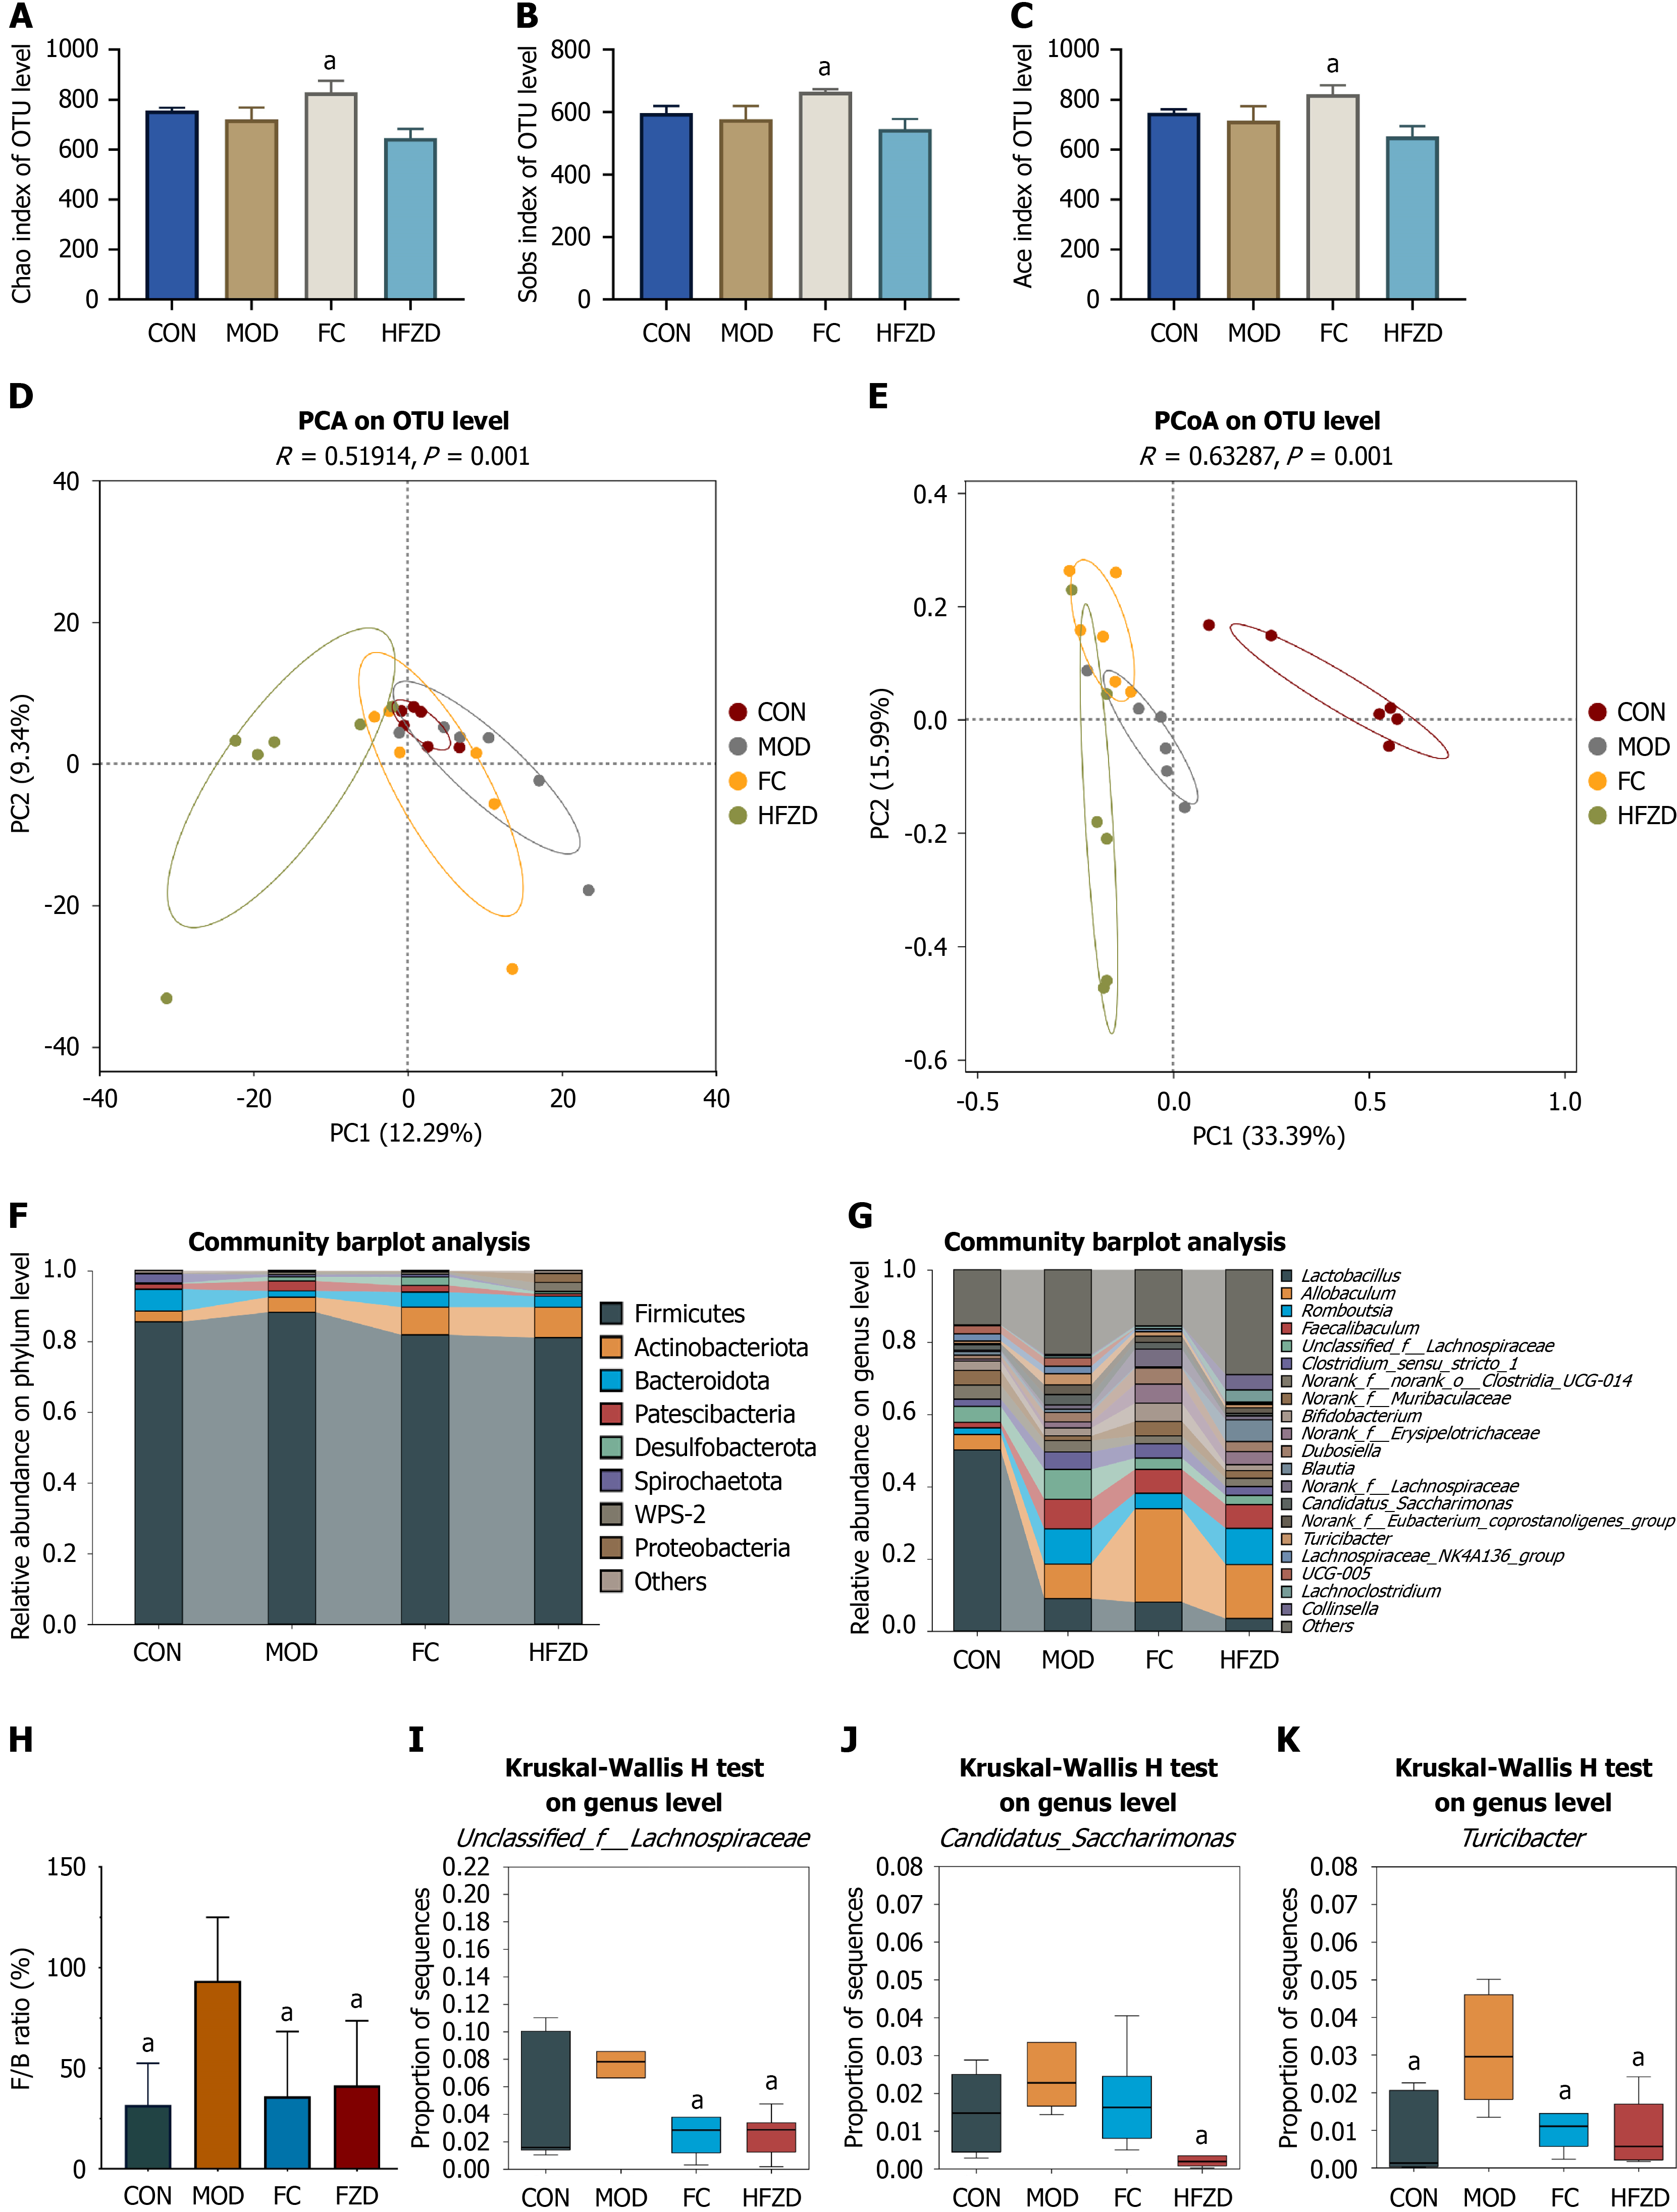
Figure 4 Effect of Fuling Zexie decoction on gut microbiota in rats with metabolic dysfunction-associated steatotic liver disease.
A: Chao1 index; B: Observed species index; C: Abundance-based coverage estimator index; D: Principal component analysis; E: Principal coordinate analysis; F: Species composition at the phylum level of intestinal flora in rats; G: Species composition at the genus level of intestinal flora in rats; H: Firmicutes/Bacteroidota ratio; I: Relative abundance of Unclassified_f_Lachnospiraceae; J: Relative abundance of Candidatus Saccharimonas; K: Relative abundance of Turicibacter. aP < 0.05. All P values vs the model group. CON: Control group; MOD: Model group; FC: Fenofibrate capsules group; HFZD: High-dose Fuling Zexie decoction group; OTU: Operational taxonomic unit; PCA: Principal component analysis; PCoA: Principal coordinate analysis; PC: Principal component; F/B: Firmicutes/Bacteroidota.
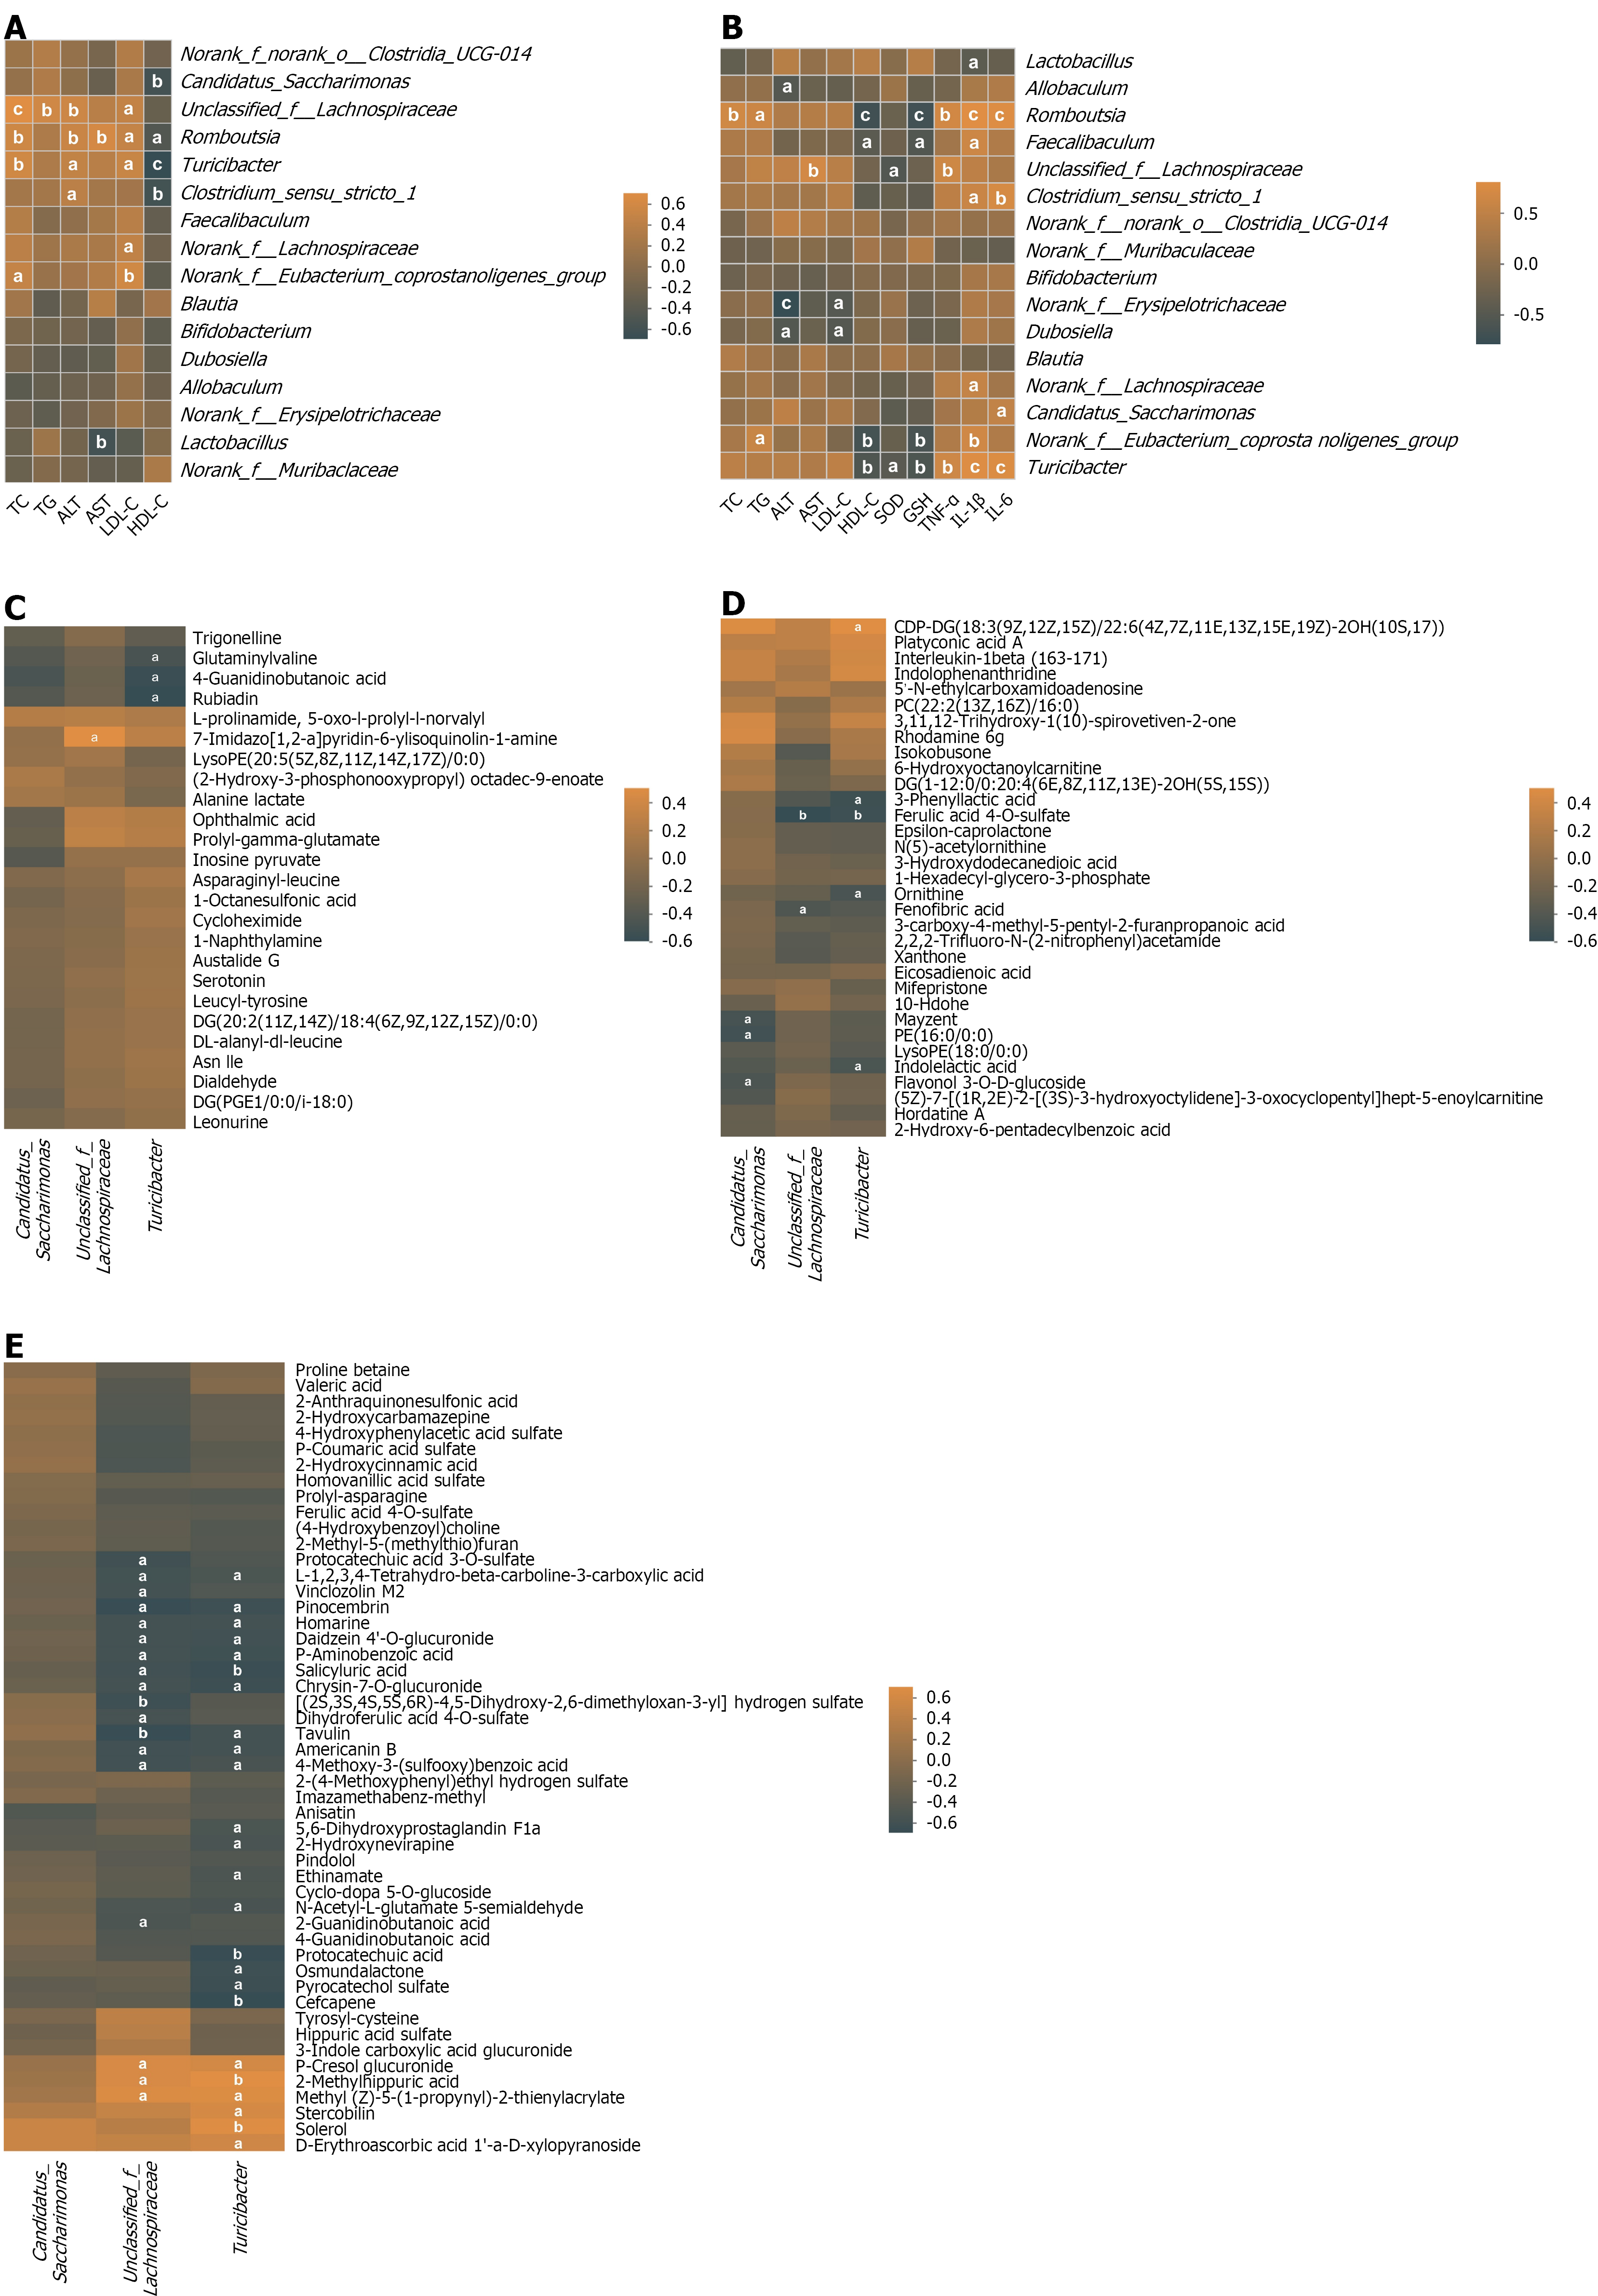
Figure 5 Spearman’s correlation analysis among gut microbiota, pathological indicators, and differential metabolites regulated by Fuling Zexie decoction.
Spearman’s correlation heatmap between gut microbiota at the genus level and serum pathological indicators (A), liver pathological indicators (B), serum differential metabolites (C), liver differential metabolites (D), and urine differential metabolites (E). aP < 0.05. bP < 0.01. cP < 0.001. TC: Total cholesterol; TG: Triglyceride; ALT: Alanine aminotransferase; AST: Aspartate aminotransferase; LDL-C: Low-density lipoprotein cholesterol; HDL-C: High-density lipoprotein cholesterol; SOD: Superoxide dismutase; GSH: Glutathione; TNF: Tumor necrosis factor; IL: Interleukin.
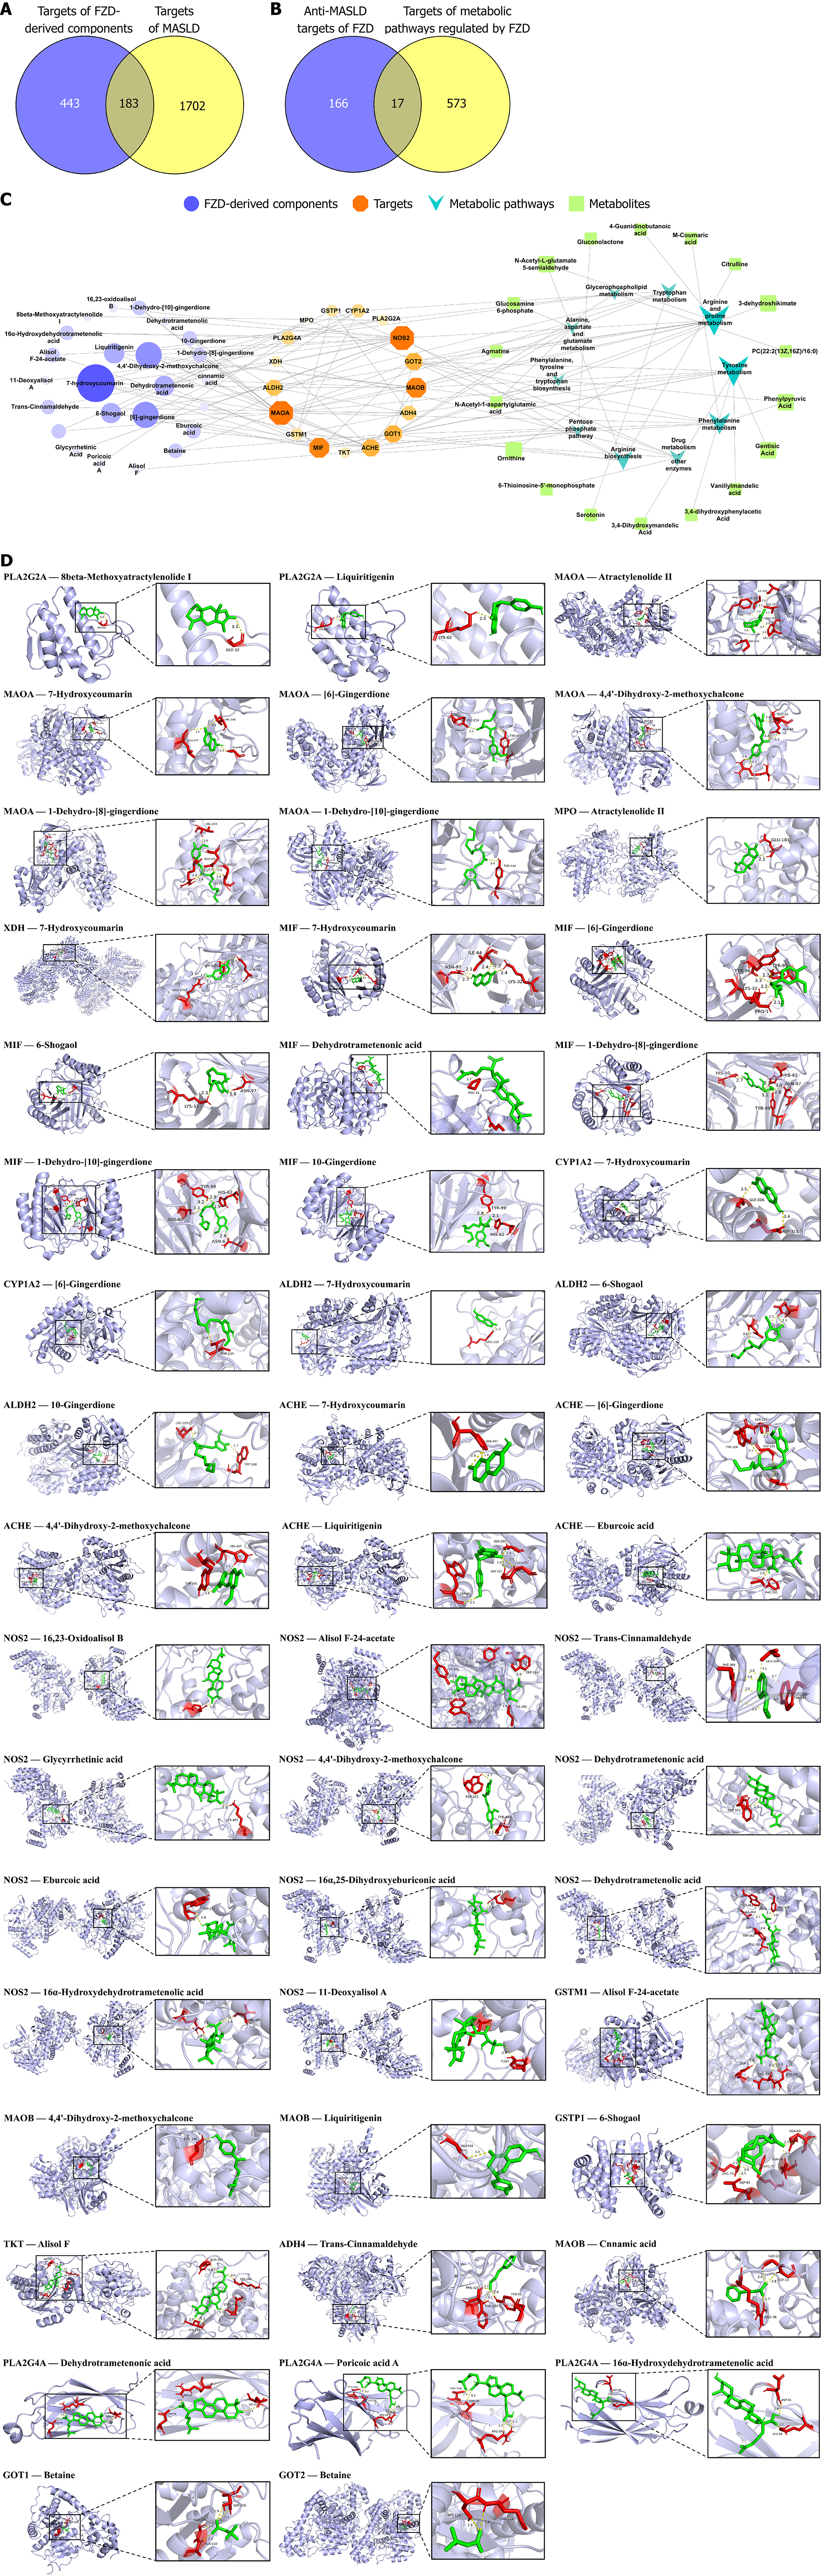
Figure 6 Integrated analysis of Fuling Zexie decoction-derived compounds and metabolomics.
A: Venn diagram of Fuling Zexie decoction (FZD)-derived compound targets and metabolic dysfunction-associated steatotic liver disease (MASLD) targets; B: Venn diagram of anti-MASLD targets of FZD-derived compounds and FZD-regulated metabolic pathway targets; C: The “active compound-target-pathway-metabolite” network; D: Molecular docking between key components and core targets. FZD: Fuling Zexie decoction group; MASLD: Metabolic dysfunction-associated steatotic liver disease.
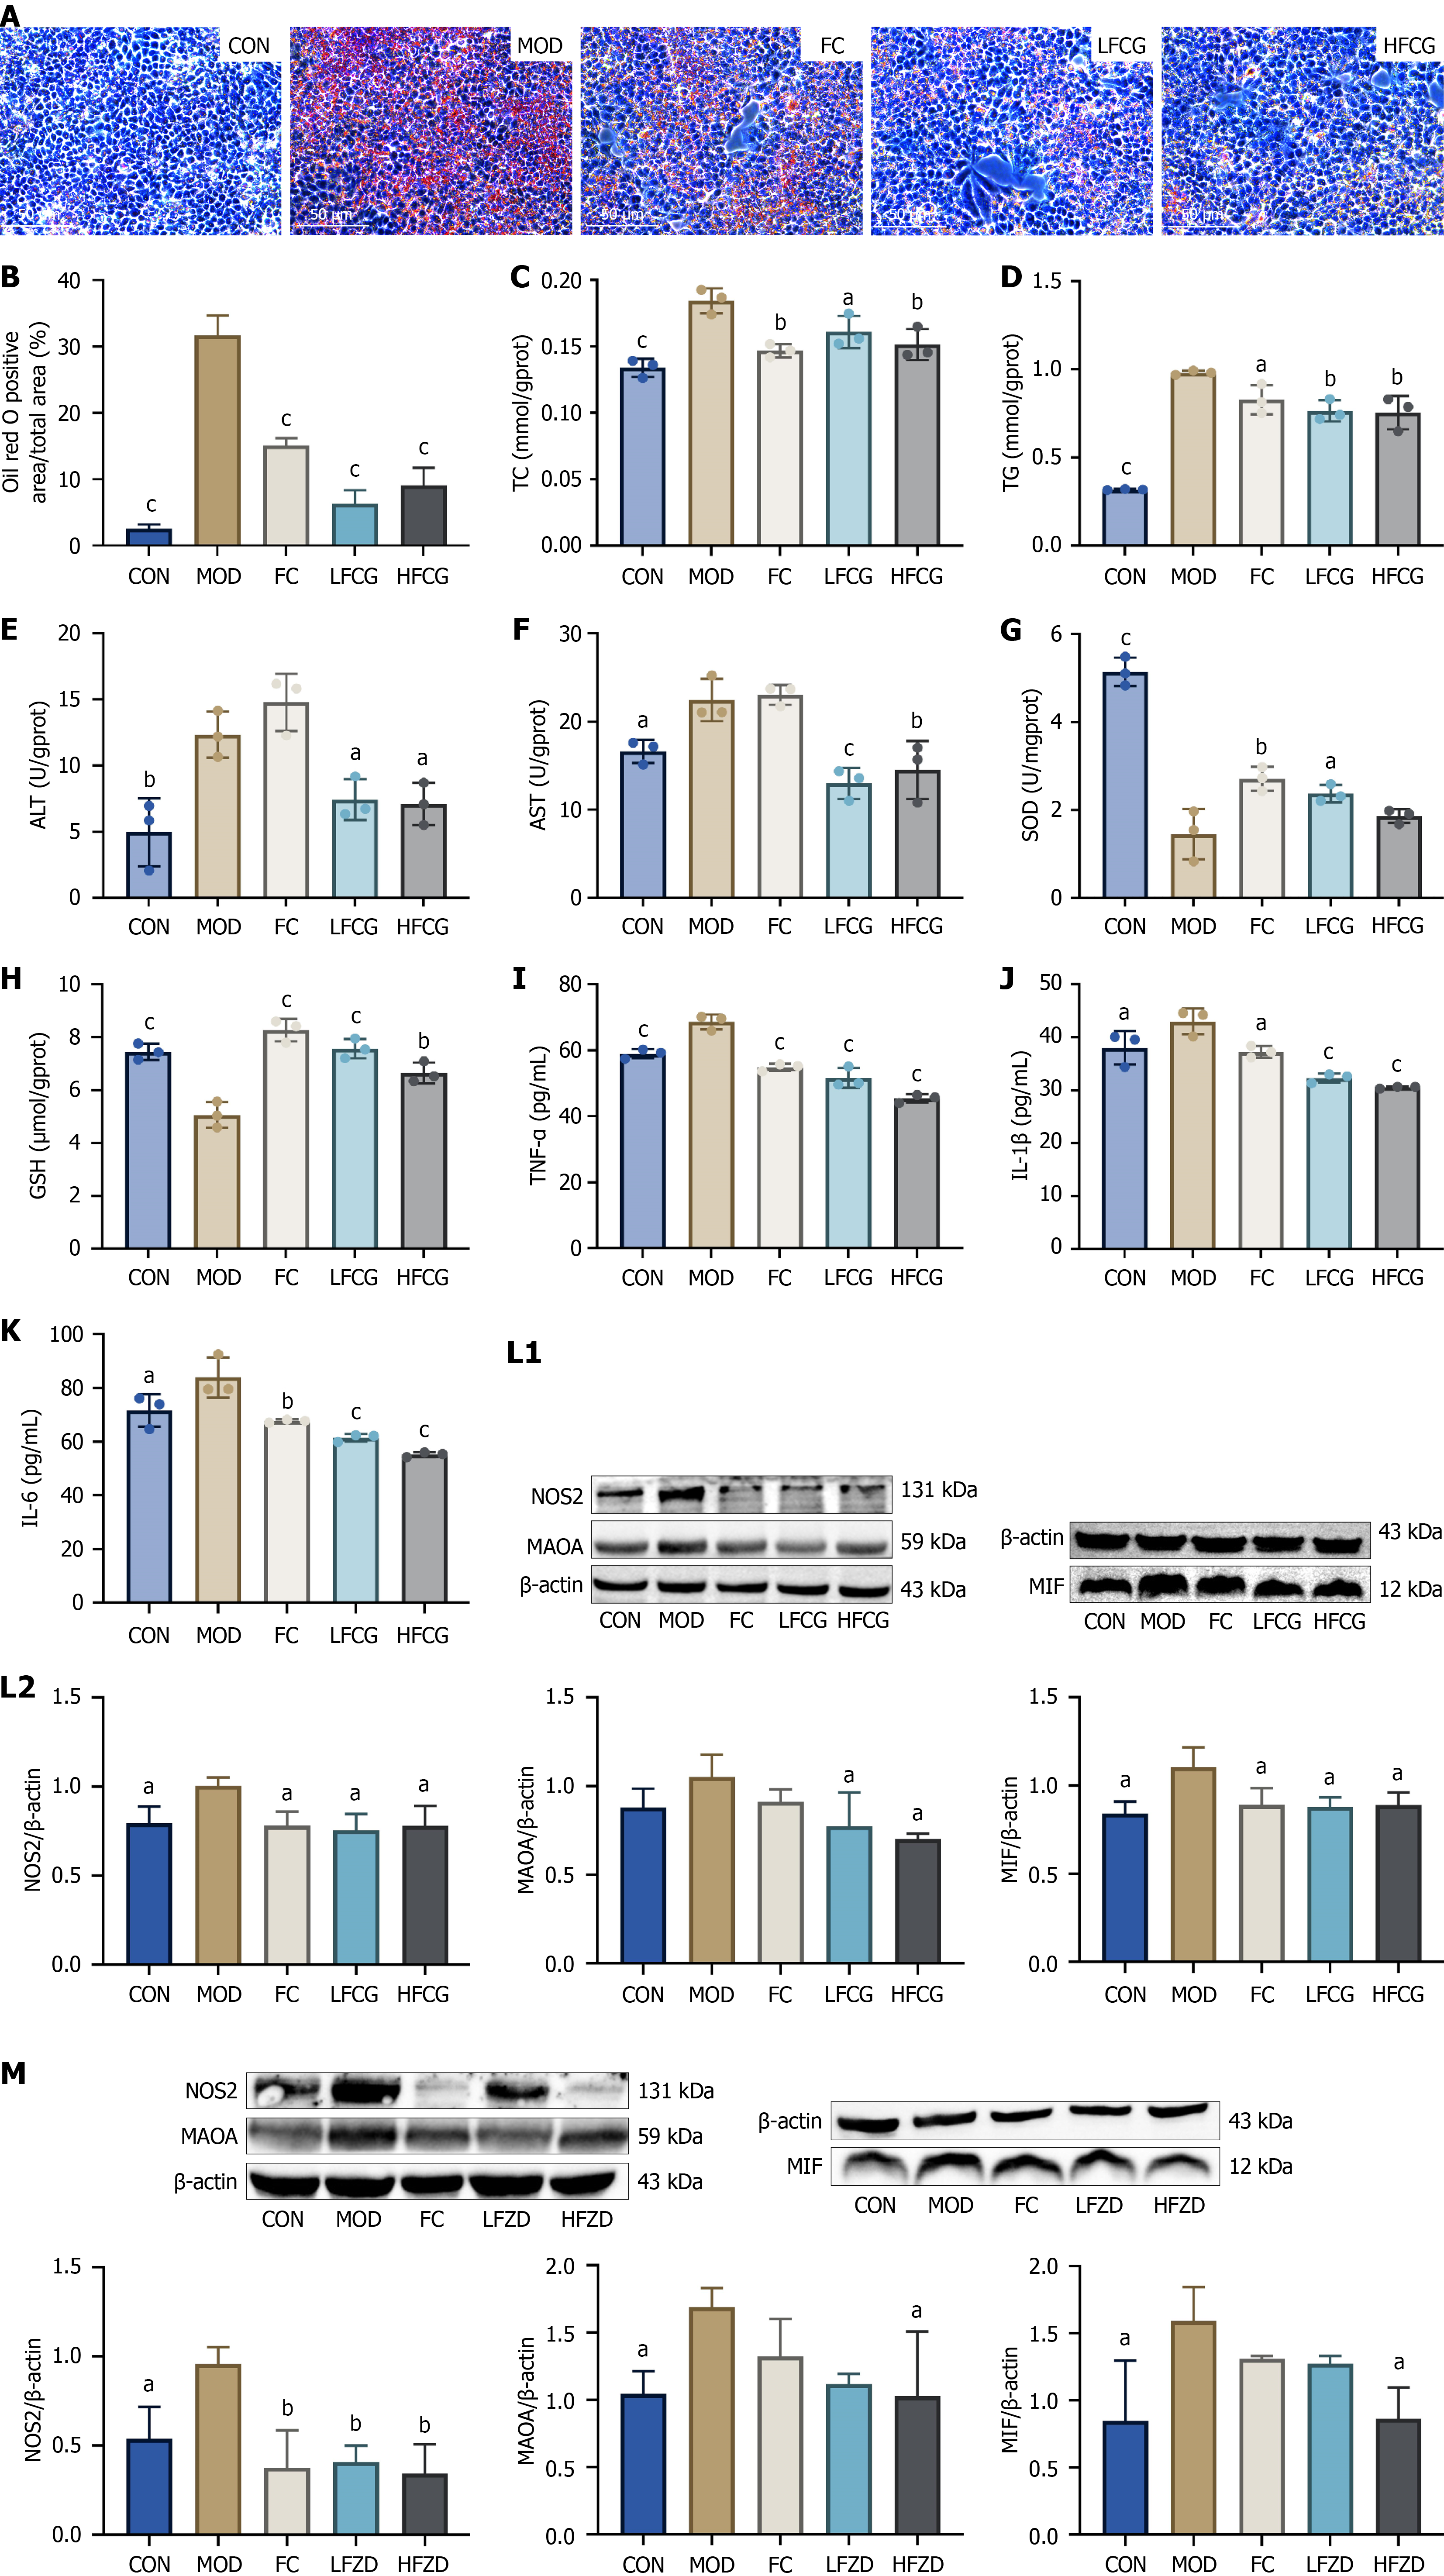
Figure 7 Effect of Fuling Zexie decoction-derived key active compounds on free fatty acid-induced HepG2 cells.
A: Oil red O stained sections (scale bar = 50 μm); B: Analysis of relative lipid droplet content; C-K: Total cholesterol (C), triglyceride (D), alanine aminotransferase (E), aspartate aminotransferase (F), superoxide dismutase (G), glutathione (H), tumor necrosis factor-α (I), interleukin (IL)-1β (J), IL-6 (K) levels in the free fatty acid-induced HepG2 cells; L: The expression of NOS2, MAOA and MIF in HepG2 cells after Fuling Zexie decoction (FZD)-derived key compound group treatment; M: The expression of NOS2, MAOA and MIF in the liver of rats with metabolic dysfunction-associated steatotic liver disease after FZD treatment. aP < 0.05. bP < 0.01. cP < 0.001. All P values vs the model group. CON: Control group; MOD: Model group; FC: Fenofibrate capsules group; HFCG: High-dose Fuling Zexie decoction-derived key compound group; LFCG: Low-dose Fuling Zexie decoction-derived key compound group; TC: Total cholesterol; TG: Triglyceride; ALT: Alanine aminotransferase; AST: Aspartate aminotransferase; SOD: Superoxide dismutase; GSH: Glutathione; TNF: Tumor necrosis factor; HFZD: High-dose Fuling Zexie decoction group; LFZD: Low-dose Fuling Zexie decoction group.
- Citation: Wang PQ, Yang H, Tang YM, Tao YX, Han SC, Zhou QD, Yu J, Yang XX. Mechanisms of Fuling Zexie decoction against metabolic dysfunction-associated steatotic liver disease: Integrative metabolomics, gut microbiota and serum pharmacochemistry. World J Gastroenterol 2027; 33(1): 123034
- URL: https://www.wjgnet.com/1007-9327/full/v33/i1/123034.htm
- DOI: https://dx.doi.org/10.3748/wjg.123034