
















Copyright: ©Author(s) 2026.
World J Gastroenterol. Dec 28, 2026; 32(48): 121570
Published online Dec 28, 2026. doi: 10.3748/wjg.121570
Published online Dec 28, 2026. doi: 10.3748/wjg.121570
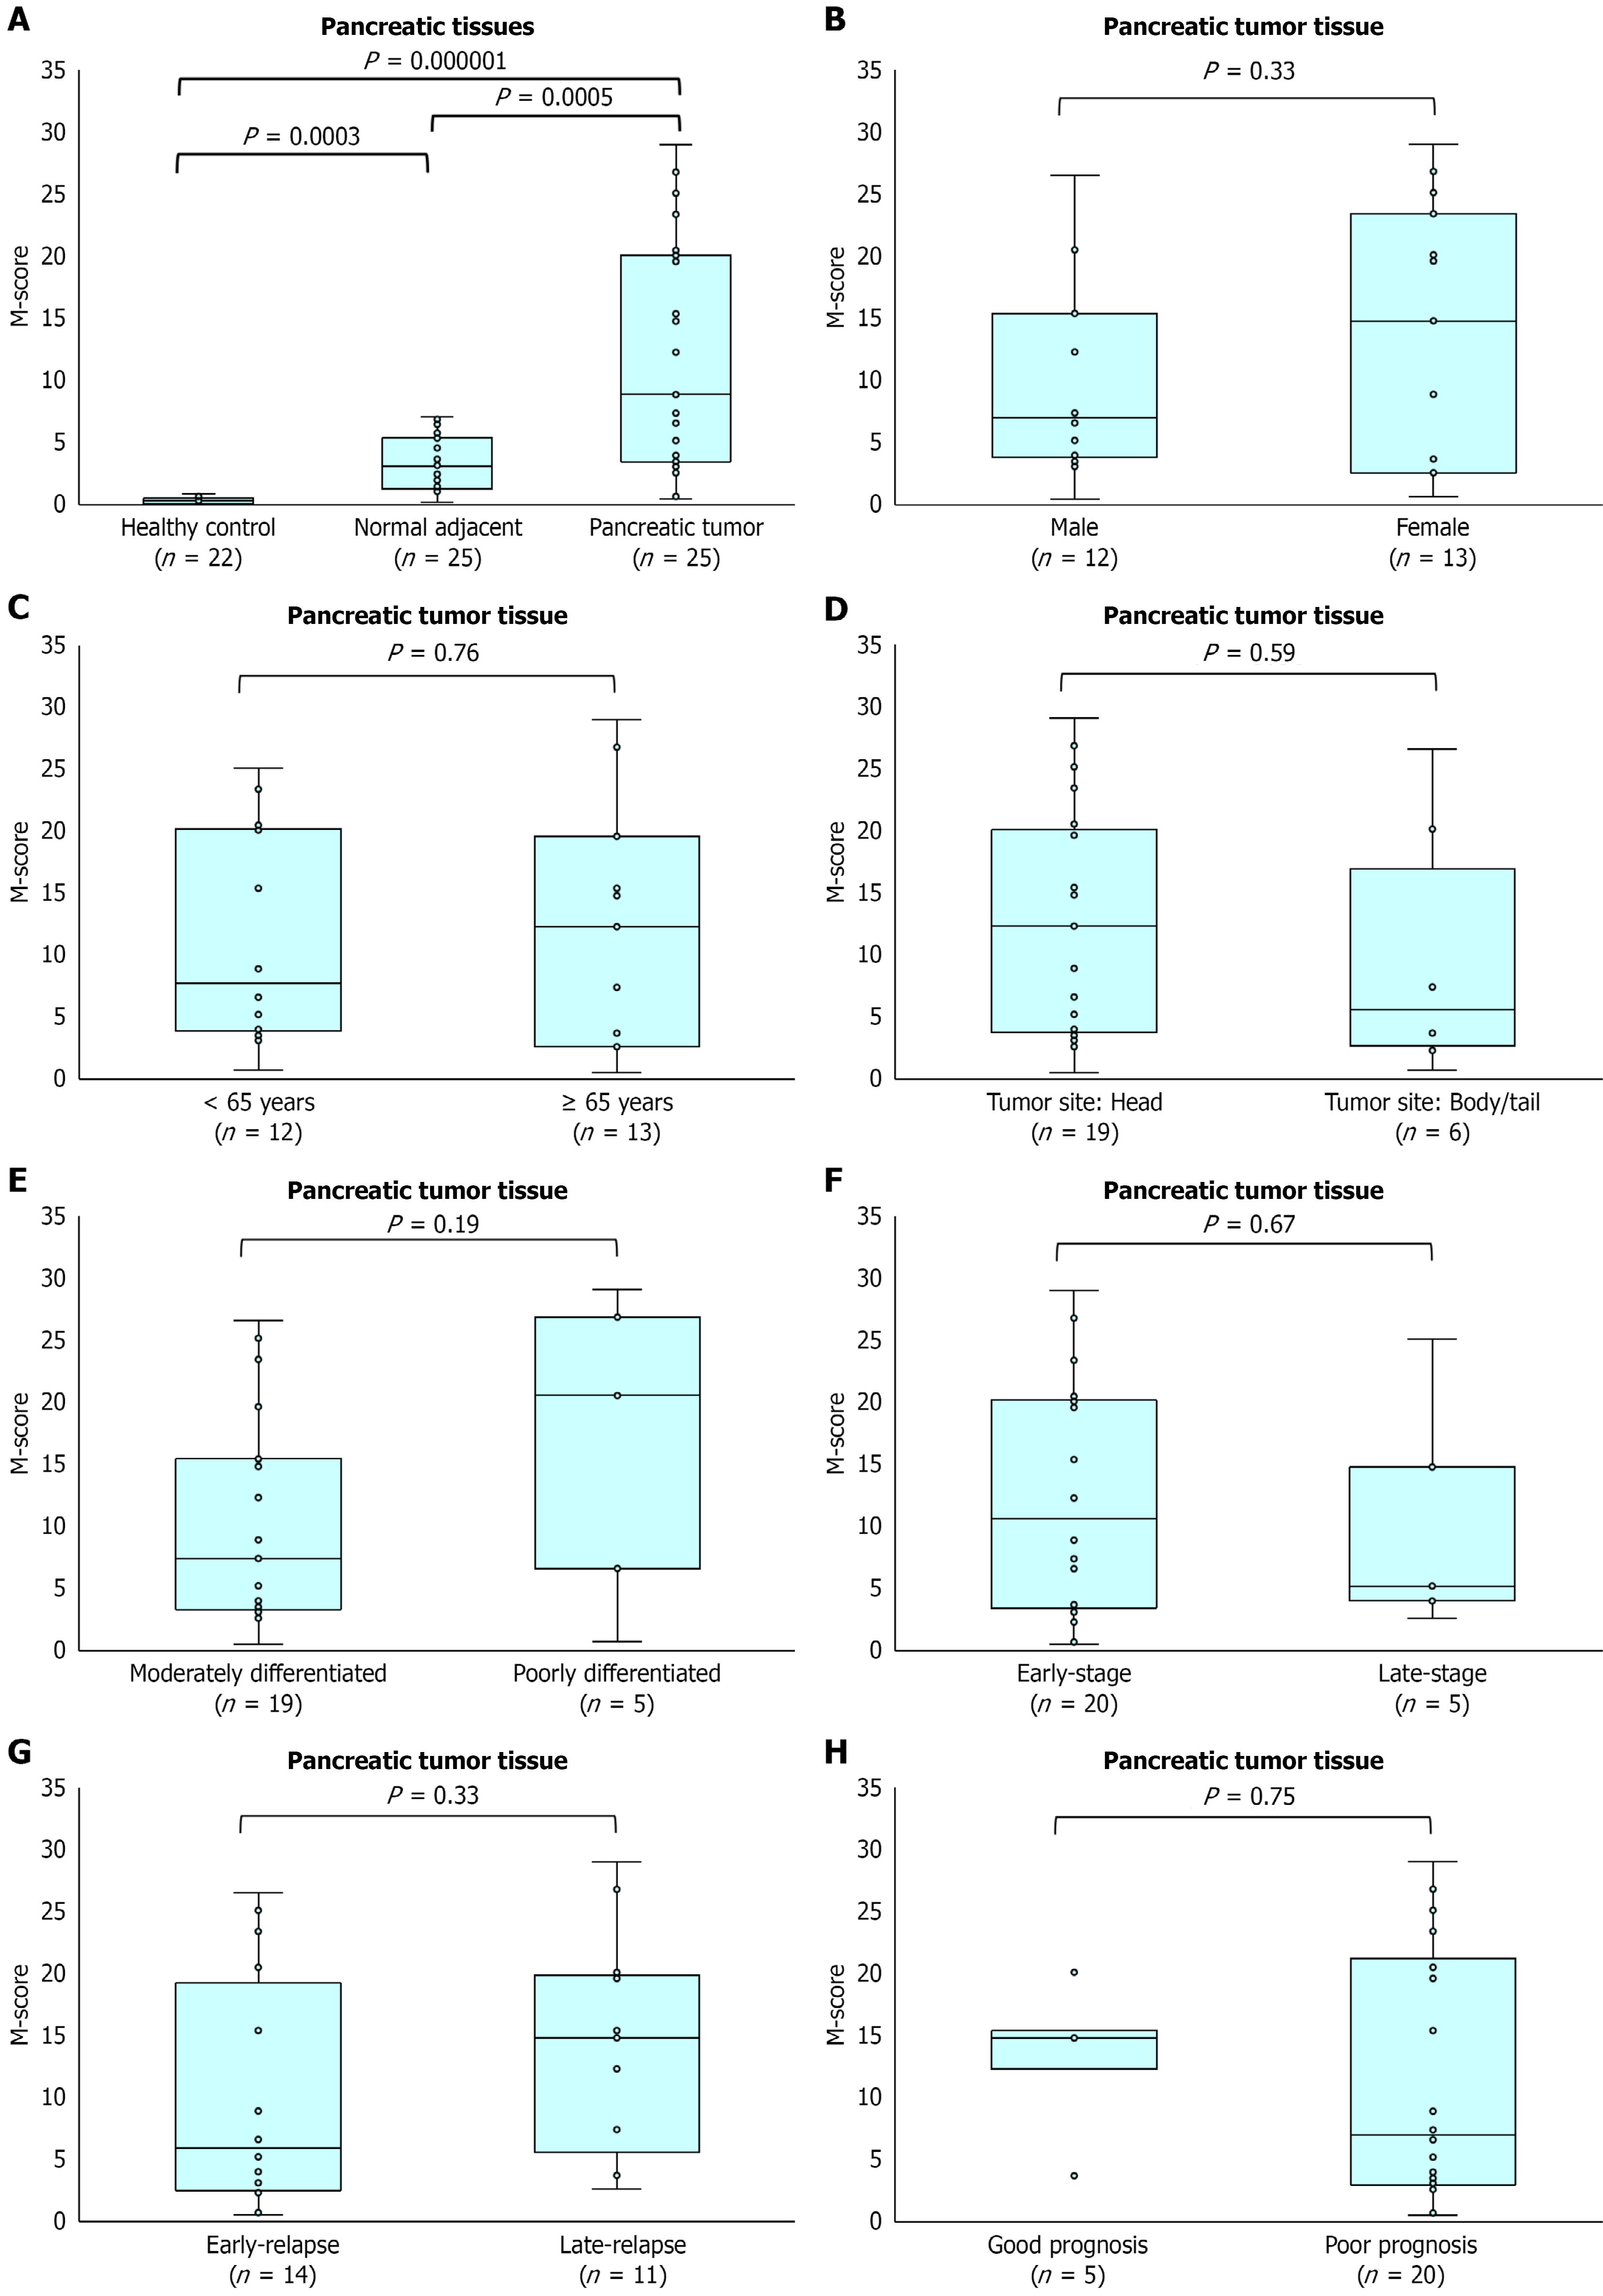
Figure 1 Cadherin 17 expression in pancreatic tissue samples and its association with clinicopathological features.
A: Cadherin 17 (CDH17) M-scores in healthy pancreatic tissues (n = 22), paired normal adjacent tissues (n = 25) and pancreatic tumor tissues (n = 25). Data are presented as box-and-whisker plots showing the median, interquartile range, and range. Relationships between CDH17 M-scores and clinicopathological variables; B: Sex; C: Age; D: Tumor site; E: Differentiation grade; F: Disease stage (stages I/II vs III/IV); G: Relapse status (relapse < 1 year vs ≥ 1 year); H: Prognosis (overall survival ≥ 3 years vs < 3 years). None of the factors examined showed significant associations.
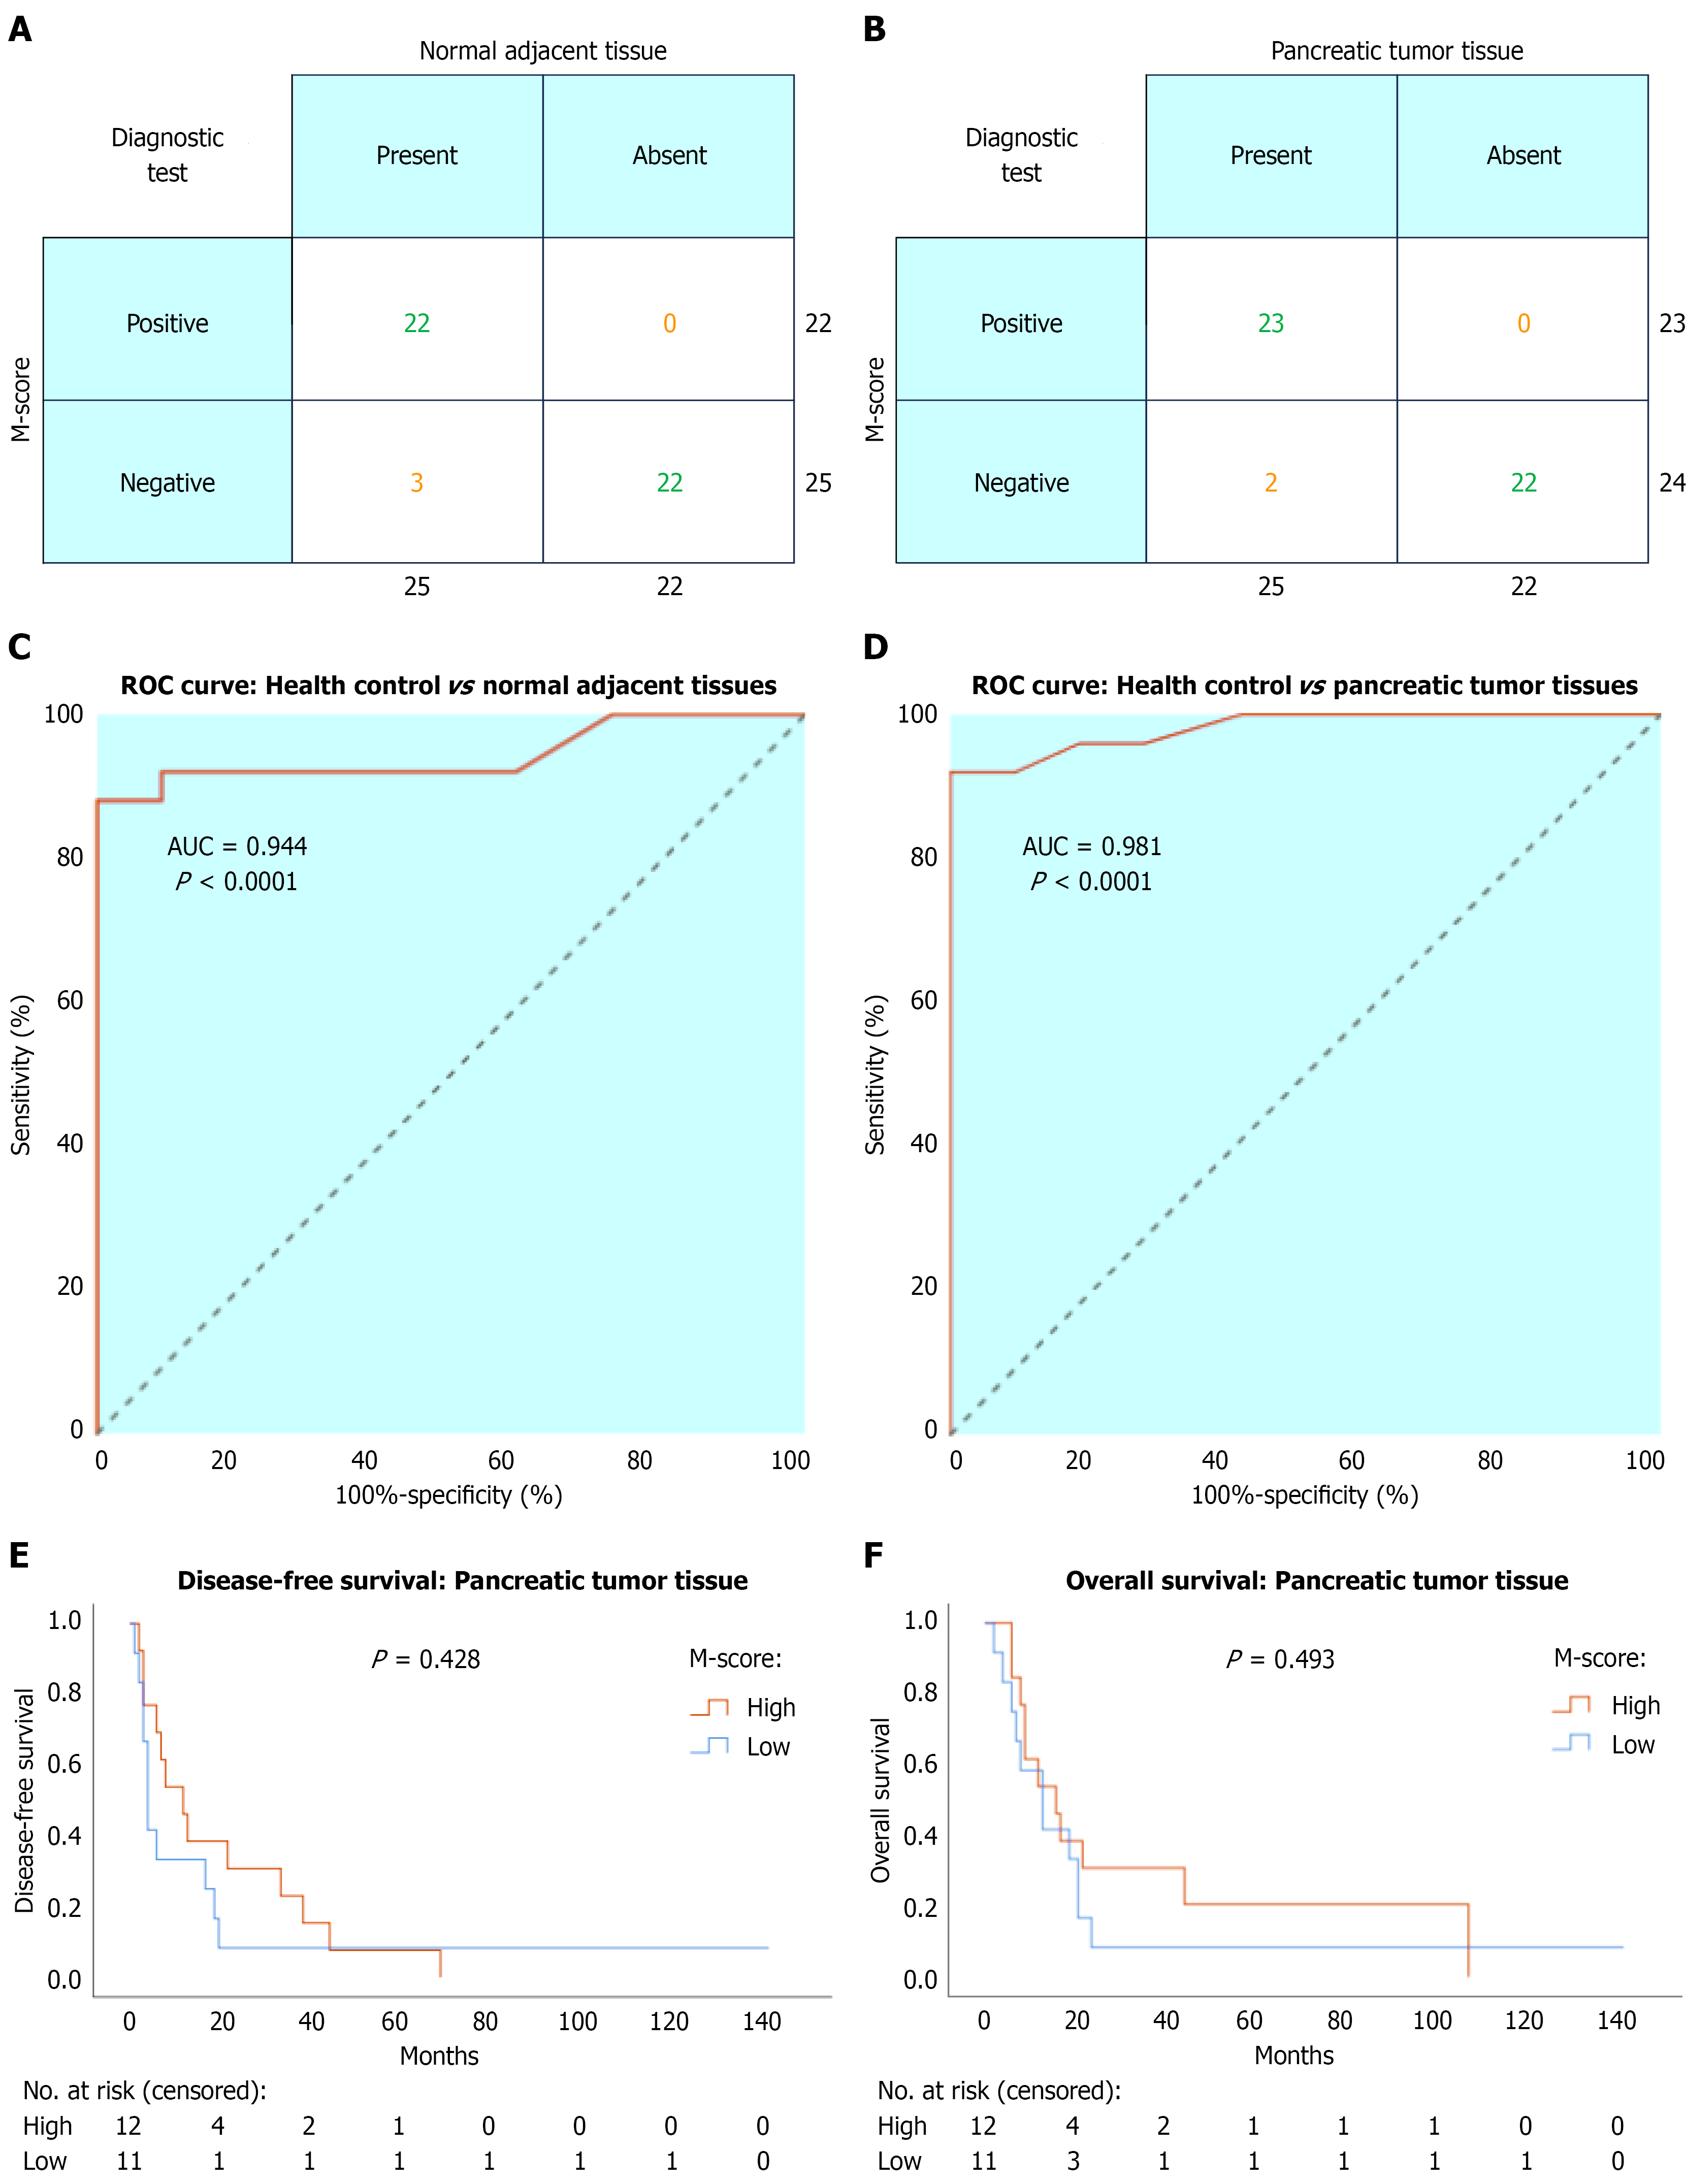
Figure 2 Diagnostic and prognostic performance of the cadherin 17 M-score in pancreatic tissue samples.
A and B: Classification of healthy controls (n = 22), normal adjacent tissues (n = 25), and pancreatic tumor tissues (n = 25) using an M-score cutoff of ≥ 1 to define positivity. For healthy control vs normal adjacent tissues, sensitivity was 88% and specificity 100%. For healthy control vs pancreatic tumor tissues, sensitivity was 92% and specificity 100%; C and D: Receiver operating characteristic curve analysis of the cadherin 17 (CDH17) M-score for detecting normal adjacent tissue and pancreatic tumor tissue. The area under the curve was 0.944 and 0.981, respectively; E and F: Kaplan-Meier survival curves comparing patients with median-high vs median-low CDH17 M-scores for disease-free survival and overall survival. No significant differences were observed for either endpoint (log-rank test). ROC: Receiver operating characteristic; AUC: Area under the curve.
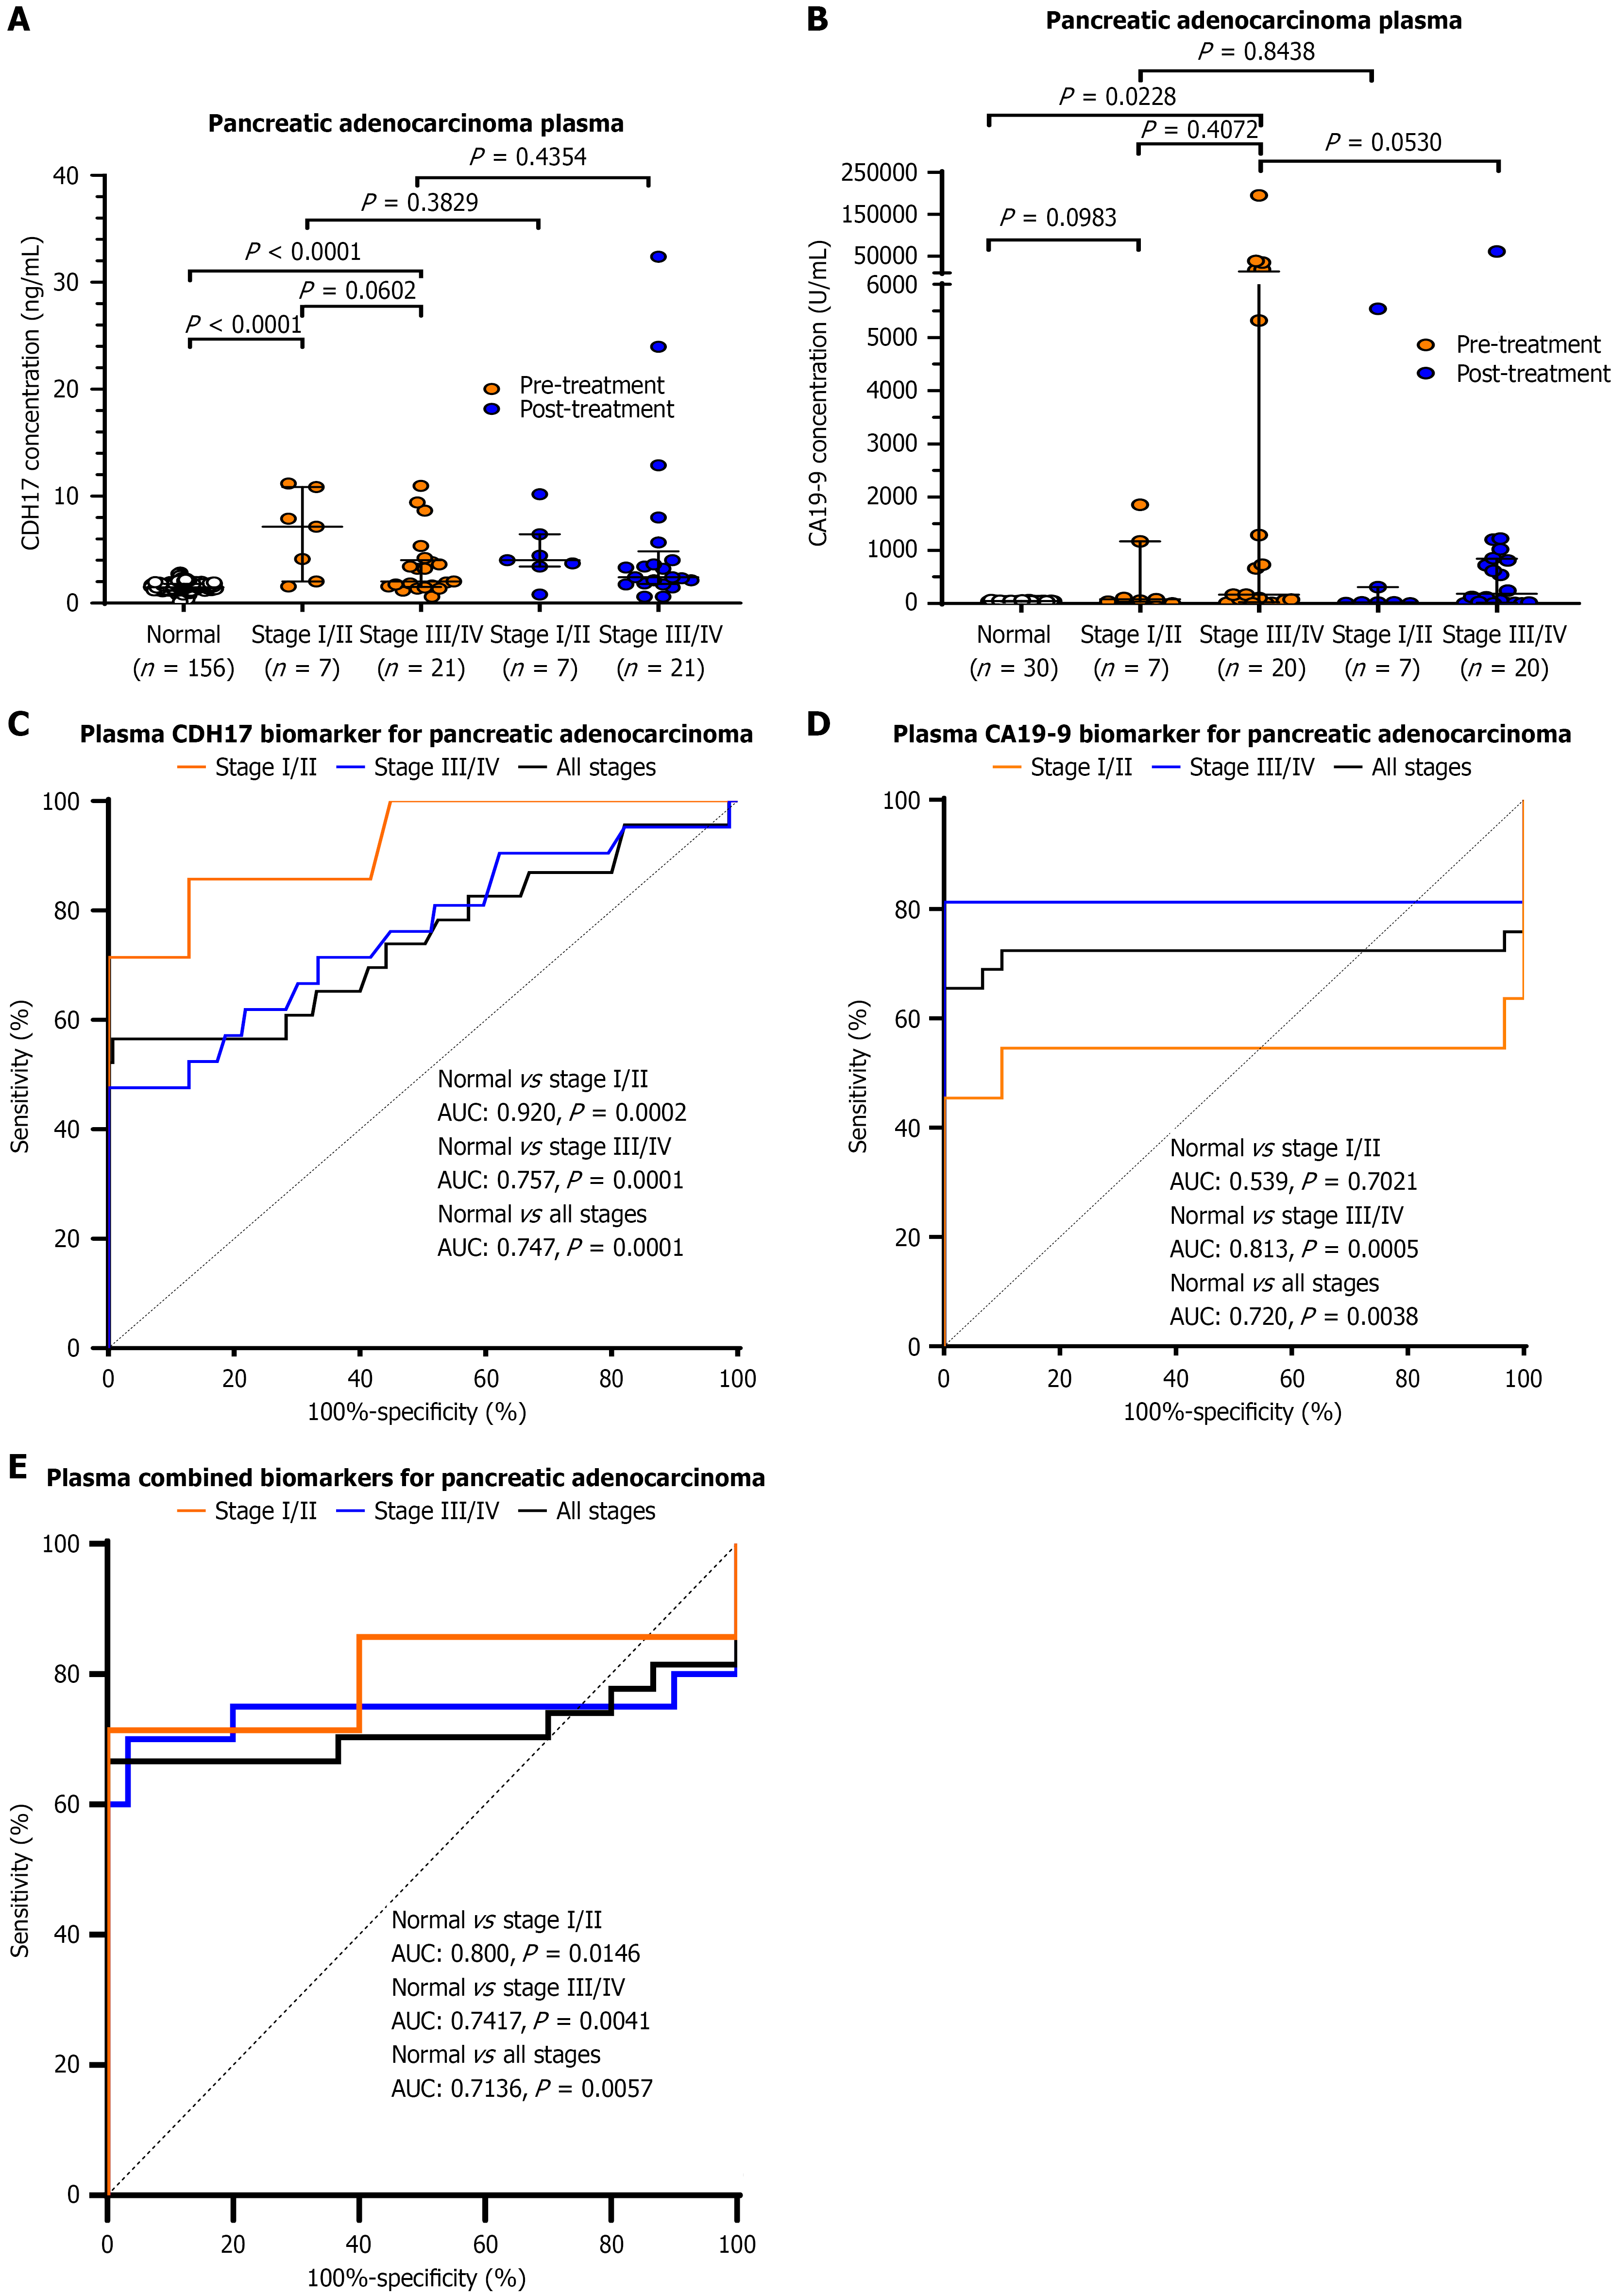
Figure 3 Expression of plasma cadherin 17 and carbohydrate antigen 19-9 in pancreatic adenocarcinoma.
A and B: Plasma cadherin 17 (CDH17) and carbohydrate antigen 19-9 (CA19-9) levels in healthy controls (CDH17: n = 156; CA19-9: n = 30) and patients with stage I/II (n = 7) and stage III/IV (CDH17: n = 21; CA19-9: n = 20) pancreatic adenocarcinoma, measured before and after treatment. Data are presented as median with interquartile range; C and D: Receiver operating characteristic (ROC) curves for CDH17 and CA19-9 in predicting stage I/II, stage III/IV, and all-stage disease based on the area under the curve; E: Combined ROC curve for CDH17 and CA19-9 in early-stage (I/II), late-stage (III/IV) and all stages detection using multiple logistic regression. CDH17: Cadherin 17; CA19-9: Carbohydrate antigen 19-9; AUC: Area under the curve.
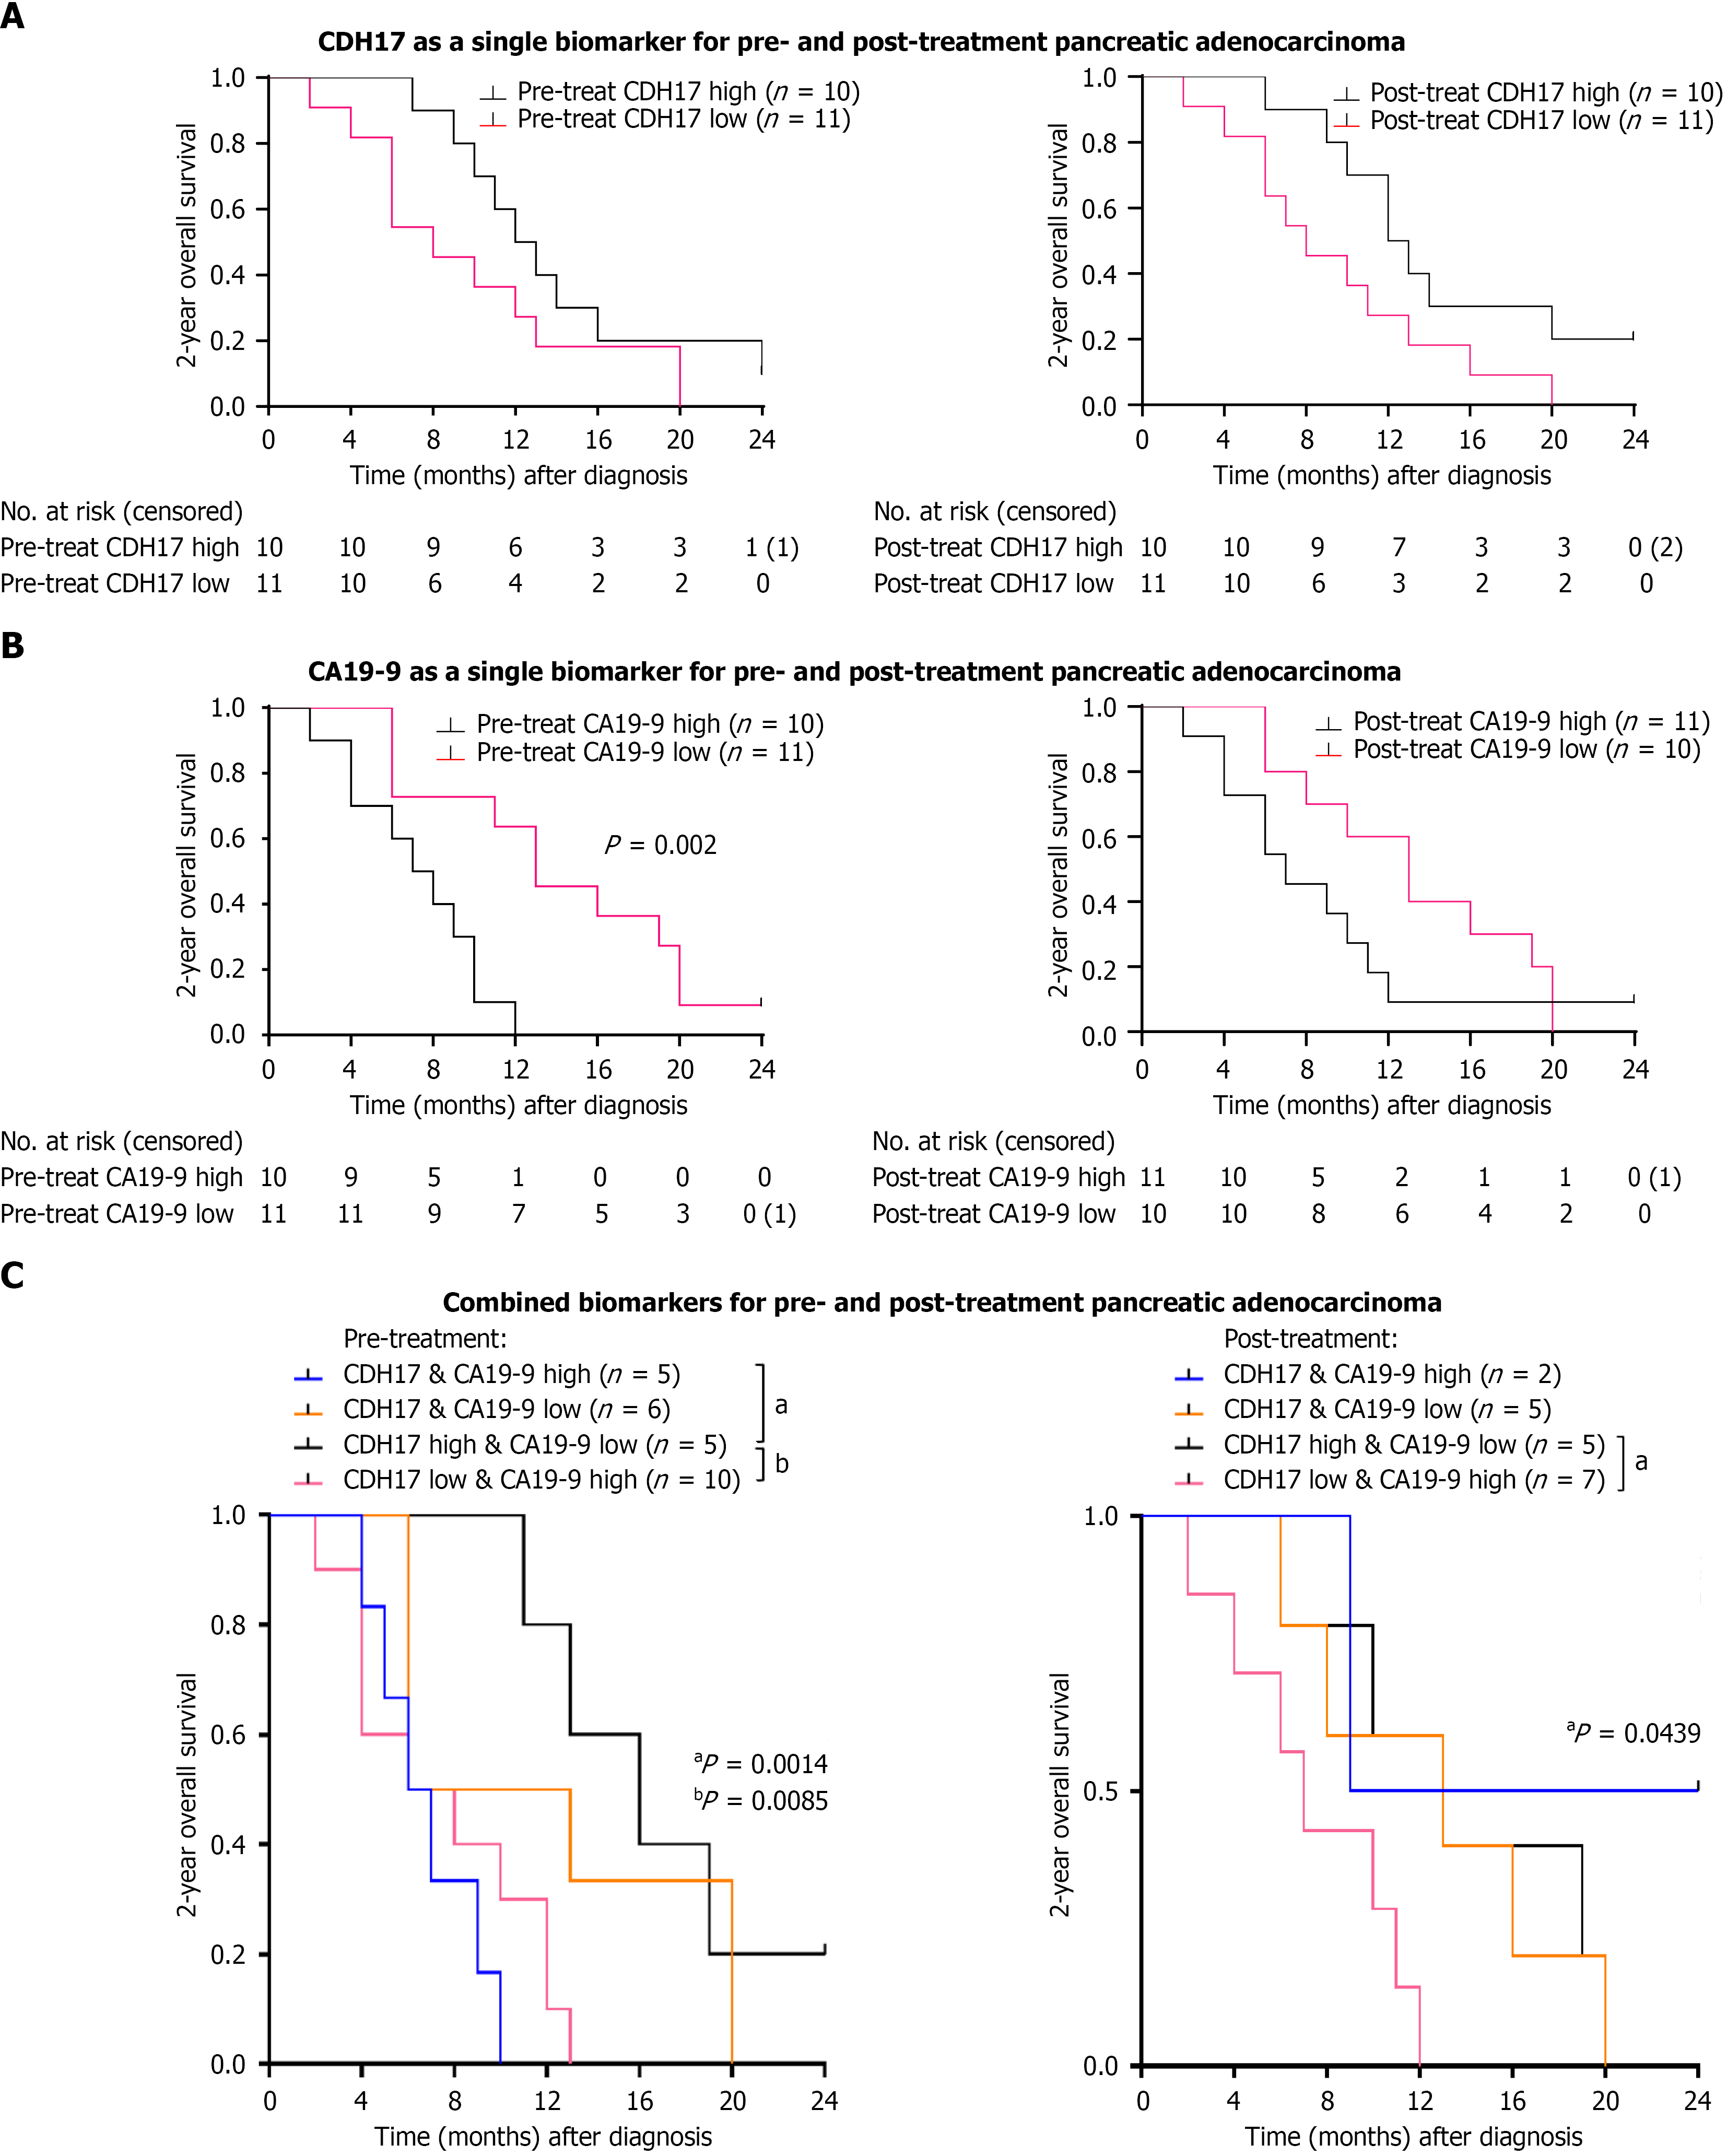
Figure 4 Prognostic value of pre- and post-treatment cadherin 17 and carbohydrate antigen 19-9 in the plasma samples of advanced pancreatic adenocarcinoma.
Kaplan-Meier curves showing 2-year survival rates for late-stage (III/IV) pancreatic cancer patients, stratified by median-high or median-low pre- and post-treatment levels. A: Cadherin 17; B: Carbohydrate antigen 19-9 analyzed individually; C: In combination. Statistical significance was assessed using the Log-rank (Mantel-Cox) test. CDH17: Cadherin 17; CA19-9: Carbohydrate antigen 19-9.
- Citation: Cho WC, Yu WS, Hon TC, Cheung ETY, Wang XQ, Wong DA, Wong CSC, Cheuk W, Luk JM. Cadherin-17: A potential biomarker for early detection in pancreatic adenocarcinoma. World J Gastroenterol 2026; 32(48): 121570
- URL: https://www.wjgnet.com/1007-9327/full/v32/i48/121570.htm
- DOI: https://dx.doi.org/10.3748/wjg.121570