
















Copyright: ©Author(s) 2026.
World J Gastroenterol. Dec 21, 2026; 32(47): 122668
Published online Dec 21, 2026. doi: 10.3748/wjg.122668
Published online Dec 21, 2026. doi: 10.3748/wjg.122668
Figure 1 ZFP36 inhibits cell proliferation, migration, invasion, and facilitates apoptosis in AGS cells.
A: Validation of ZFP36 overexpression efficiency by reverse transcription-quantitative polymerase chain reaction in AGS cells; B: Validation of ZFP36 overexpression efficiency by western blot in AGS cells; C: Cell proliferation assessed by cell counting kit-8 assay; D: Cell cycle distribution analyzed by flow cytometry; E: Cell apoptosis detected by flow cytometry; F: Cell invasion assessed by Transwell assay; G: Cell migration assessed by Transwell assay. aP < 0.05 vs negative control group, bP < 0.01 vs negative control group, cP < 0.001 vs negative control group, dP < 0.0001 vs negative control group. NC: Negative control; OE: Overexpression.
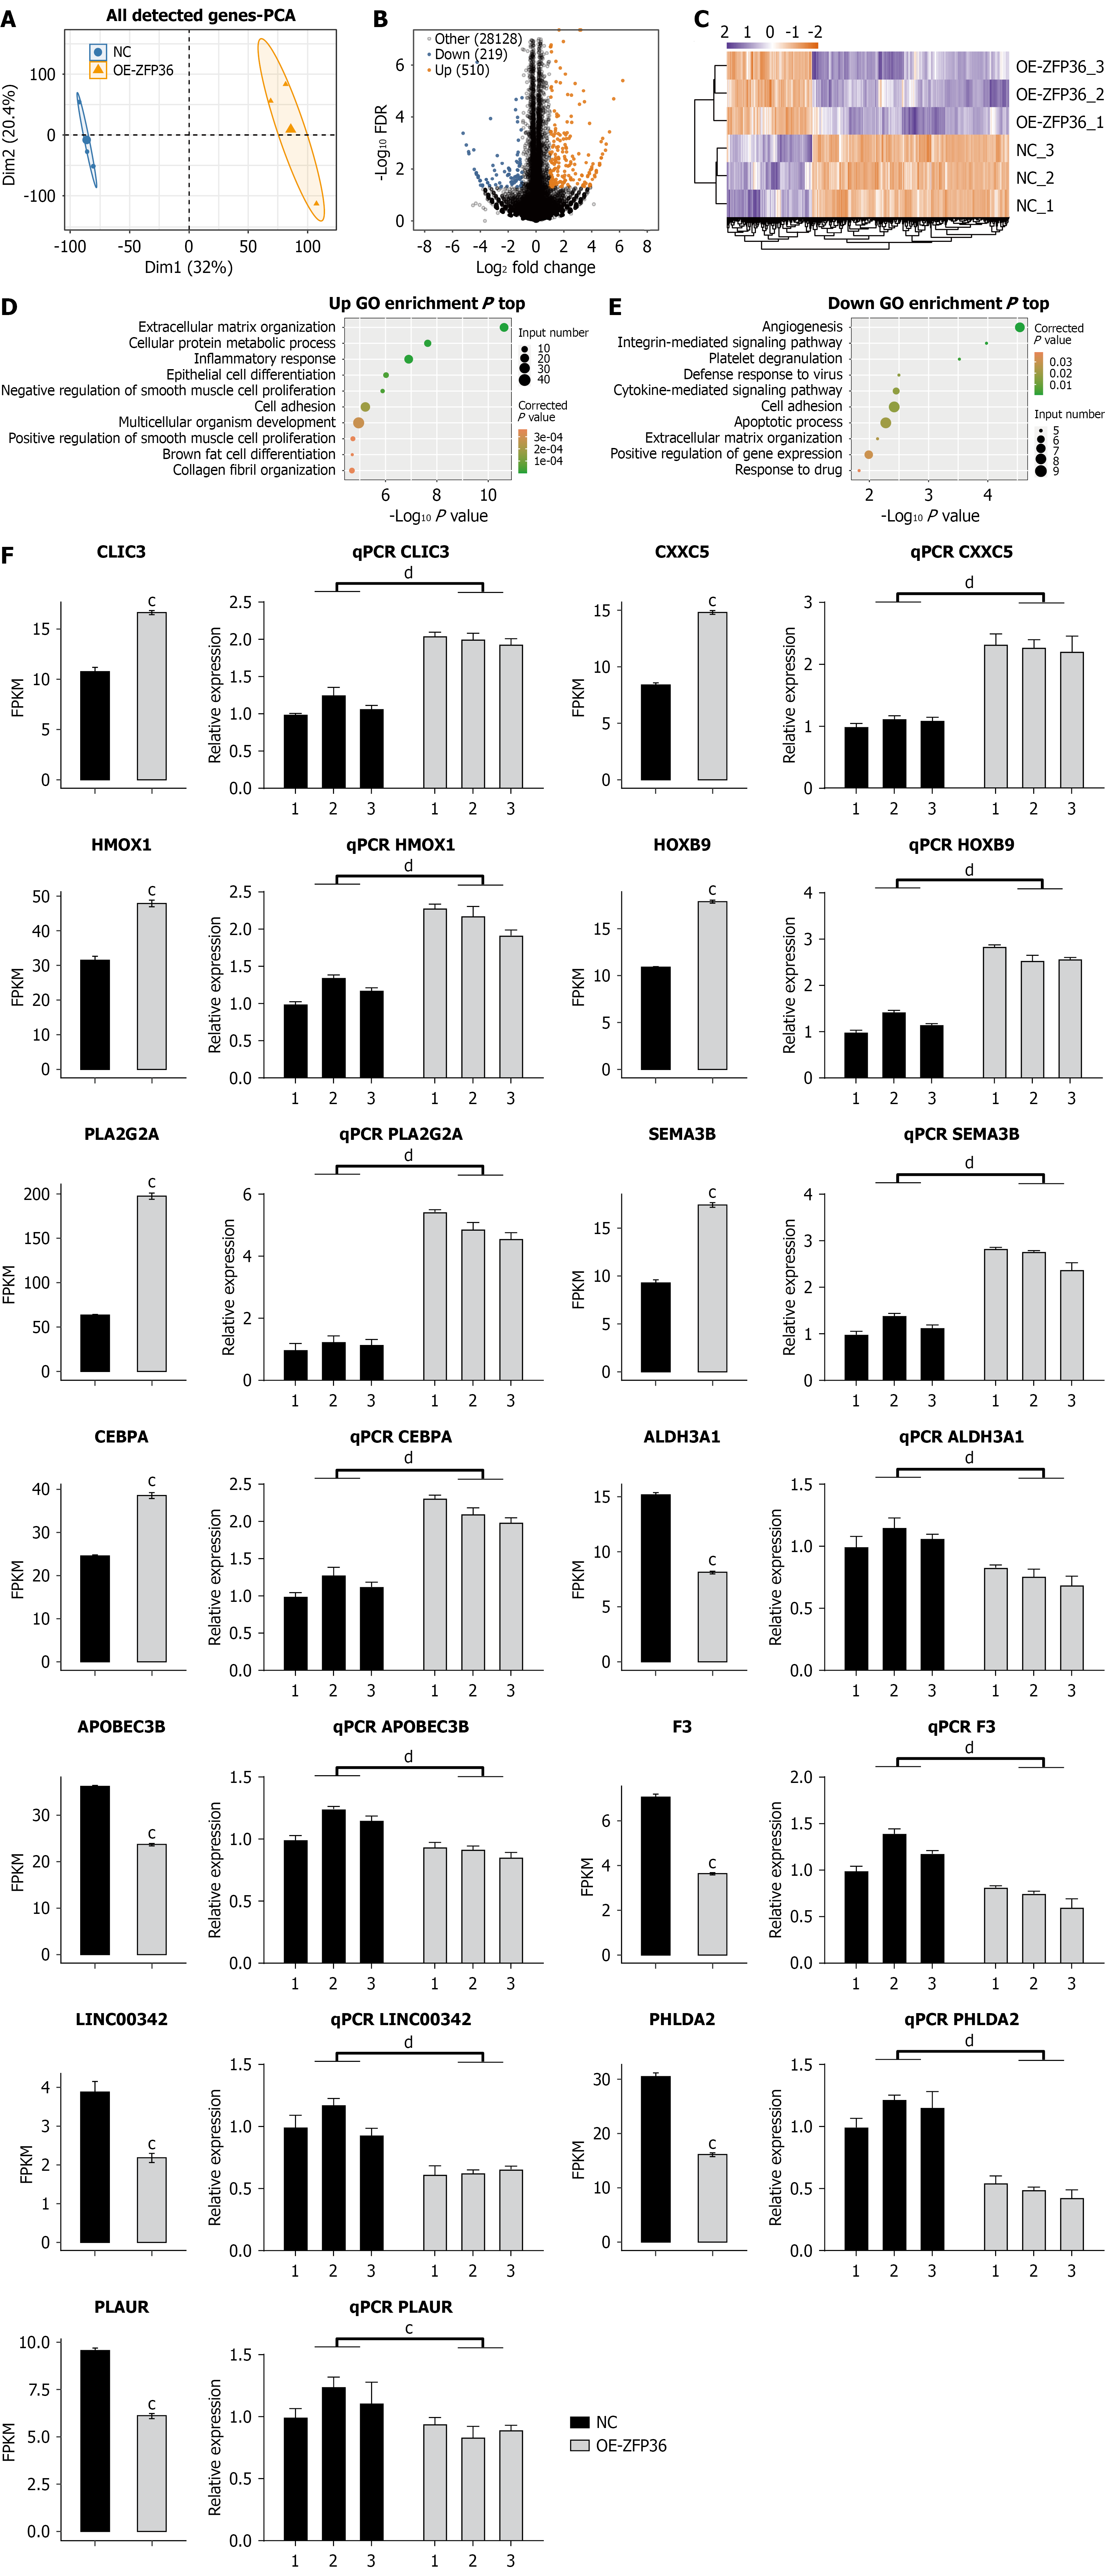
Figure 2 ZFP36 regulates gene expression in AGS cells.
A: Principal component analysis based on fragments per kilobase of transcript per million mapped reads values of all detected genes following ZFP36 overexpression. Ellipses for each group represent the confidence ellipse; B: Volcano plot showing all differentially expressed gene (DEGs) between the overexpression-ZFP36 and NC samples; C: Hierarchical clustering heatmap showing expression levels of all DEGs; D: Scatter plot exhibiting the most enriched Gene Ontology biological process results for up-regulated DEGs; E: Scatter plot exhibiting the most enriched Gene Ontology biological process results for down-regulated DEGs; F: Bar plot showing the expression pattern and statistical differences of DEGs, as determined by RNA sequencing and reverse transcription-quantitative polymerase chain reaction validation. cP < 0.001 vs negative control group, dP < 0.0001 vs negative control group. PCA: Principal component analysis; NC: Negative control; OE: Overexpression; GO: Gene Ontology; FPKM: Fragments per kilobase of transcript per million mapped reads.
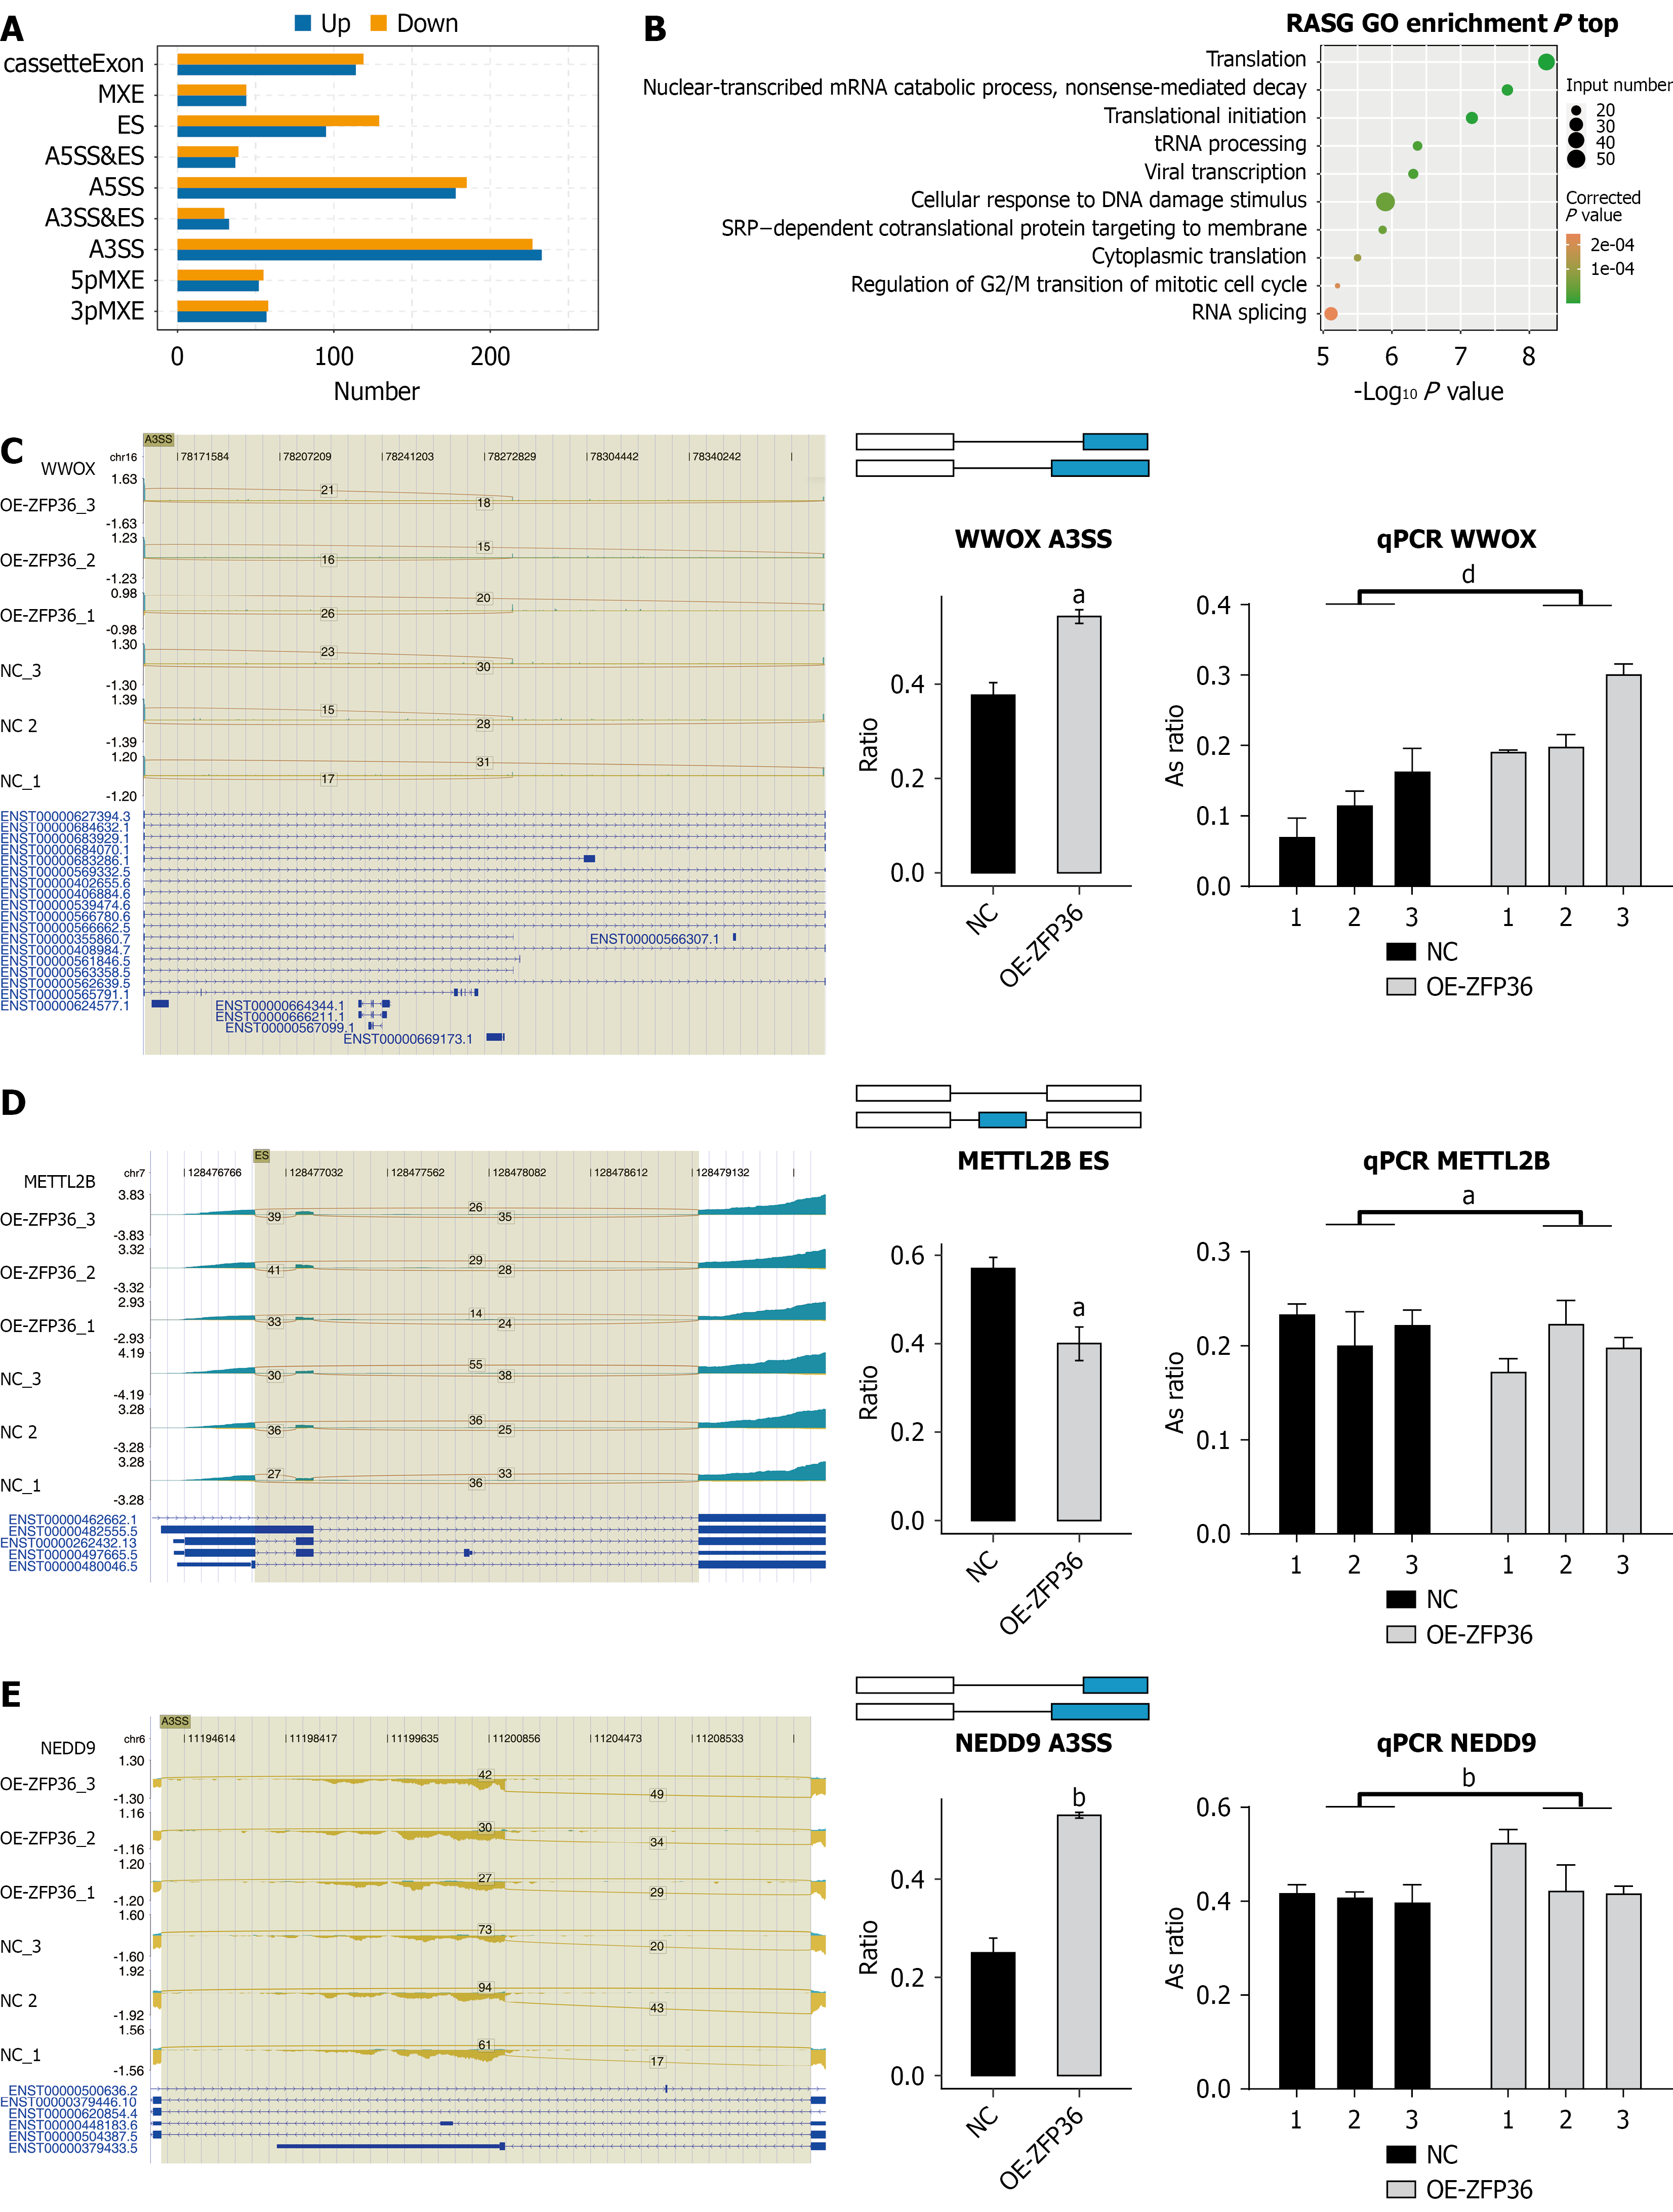
Figure 3 ZFP36 regulates alternative splicing of genes in AGS cells.
A: Bar plot illustrating alternative splicing events governed by ZFP36; B: Scatter plot displaying top enriched Gene Ontology biological processes among genes that undergo alternative spliced; C-E: ZFP36-mediated alternative splicing events for WWOX (A3SS), METTL2B (ES), and NEDD9 (A3SS) are presented. Left panel: Integrative genomics viewer-sashimi plot illustrating binding sites and regulated splicing events along the mRNA transcript. Upper panel displays read coverage for each regulated alternative splicing event; gene transcript structures are depicted beneath. Right panel: Structural diagrams of alternative splicing events. Bottom portion of the right panel shows confirmation via RNA sequencing and reverse transcription-quantitative polymerase chain reaction. aP < 0.05 vs negative control group, bP < 0.01 vs negative control group, dP < 0.0001 vs negative control group. NC: Negative control; OE: Overexpression; GO: Gene Ontology.
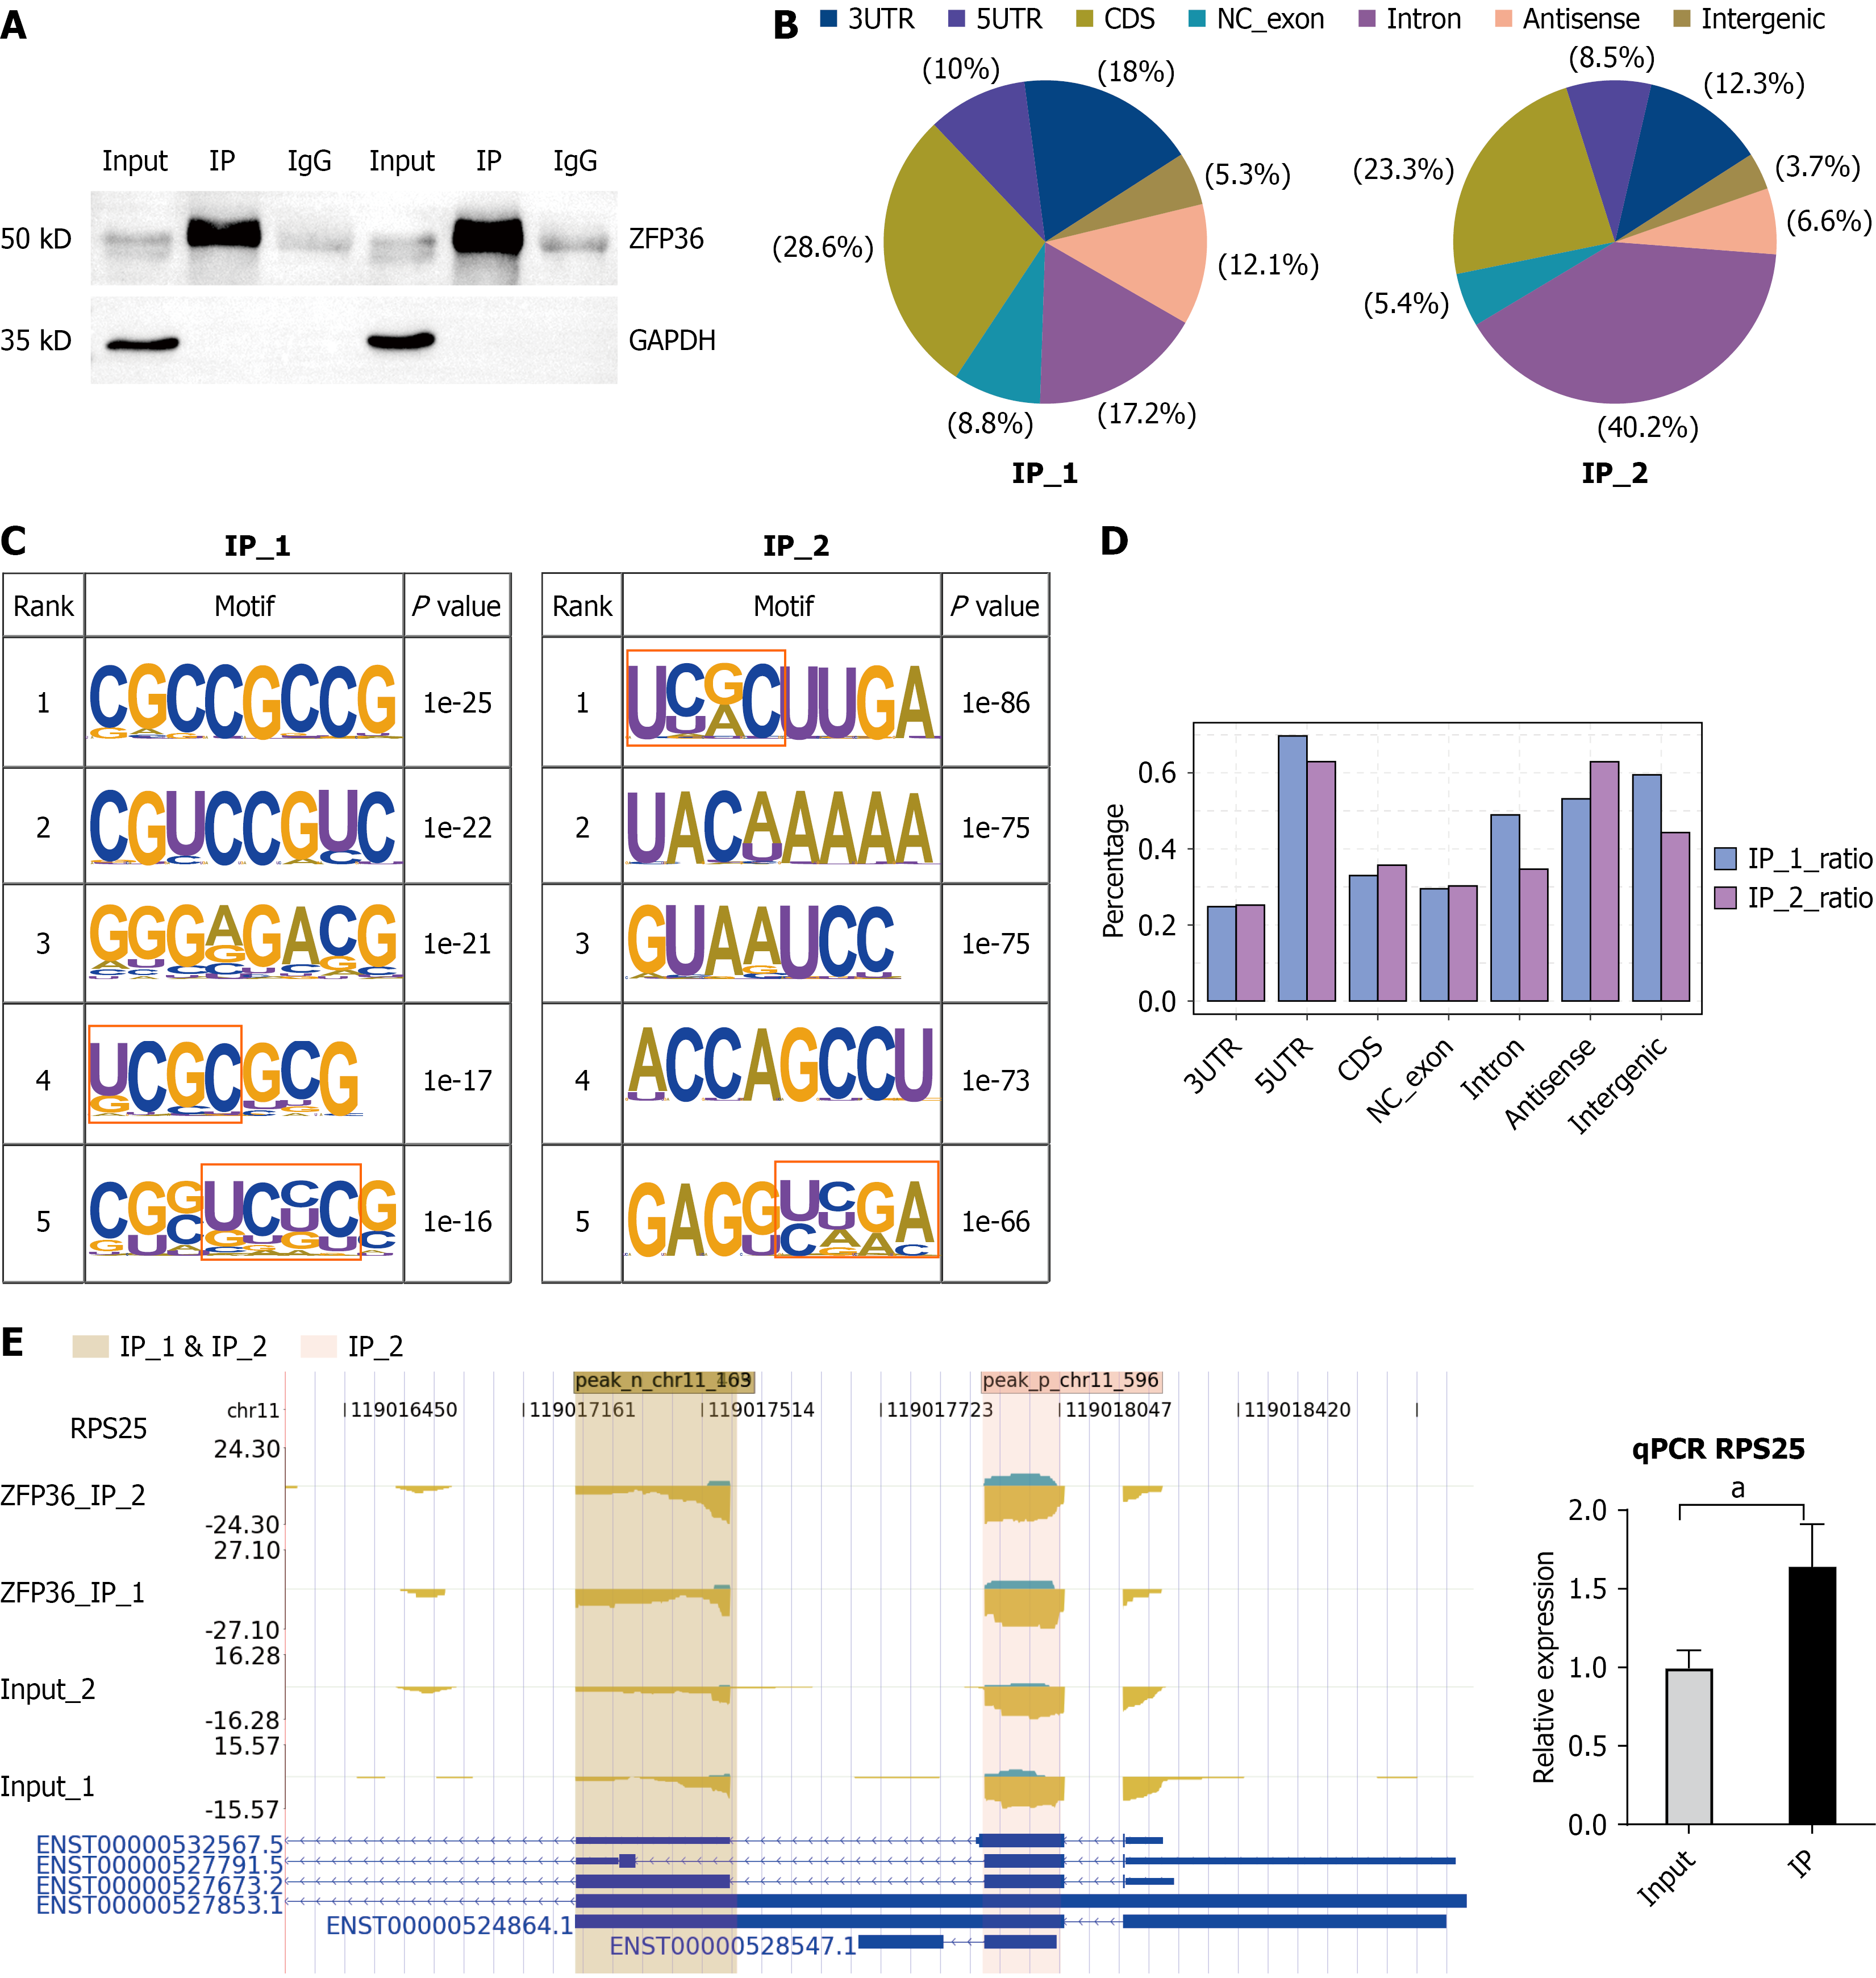
Figure 4 ZFP36 interacts with gastric carcinoma-related mRNAs in AGS cells.
A: Western blot validation of ZFP36 immunoprecipitation using an anti-Flag monoclonal antibody; B: Pie chart depicting peak distribution across the genome for two biological replicates of ZFP36-bound fragments; C: Consensus motifs enriched among ZFP36-bound peaks (top five) from two replicate trials are displayed; D: Spatial distribution of UCGC-enriched sequences as determined by Ablife analysis across both experimental replicates; E: ZFP36 binding peak within the RPS25 gene are presented. Left: Read density landscape of ZFP36-binding peaks across RPS25. Right: Reverse transcription-quantitative polymerase chain reaction quantification of RPS25 expression from improved RNA immunoprecipitation sequencing data. aP < 0.05.
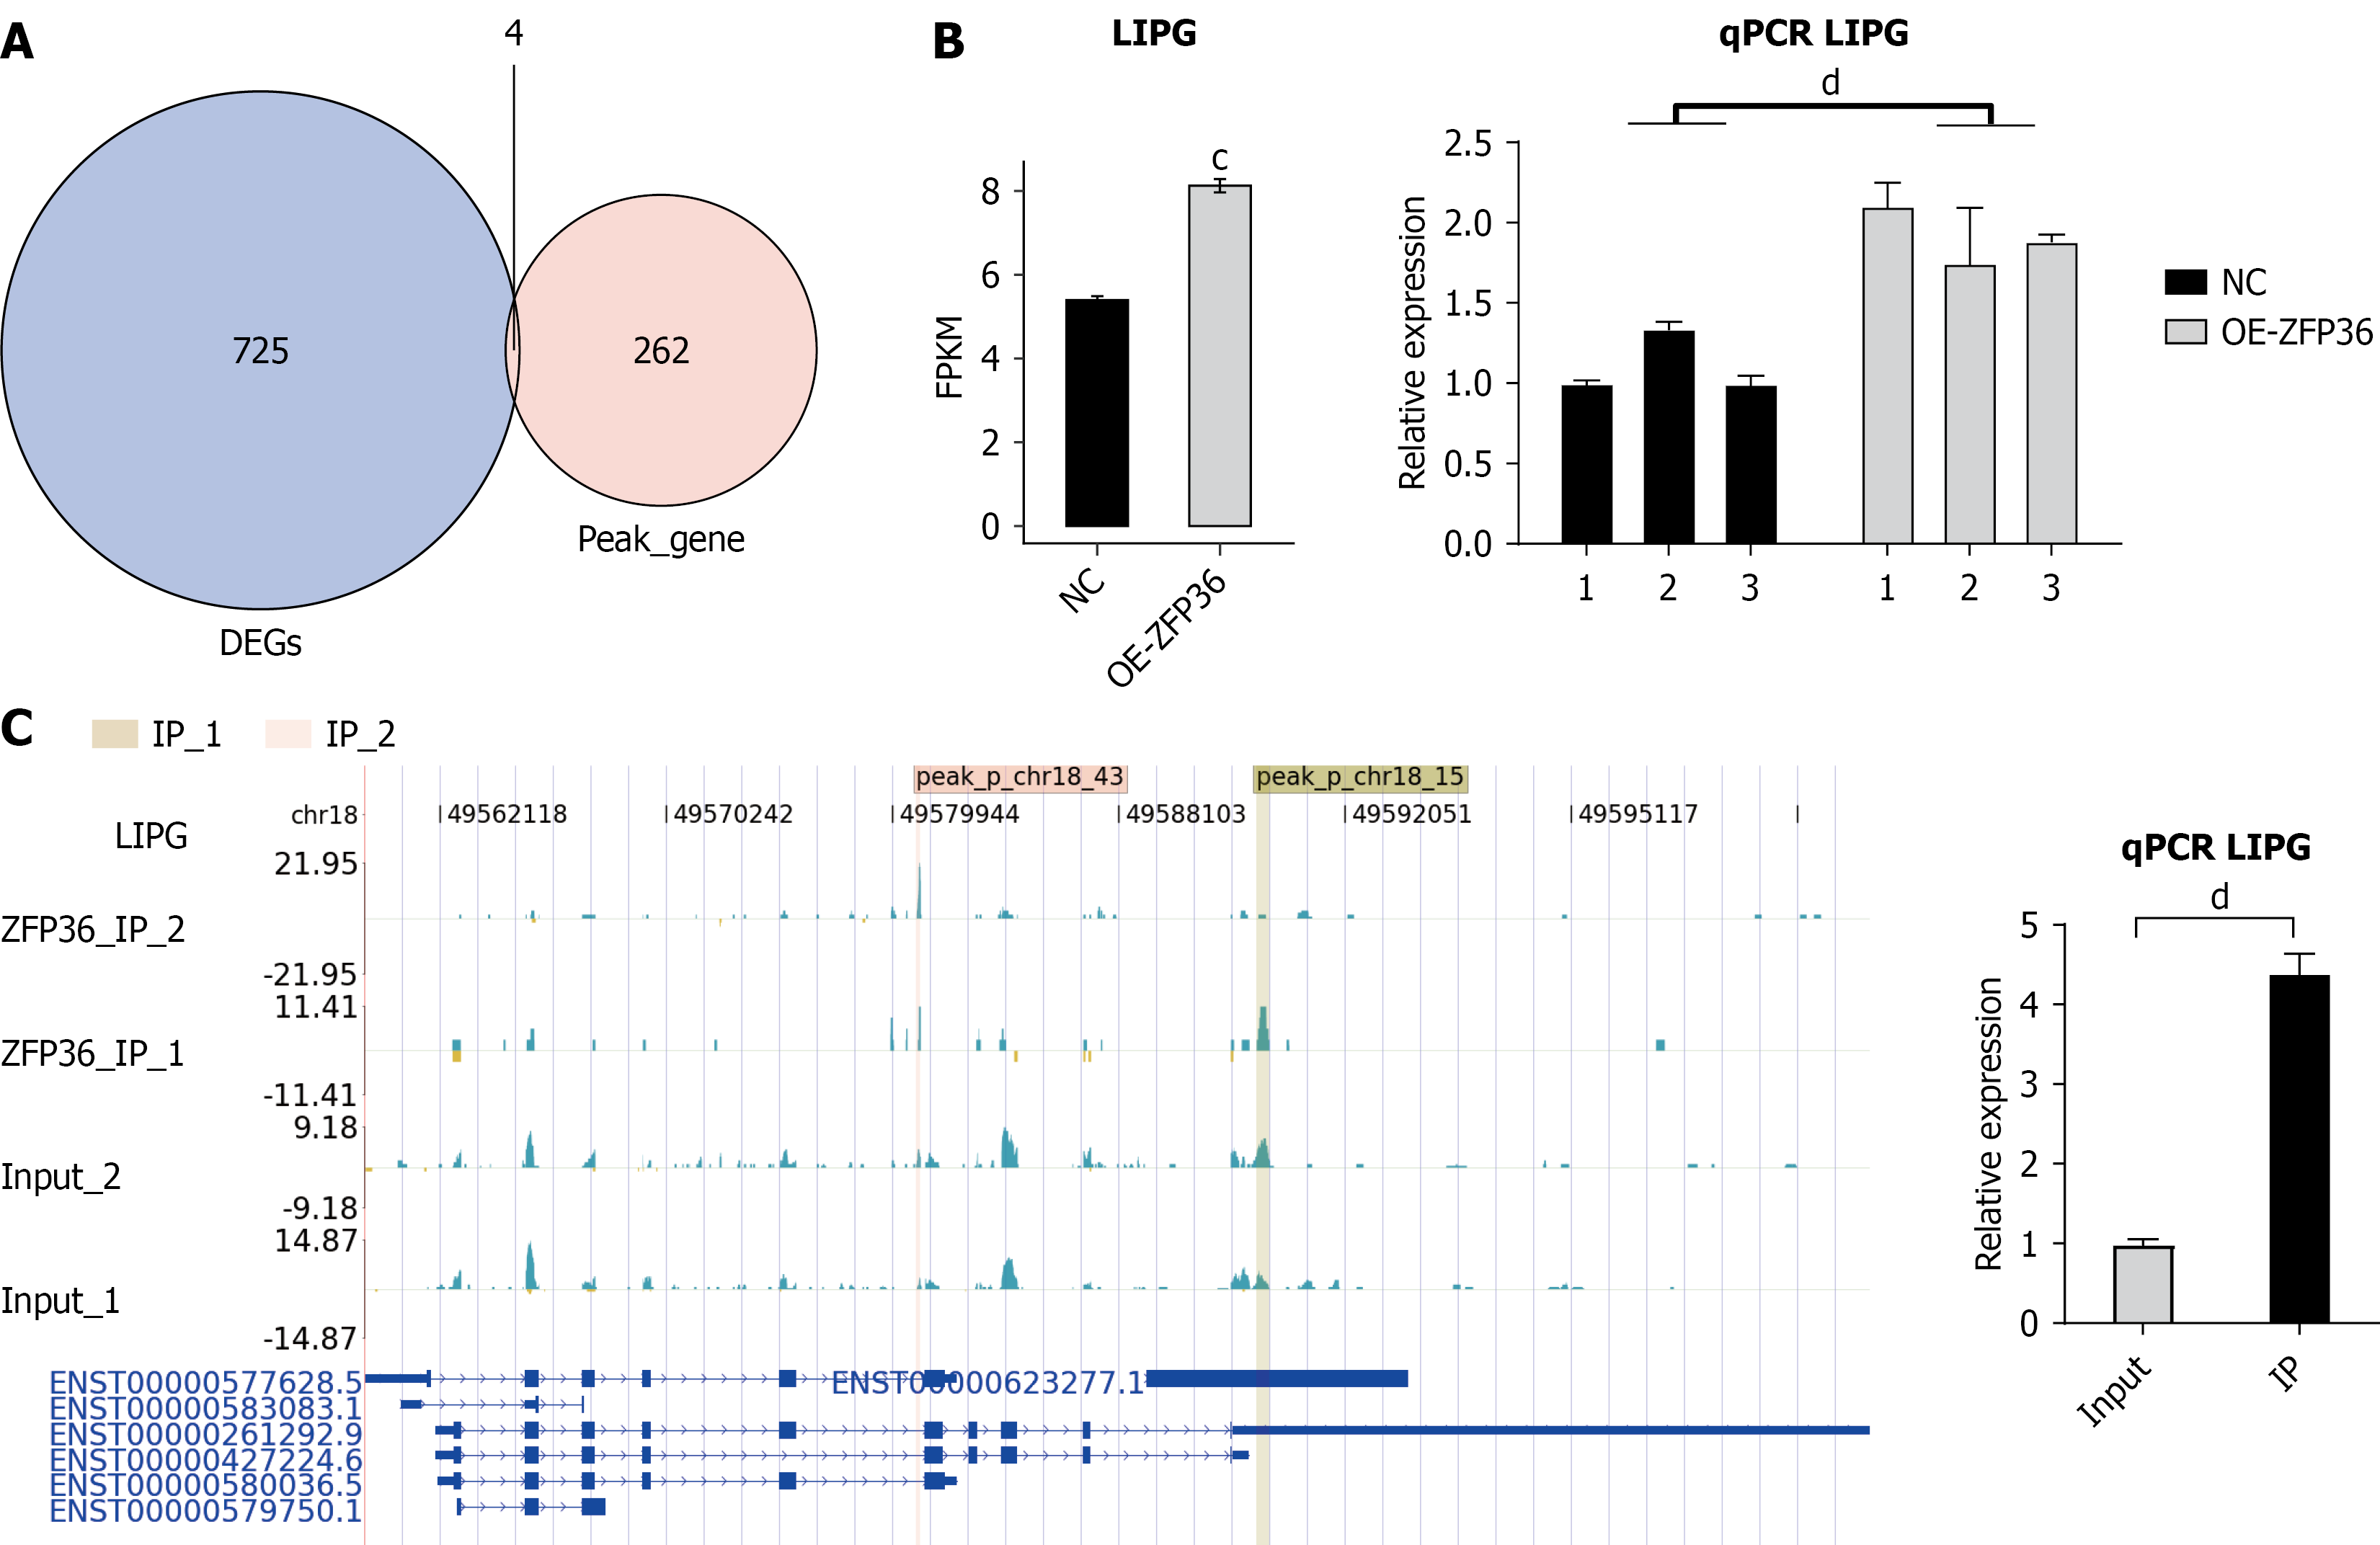
Figure 5 Integrative analysis of ZFP36-bound RNAs and differentially expressed genes.
A: Venn diagram illustrating overlap between ZFP36 peak-associated genes and differentially expressed genes; B: Lipase G (LIPG) expression patterns and statistical differences derived from RNA sequencing and reverse transcription-quantitative polymerase chain reaction validation are shown via bar plot; C: ZFP36 binding peaks within the LIPG gene. Left panel: Read density distribution of ZFP36-binding peaks across LIPG. Right panel: RNA immunoprecipitation-quantitative polymerase chain reaction quantification of LIPG expression based on improved RNA immunoprecipitation sequencing data. cP < 0.001, dP < 0.0001. DEG: Differentially expressed gene; LIPG: Lipase G; FPKM: Fragments per kilobase of transcript per million mapped reads; NC: Negative control; OE: Overexpression; qPCR: Quantitative polymerase chain reaction.
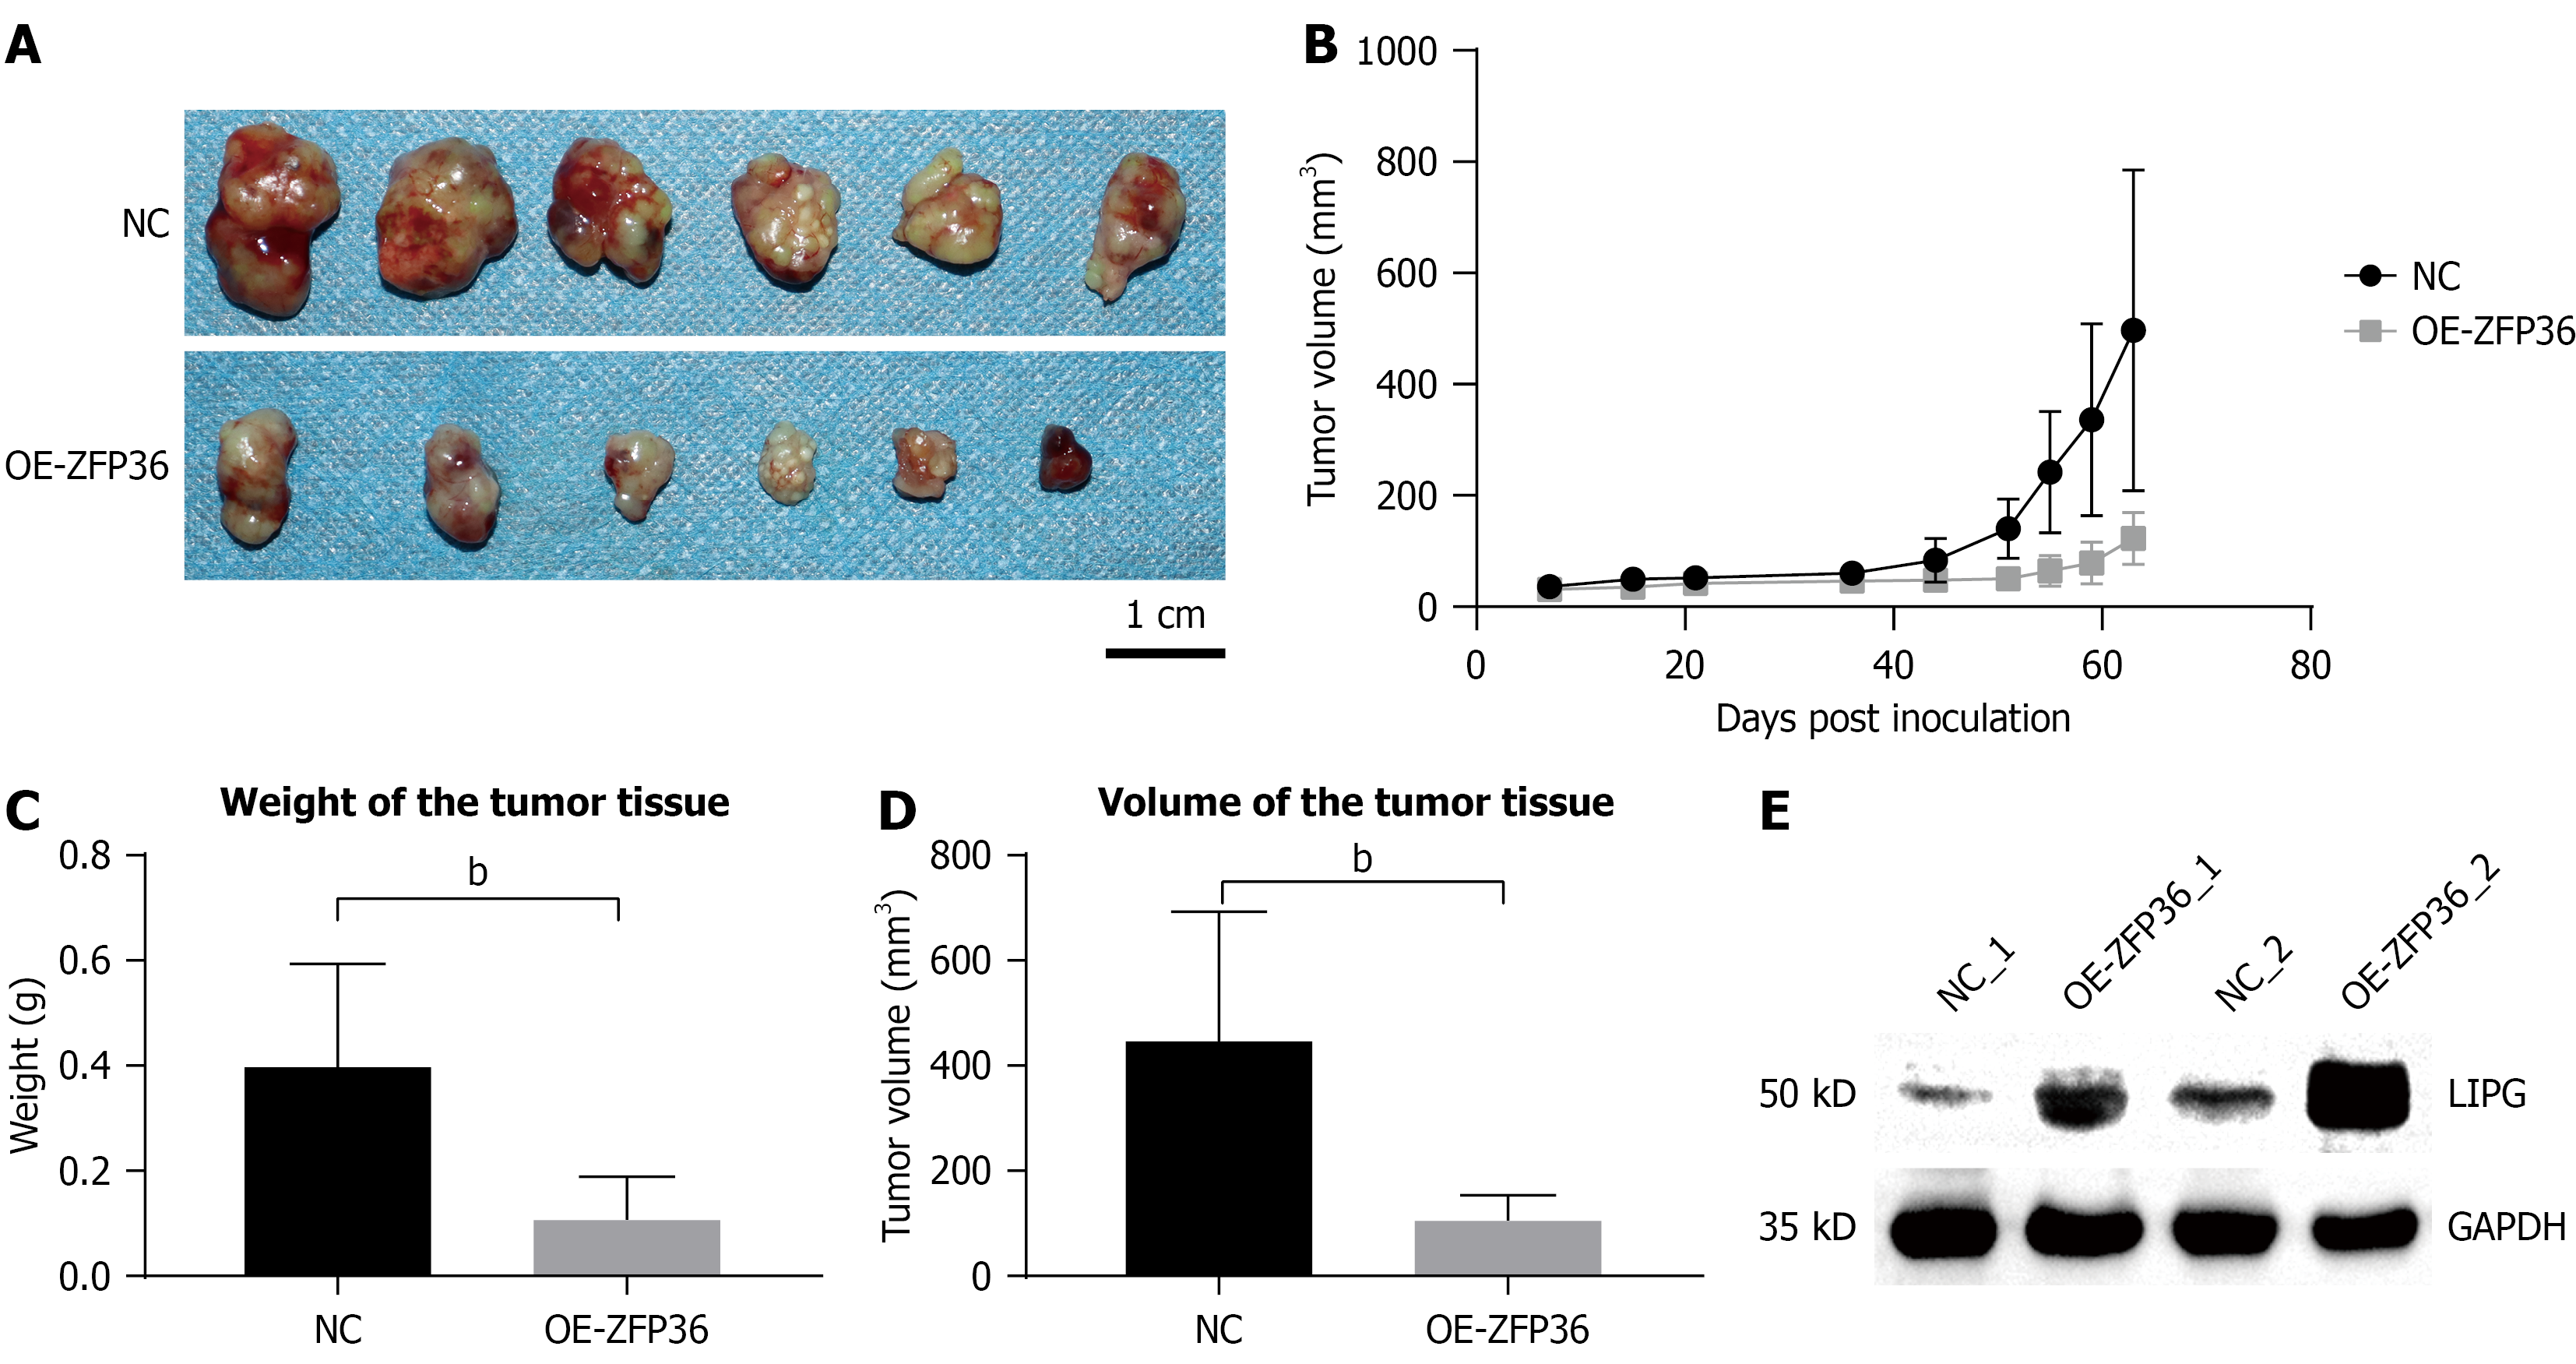
Figure 6 ZFP36 inhibited tumor growth in vivo.
A: Xenografts were established in nude mice using AGS cells and resected 63 days post-induction; B: Tumor volumes were calculated at indicated time points (days 7, 15, 21, 36, 44, 51, 55, 59, and 63) using the formula: V = (L × S2)/2, where L = long diameter and S = short diameter; C: Xenograft weights were measured following resection; D: Resected tumor volumes were quantified; E: Lipase G protein expression levels in xenograft tissues were assessed. bP < 0.01. LIPG: Lipase G; NC: Negative control; OE: Overexpression.
- Citation: Yu PJ, Zhu SM, Cai BJ, Ma XM, Qiao WJ, Han JJ, Zhang CW. Zfp36 zinc finger CCCH-type inhibits gastric cancer progression by upregulating lipase G and binding its 3’ untranslated region. World J Gastroenterol 2026; 32(47): 122668
- URL: https://www.wjgnet.com/1007-9327/full/v32/i47/122668.htm
- DOI: https://dx.doi.org/10.3748/wjg.122668