
















Copyright: ©Author(s) 2026.
World J Gastroenterol. Dec 21, 2026; 32(47): 121762
Published online Dec 21, 2026. doi: 10.3748/wjg.121762
Published online Dec 21, 2026. doi: 10.3748/wjg.121762
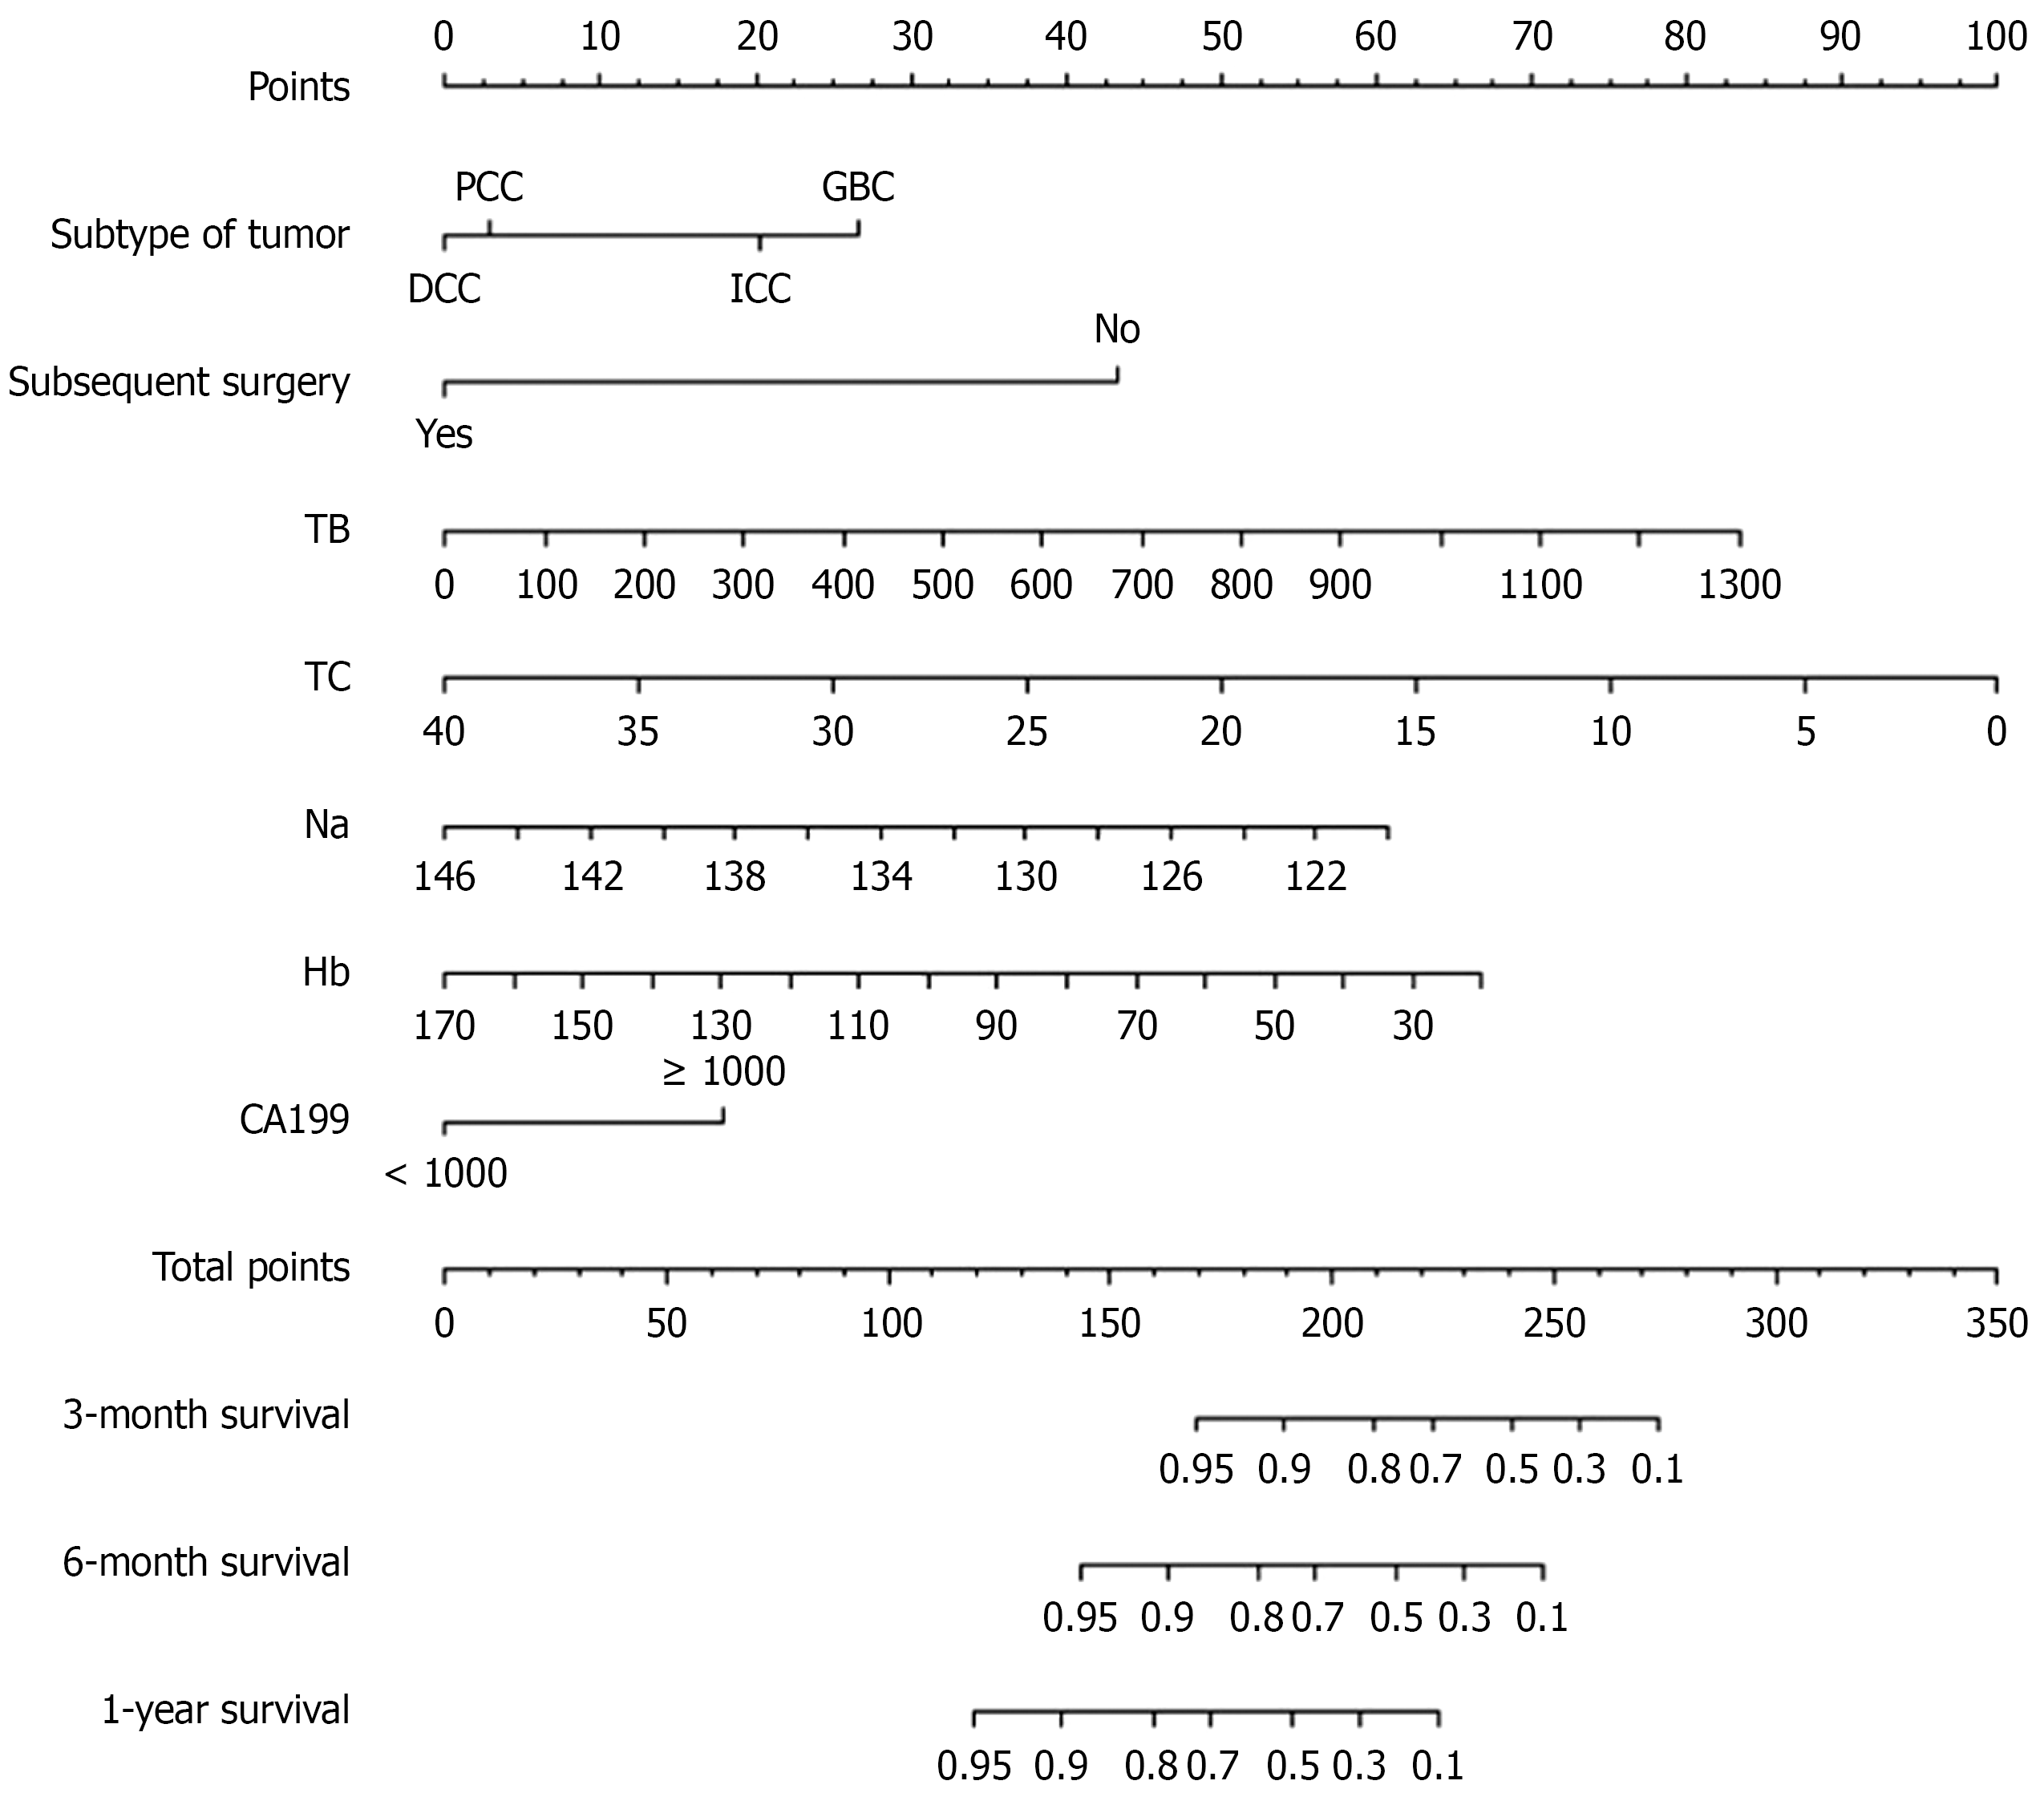
Figure 1 The modified Clinical Outcomes of Malignant biliary obstruction-Biliary tract cancer Survival nomogram for survival prediction.
This nomogram was based on seven clinical predictors. To utilize these nomograms, the values of individual patients are plotted on each variable axis, with lines drawn to indicate the number of points assigned to each variable value. The sum of these numerical values is plotted on the total score axis, and three downward lines are drawn to the risk axis to determine the survival probabilities at 3-month, 6-month, and 1-year. PCC: Perihilar cholangiocarcinoma; DCC: Distal cho
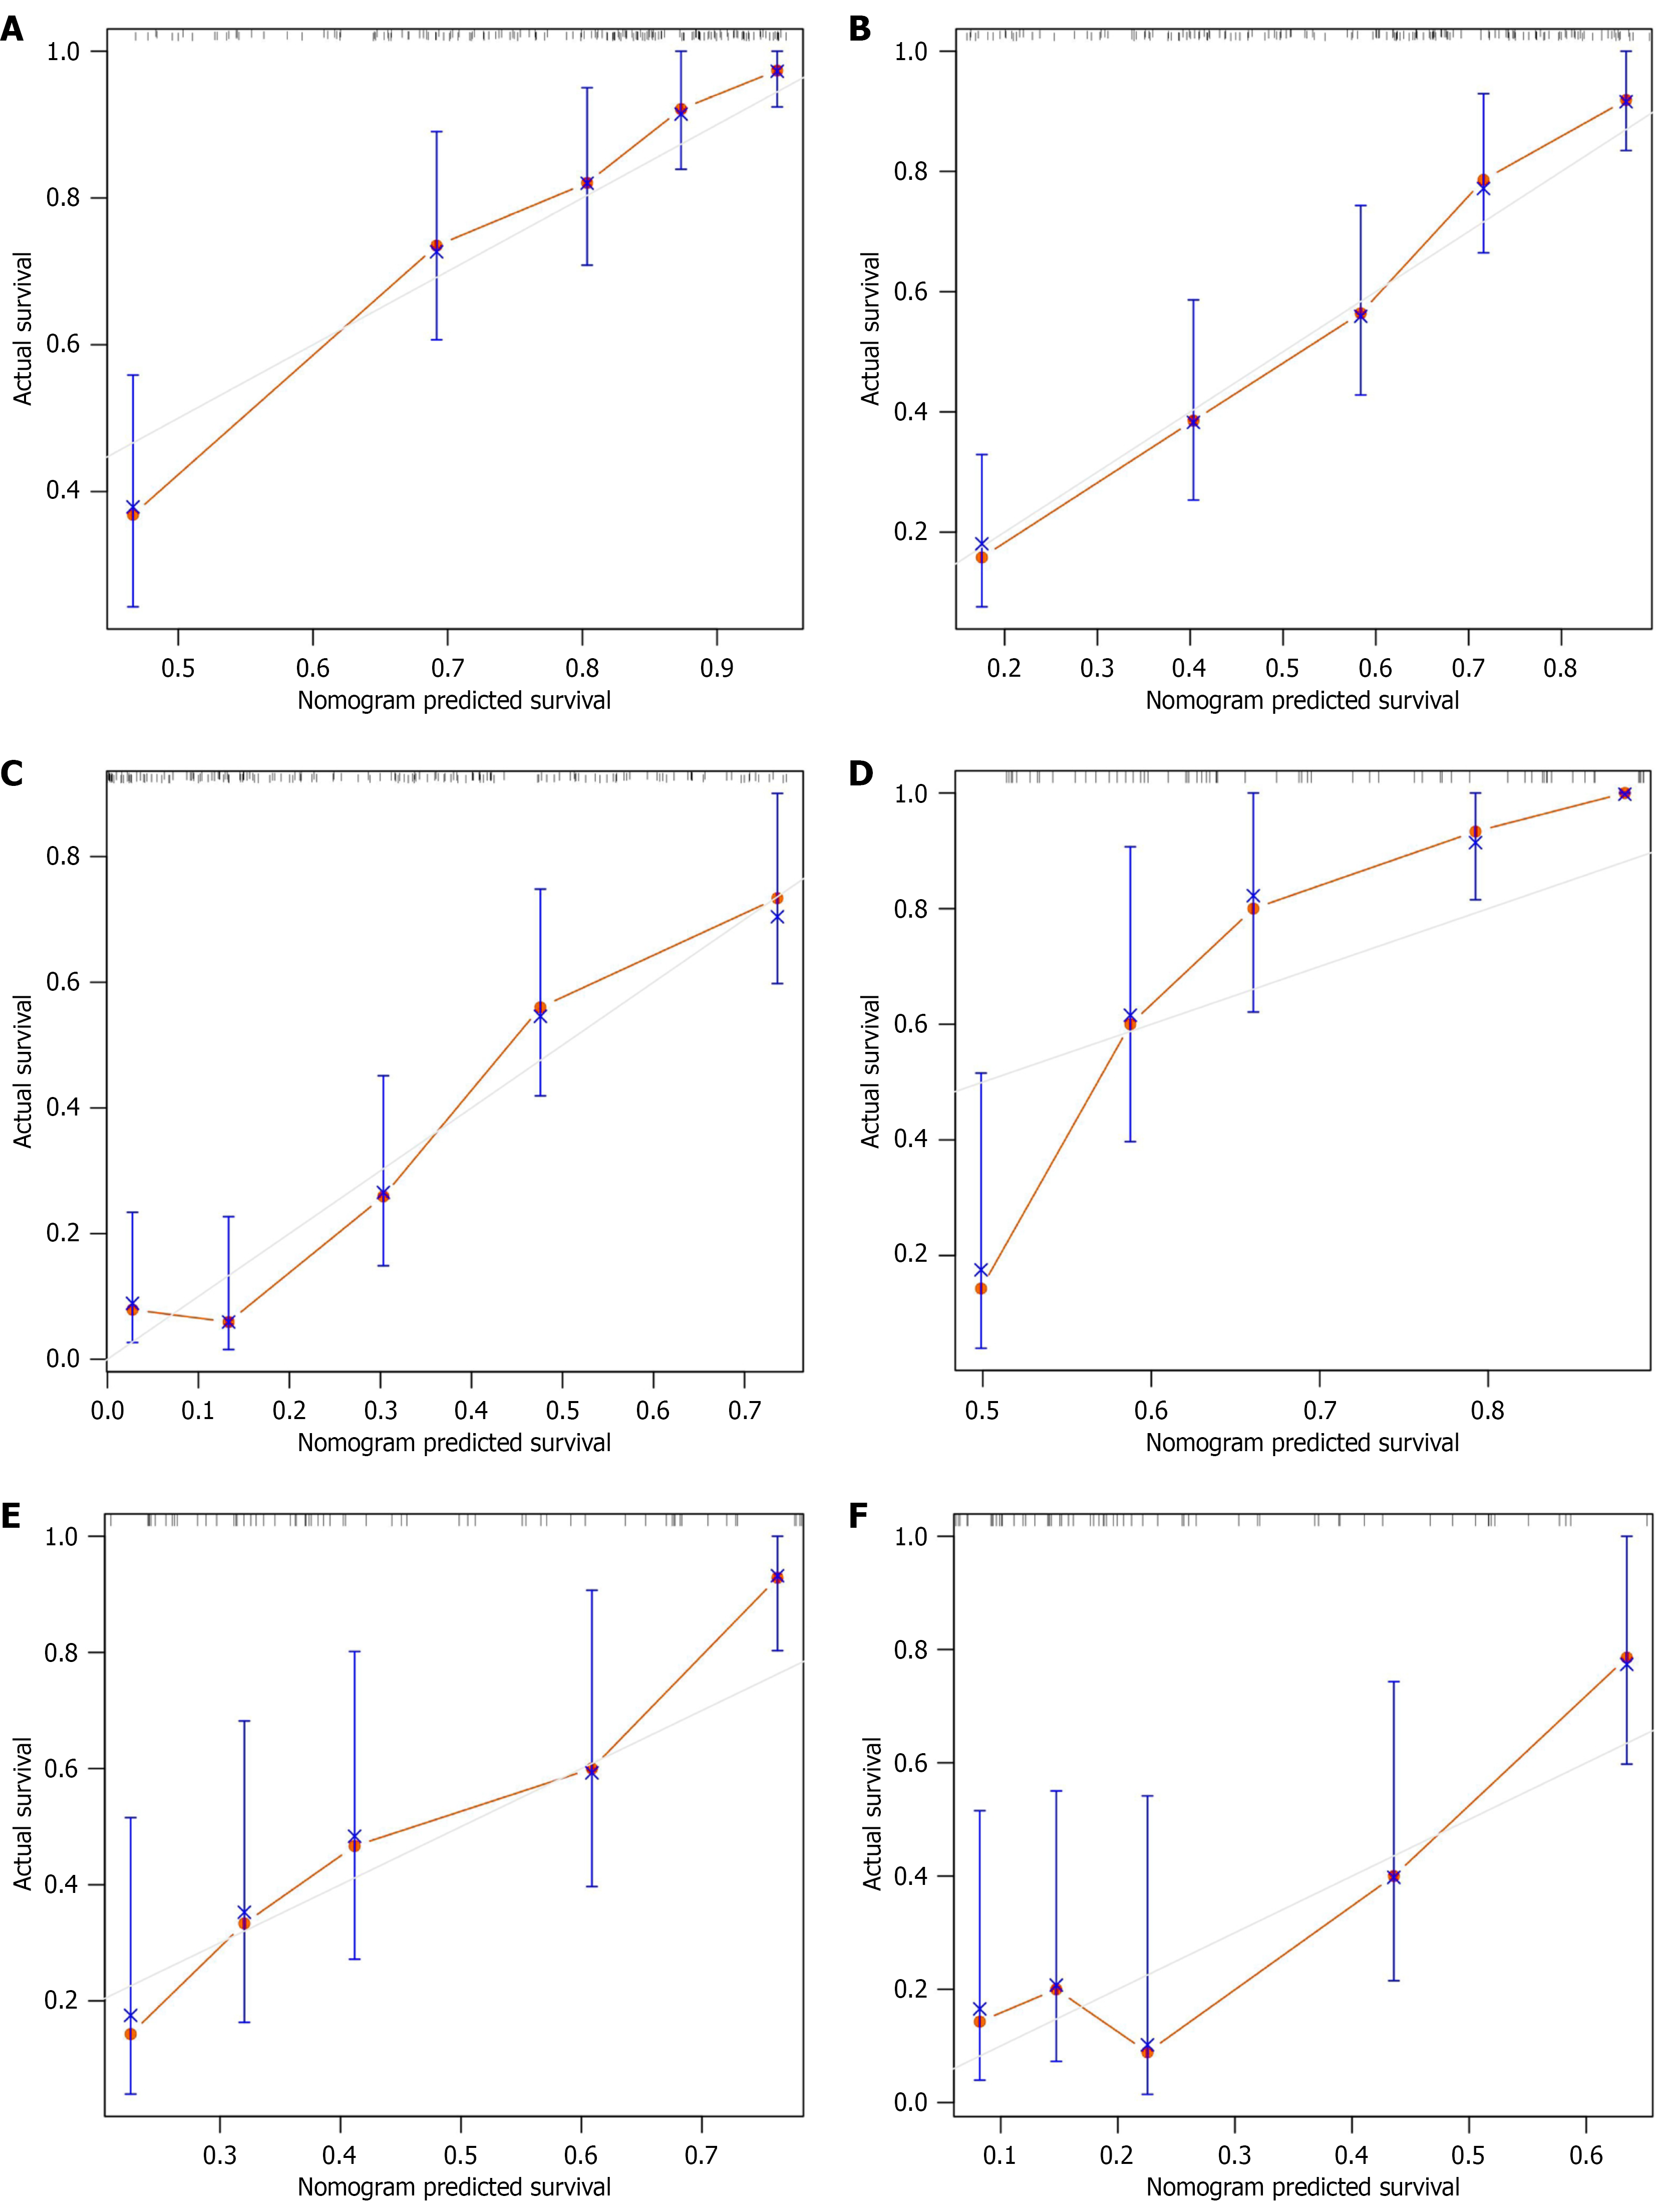
Figure 2 The calibration curve of actual survival and predicted survival.
A: 3-month overall survival (OS) of the training group; B: 6-month OS of the training group; C: 1-year OS of the training group; D: 3-month OS of the validation group; E: 6-month OS of the validation group; F: 1-year OS of the validation group.
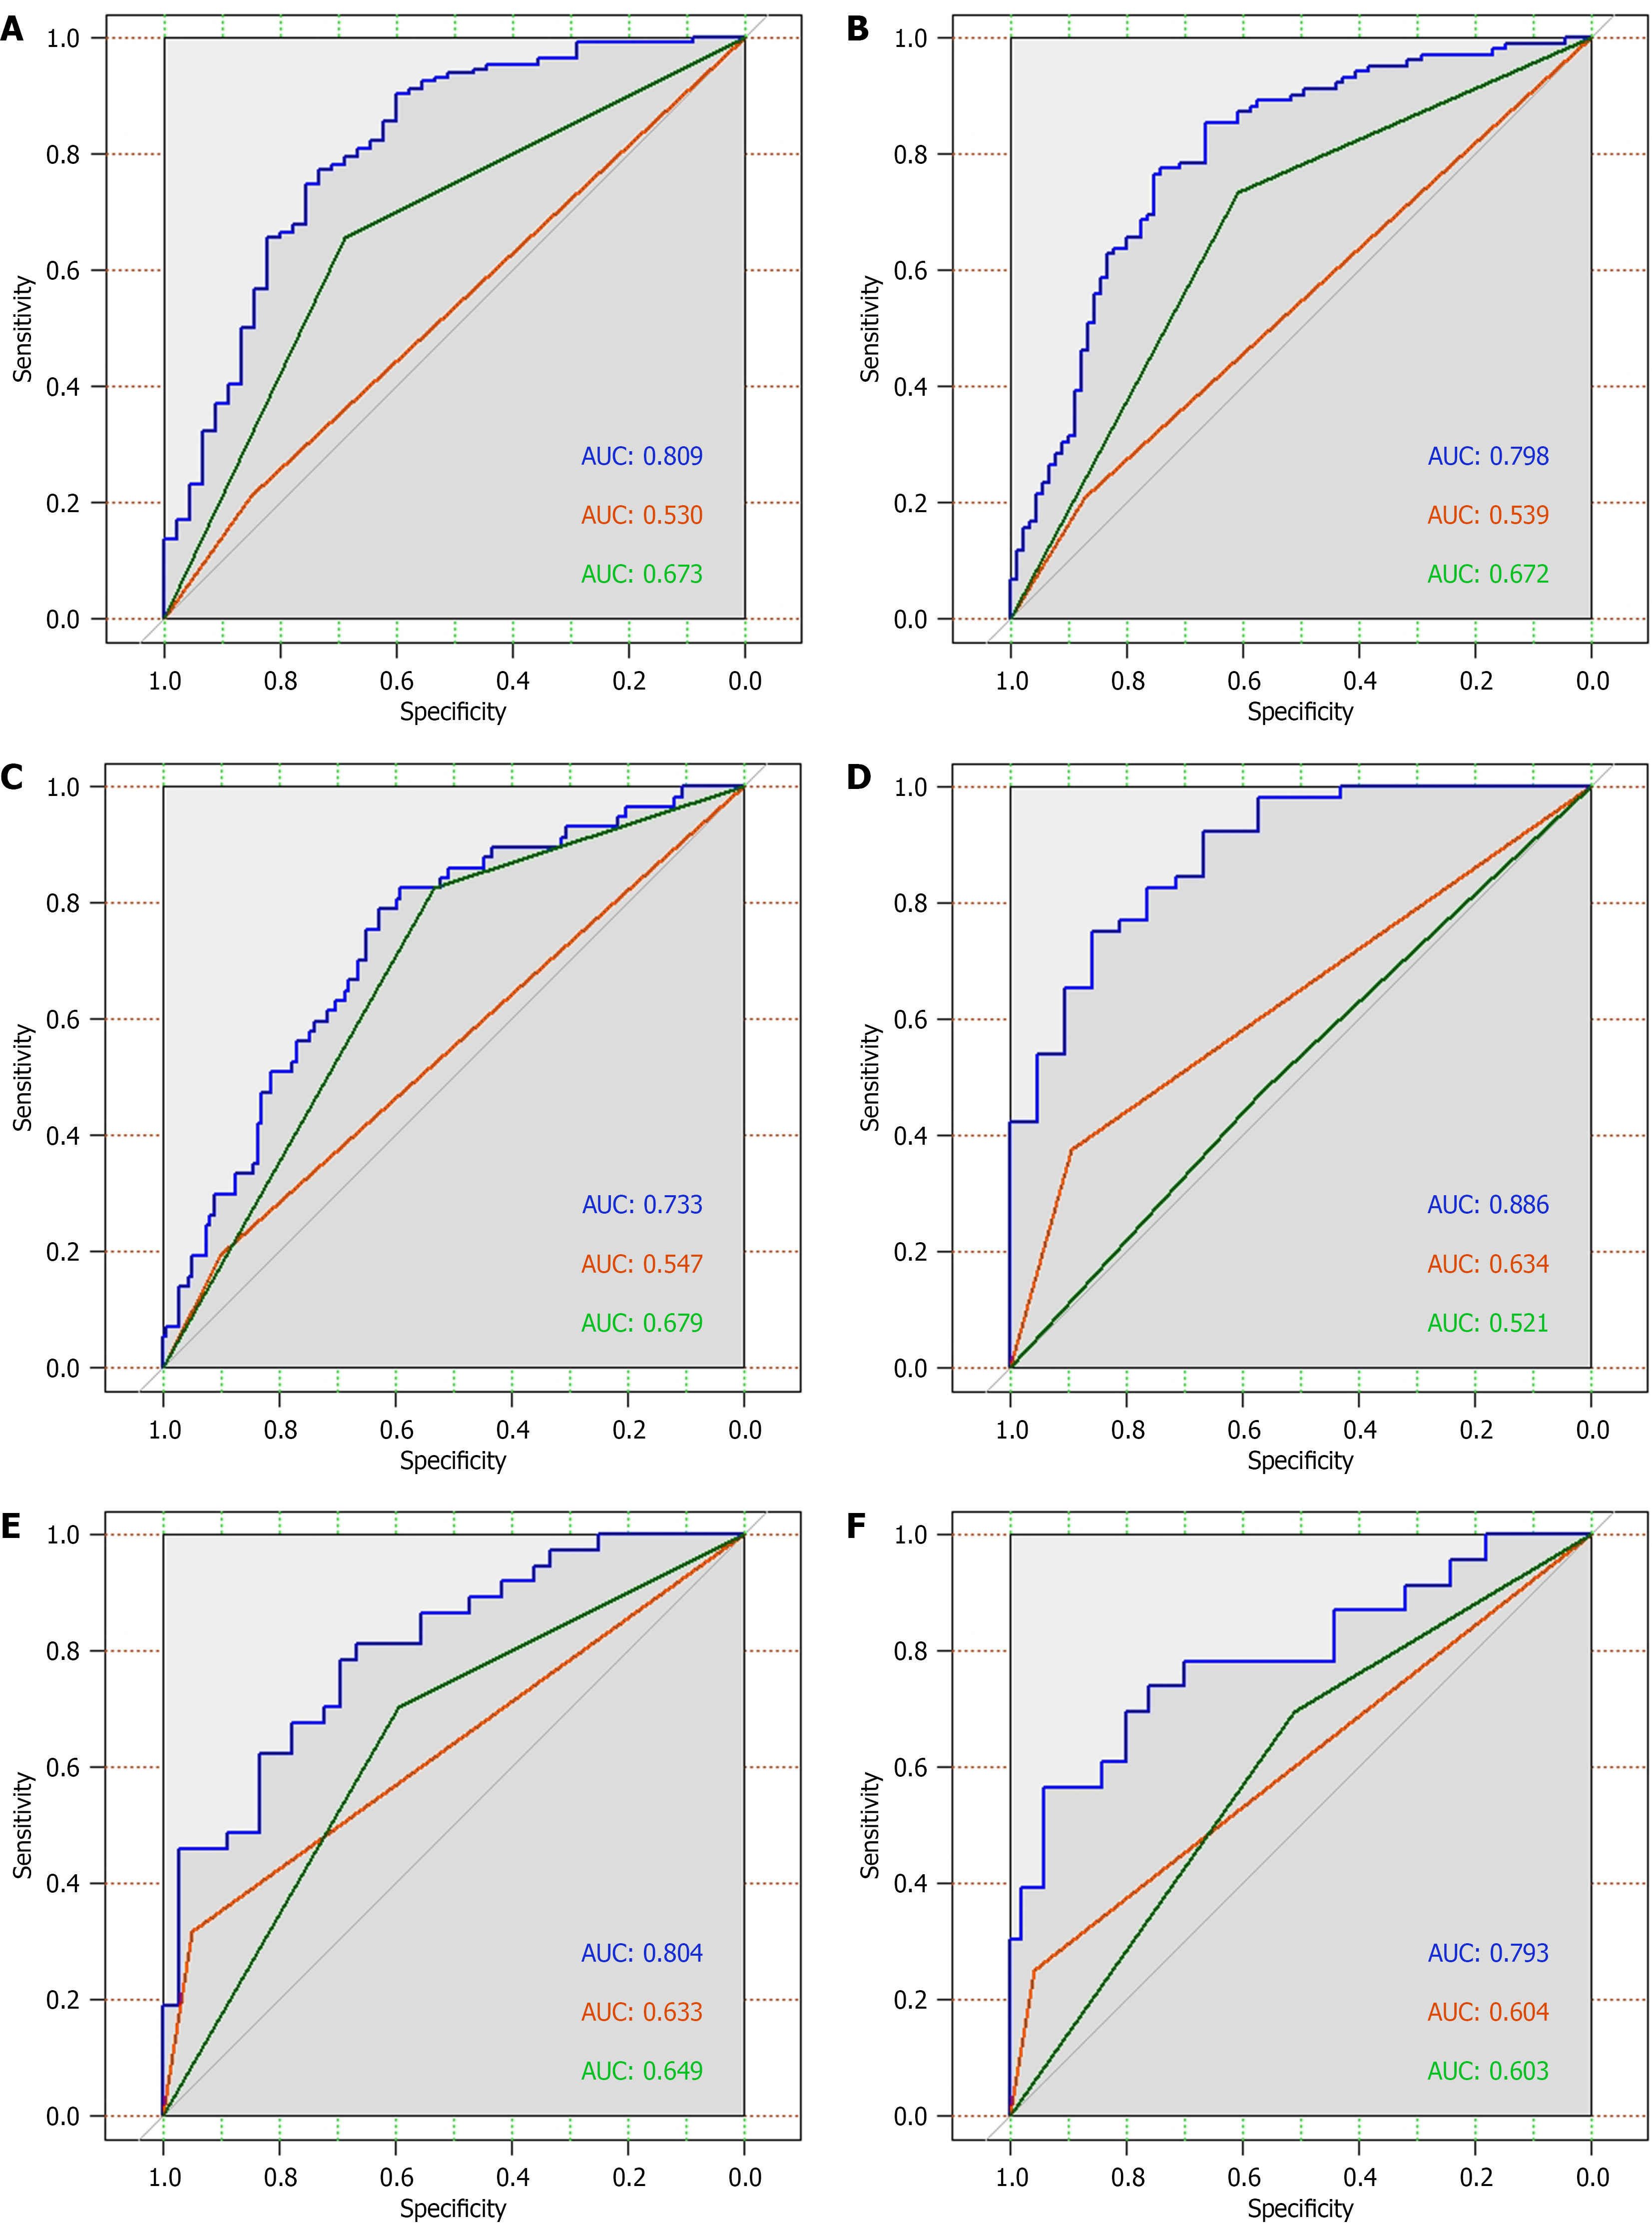
Figure 3 The area under the curve values from the receiver operating characteristic analyses of the modified Clinical Outcomes of Ma
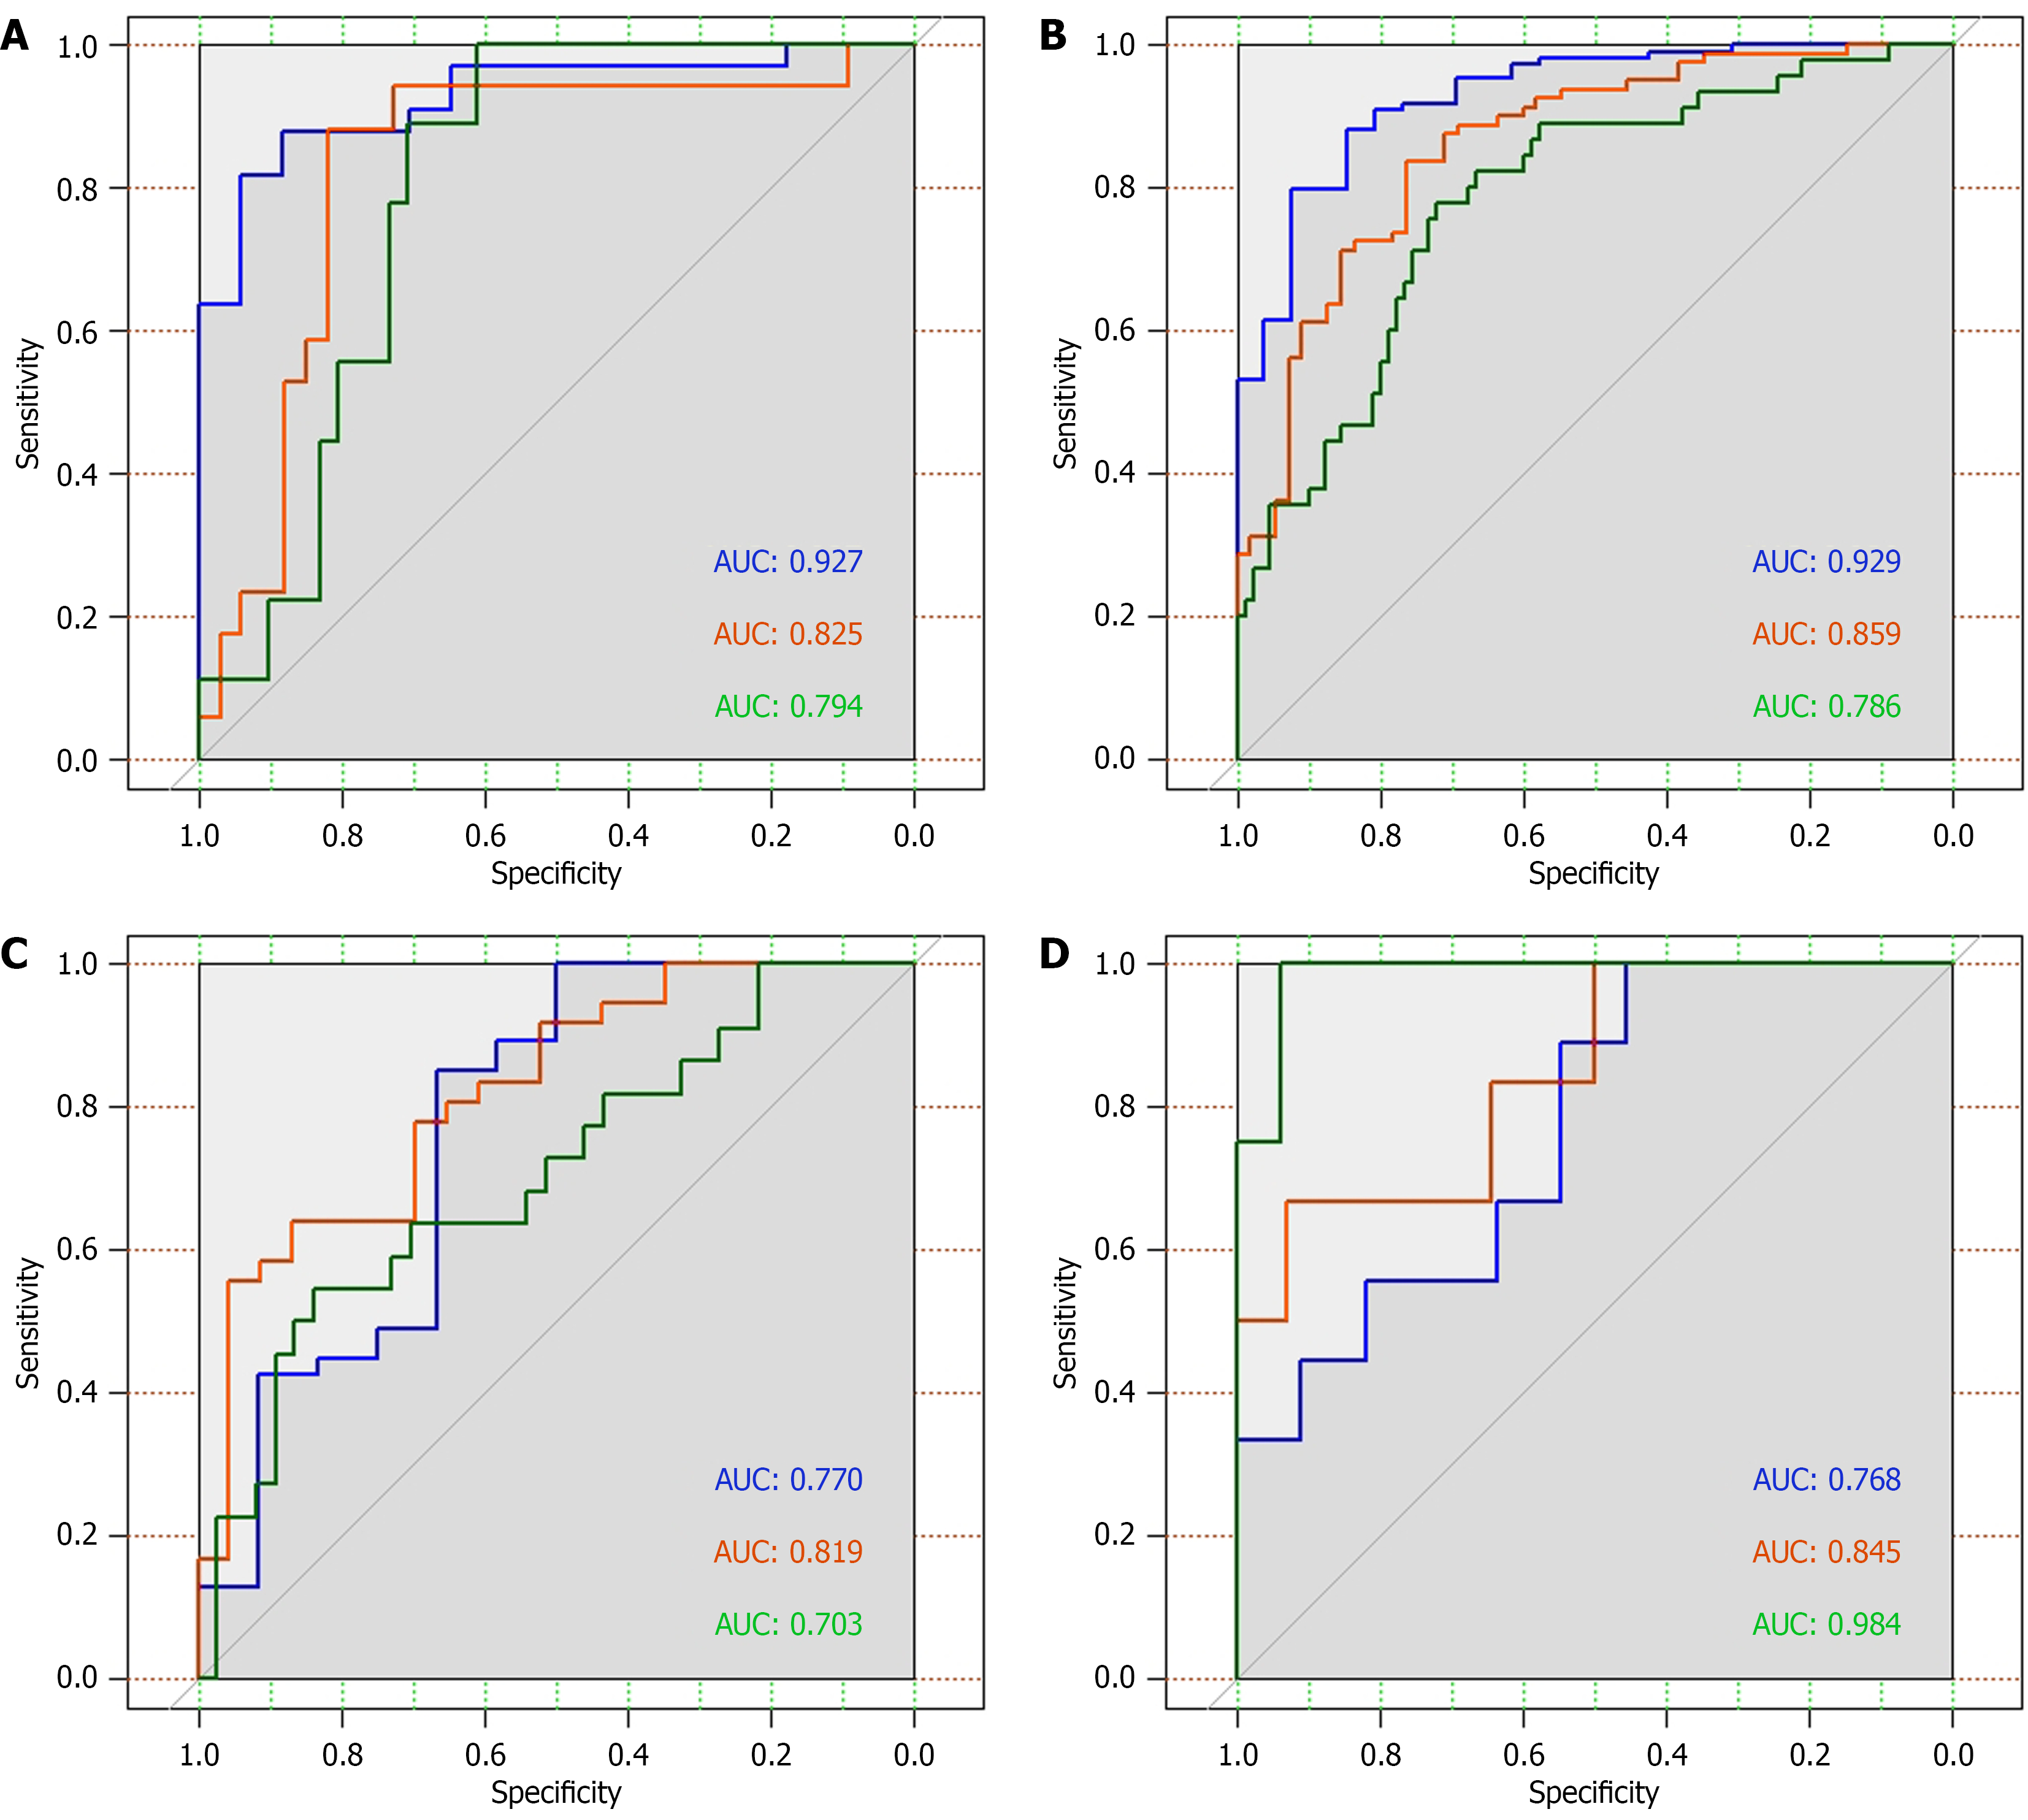
Figure 4 The area under the curve values from the receiver operating characteristic analyses in different tumor subtypes.
A: Intrahepatic cholangiocarcinoma; B: Perihilar cholangiocarcinoma; C: Distal cholangiocarcinoma; D: Gallbladder carcinoma. The blue curve predicted the 3-month overall survival (OS), the orange curve predicted the 6-month OS, and the green curve predicted the 1-year OS. AUC: Area under the curve.
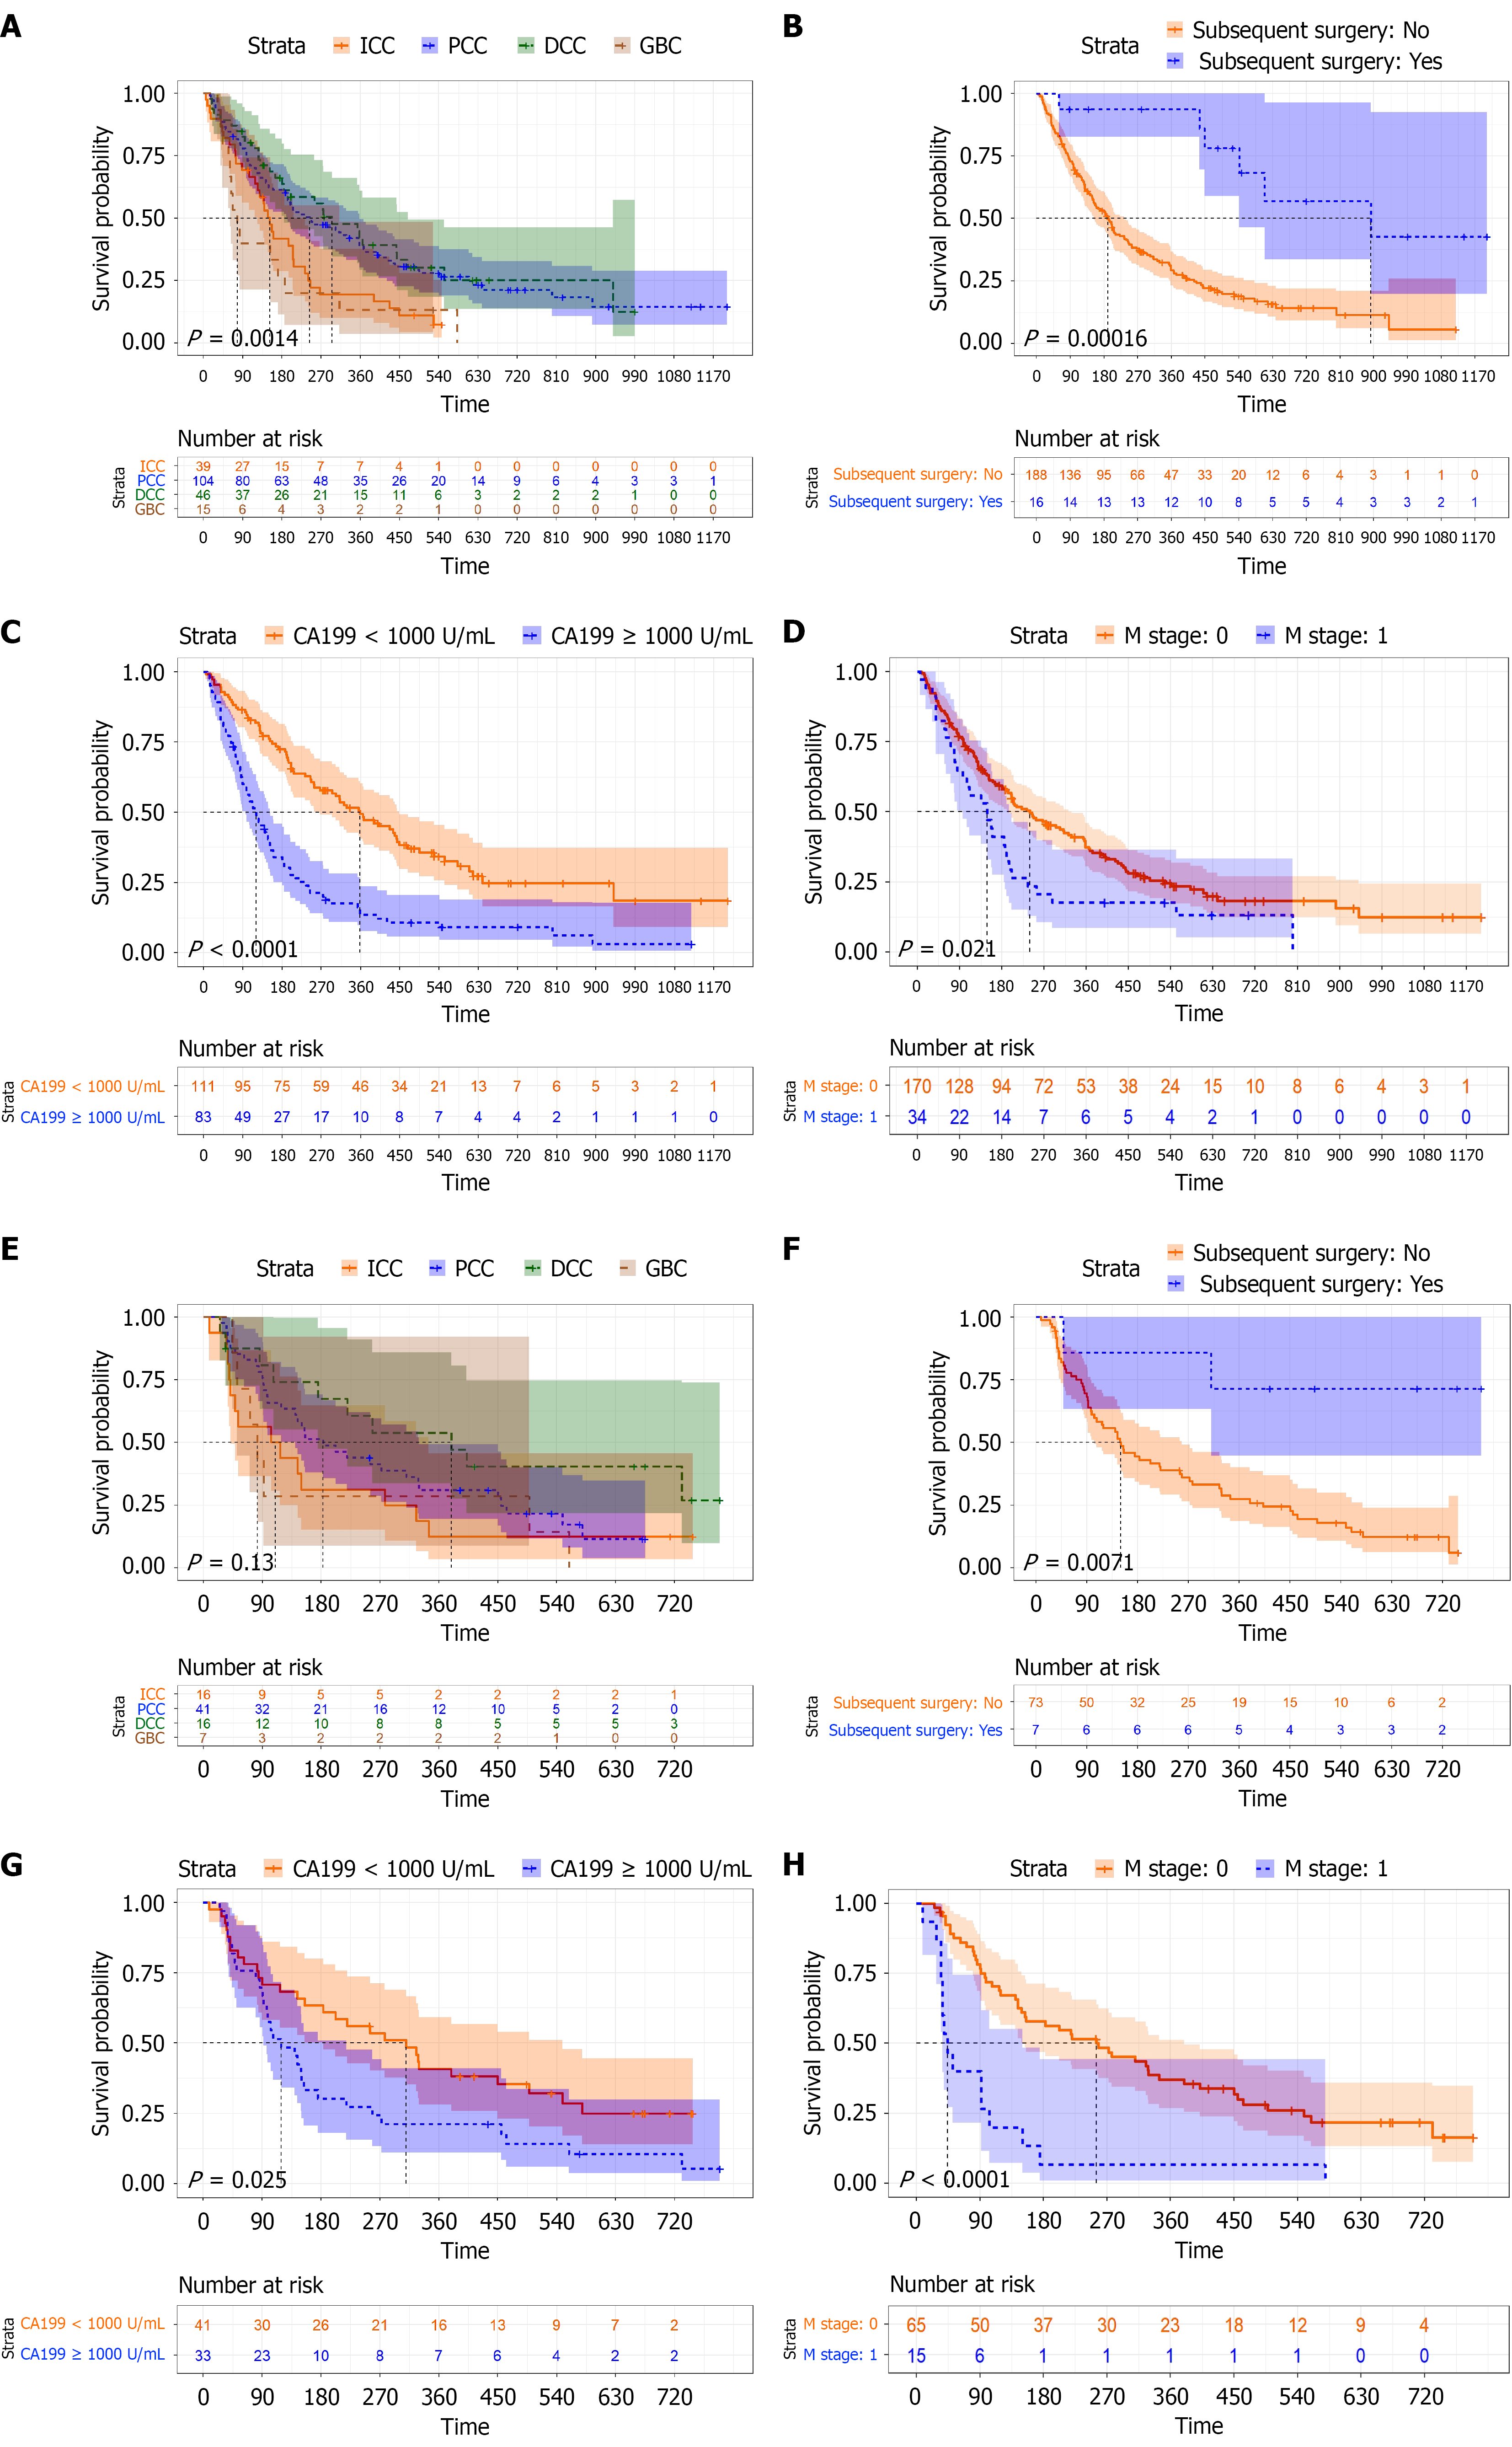
Figure 5 The Kaplan-Meier analyses with the log-rank test in different subgroups with different survival.
A: Tumor subtypes in the training group; B: Subsequent surgery in the training group; C: Carbohydrate antigen 19-9 (CA19-9) in the training group; D: M stage in the training group; E: Tumor subtypes in the validation group; F: Subsequent surgery in the validation group; G: CA19-9 in the validation group; H: M stage in the validation group. ICC: Intrahepatic cho
- Citation: Zhang YZ, Tang YZ, Pan ST, He YX, Dai HC, Zhou WZ, Zhou HF. Survival prediction for patients with malignant biliary obstruction caused by biliary tract cancer undergoing percutaneous biliary decompression. World J Gastroenterol 2026; 32(47): 121762
- URL: https://www.wjgnet.com/1007-9327/full/v32/i47/121762.htm
- DOI: https://dx.doi.org/10.3748/wjg.121762