
















Copyright: ©Author(s) 2026.
World J Gastroenterol. Dec 21, 2026; 32(47): 121435
Published online Dec 21, 2026. doi: 10.3748/wjg.121435
Published online Dec 21, 2026. doi: 10.3748/wjg.121435
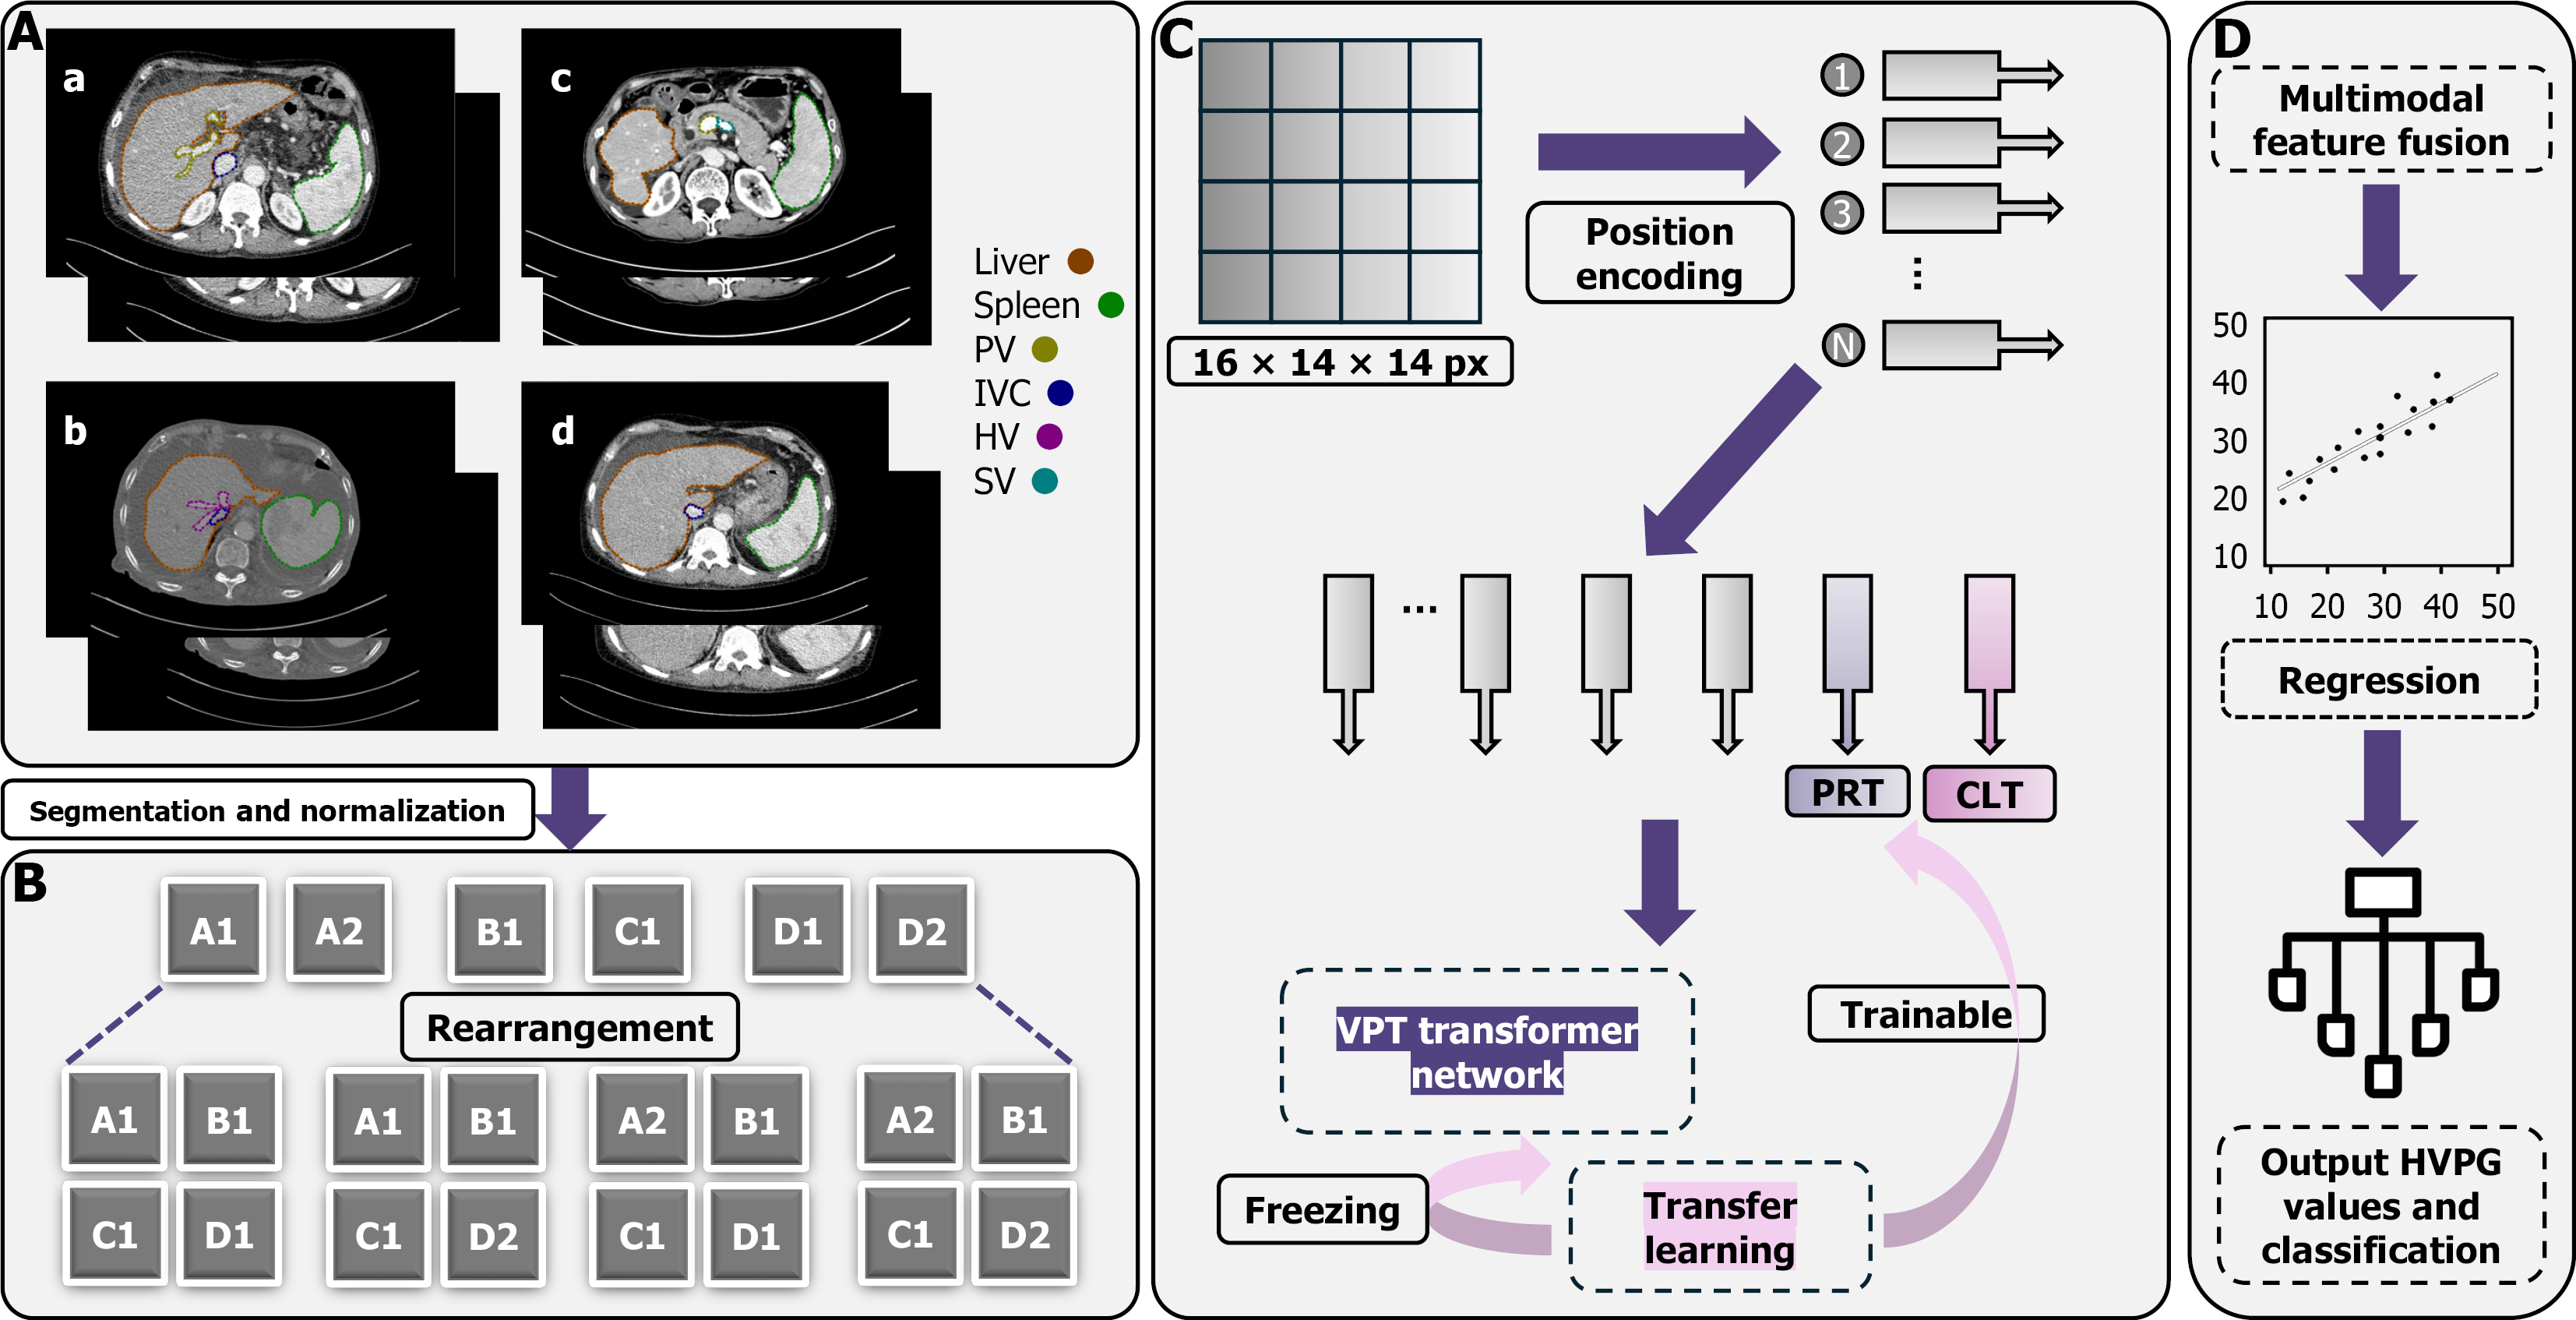
Figure 1 Image pre-processing and model establishment.
A: Region of interests delineation on computed tomography images. a: The first hepatic hilum section; b: The second hepatic hilum section; c: The section of the splenic vein merging into the portal vein; d: The section with the largest spleen area; B: Data rearrangement strategy was adopted by permuting and combining the computed tomography images of four anatomical sections in each patient; C: The pre-processed images were converted into vectors and subjected to the visual prompt tuning transformer network for feature extraction. Transfer learning indicated that the transformer network parameters were frozen and that only the prompt tokens were trainable; D: The extracted feature vectors underwent multimodal feature fusion, regression analysis, and finally output of the predictive hepatic venous pressure gradient values and classification interval. PV: Portal vein; IVC: Inferior vena cava; HV: Hepatic vein; SV: Splenic vein; PRT: Prompt token; CLT: Class token; VPT: Visual prompt tuning; HVPG: Hepatic venous pressure gradient.
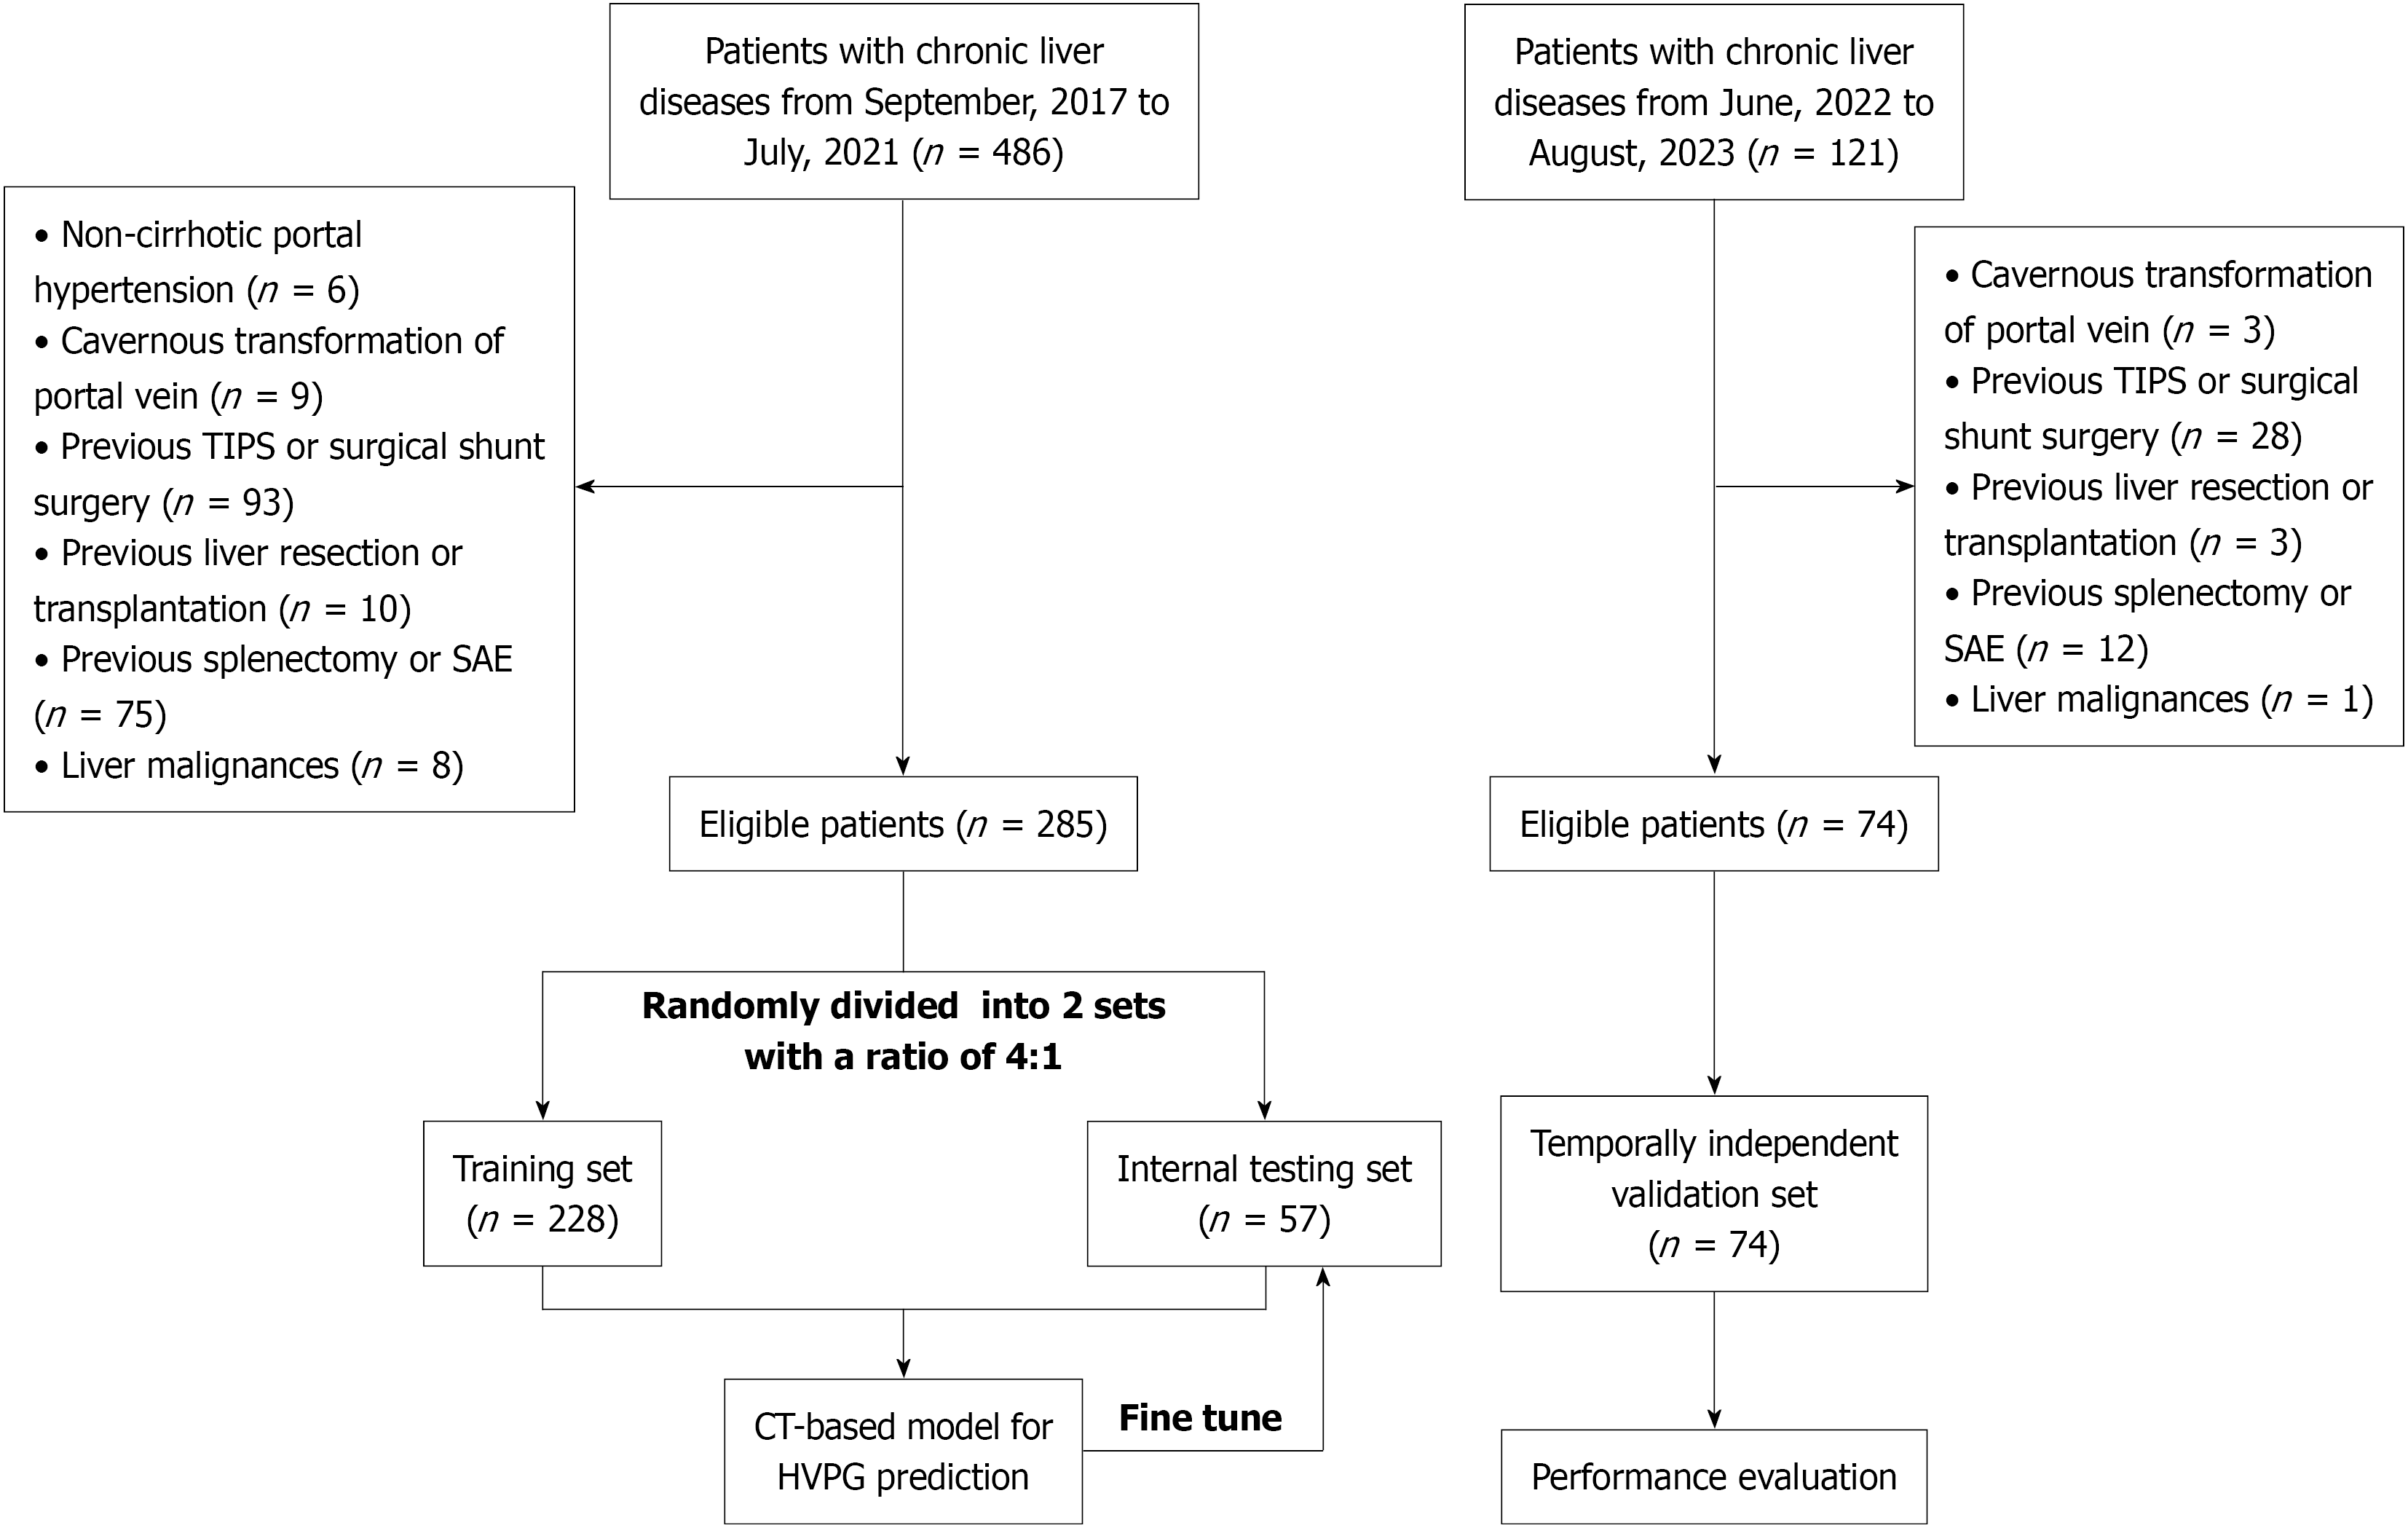
Figure 2 Flowchart of the study.
TIPS: Transjugular intrahepatic portosystemic shunt; SAE: Splenic artery embolization; CT: Computed tomography; HVPG: Hepatic venous pressure gradient.
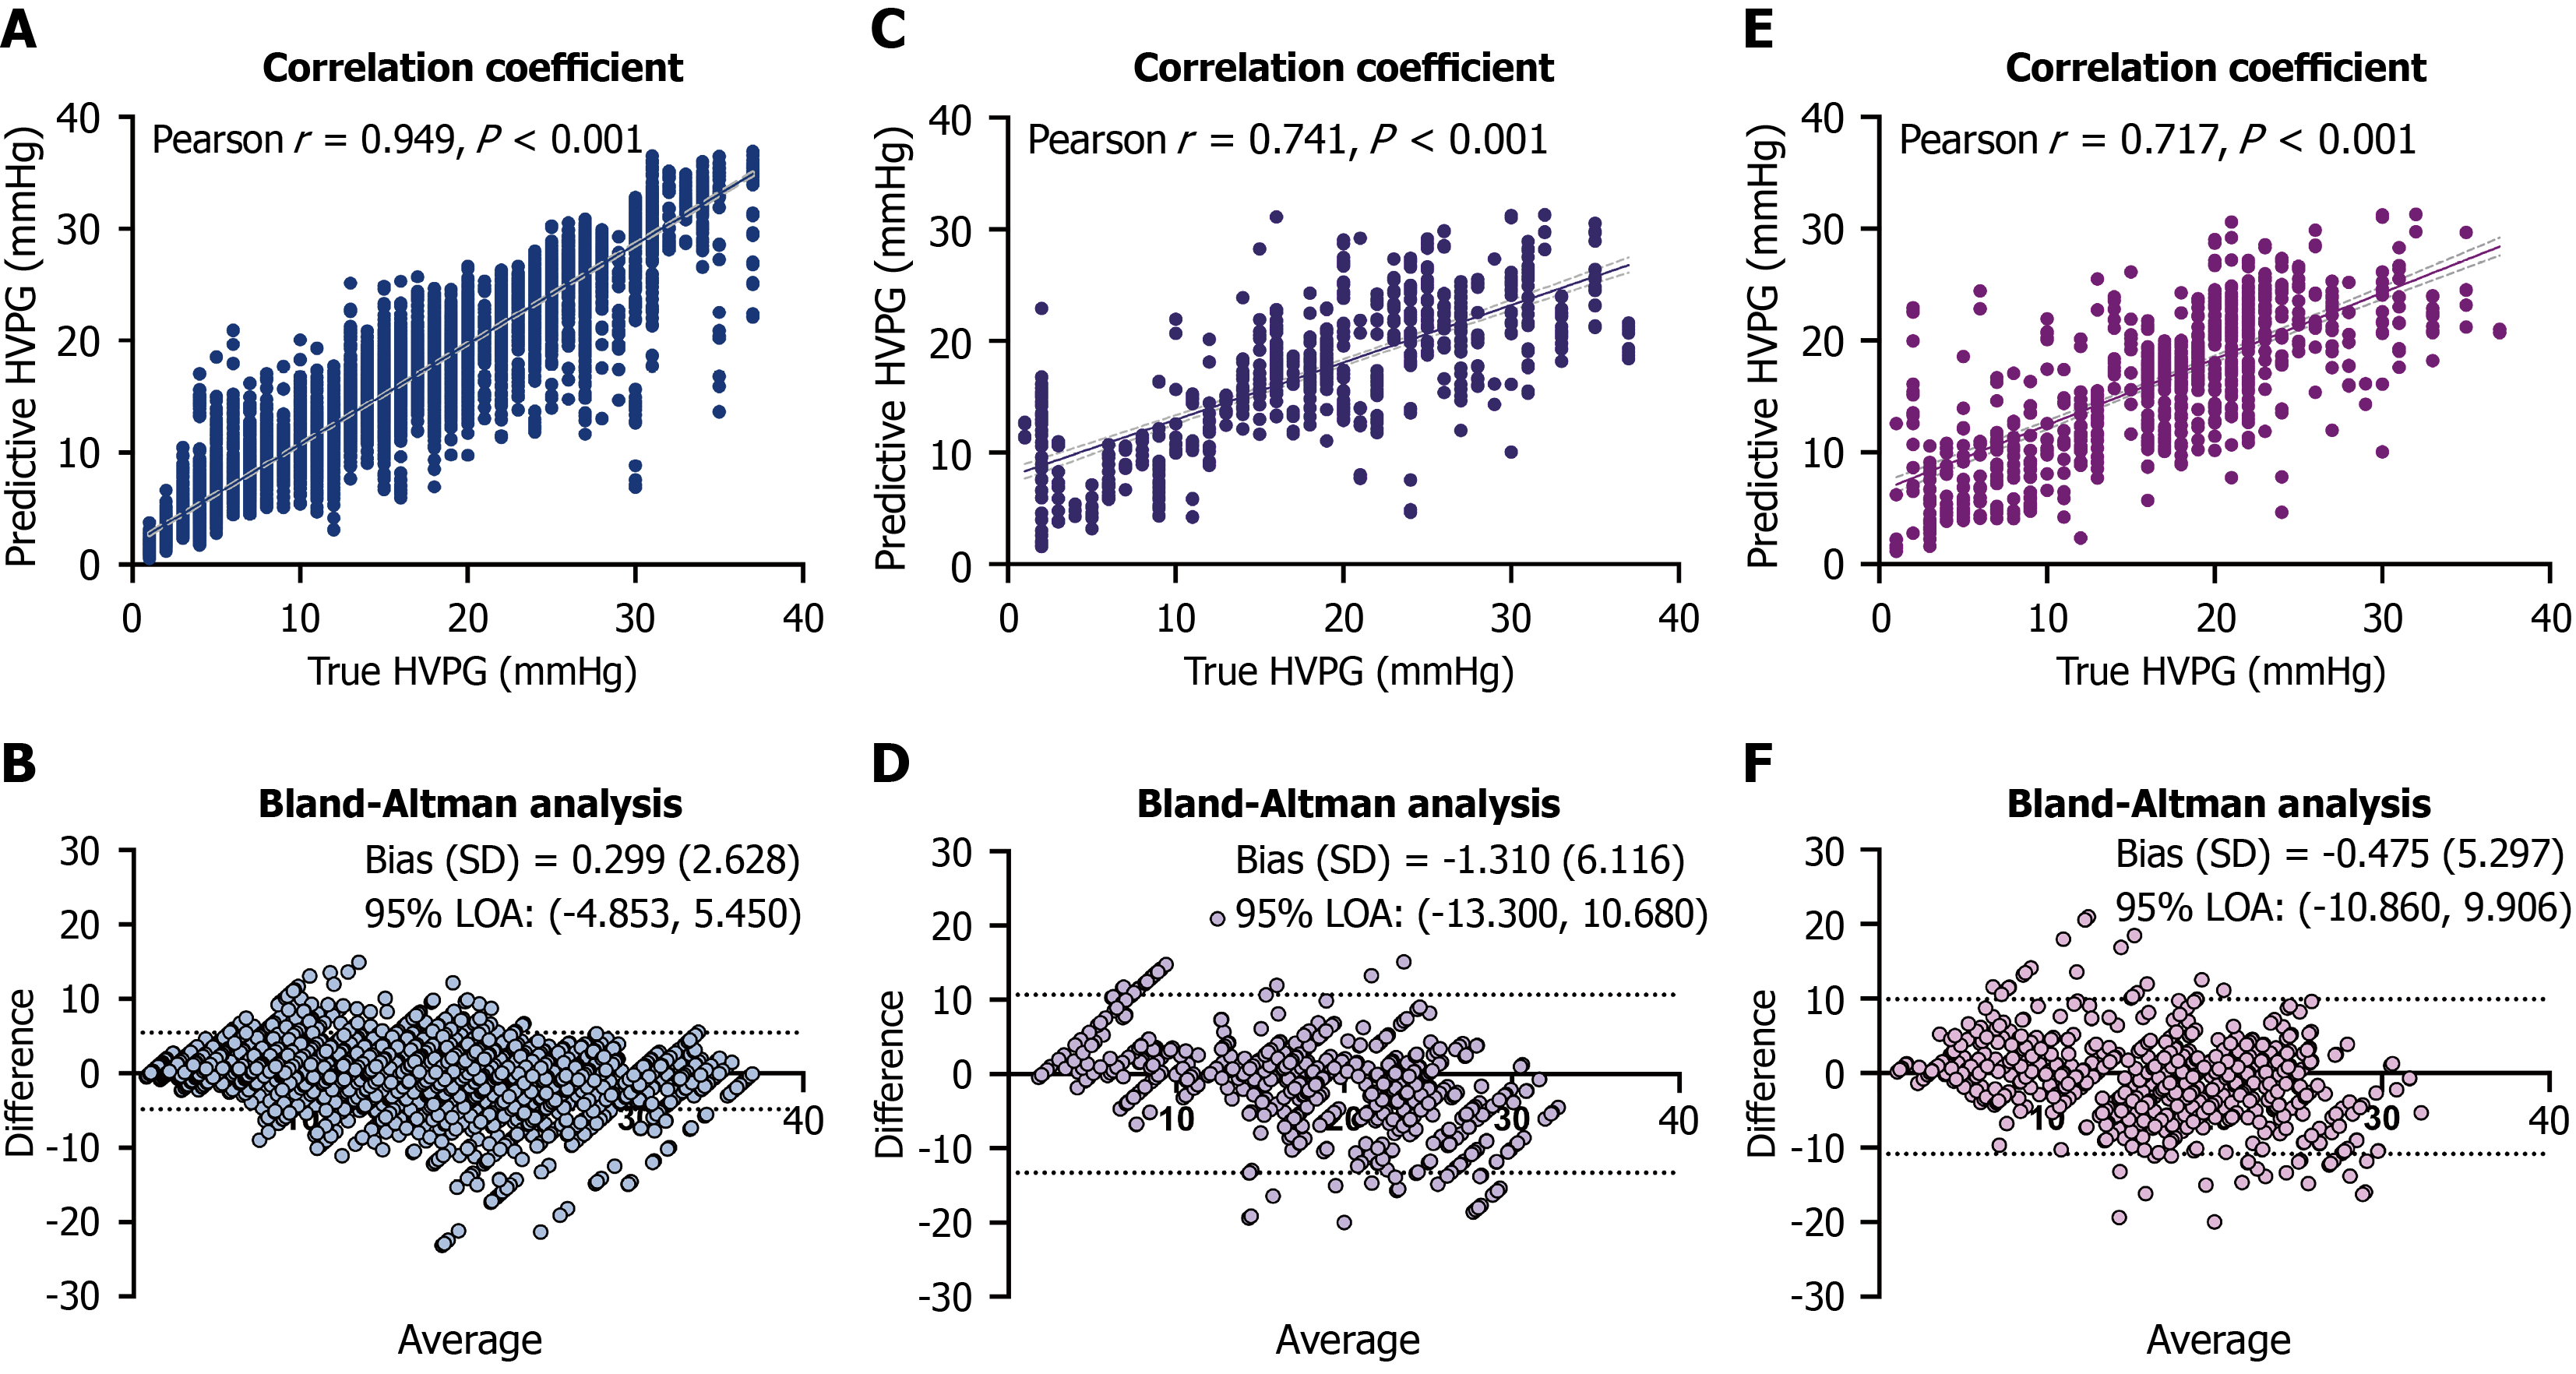
Figure 3 Correlation and agreement between the predictive and actual hepatic venous pressure gradient values.
Scatterplot and Bland-Altman analysis showed the correlation and agreement between the actual hepatic venous pressure gradient and the predictive hepatic venous pressure gradient values. A and B: Training set; C and D: Internal testing set; E and F: Temporally independent validation set. HVPG: Hepatic venous pressure gradient; LOA: Limits of agre
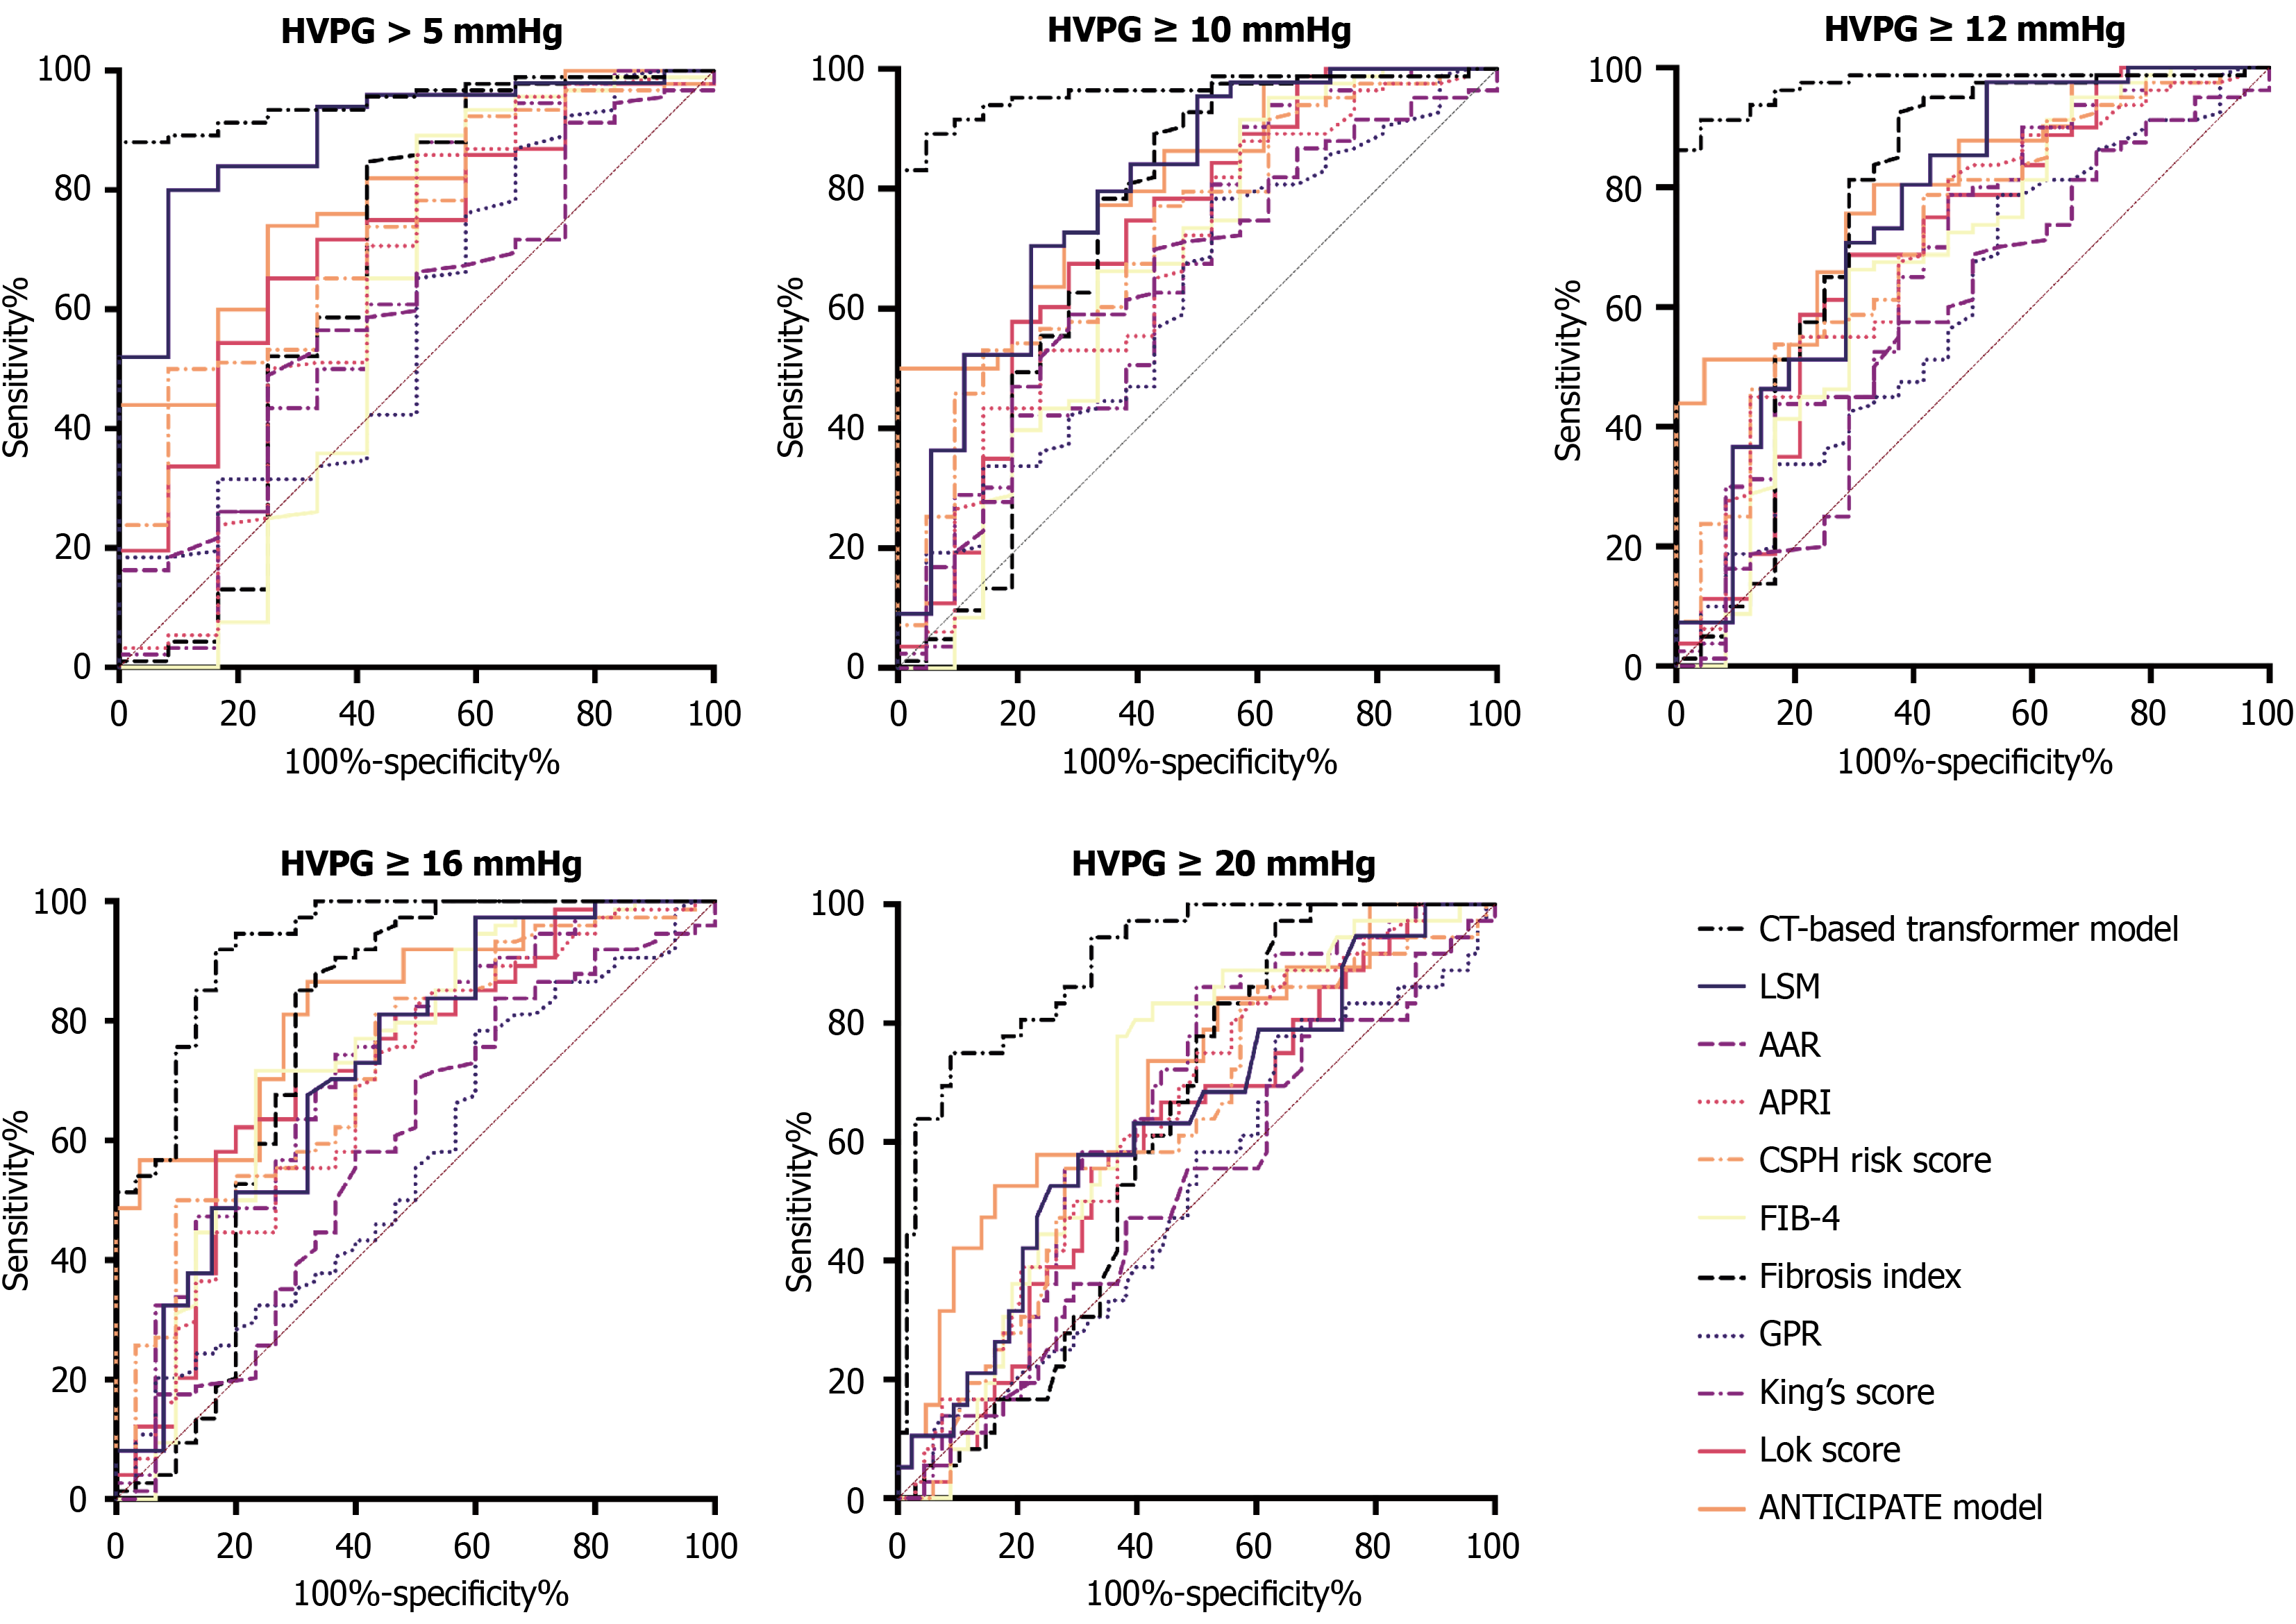
Figure 4 Receiver operating characteristic curves of our hepatic venous pressure gradient prediction model and other conventional non-invasive models.
HVPG: Hepatic venous pressure gradient; CT: Computed tomography; LSM: Liver stiffness measurement; AAR: Aspartate aminotransferase-to-alanine aminotransferase ratio; APRI: Aspartate aminotransferase-to-platelet count ratio index; CSPH: Clinically significant portal hypertension; FIB-4: Fibrosis index based on four factors; GPR: Gamma-glutamyl transferase-to-platelet count ratio.
- Citation: Guo X, Tong H, Cai WQ, He JY, Han TR, Qian SJ, Quan X, Li Y, Wei B, Wang ZD, Tai Y, Guo DQ, Wu H. Computed tomography-based transformer model for non-invasive prediction of portal venous pressure in chronic liver diseases. World J Gastroenterol 2026; 32(47): 121435
- URL: https://www.wjgnet.com/1007-9327/full/v32/i47/121435.htm
- DOI: https://dx.doi.org/10.3748/wjg.121435