
















Copyright: ©Author(s) 2026.
World J Gastroenterol. Dec 14, 2026; 32(46): 123696
Published online Dec 14, 2026. doi: 10.3748/wjg.123696
Published online Dec 14, 2026. doi: 10.3748/wjg.123696
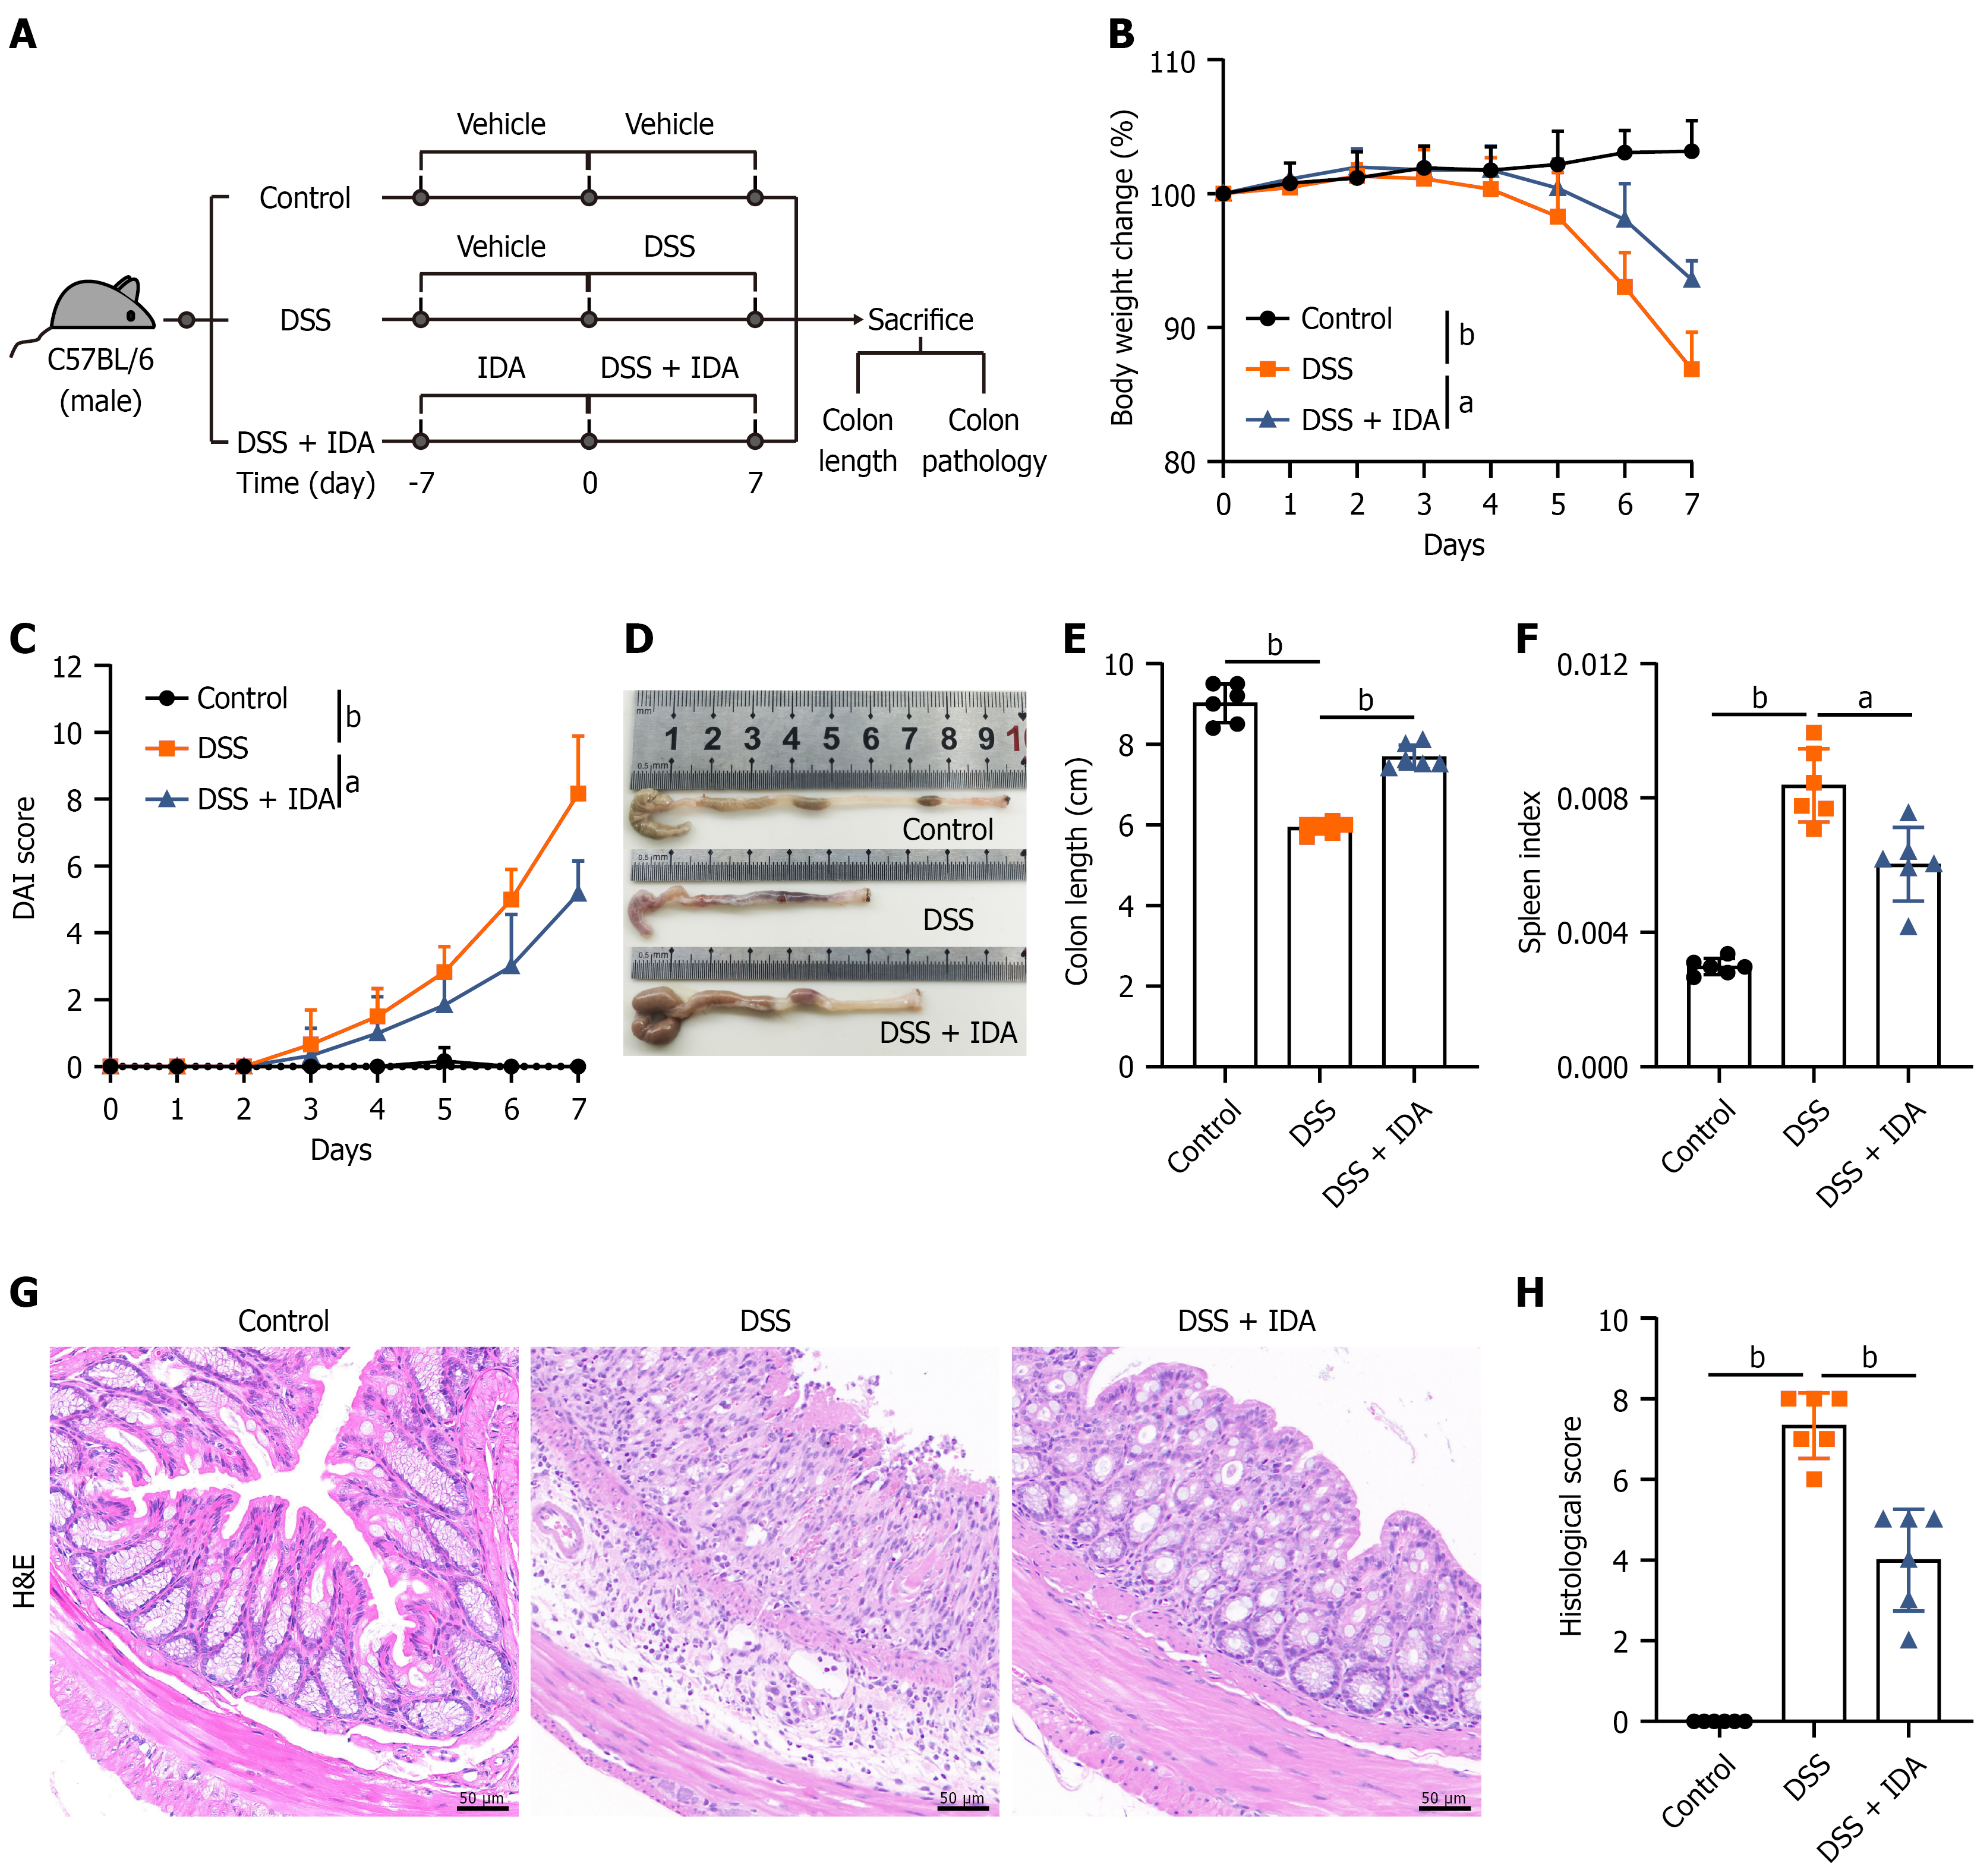
Figure 1 Trans-3-indoleacrylic acid ameliorates acute dextran sulfate sodium-induced colitis in mice.
A: Schematic of the animal experiment; B: Body weight change (%) of mice during dextran sulfate sodium (DSS) treatment; C: Disease activity index score during DSS treatment; D: Representative images of colons from each group; E: Colon length; F: Spleen index; G: Representative images of colonic sections stained with hematoxylin and eosin; H: Histological scores. The data are shown as the mean ± SD (n = 6 mice per group). Group comparisons were analyzed using one-way ANOVA with Sidak’s multiple comparisons test. In B and C, the P values indicate the differences between groups on day 7. aP < 0.001, bP < 0.0001. DSS: Dextran sulfate sodium; IDA: Trans-3-indoleacrylic acid; DAI: Disease activity index; H&E: Hematoxylin and eosin.
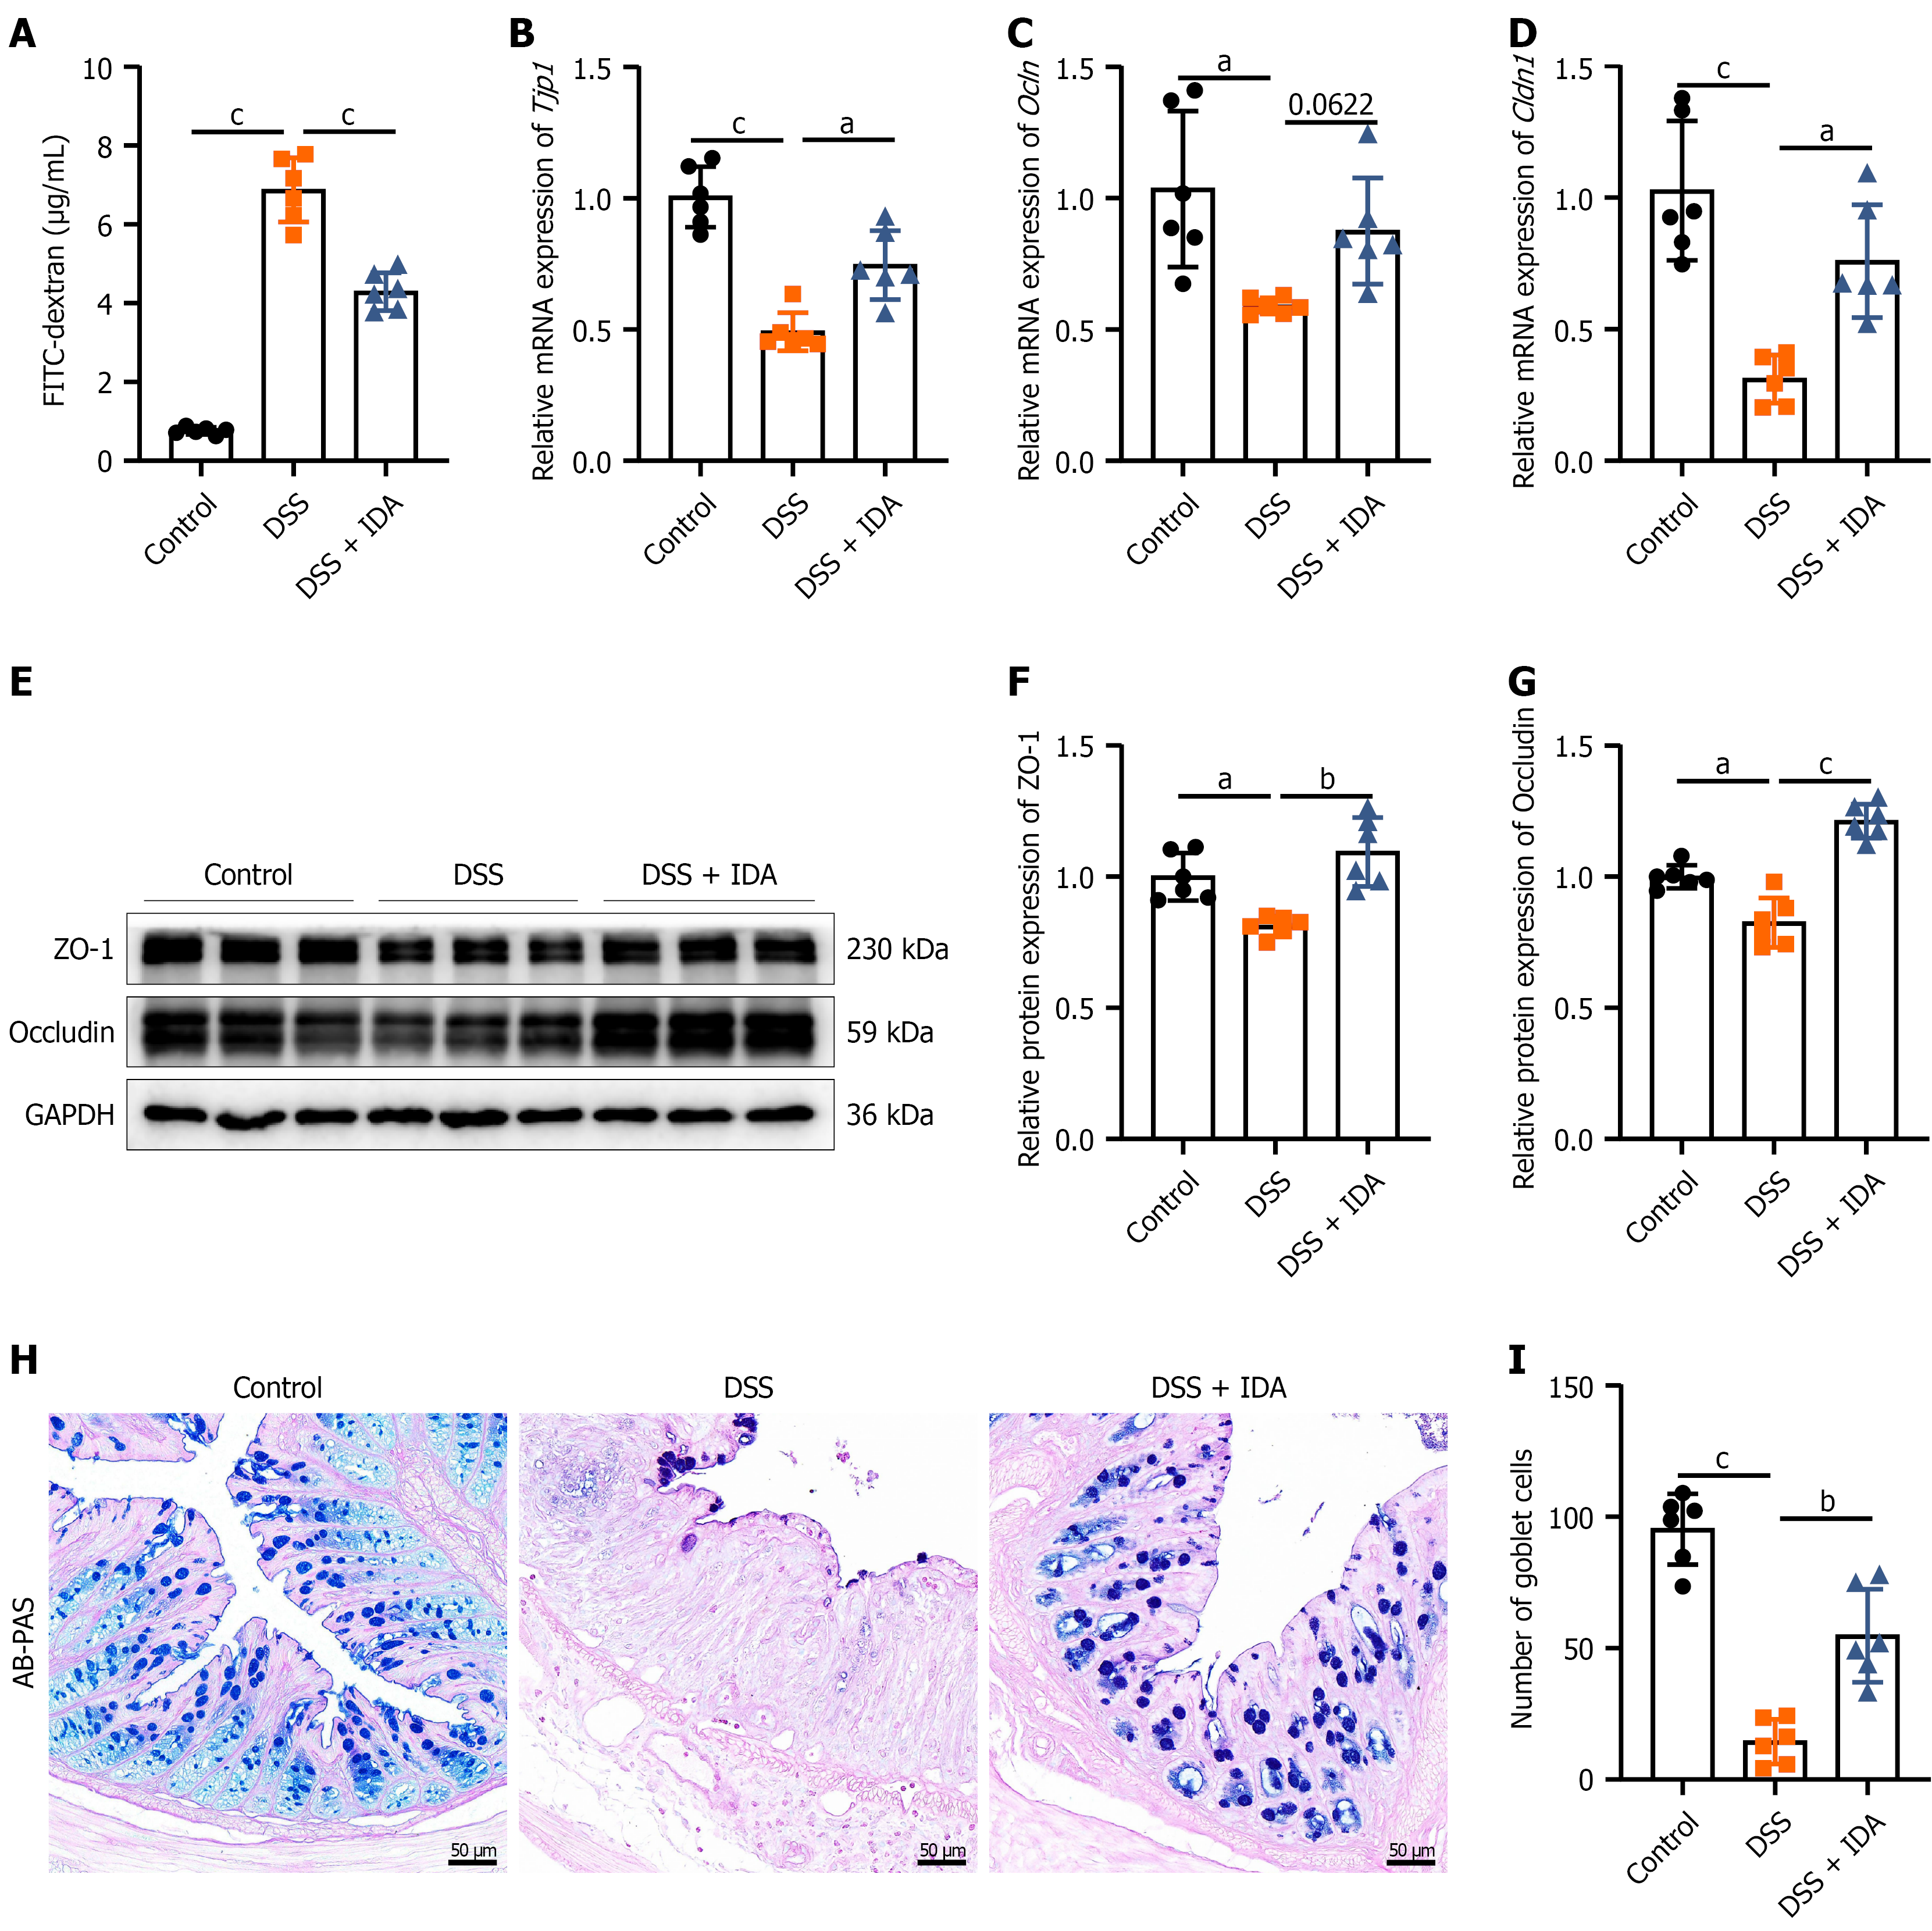
Figure 2 Trans-3-indoleacrylic acid preserves intestinal barrier integrity and reduces intestinal permeability in mice with colitis.
A: Fluorescence intensity of fluorescein isothiocyanate-dextran in serum; B-D: Relative mRNA expression of Tjp1, Ocln, and Cldn1 in colonic tissues; E-G: Representative immunoblots and the relative protein expression of ZO-1 and Occludin in colonic tissues; H: Representative images of colonic sections stained with alcian blue-periodic acid-Schiff (scale bars = 50 μm); I: Number of goblet cells. The data are shown as the mean ± SD (n = 6 mice per group). Group comparisons were analyzed using one-way ANOVA with Sidak’s multiple comparisons test. aP < 0.01, bP < 0.001, cP < 0.0001. DSS: Dextran sulfate sodium; IDA: Trans-3-indoleacrylic acid; FITC-Dextran: Fluorescein isothiocyanate-Dextran; AB-PAS: Alcian blue-periodic acid-Schiff.
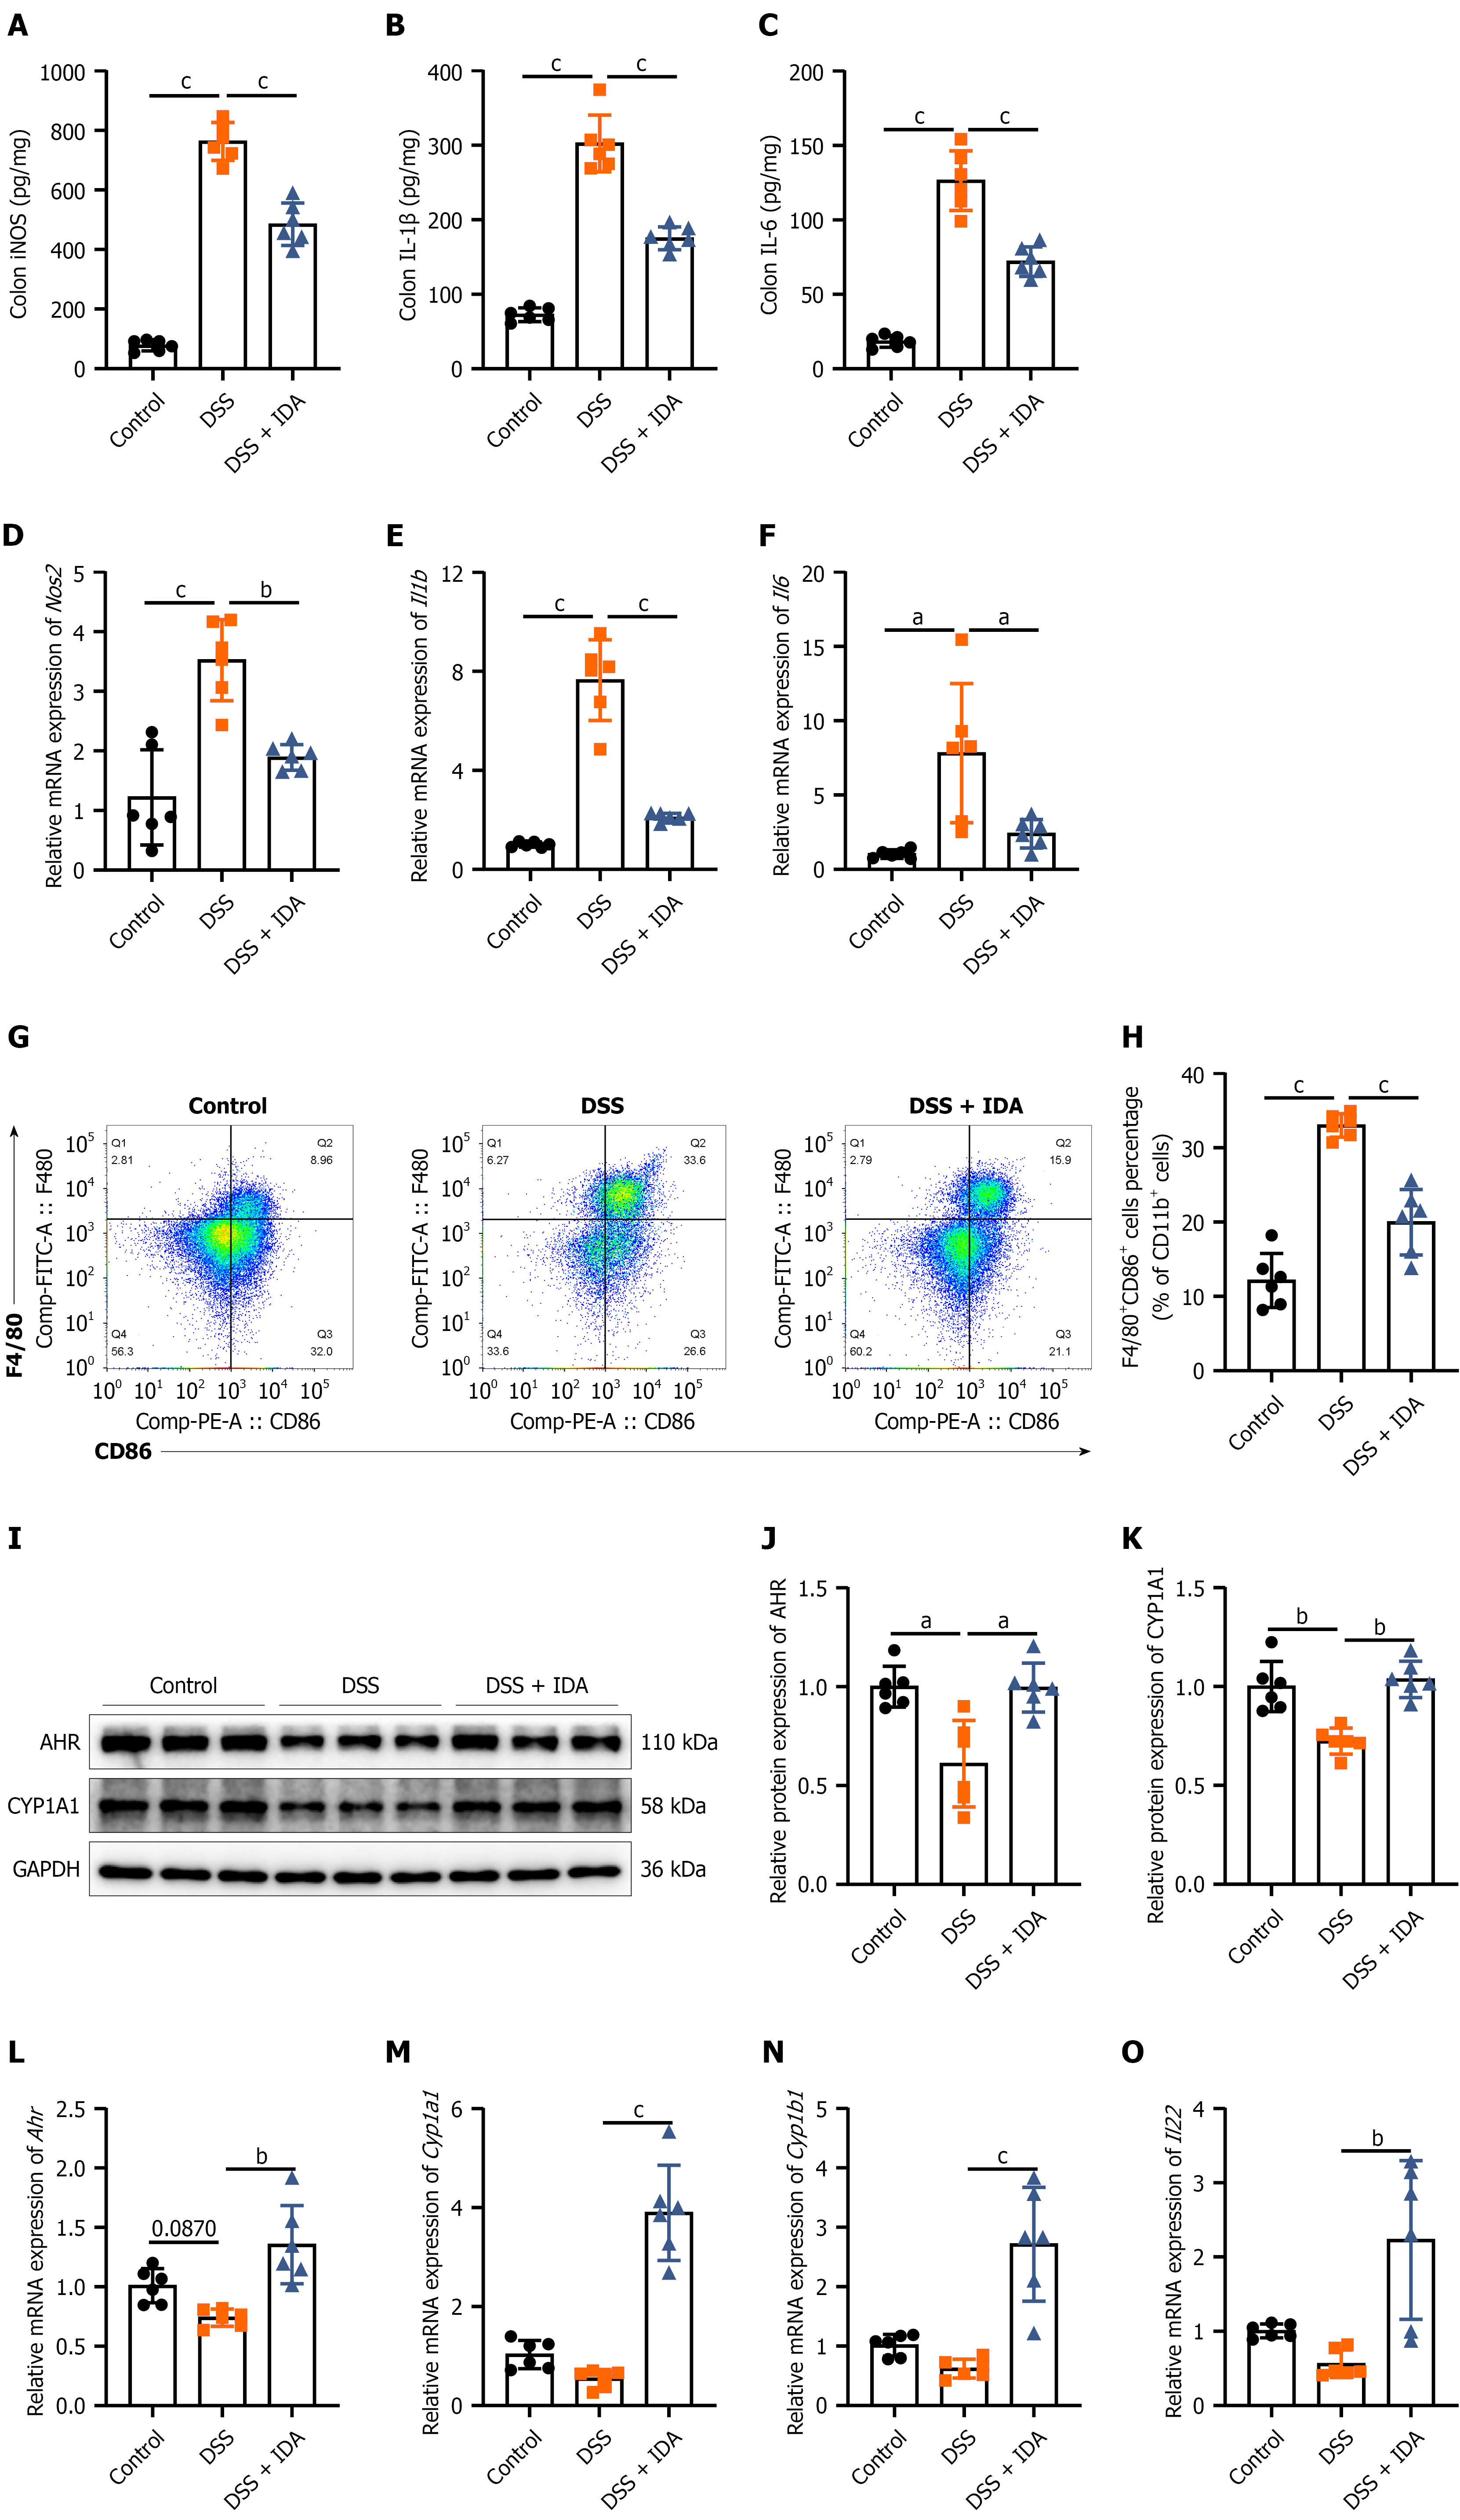
Figure 3 Trans-3-indoleacrylic acid activates aryl hydrocarbon receptor signaling and suppresses M1 macrophage polarization in vivo.
A-C: Concentration of iNOS, IL-1β, and IL-6 in colonic tissues; D-F: Relative mRNA expression of Nos2, Il1b, and Il6 in colonic tissues; G: Representative flow cytometry plots of macrophages from the colon lamina propria. Cells were pre-gated on the CD11b+ population. The upper right quadrant (Q2) indicates F4/80+CD86+ macrophages (M1 macrophages); H: Quantitative analysis of the percentage of F4/80+CD86+ macrophages among CD11b+ cells; I-K: Representative immunoblots and the relative protein expression of AHR and CYP1A1 in colonic tissues; L-O: Relative mRNA expression of Ahr, Cyp1a1, Cyp1b1, and Il22 in colonic tissues. The data are shown as the mean ± SD (n = 6 mice per group). Group comparisons were analyzed using one-way ANOVA with Sidak’s multiple comparisons test. aP < 0.01, bP < 0.001, cP < 0.0001. DSS: Dextran sulfate sodium; IDA: Trans-3-indoleacrylic acid; AHR: Aryl hydrocarbon receptor.
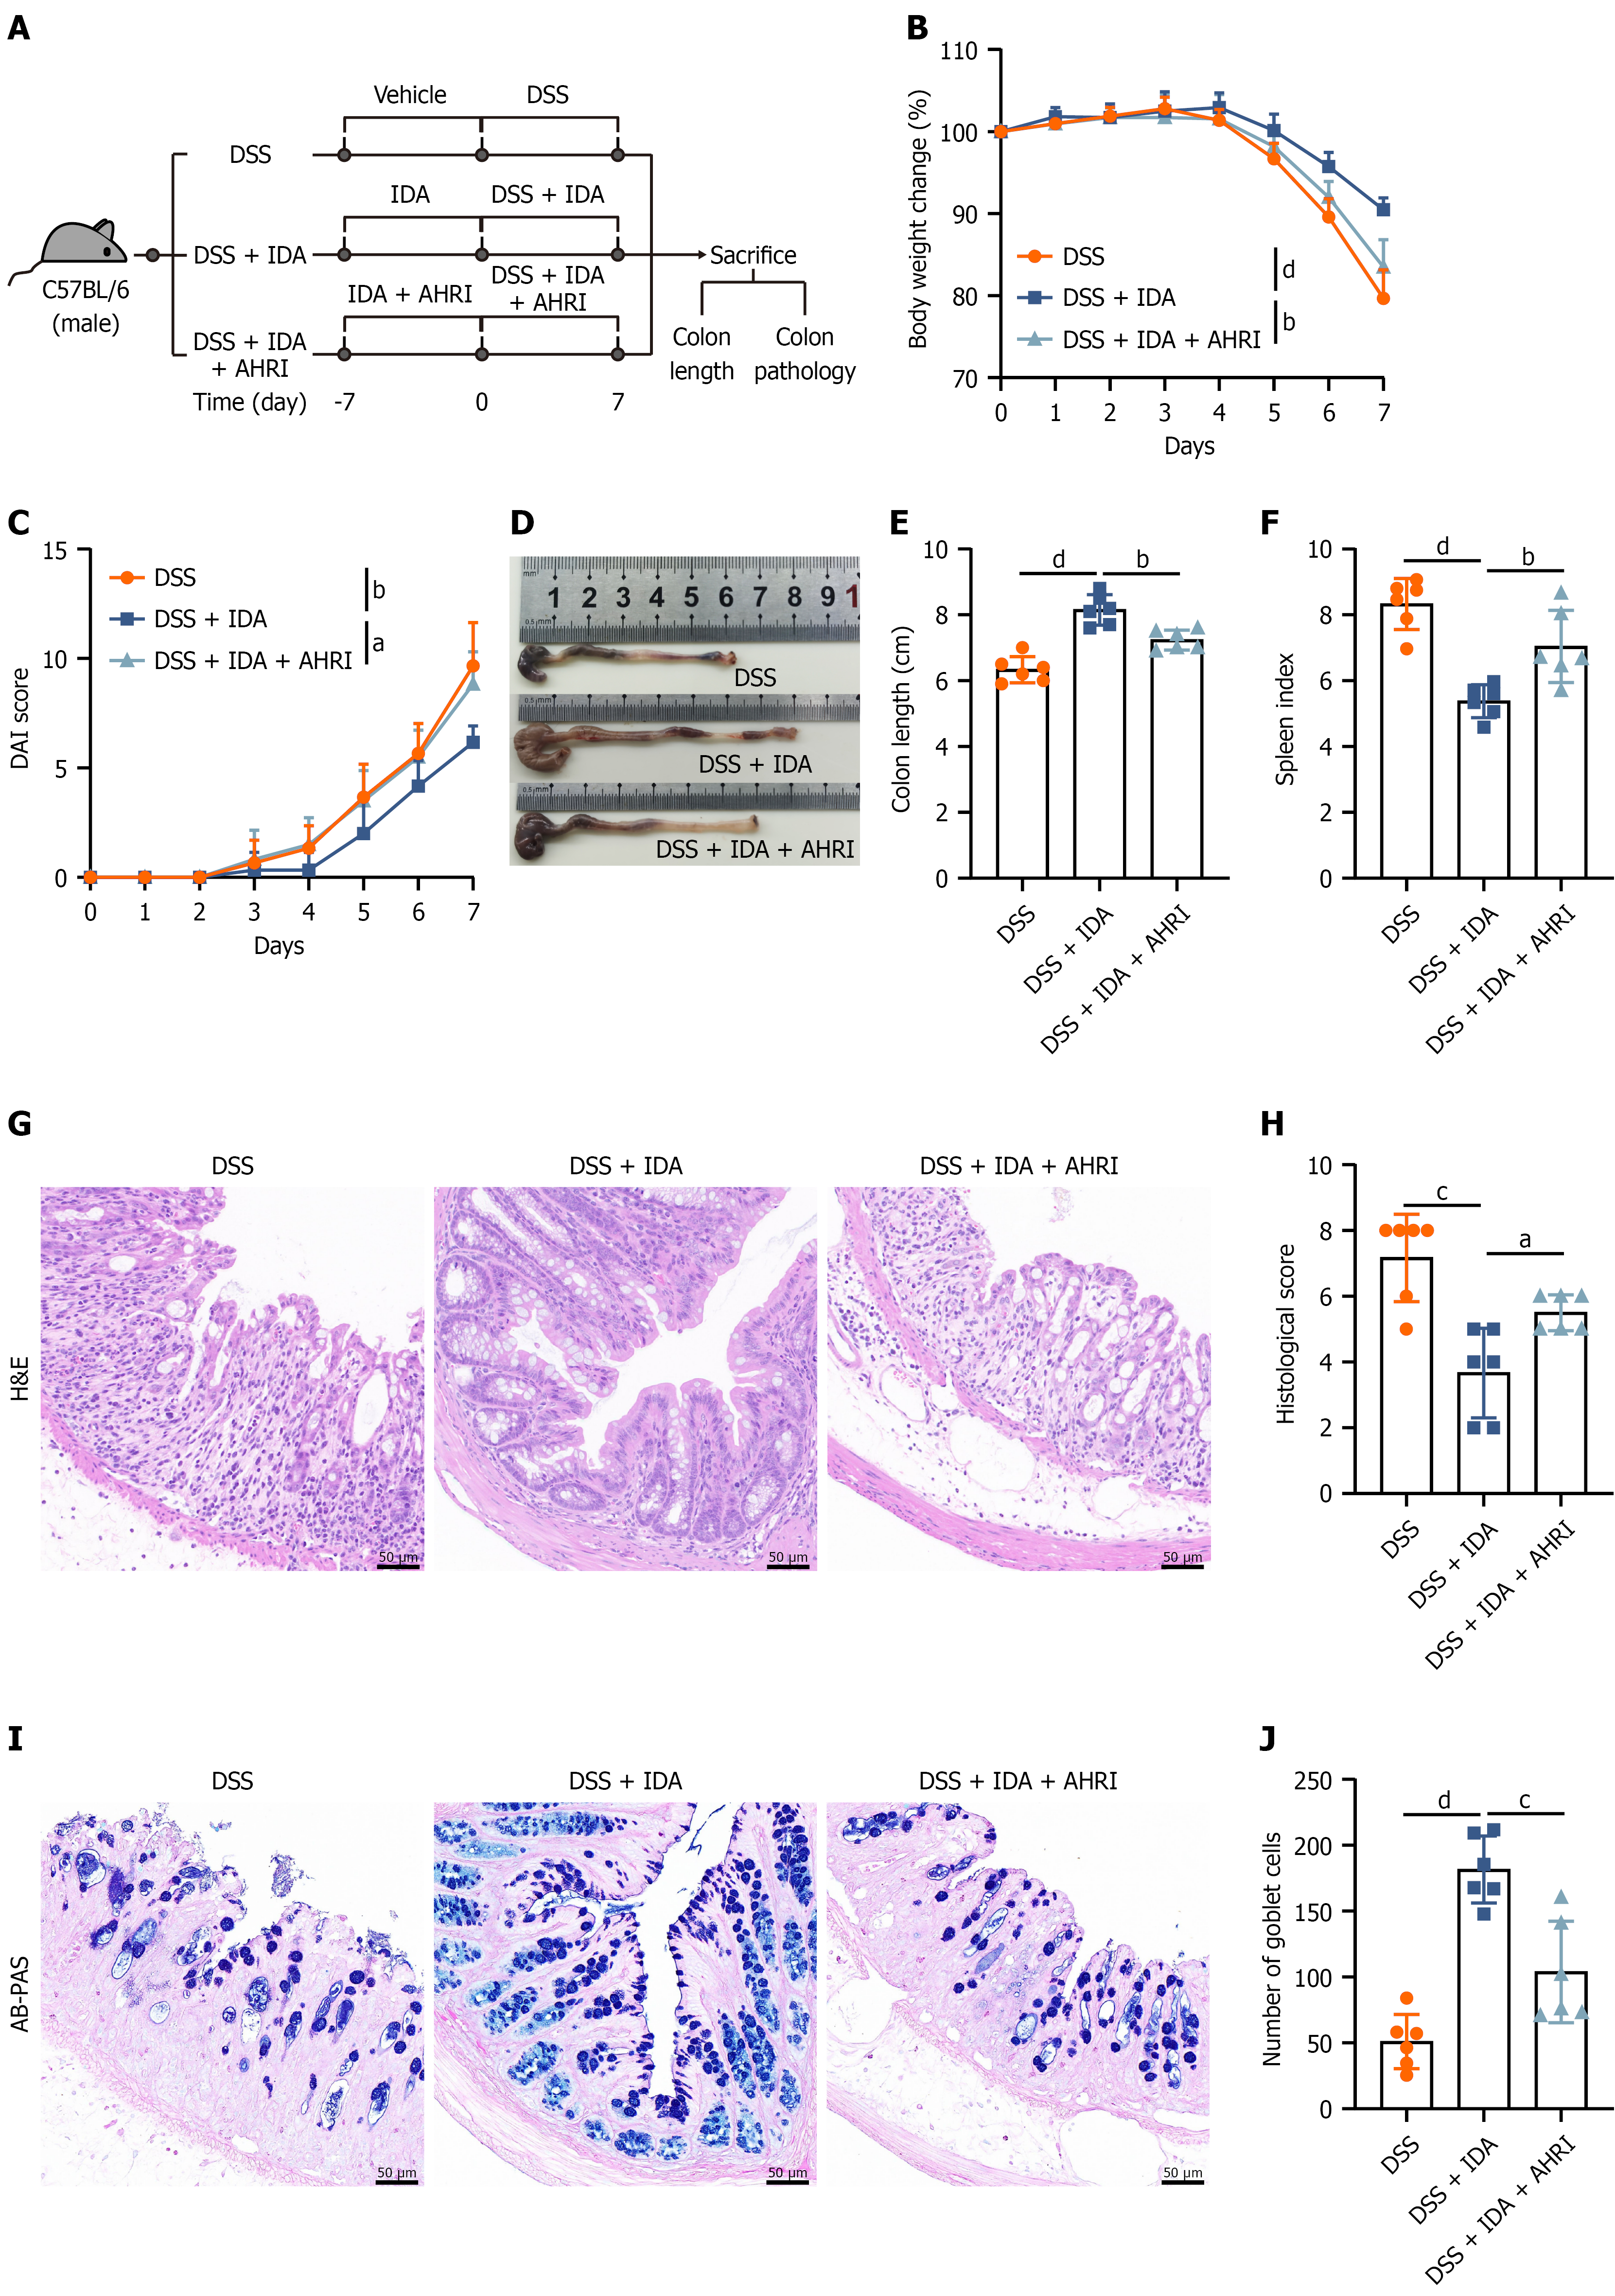
Figure 4 Aryl hydrocarbon receptor inhibition abrogates the protective effects of trans-3-indoleacrylic acid on dextran sulfate sodium-induced colitis.
A: Schematic of the animal experiment; B: Body weight change (%) of mice during dextran sulfate sodium (DSS) treatment; C: Disease activity index score during DSS treatment; D: Representative images of colons from each group; E: Colon length; F: Spleen index; G: Representative images of colonic sections stained with hematoxylin and eosin; H: Histological scores; I: Representative images of colonic sections stained with alcian blue-periodic acid-Schiff; J: Number of goblet cells. The data are shown as the mean ± SD (n = 6 mice per group). Group comparisons were analyzed using one-way ANOVA with Sidak’s multiple comparisons test. aP < 0.05, bP < 0.01, cP < 0.001, dP < 0.0001. In B and C, the P values indicate the differences between groups on day 7. DSS: Dextran sulfate sodium; IDA: Trans-3-indoleacrylic acid; AHRI: Aryl hydrocarbon receptor inhibitor; DAI: Disease activity index; H&E: Hematoxylin and eosin. AB-PAS: Alcian blue-periodic acid-Schiff.
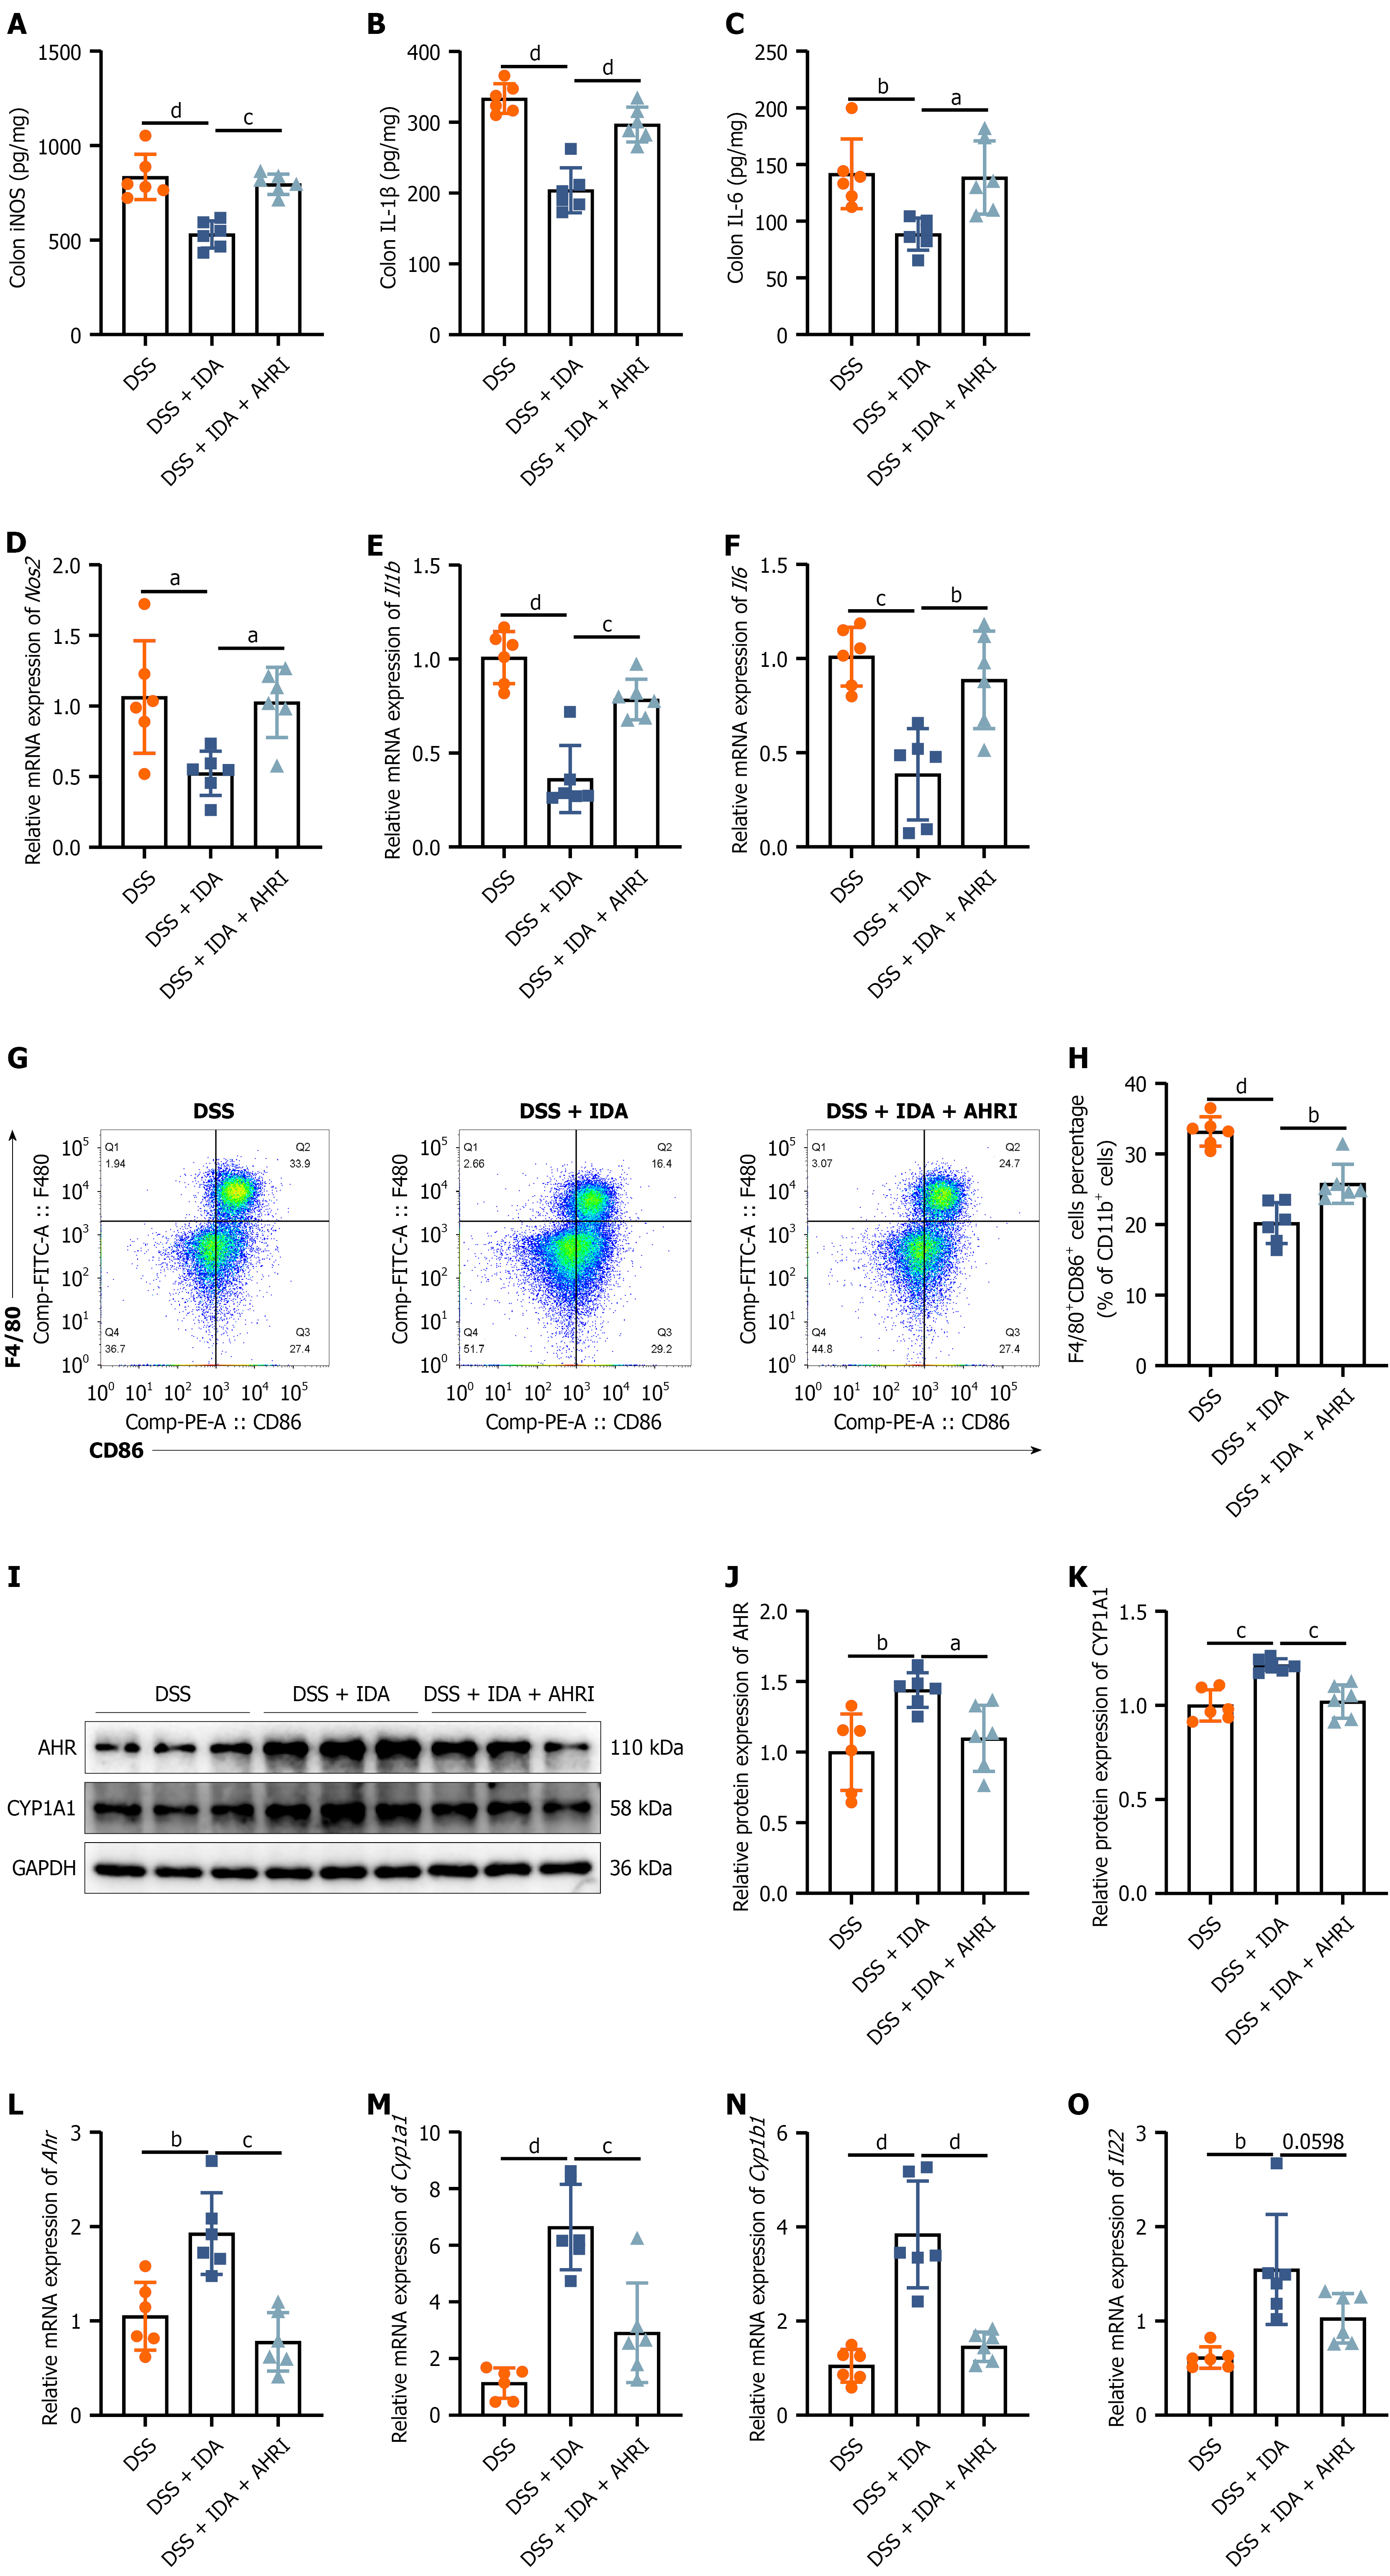
Figure 5 Trans-3-indoleacrylic acid suppresses M1 macrophage polarization via aryl hydrocarbon receptor activation in vivo.
A-C: Concentration of iNOS, IL-1β, and IL-6 in colonic tissues; D-F: Relative mRNA expression of Nos2, Il1b, and Il6 in colonic tissues; G: Representative flow cytometry plots of macrophages from the colon lamina propria. Cells were pre-gated on the CD11b+ population. The upper right quadrant (Q2) indicates F4/80+CD86+ macrophages (M1 macrophages); H: Quantitative analysis of the percentage of F4/80+CD86+ macrophages among CD11b+ cells; I-K: Representative immunoblots and the relative protein expression of aryl hydrocarbon receptor and CYP1A1 in colonic tissues; L-O: Relative mRNA expression of Ahr, Cyp1a1, Cyp1b1, and Il22 in colonic tissues. The data are shown as the mean ± SD (n = 6 mice per group). Group comparisons were analyzed using one-way ANOVA with Sidak’s multiple comparisons test. aP < 0.05, bP < 0.01, cP < 0.001, dP < 0.0001. DSS: Dextran sulfate sodium; IDA: Trans-3-indoleacrylic acid; AHRI: Aryl hydrocarbon receptor inhibitor; AHR: Aryl hydrocarbon receptor.
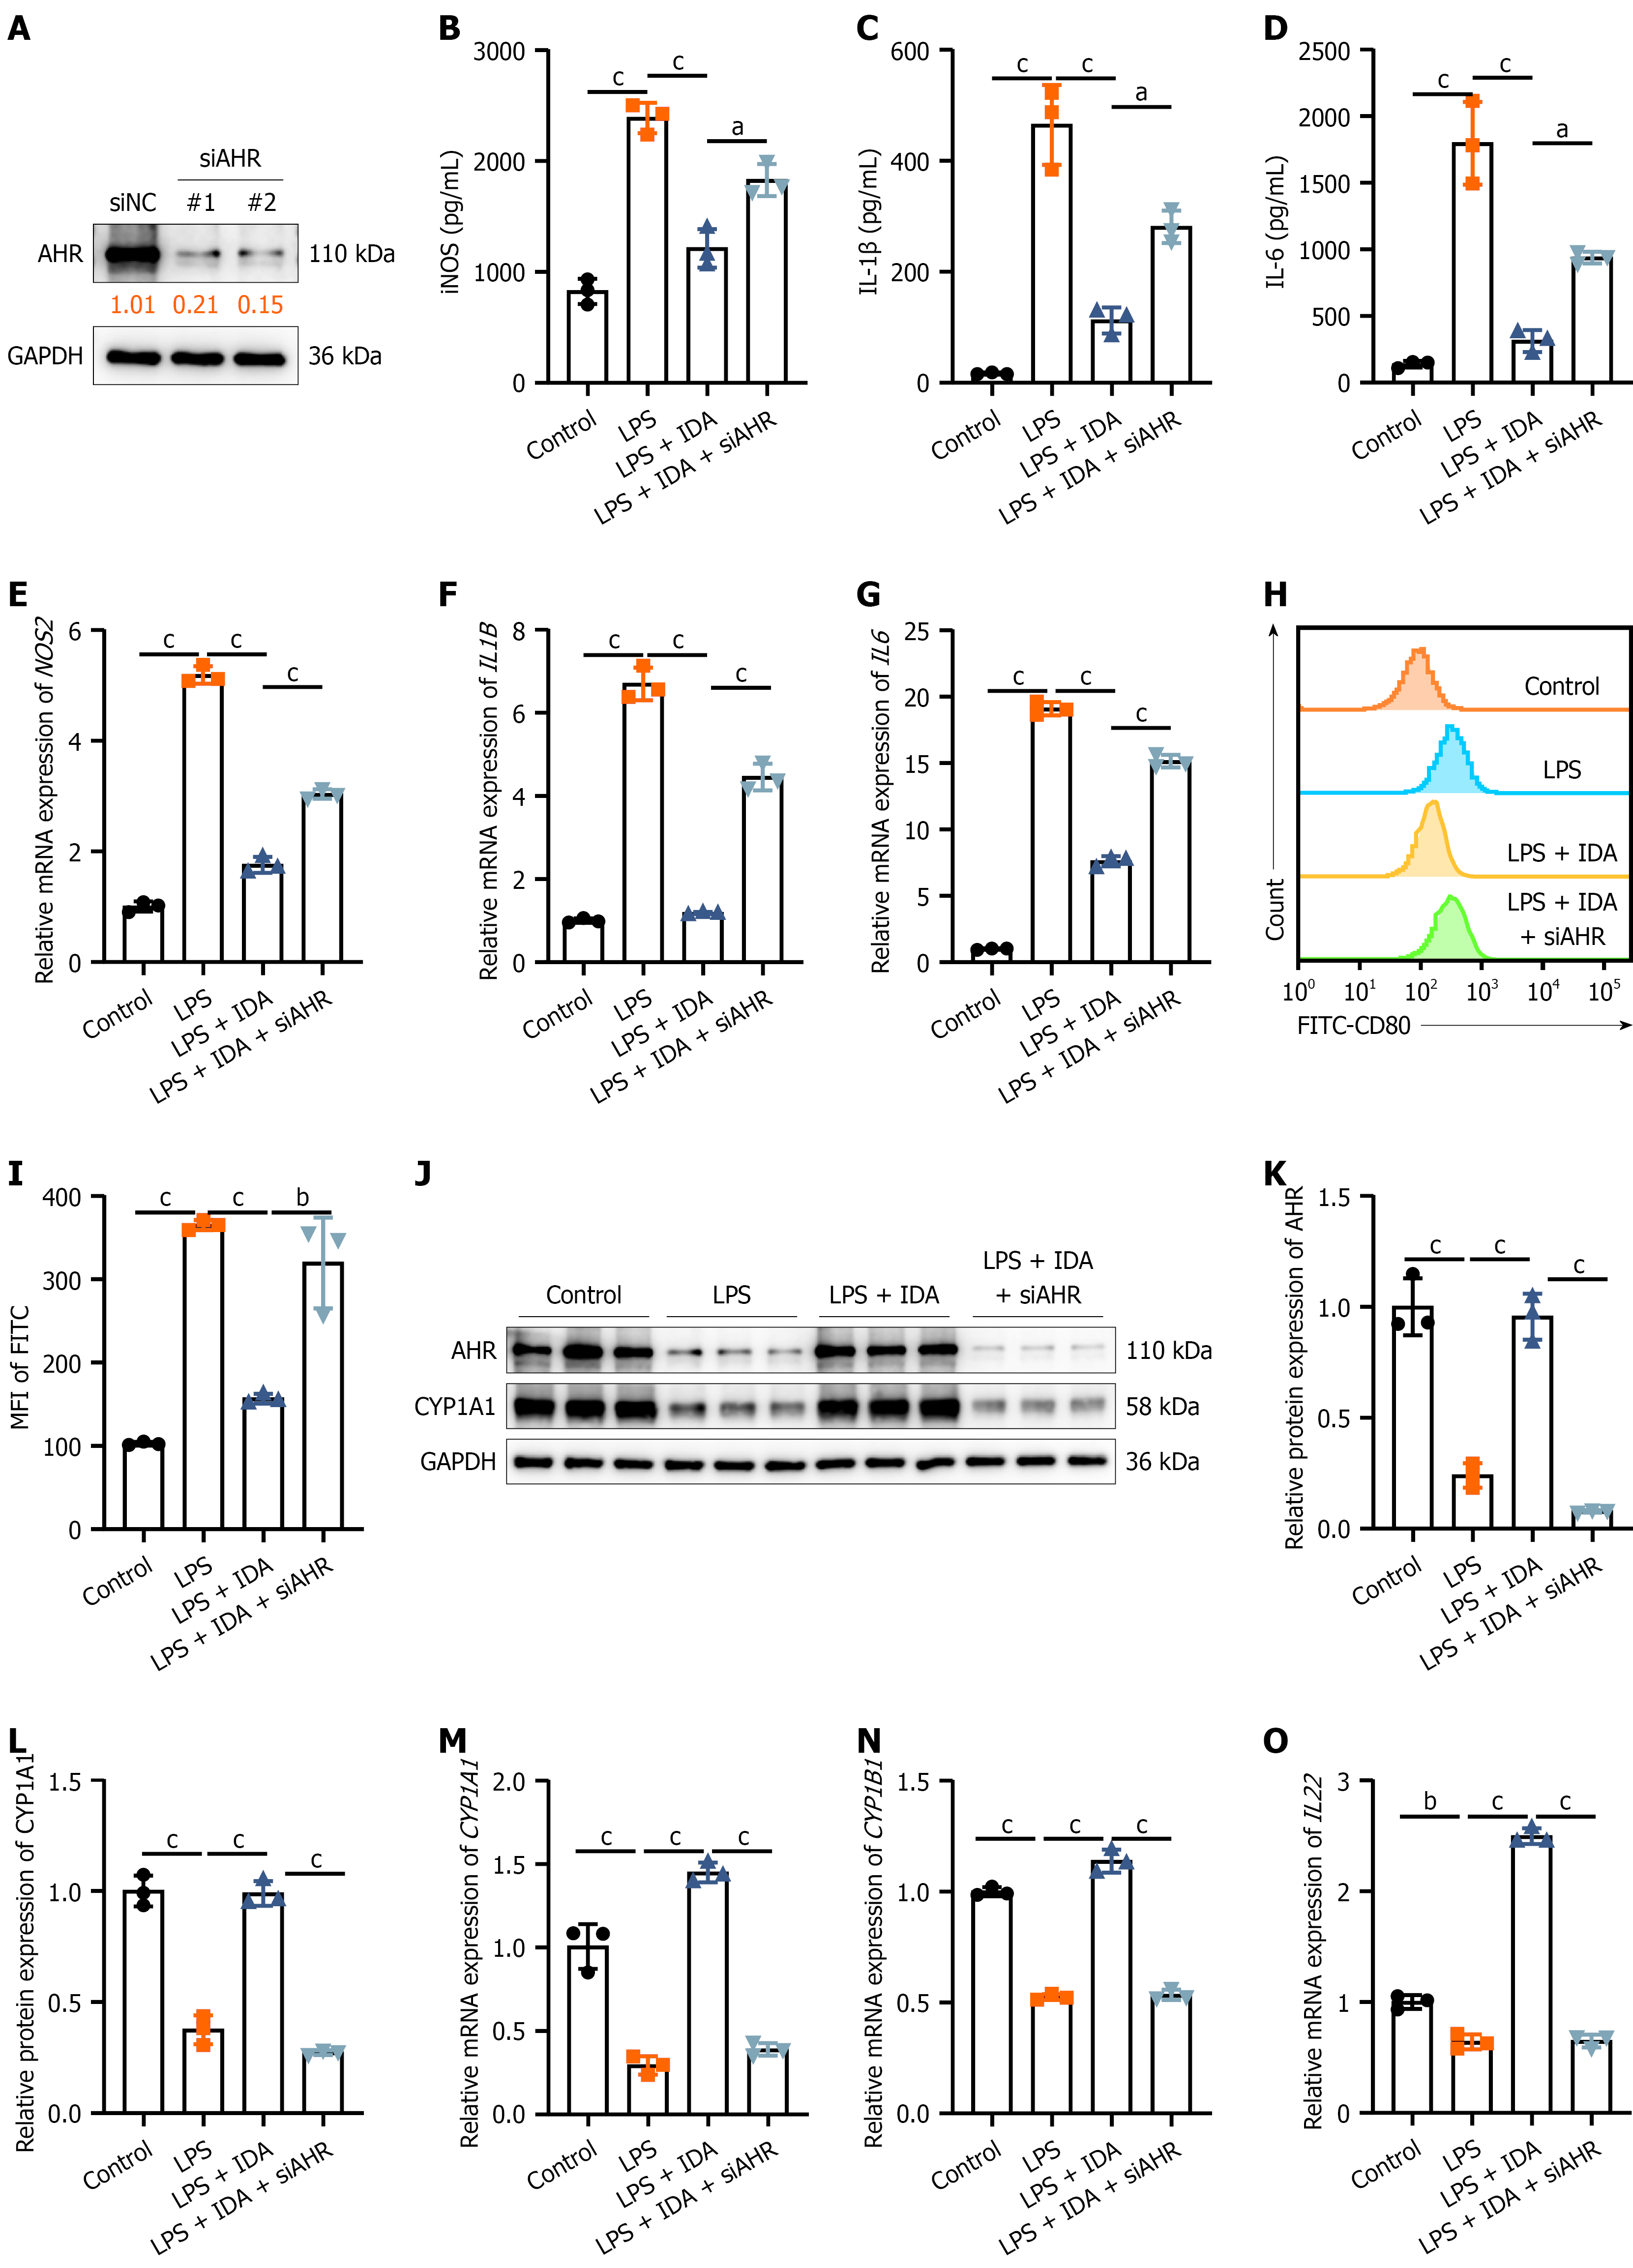
Figure 6 Trans-3-indoleacrylic acid attenuates lipopolysaccharide-stimulated M1 polarization through aryl hydrocarbon receptor signaling in vitro.
A: Representative immunoblots of aryl hydrocarbon receptor (AHR) in AHR knockdown THP-1 macrophages; B-D: Concentration of iNOS, IL-1β, and IL-6 in THP-1 macrophage culture supernatants; E-G: Relative mRNA expression of NOS2, IL1B, and IL6 in THP-1 macrophages; H: Representative flow cytometry histograms of the CD80 expression levels in THP-1 macrophages; I: Quantification of FITC-CD80 mean fluorescence intensity; J-L: Representative immunoblots and the relative protein expression of AHR and CYP1A1 in THP-1 macrophages; M-O: Relative mRNA expression of AHR, CYP1A1, CYP1B1, and IL22 in THP-1 macrophages. The data are shown as the mean ± SD (n = 3 cell per group). Group comparisons were analyzed using one-way ANOVA with Sidak’s multiple comparisons test. aP < 0.01, bP < 0.001, cP < 0.0001. AHR: Aryl hydrocarbon receptor; NC: Negative control; LPS: Lipopolysaccharide; IDA: Trans-3-indoleacrylic acid; MFI: Mean fluorescence intensity.
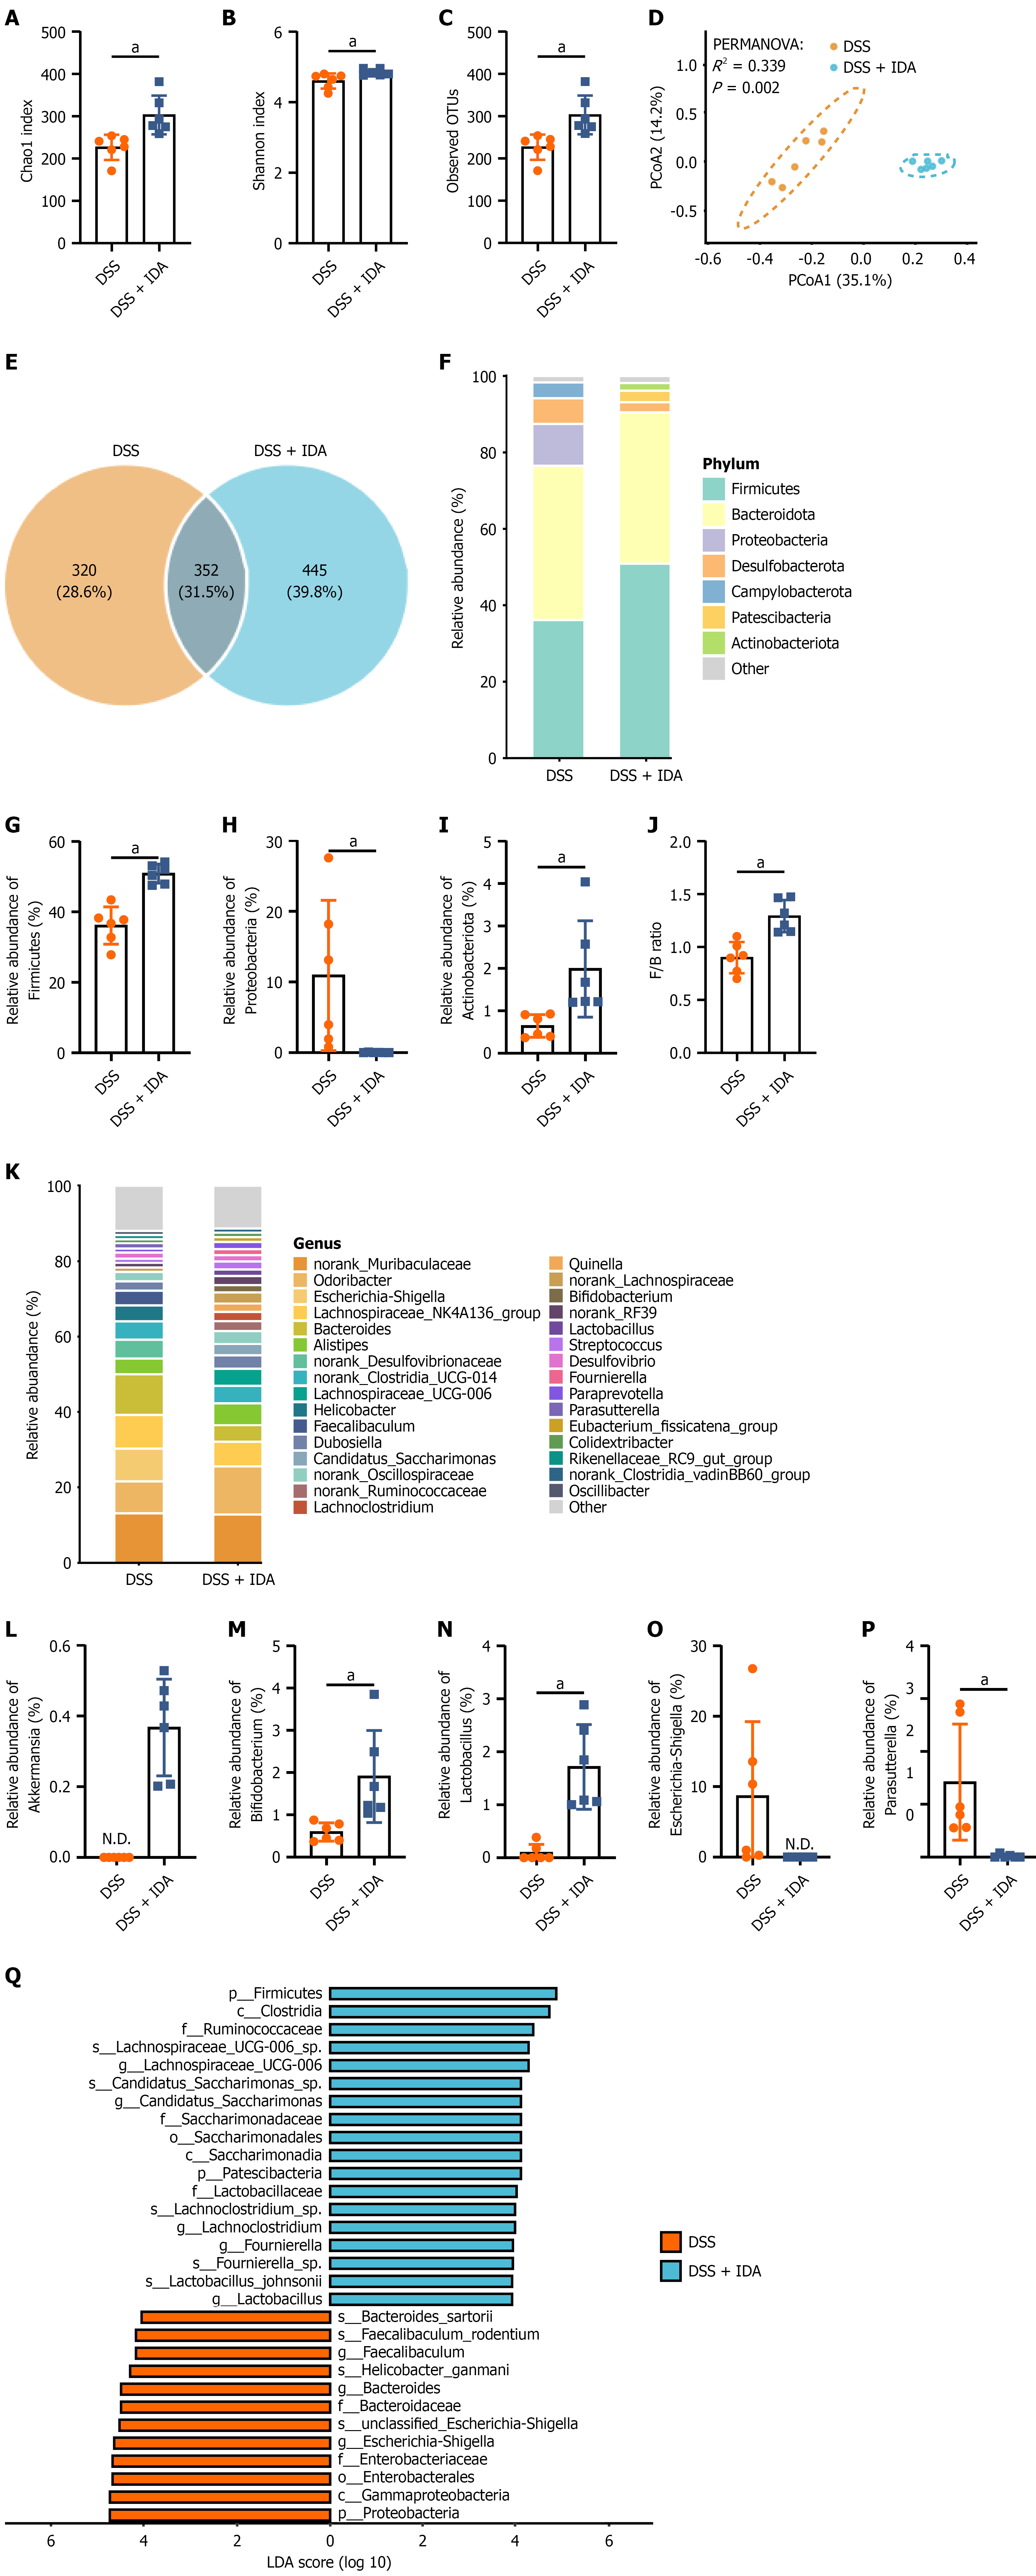
Figure 7 Trans-3-indoleacrylic acid attenuates the dextran sulfate sodium-induced disruption of the gut microbiota.
A-C: Alpha diversity indices of the gut microbiota, including Chao1, Shannon, and observed operational taxonomic units (OTUs); D: Principal coordinate analysis plot based on Bray-Curtis distance; E: Venn diagram illustrating the shared and unique OTUs; F and K: Taxonomic composition of the gut microbiota at the phylum and genus levels; G-I: Relative abundance of specific phyla: Firmicutes, Proteobacteria, and Actinobacteriota; J: Ratio of relative abundance of Firmicutes to Bacteroidota; L-P: Relative abundance of specific genera: Akkermansia, Bifidobacterium, Lactobacillus, Escherichia-Shigella, and Parasutterella; Q: Linear discriminant analysis (LDA) effect size analysis identifying biomarker taxa (LDA score > 4.0). The data are shown as the mean ± SD (n = 6 mice per group). Group comparisons were analyzed using Mann-Whitney test. In D, the P value was determined by PERMANOVA. aP < 0.01. DSS: Dextran sulfate sodium; IDA: Trans-3-indoleacrylic acid; F/B: Firmi
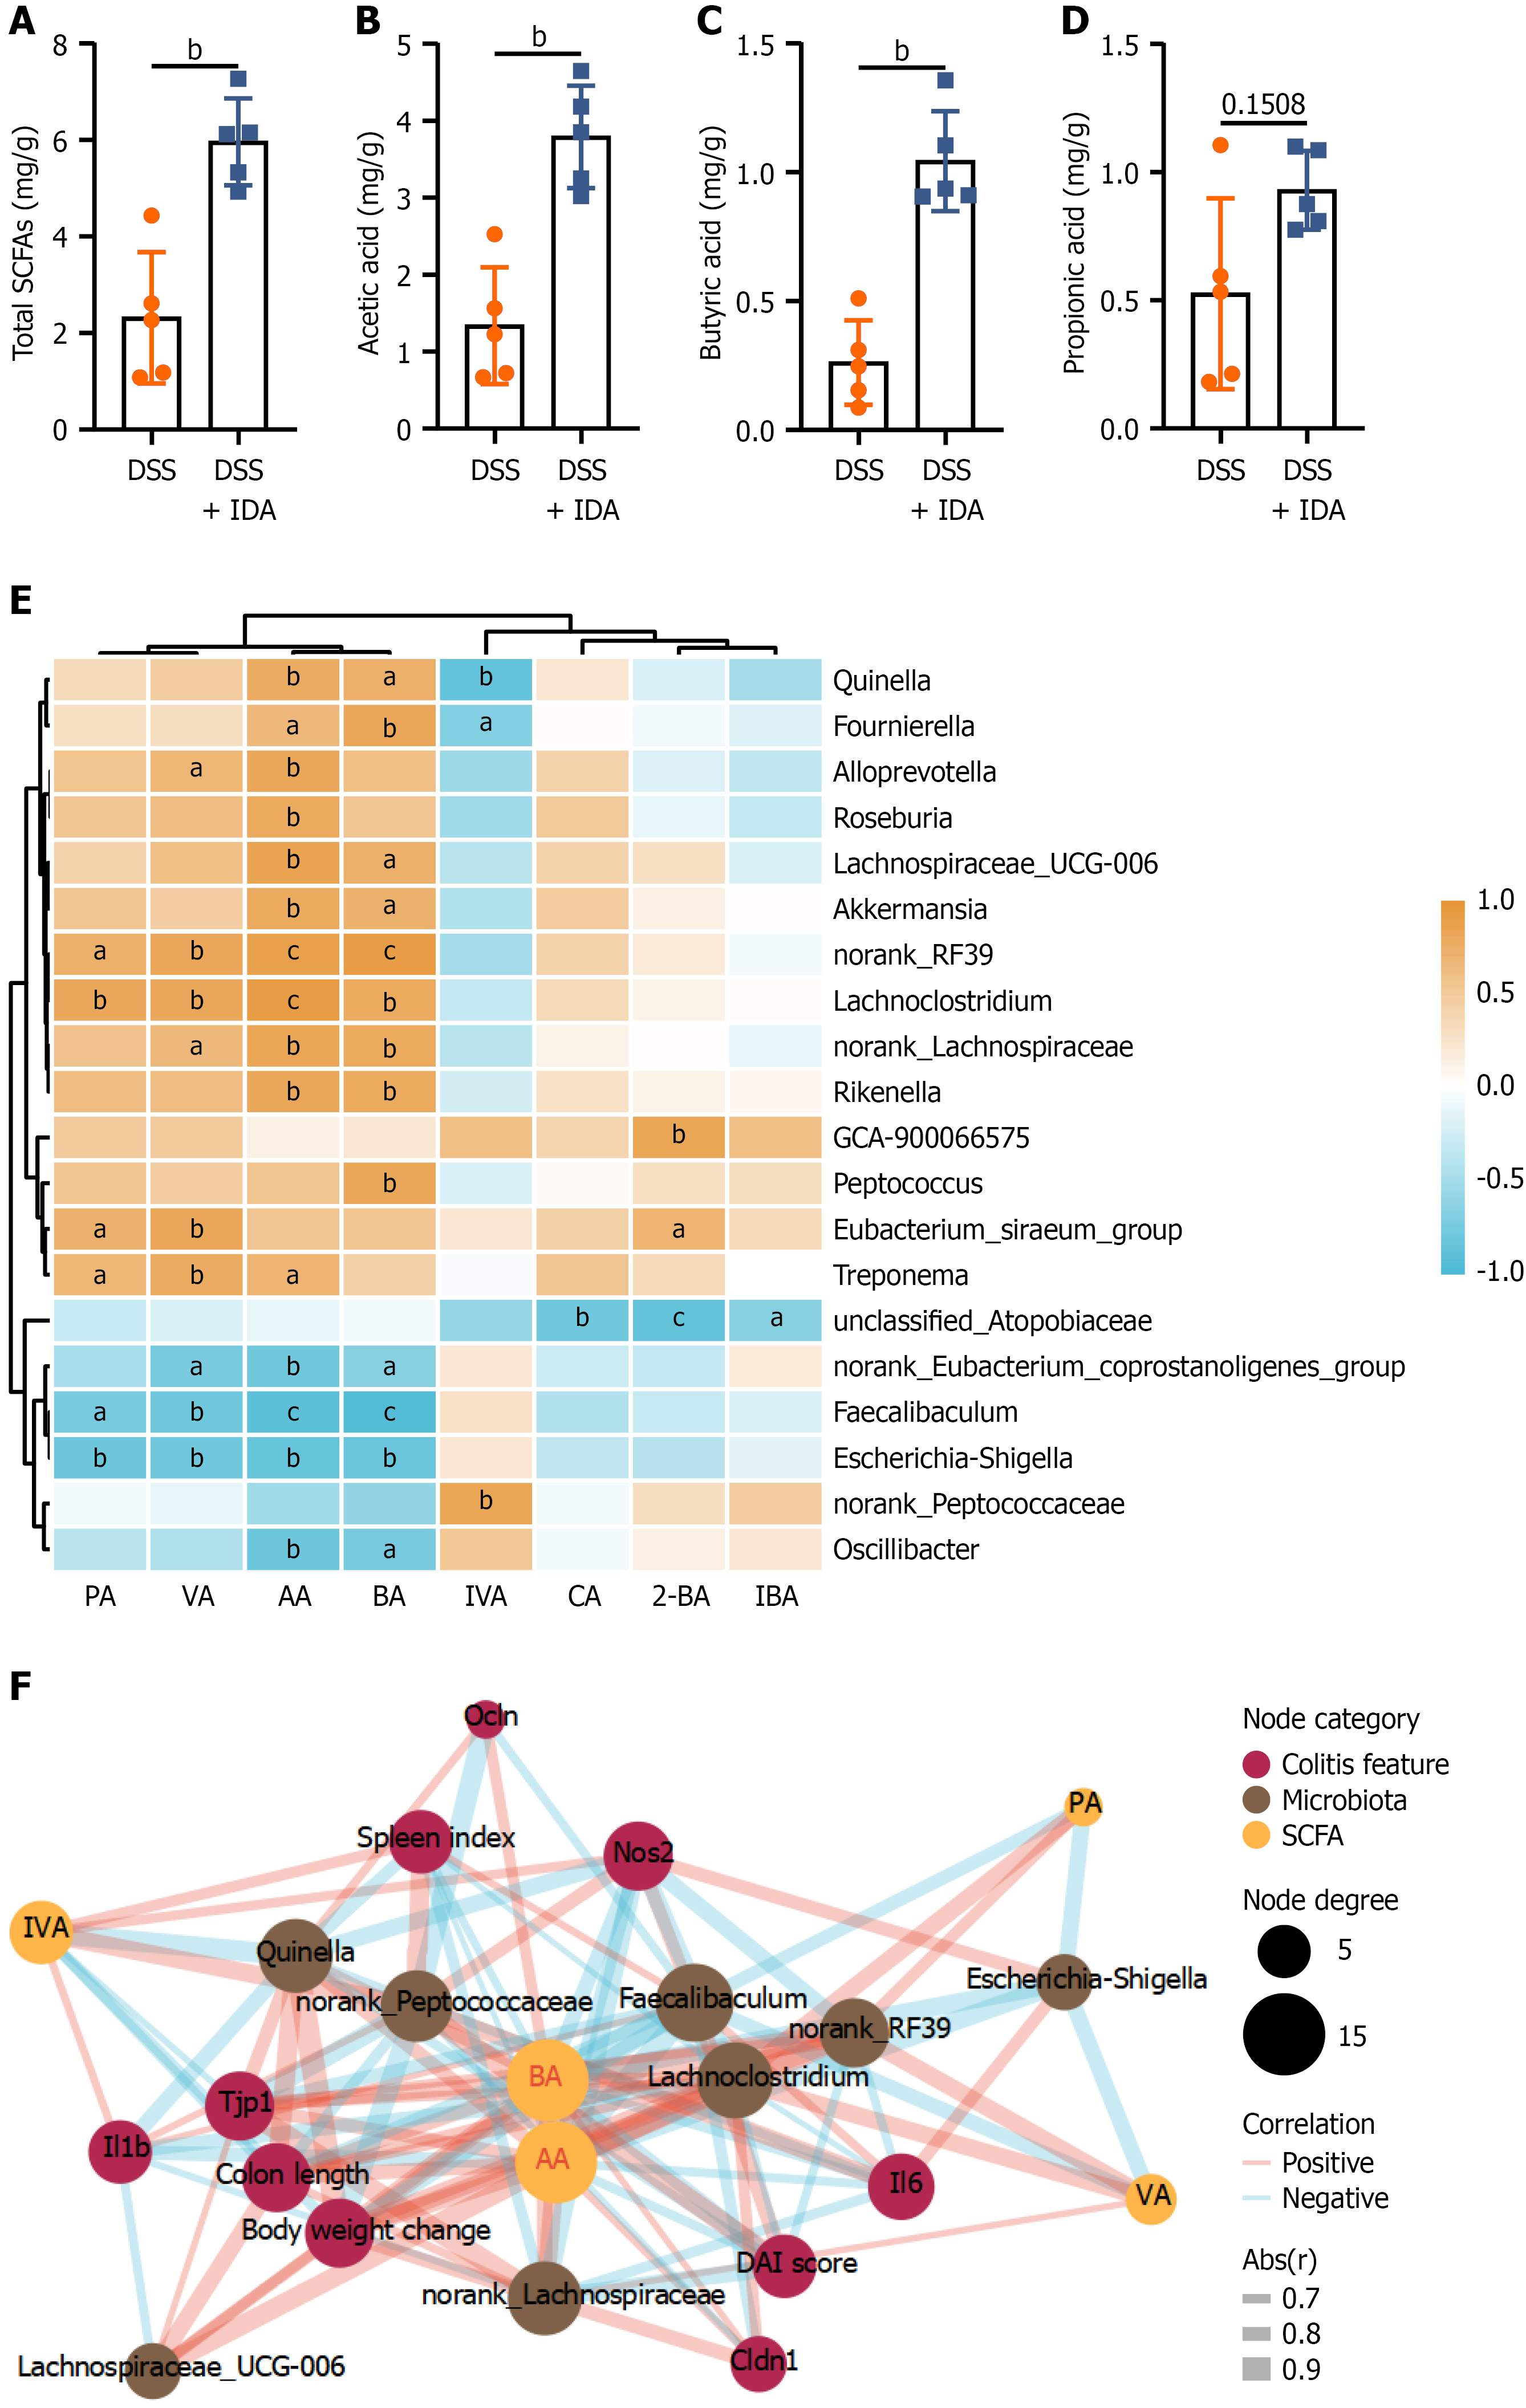
Figure 8 Trans-3-indoleacrylic acid modulates short-chain fatty acid metabolism and microbiota-short-chain fatty acid interactions in mice with colitis.
A-D: Concentrations of total short-chain fatty acids (SCFAs), acetic acid, butyric acid, and propionic acid in cecal contents; E: Spearman correlation heatmap between the differentially abundant bacterial genera and SCFAs; F: Correlation network analysis among colitis features, microbiota, and SCFAs. Node sizes represent the node degree. The data in A-D are shown as the mean ± SD (n = 5 mice per group). Five randomly selected mice from each group were included in the SCFA analysis due to insufficient fecal sample availability. Group comparisons were analyzed using Mann-Whitney test. In E and F, red indicates positive correlations, while blue indicates negative correlations. aP < 0.05, bP < 0.01, cP < 0.001. DSS: Dextran sulfate sodium; IDA: Trans-3-indoleacrylic acid; SCFAs: Short-chain fatty acids; PA: Propionic acid; VA: Valeric acid; AA: Acetic acid; BA: Butyric acid; IVA: Isovaleric acid; CA: Caproic acid; 2-BA: 2-methylbutyric acid; IBA: Isobutyric acid; DAI: Disease activity index; Abs(r): Absolute value of the correlation coefficient.
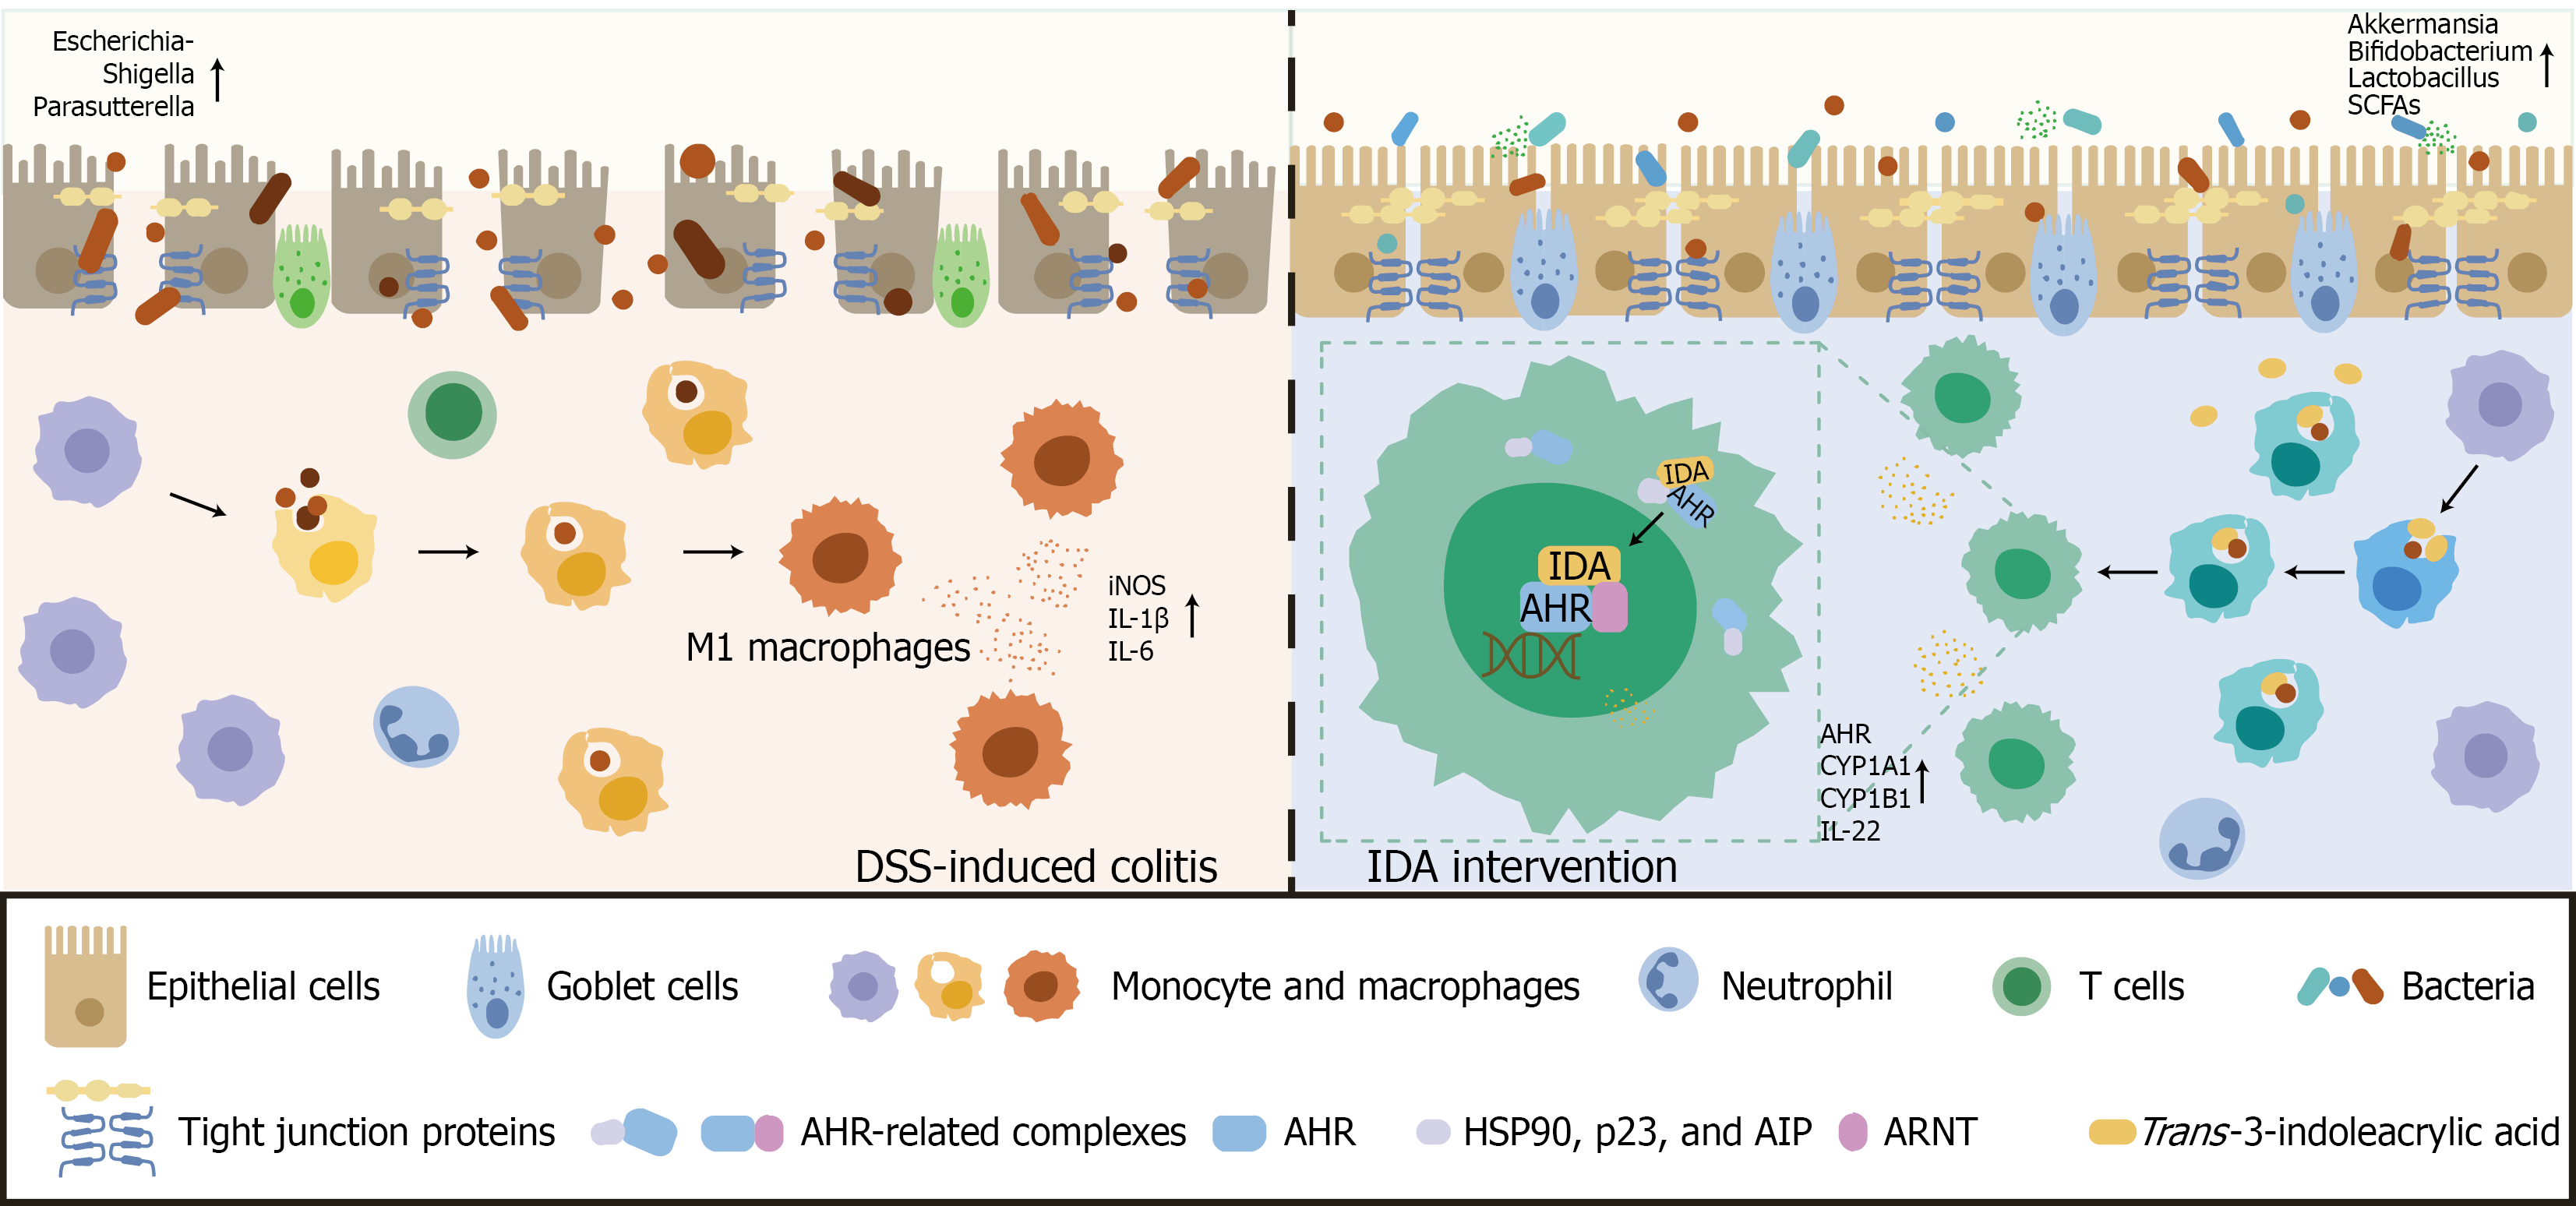
Figure 9 Proposed mechanism of trans-3-indoleacrylic acid-mediated protection against dextran sulfate sodium-induced colitis.
Trans-3-indoleacrylic acid activates aryl hydrocarbon receptor signaling to suppress pro-inflammatory M1 macrophage polarization, thereby alleviating intestinal inflammation and is associated with favorable alterations in gut microbiota composition and short-chain fatty acid profiles. IDA: Trans-3-indoleacrylic acid; DSS: Dextran sulfate sodium; AHR: Aryl hydrocarbon receptor; ARNT: Aryl hydrocarbon receptor nuclear translocator; SCFA: Short-chain fatty acid; AIP: Aryl hydrocarbon receptor-interacting protein.
- Citation: Tuo JW, Wu X, Shen ZH, Wang XY. Trans-3-indoleacrylic acid ameliorates dextran sulfate sodium-induced colitis by modulating macrophage M1 polarization through the aryl hydrocarbon receptor pathway. World J Gastroenterol 2026; 32(46): 123696
- URL: https://www.wjgnet.com/1007-9327/full/v32/i46/123696.htm
- DOI: https://dx.doi.org/10.3748/wjg.123696