
















Copyright: ©Author(s) 2026.
World J Gastroenterol. Dec 14, 2026; 32(46): 121840
Published online Dec 14, 2026. doi: 10.3748/wjg.121840
Published online Dec 14, 2026. doi: 10.3748/wjg.121840
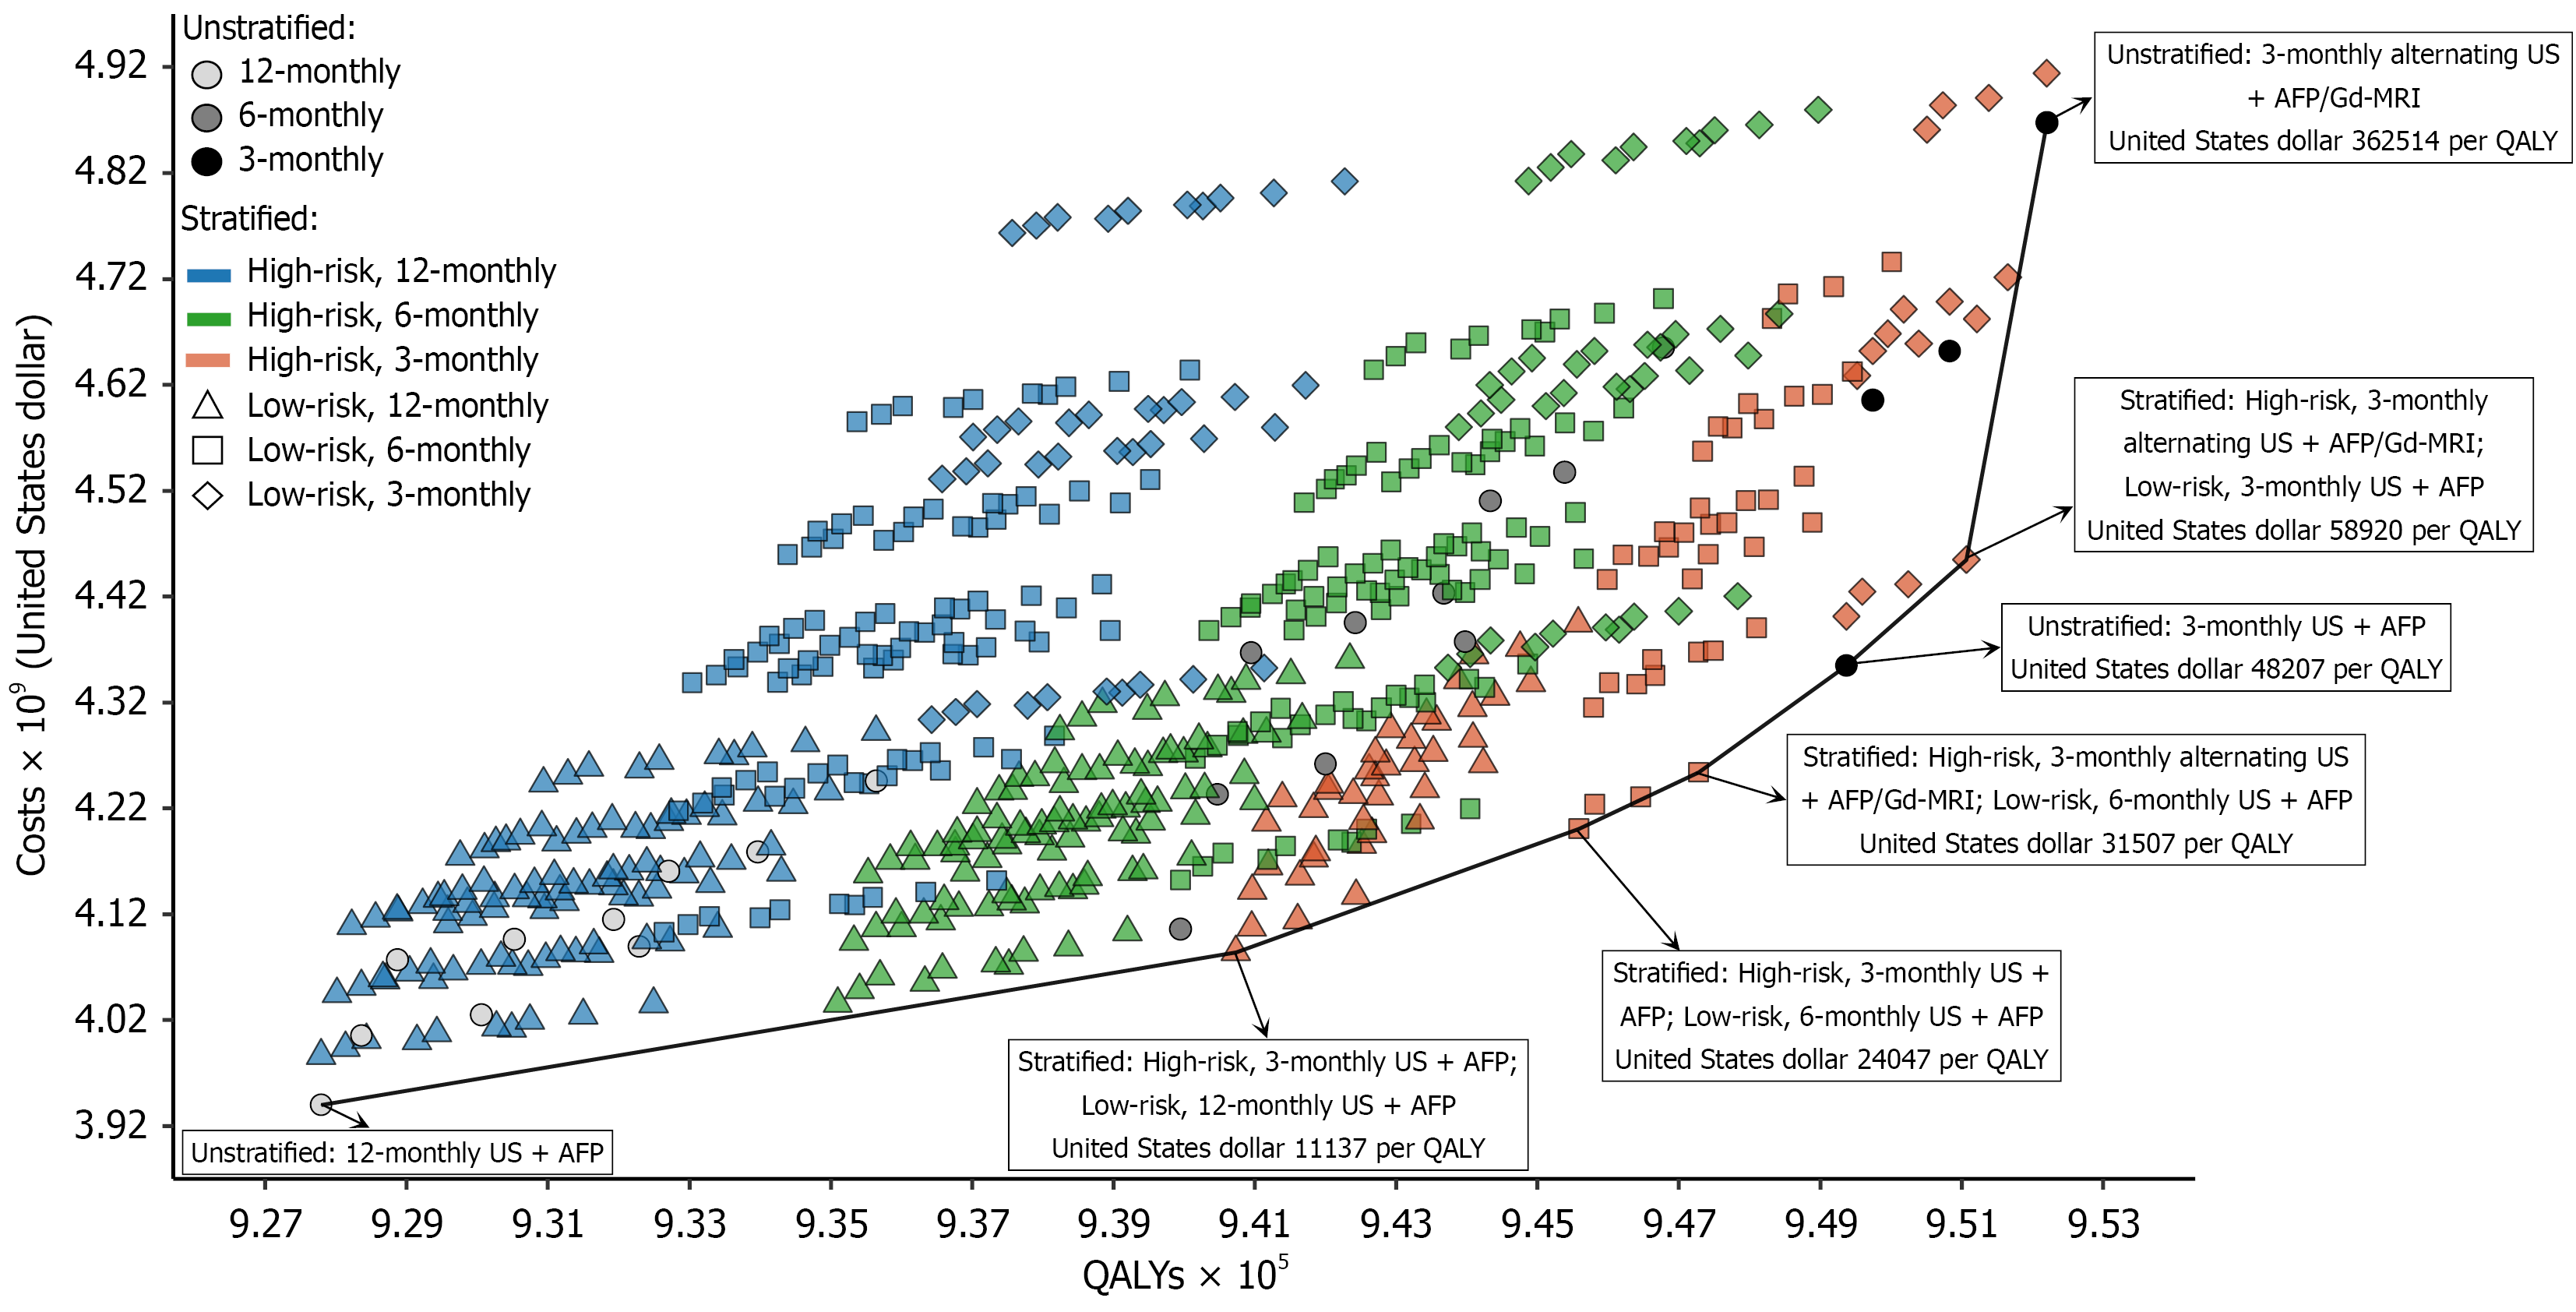
Figure 1 Cost-effectiveness frontier for all strategies (100000 cohort members).
The plotted points represent all 600 evaluated strategies. Strategies positioned on the cost-effectiveness frontier dominate those located to their upper left, respectively, and their names and incremental cost-effectiveness ratios compared to the next most effective non-dominated strategy are presented. Costs and quality-adjusted life-years are expressed as the value in 2024. US: Ultrasound; AFP: Alpha fetoprotein; QALY: Quality-adjusted life-year; Gd-MRI: Gadoxetic-enhanced magnetic resonance imaging.
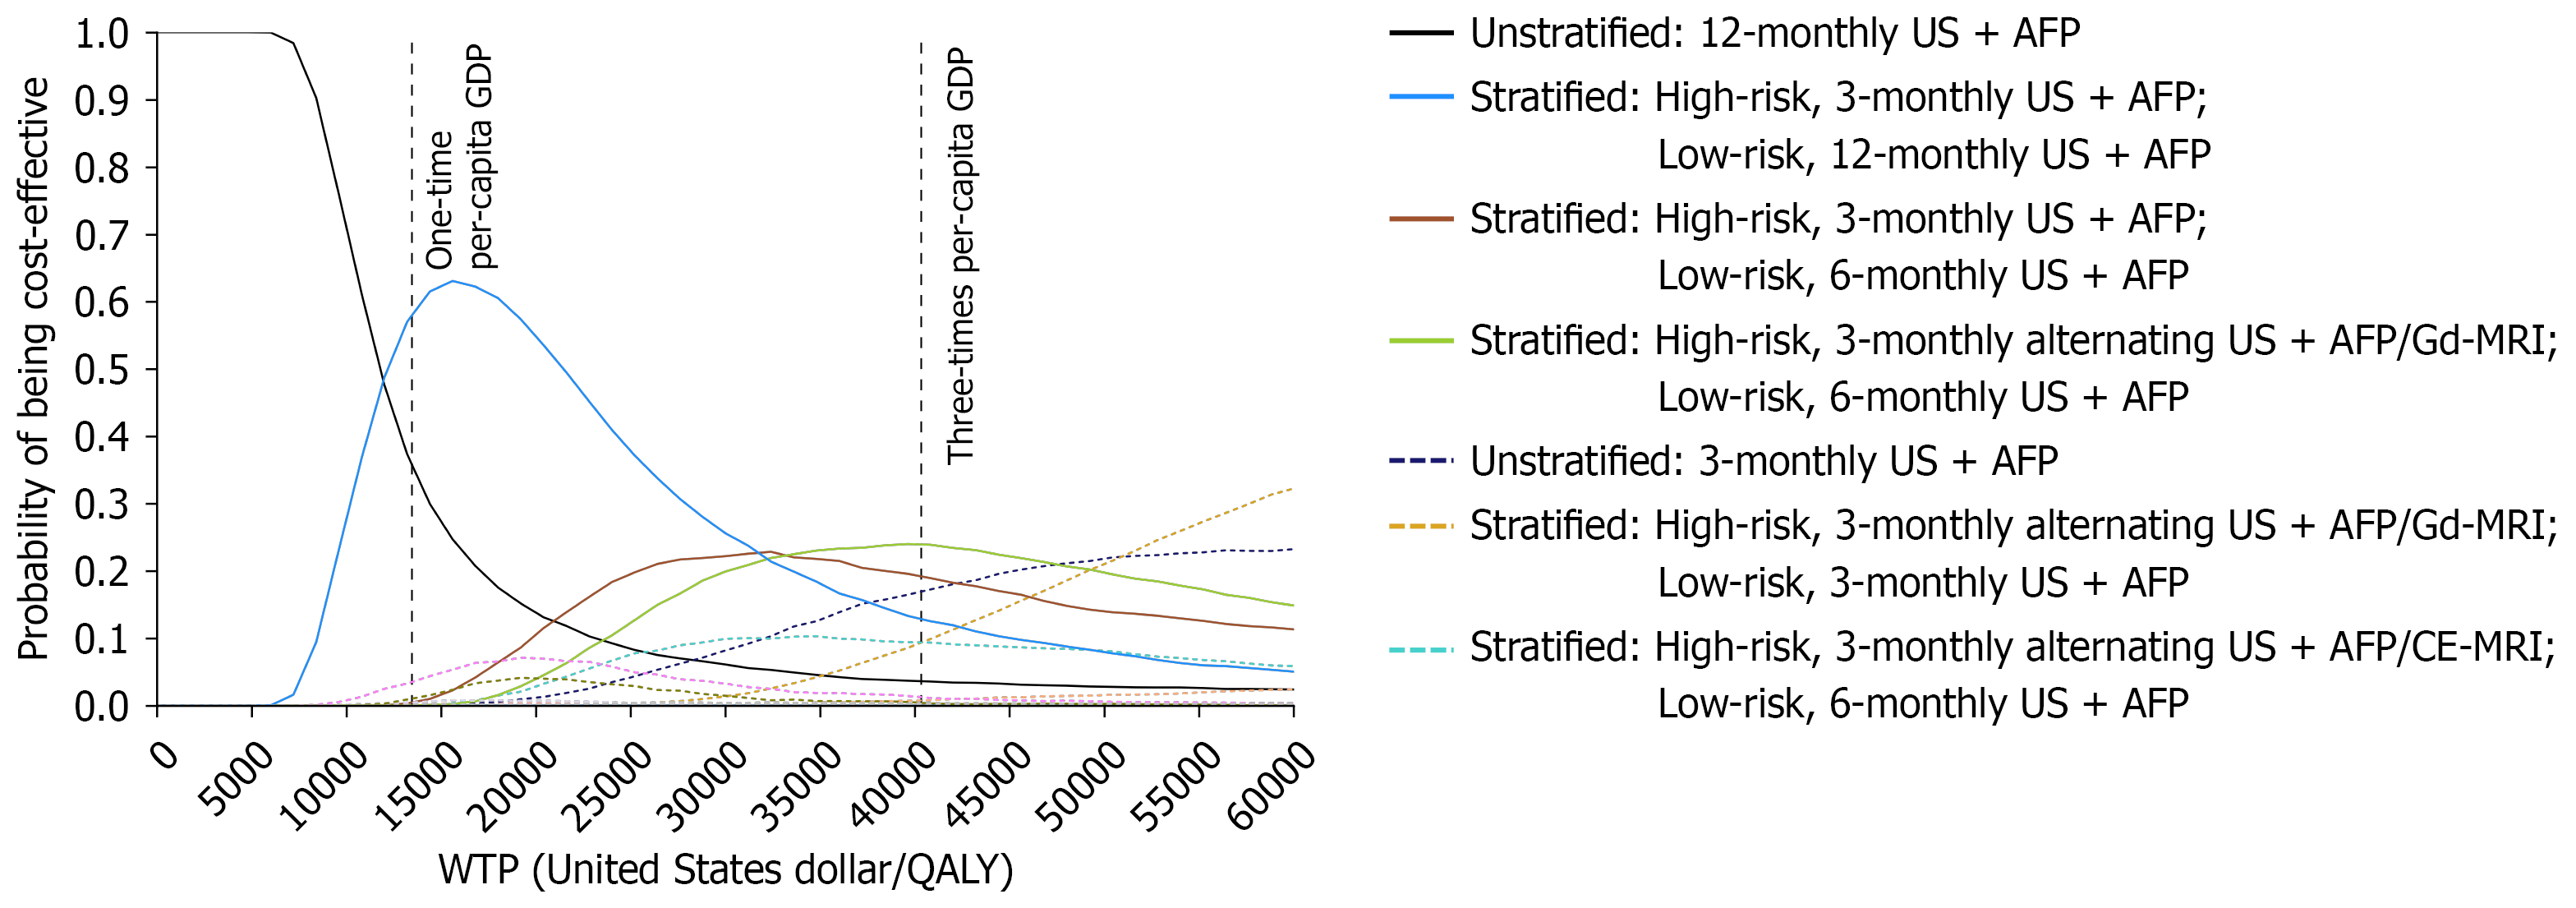
Figure 2 Cost-effectiveness acceptability curves for all strategies.
Dashed curves indicate screening strategies that never have the highest probability of being cost-effective within the willingness-to-pay threshold of three-times per-capita gross domestic product (only a subset is indicated in the legend), while solid curves represent screening strategies that may have the highest probability of being cost-effective within this threshold. Costs and quality-adjusted life-years are expressed as the value in 2024. WTP: Willingness-to-pay; GDP: Gross domestic product; US: Ultrasound; AFP: Alpha fetoprotein; QALY: Quality-adjusted life-year; Gd-MRI: Gadoxetic-enhanced magnetic resonance imaging; CE-MRI: Contrast-enhanced magnetic resonance imaging.
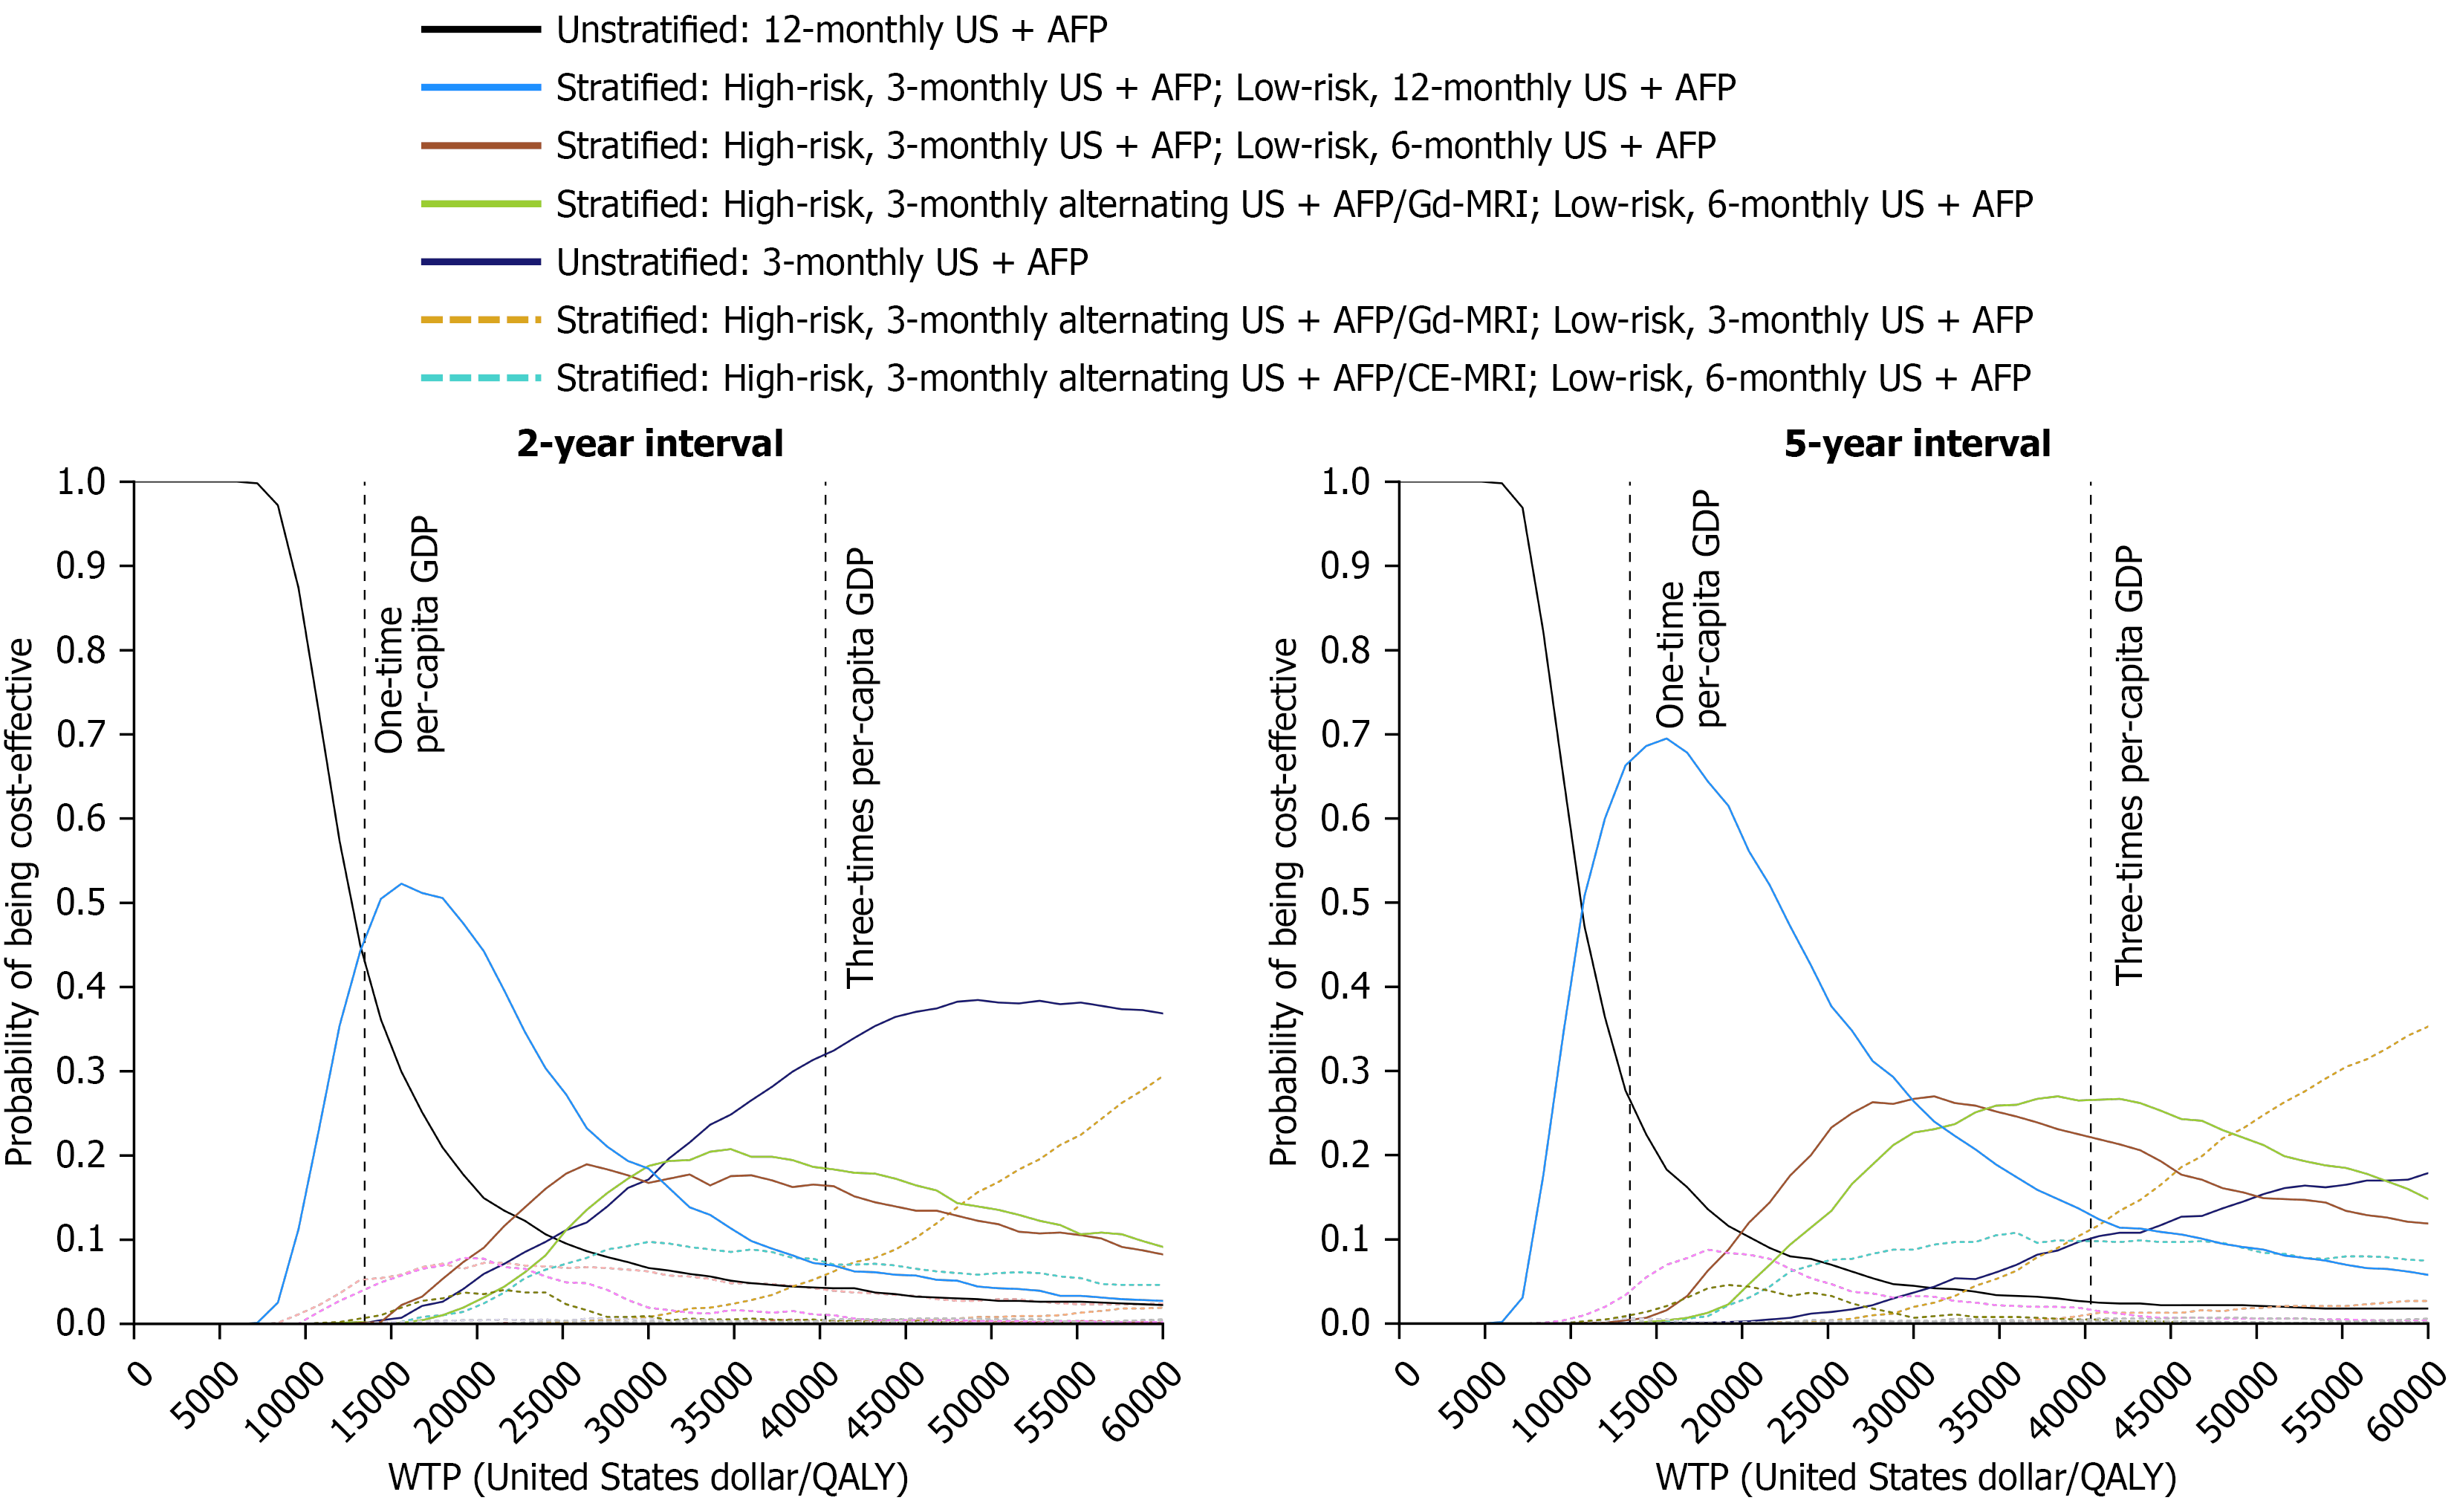
Figure 3 Cost-effectiveness acceptability curves for all strategies under varying intervals of periodic re-stratification testing.
Dashed curves indicate screening strategies that never have the highest probability of being cost-effective within the willingness-to-pay threshold of three-times per-capita gross domestic product (only a subset is indicated in the legend), while solid curves represent screening strategies that may have the highest probability of being cost-effective within this threshold. Costs and quality-adjusted life-years are expressed as the value in 2024. WTP: Willingness-to-pay; GDP: Gross domestic product; US: Ultrasound; AFP: Alpha fetoprotein; QALY: Quality-adjusted life-year; Gd-MRI: Gadoxetic-enhanced magnetic resonance imaging; CE-MRI: Contrast-enhanced magnetic resonance imaging.
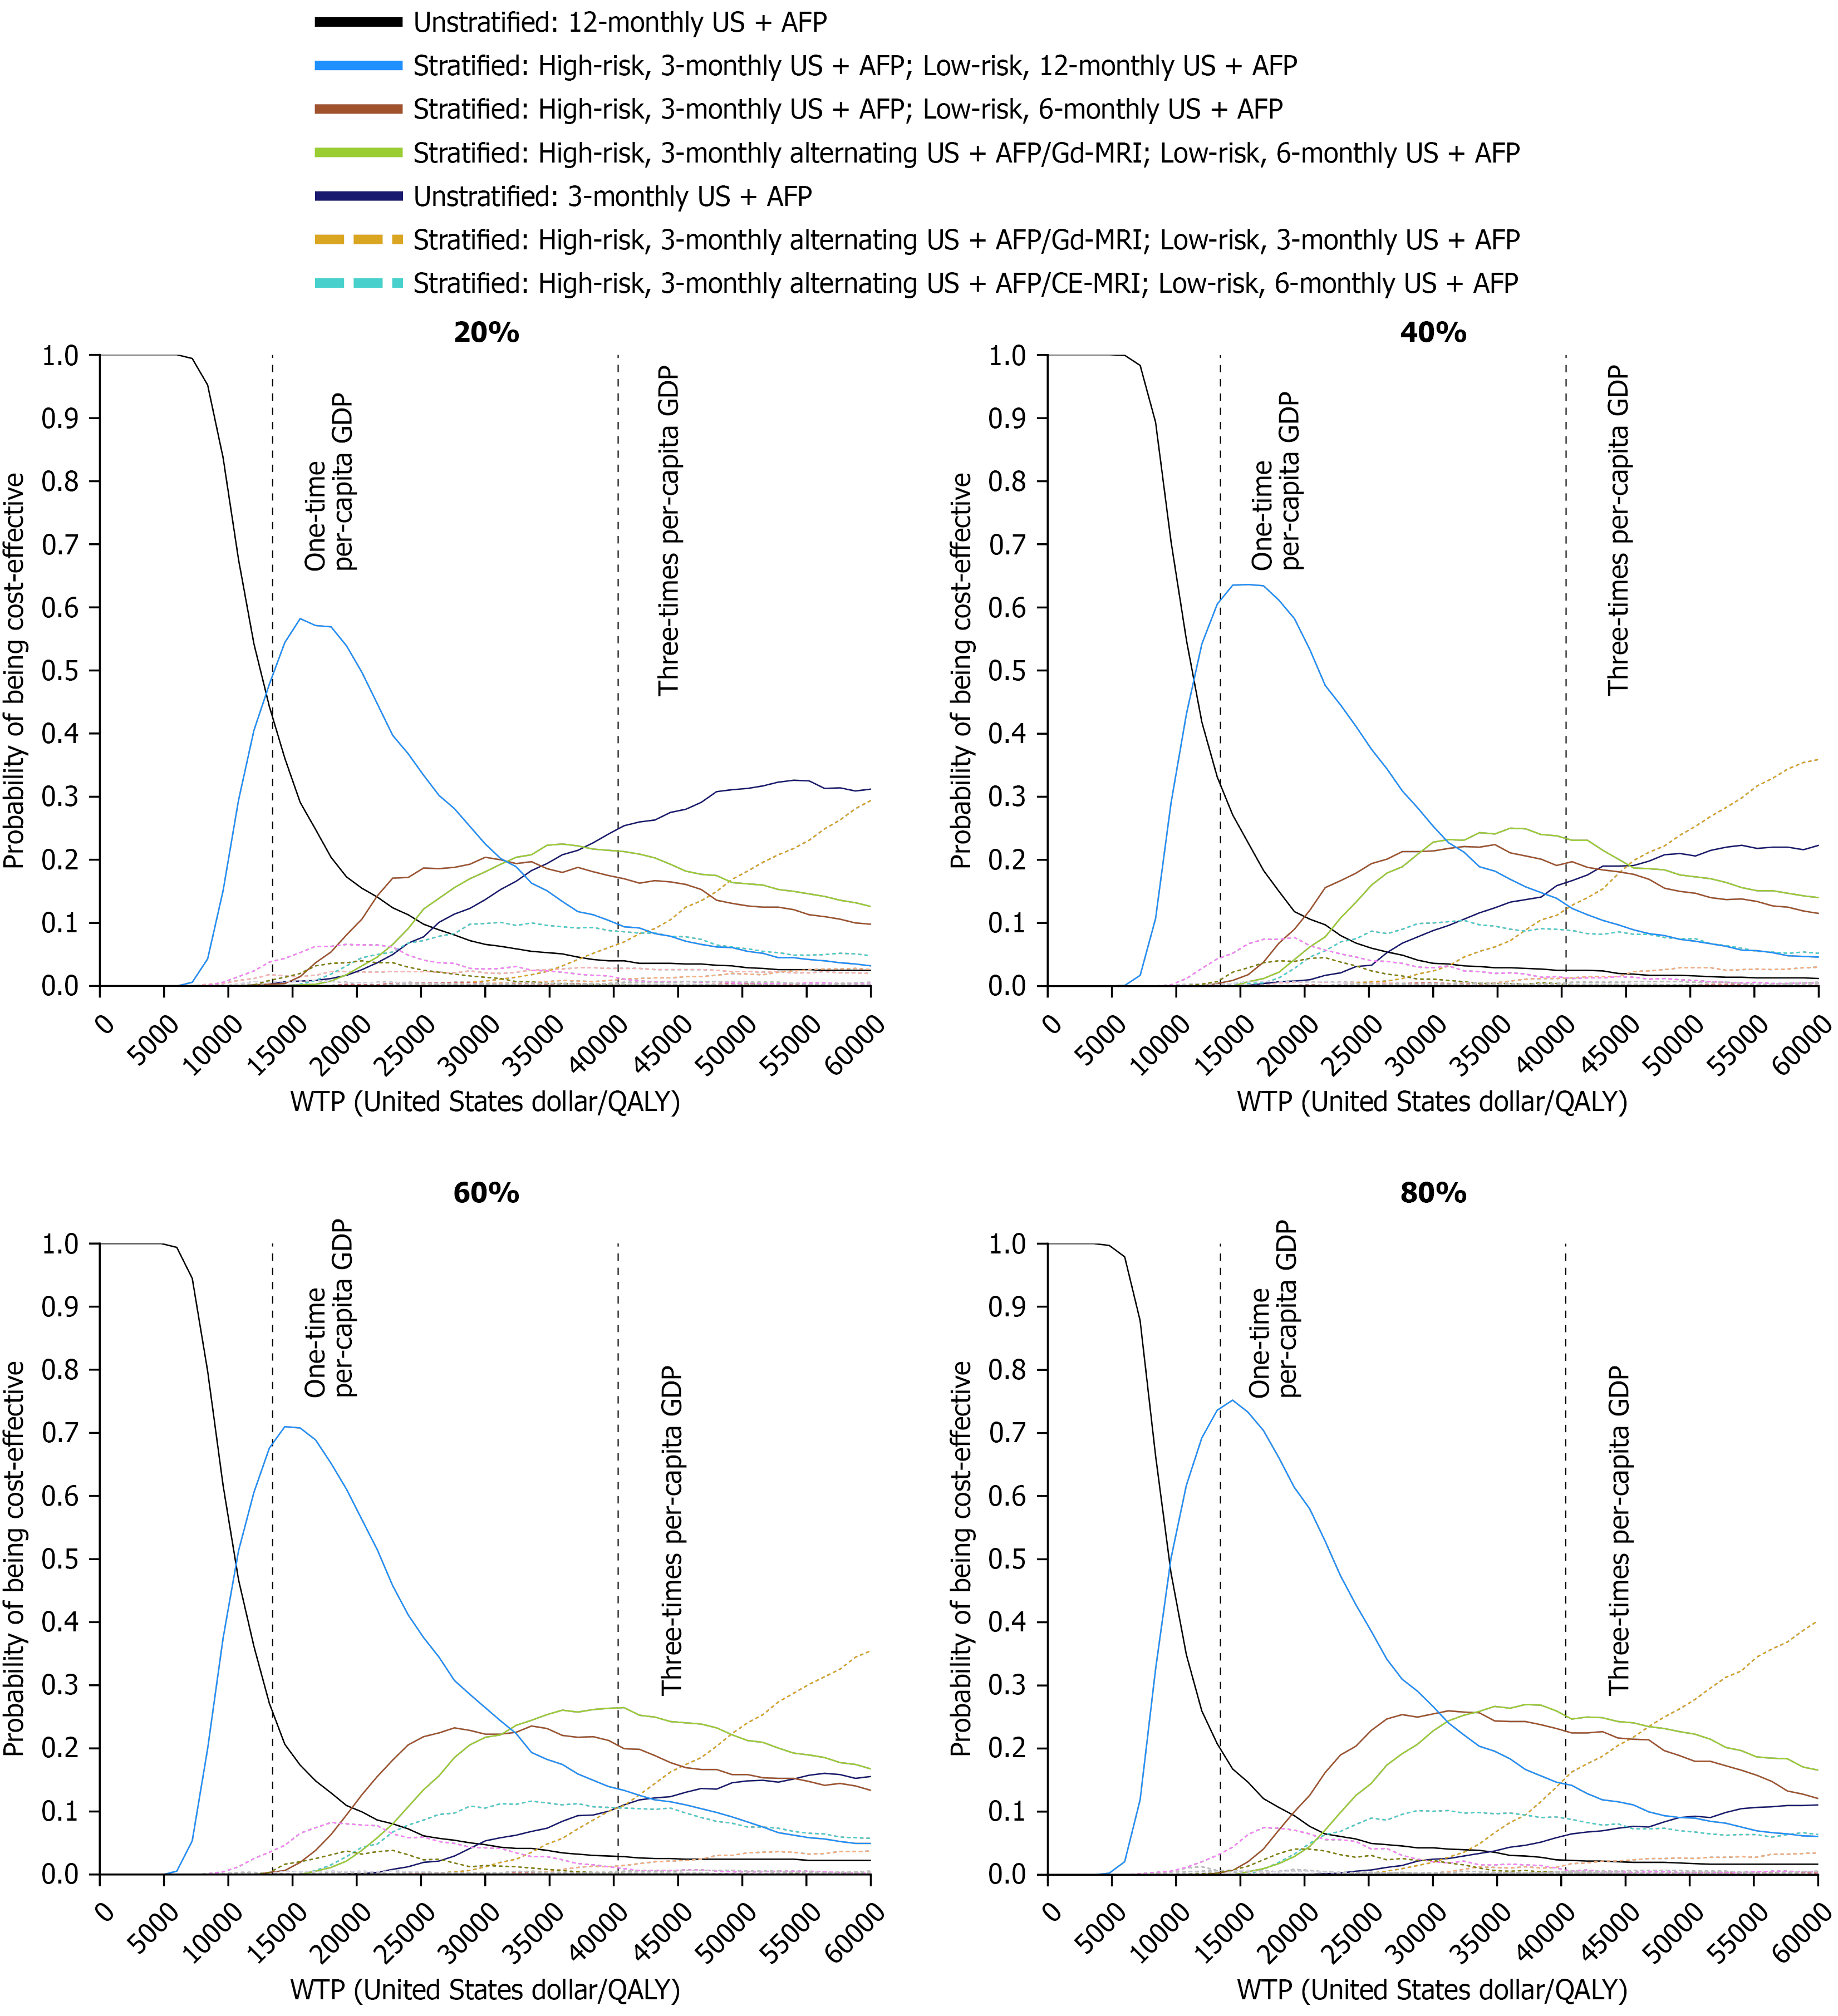
Figure 4 Cost-effectiveness acceptability curves for all strategies under various percentages of cell free DNA testing costs reduction at a two-year re-stratification testing interval.
Dashed curves indicate screening strategies that never have the highest probability of being cost-effective within the willingness-to-pay threshold of three-times per-capita gross domestic product (only a subset is indicated in the legend), while solid curves represent screening strategies that may have the highest probability of being cost-effective within this threshold. Costs and quality-adjusted life-years are expressed as the value in 2024. WTP: Willingness-to-pay; GDP: Gross domestic product; US: Ultrasound; AFP: Alpha fetoprotein; QALY: Quality-adjusted life-year; Gd-MRI: Gadoxetic-enhanced magnetic resonance imaging; CE-MRI: Contrast-enhanced magnetic resonance imaging.
- Citation: Zhang YB, Li YX, Zhang WD, Hou XB, Li R, Xia RY, Shen MW, Zou ZR, Zhuang GH. Cost-effectiveness of risk-stratified hepatocellular carcinoma screening using the age-male-albumin-bilirubin-platelets score-based stepwise enrichment approach in patients with cirrhosis. World J Gastroenterol 2026; 32(46): 121840
- URL: https://www.wjgnet.com/1007-9327/full/v32/i46/121840.htm
- DOI: https://dx.doi.org/10.3748/wjg.121840