
















Copyright: ©Author(s) 2026.
World J Gastroenterol. Dec 14, 2026; 32(46): 121708
Published online Dec 14, 2026. doi: 10.3748/wjg.121708
Published online Dec 14, 2026. doi: 10.3748/wjg.121708
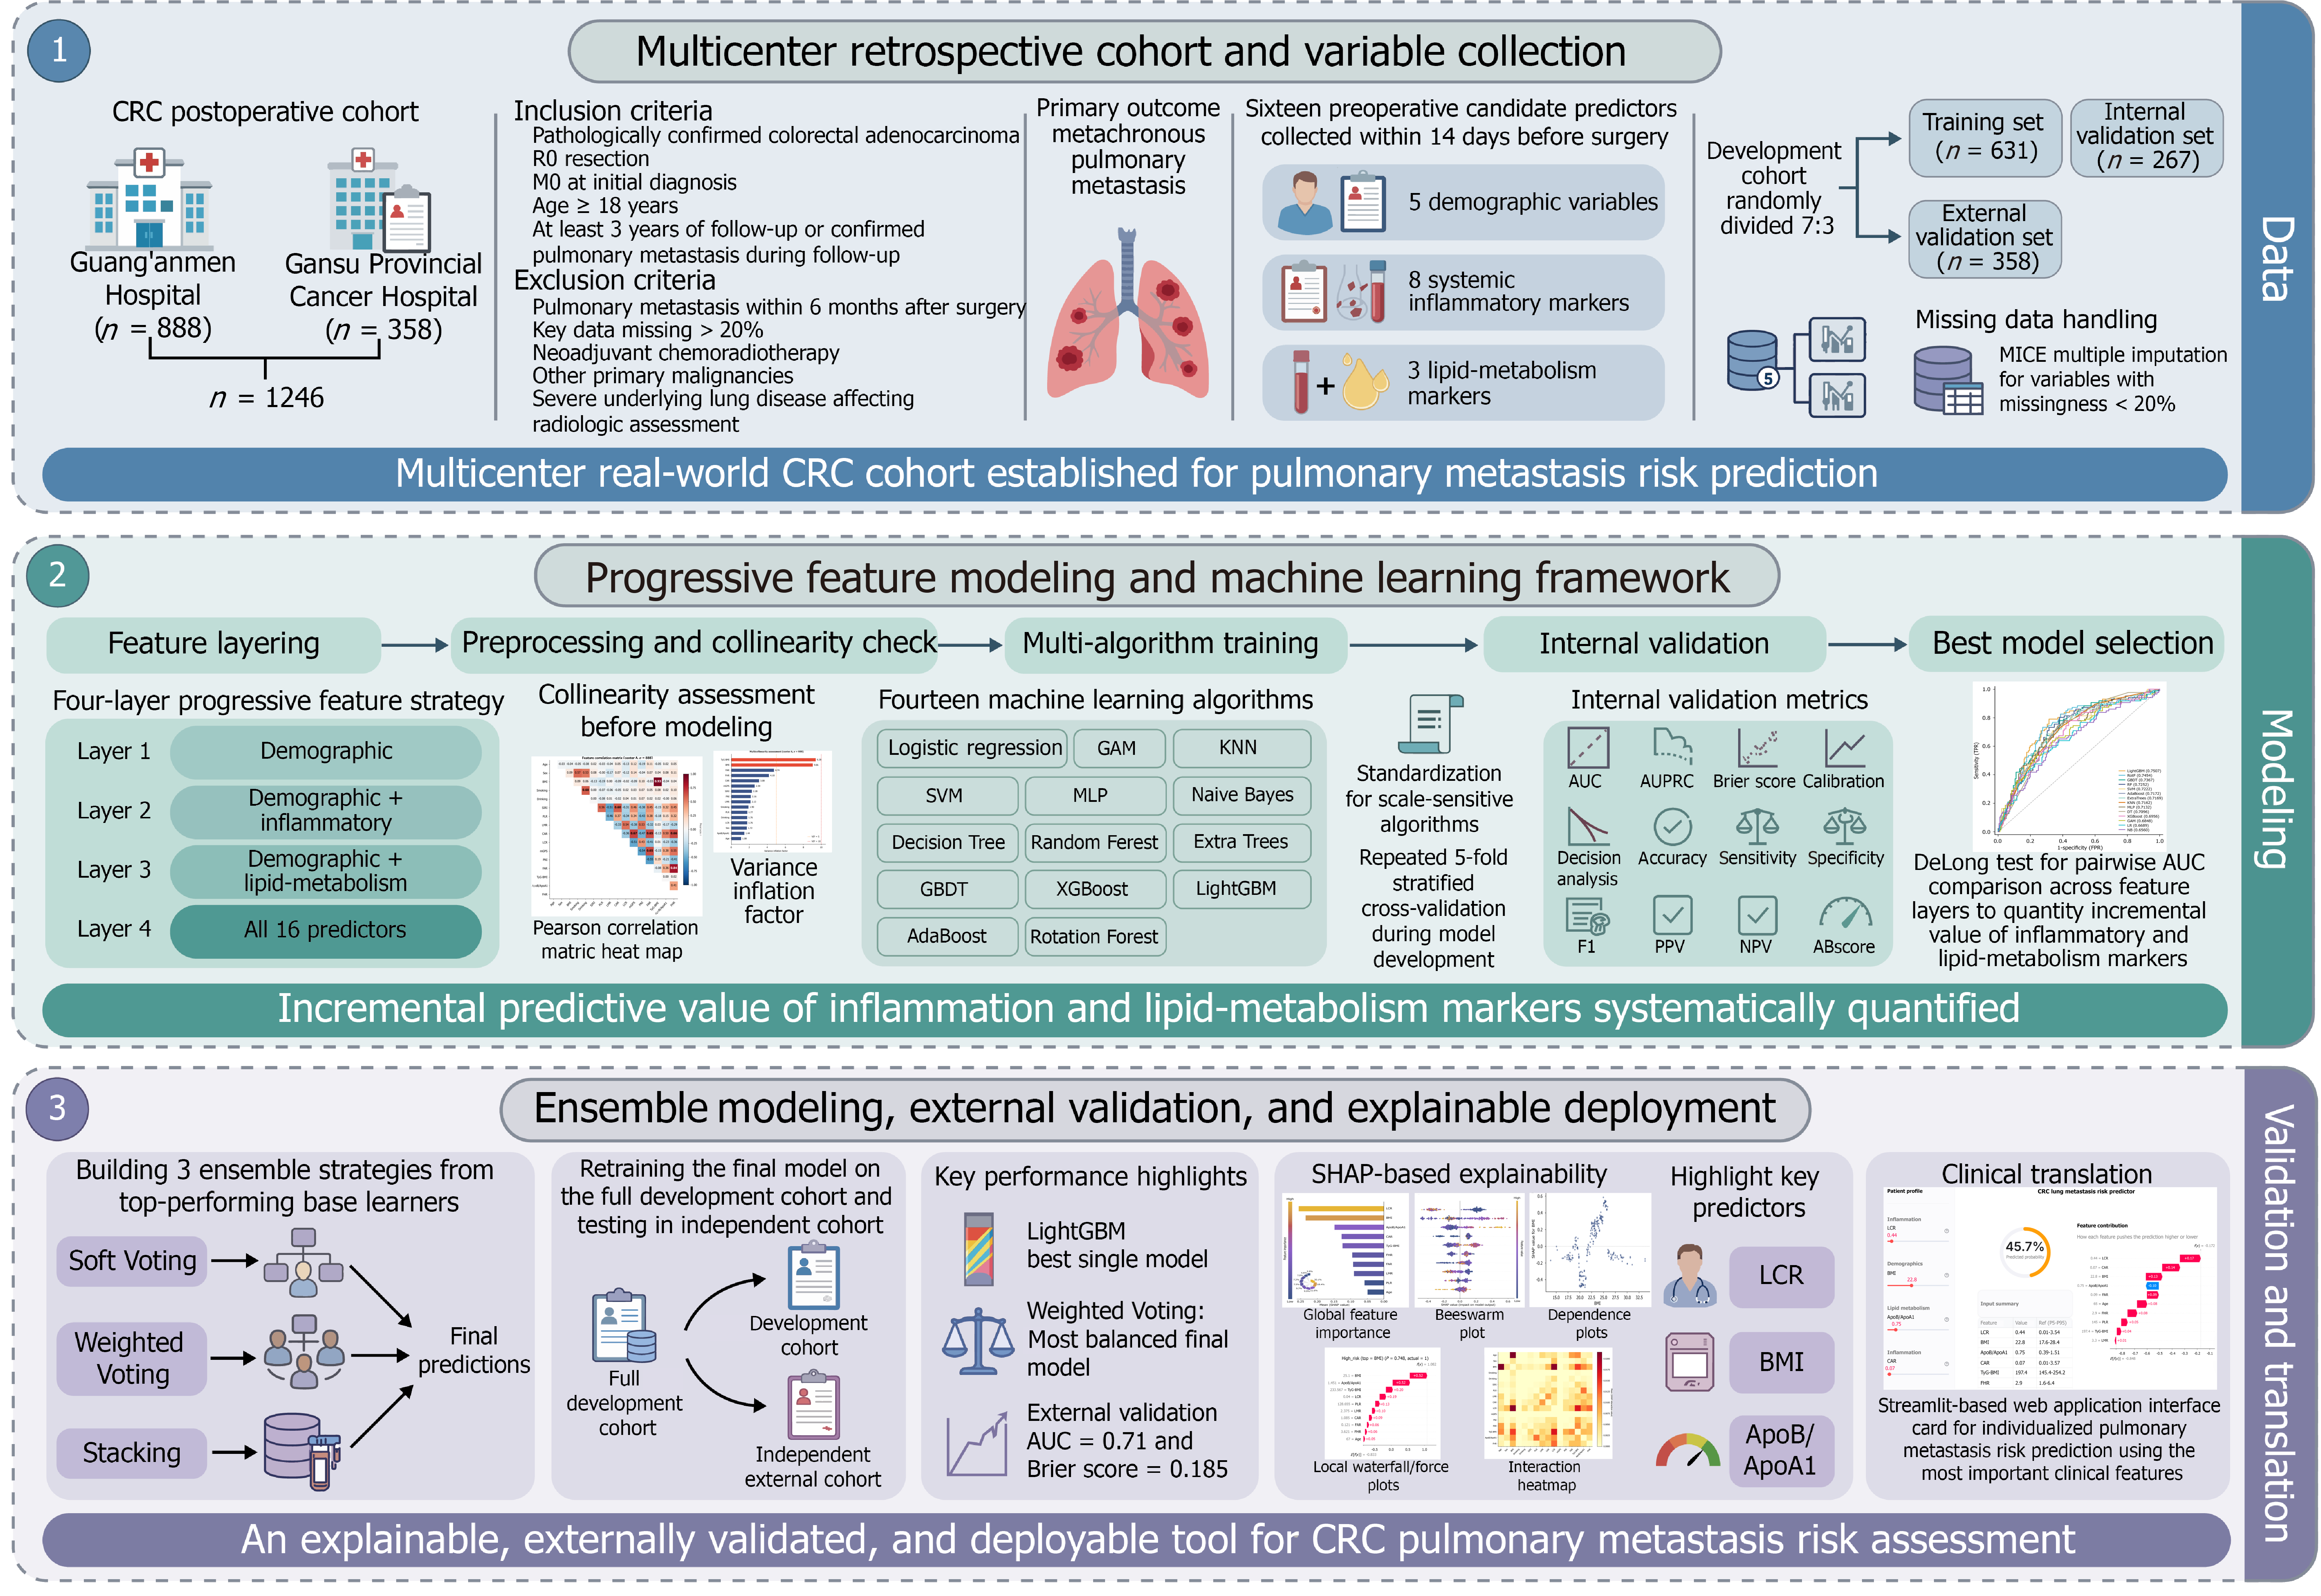
Figure 1 Flow chart of the study design.
CRC: Colorectal cancer; KNN: K-Nearest Neighbors; SVM: Support Vector Machine; MLP: Multi-Layer Perceptron; GBDT: Gradient Boosting Decision Tree; AUC: Area under the curve; AUROC: Area under the receiver operating characteristic; PPV: Positive predictive value; NPV: Negative predictive value; SHAP: SHapley Additive exPlanations; LCR: Lymphocyte-to-C-reactive protein ratio; BMI: Body mass index; ApoB/ApoA1: Apolipoprotein B-to-apolipoprotein A1 ratio.
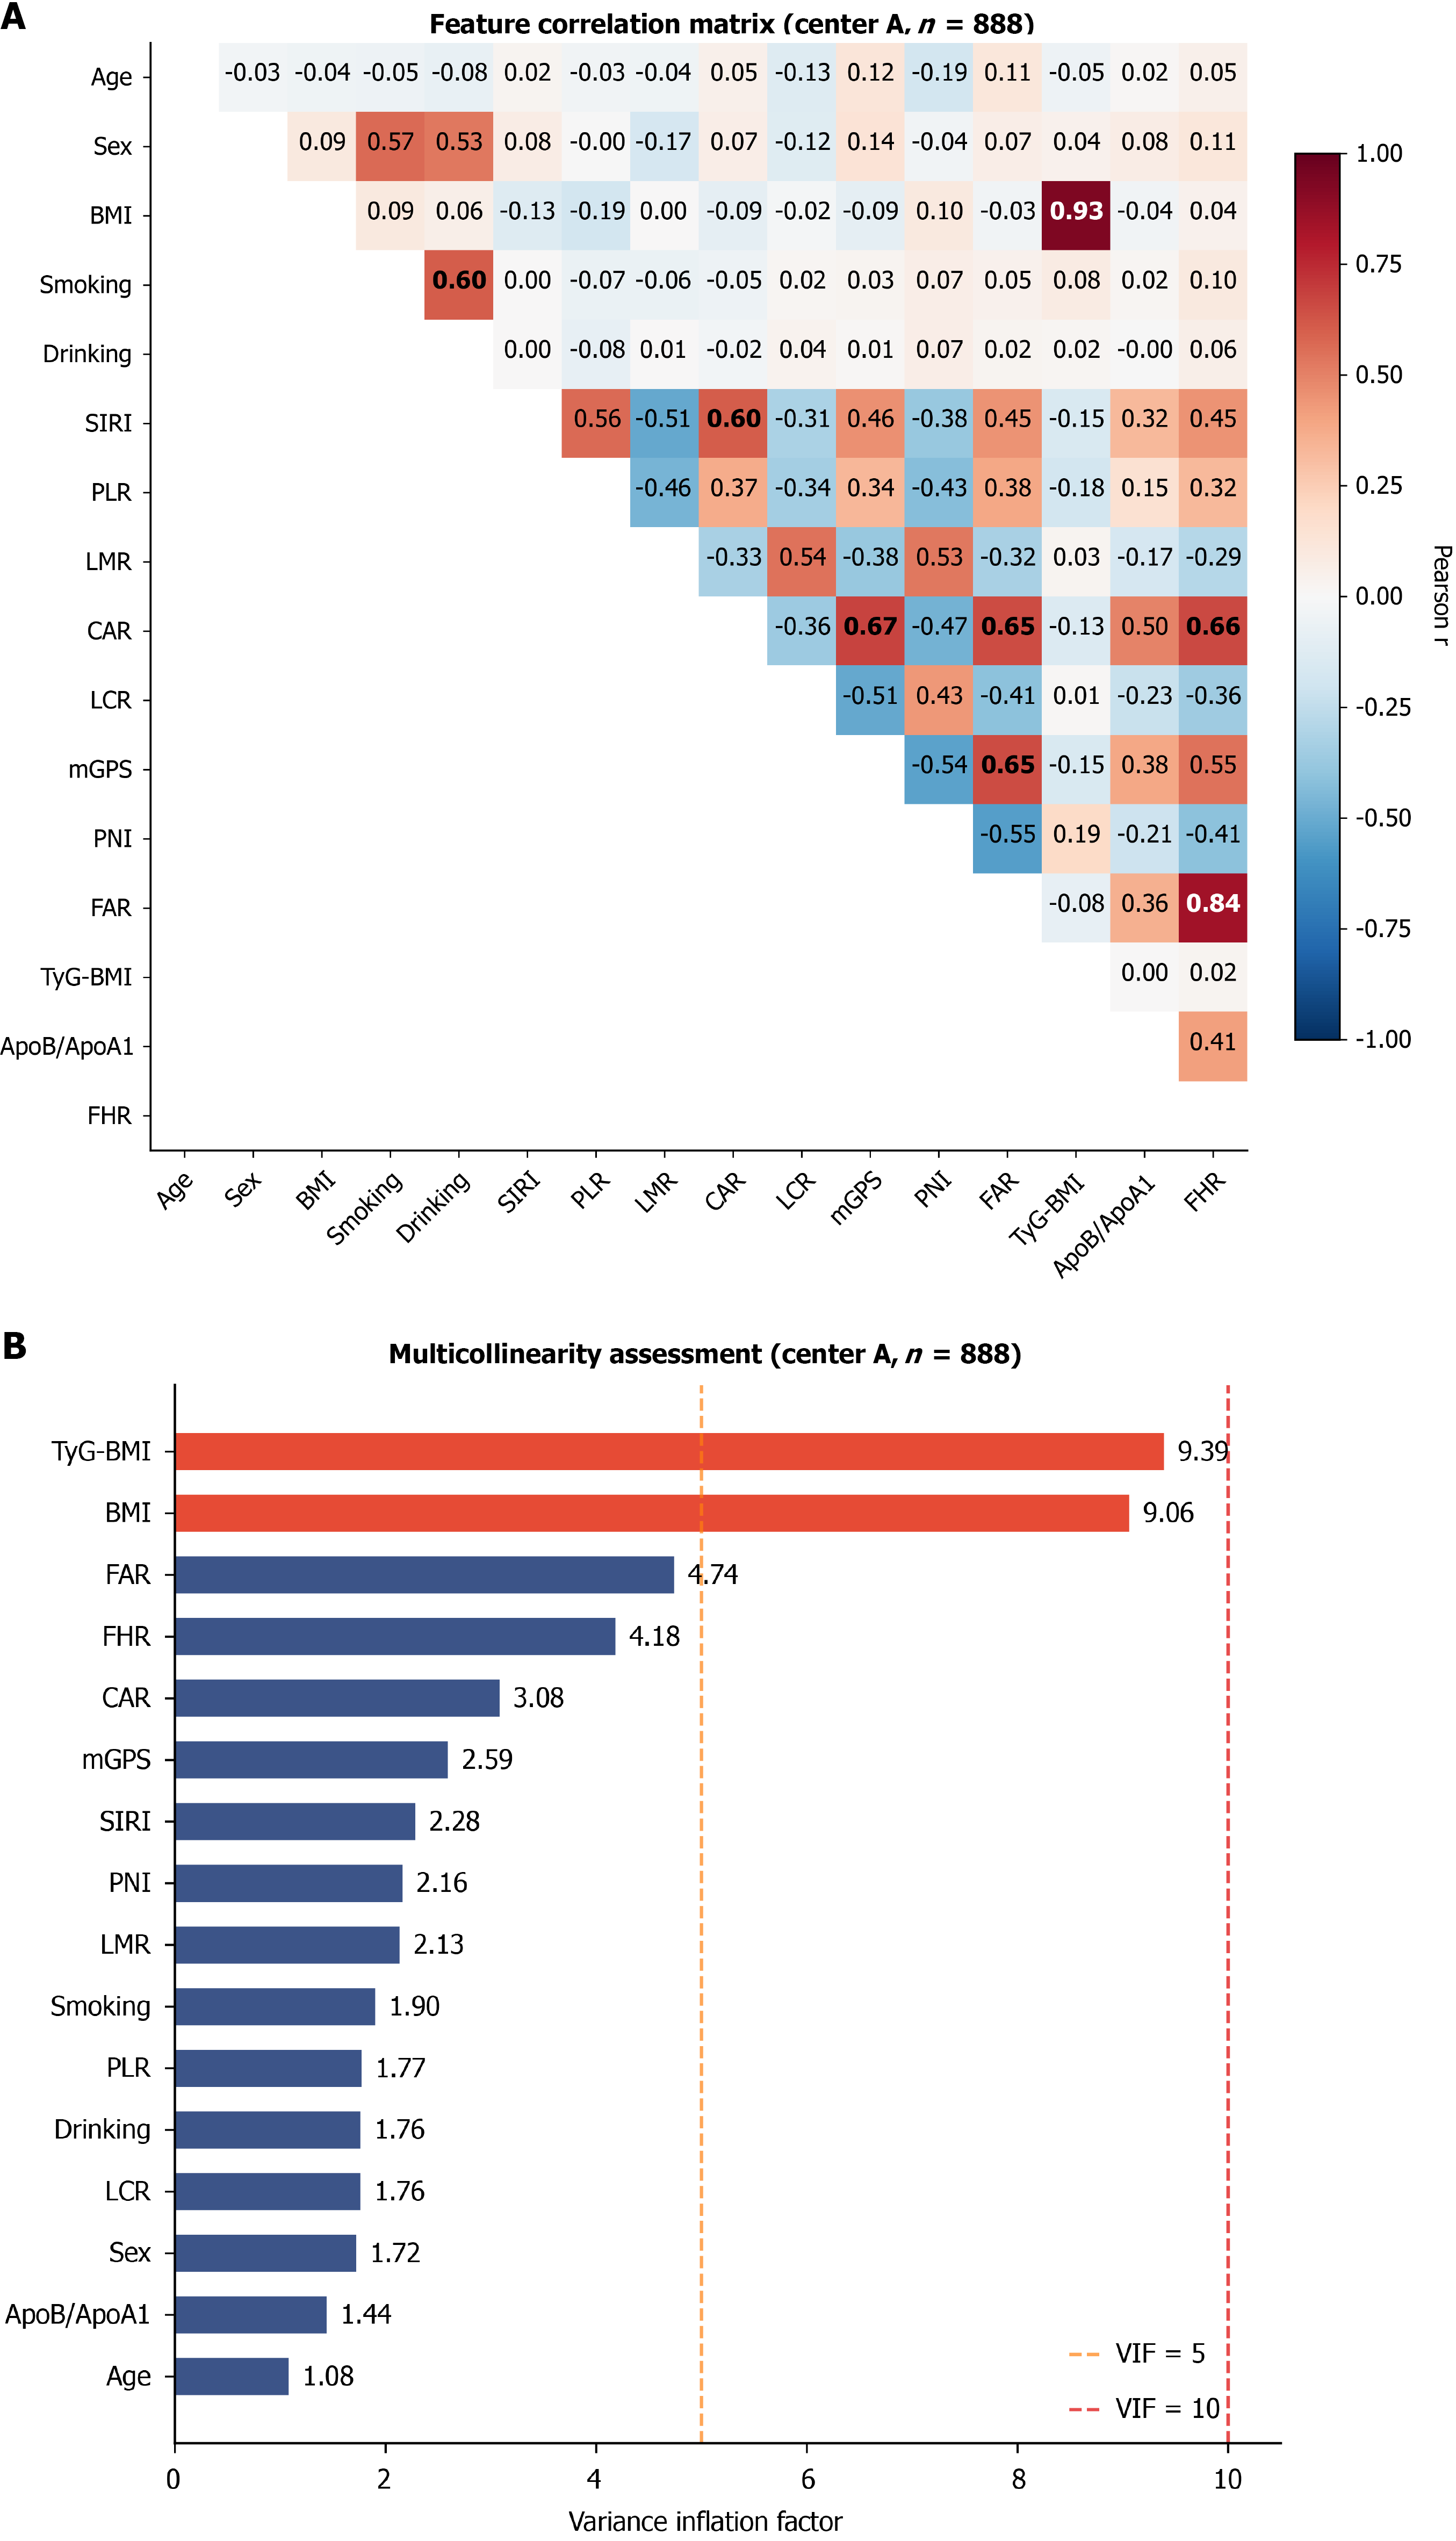
Figure 2 Feature collinearity assessment.
A: Pearson correlation coefficient heatmap; B: Variance inflation factor. BMI: Body mass index; SIRI: Systemic inflammation response index; LMR: Lymphocyte-to-monocyte ratio; PLR: Platelet-to-lymphocyte ratio; CAR: C-reactive protein-to-albumin ratio; LCR: Lymphocyte-to-C-reactive protein ratio; mGPS: Modified Glasgow Prognostic Score; PNI: Prognostic nutritional index; FAR: Fibrinogen-to-albumin ratio; TyG-BMI: Triglyceride-glucose-body mass index; FHR: Fibrinogen-to-high-density lipoprotein cholesterol ratio; ApoB/ApoA1: Apolipoprotein B-to-apolipoprotein A1 ratio.
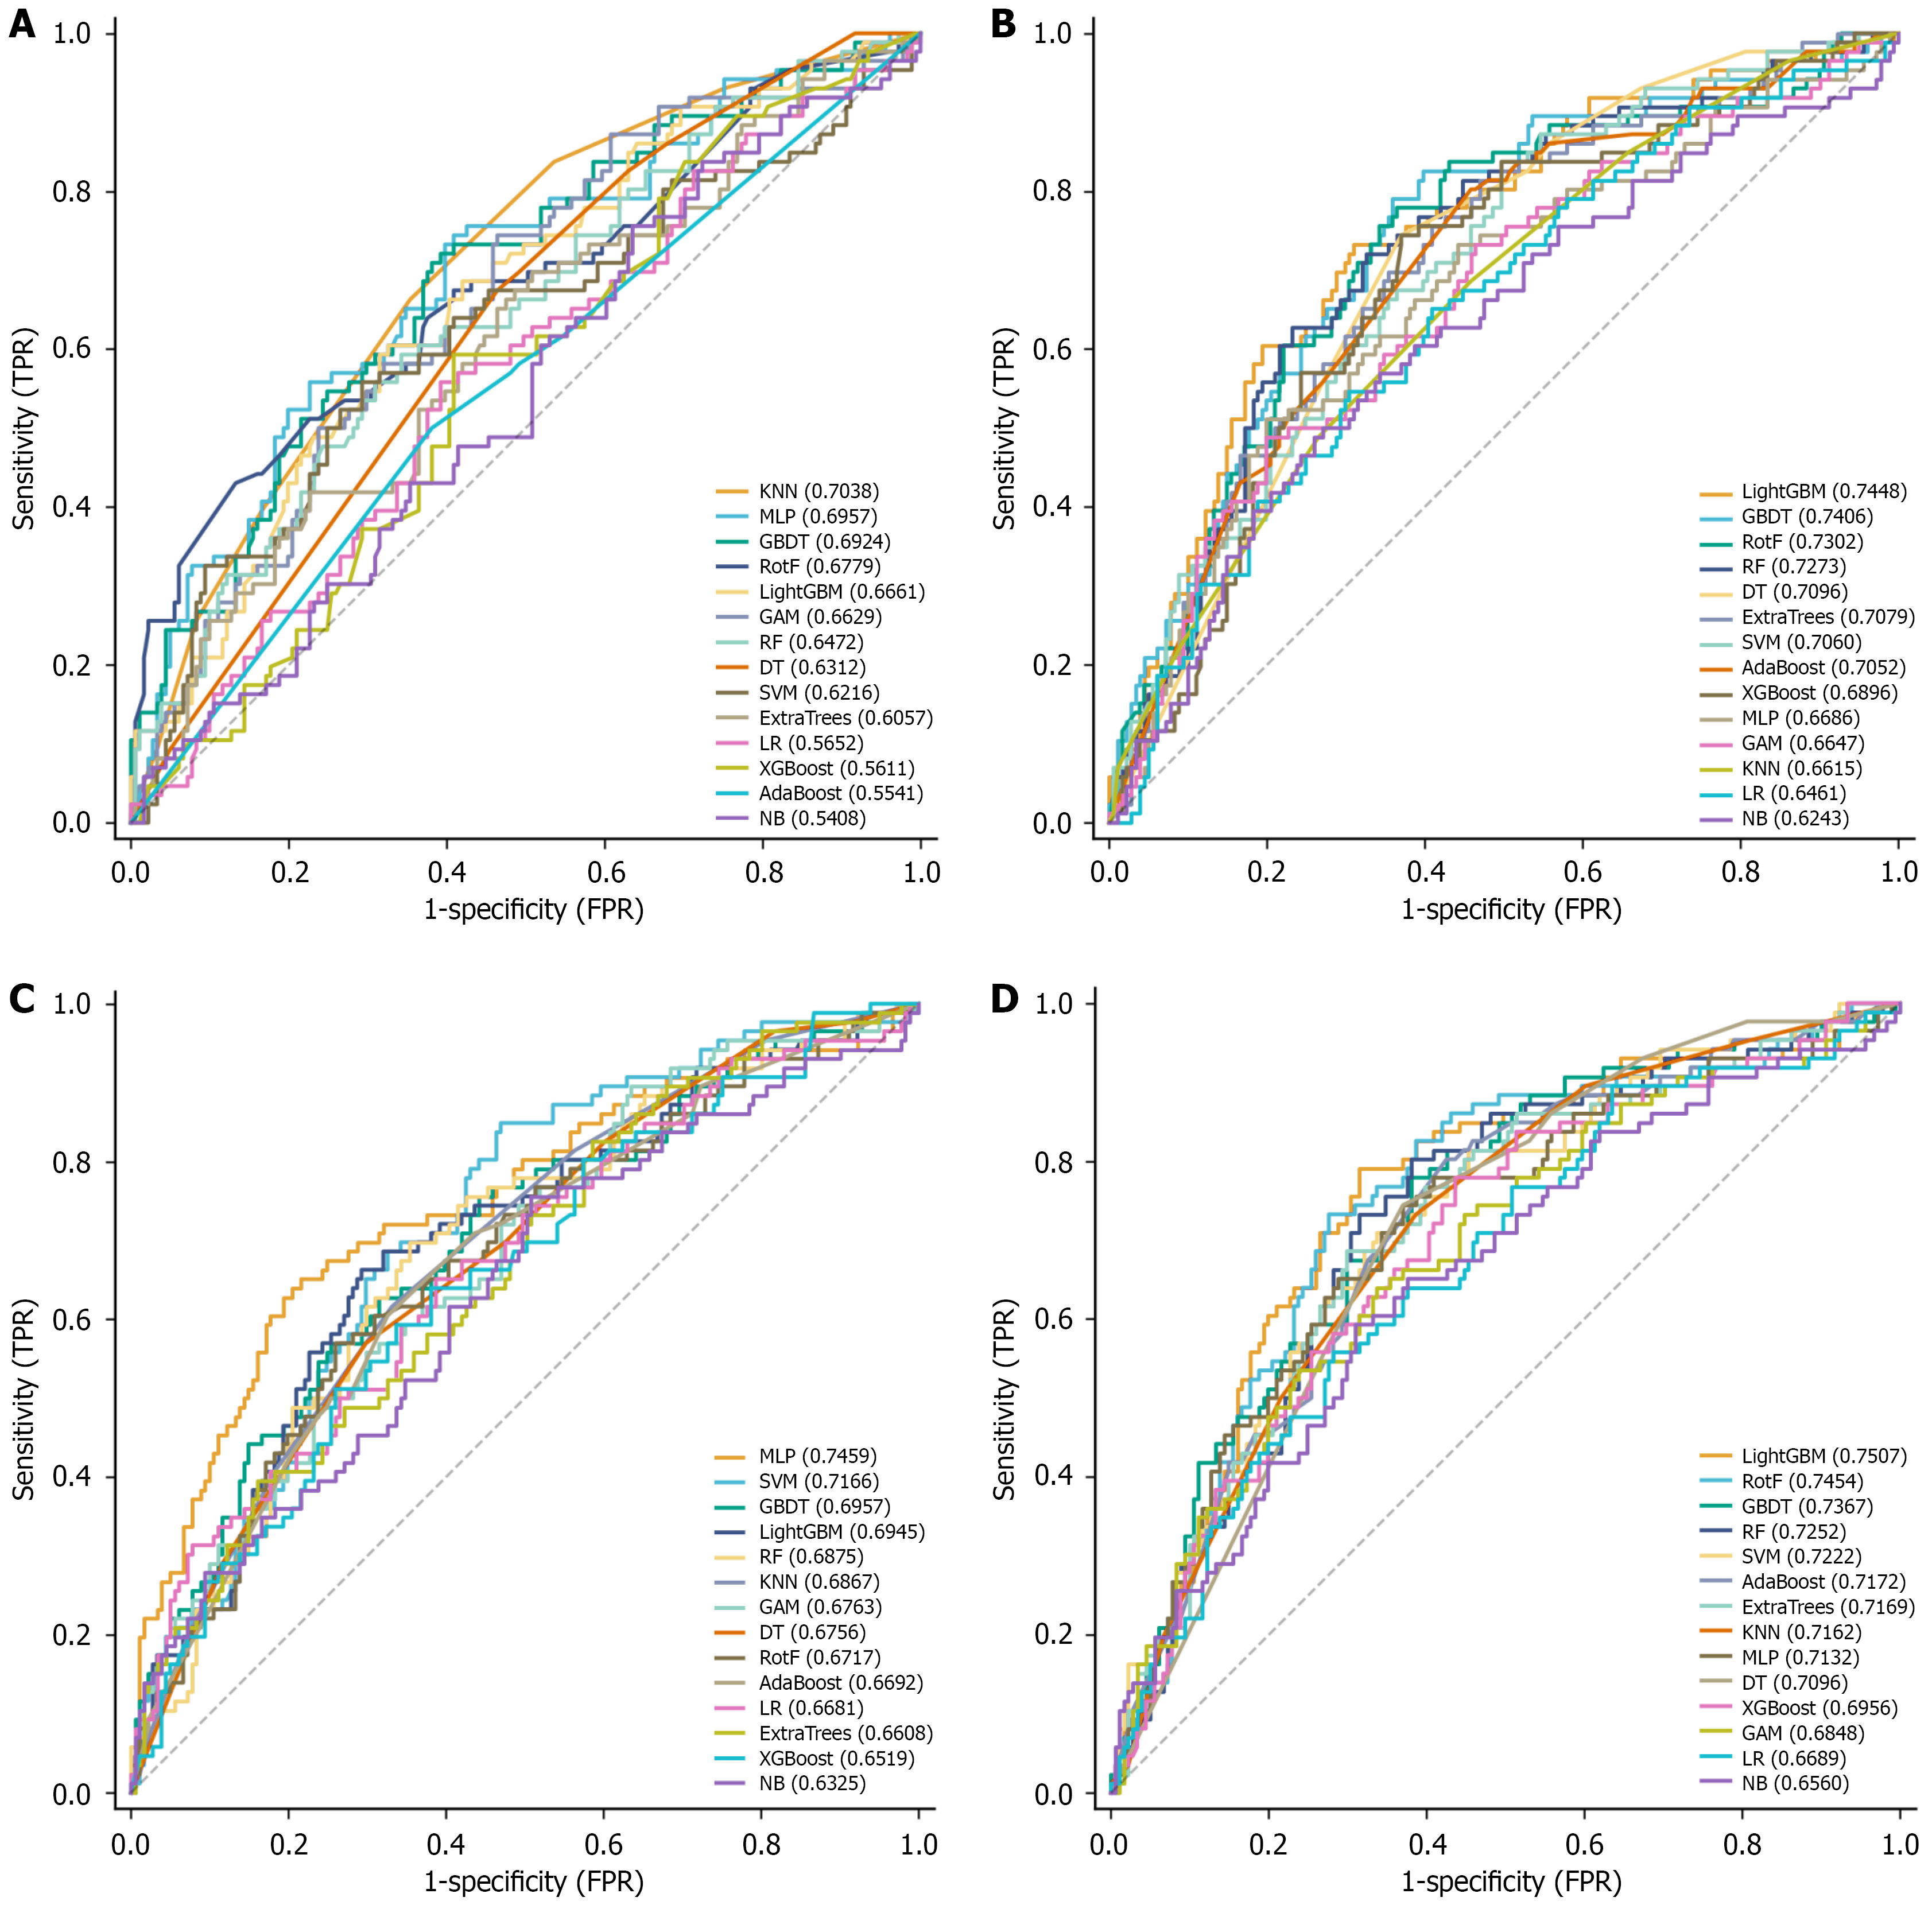
Figure 3 Receiver operating characteristic curves for the four-layer models.
A: Layer 1 receiver operating characteristic (ROC) curves (demographics); B: Layer 2 ROC curves (demographics + inflammation); C: Layer 3 ROC curves (demographics + lipid); D: Layer 4 ROC curves (all features). DT: Decision Tree; RotF: Rotation Forest; GAM: Generalized Additive Model; RF: Random Forest; LR: Logistic regression; NB: Naive Bayes; KNN: K-Nearest Neighbors; SVM: Support Vector Machine; MLP: Multi-Layer Perceptron; GBDT: Gradient Boosting Decision Tree; TPR: True positive rate; FPR: False positive rate.
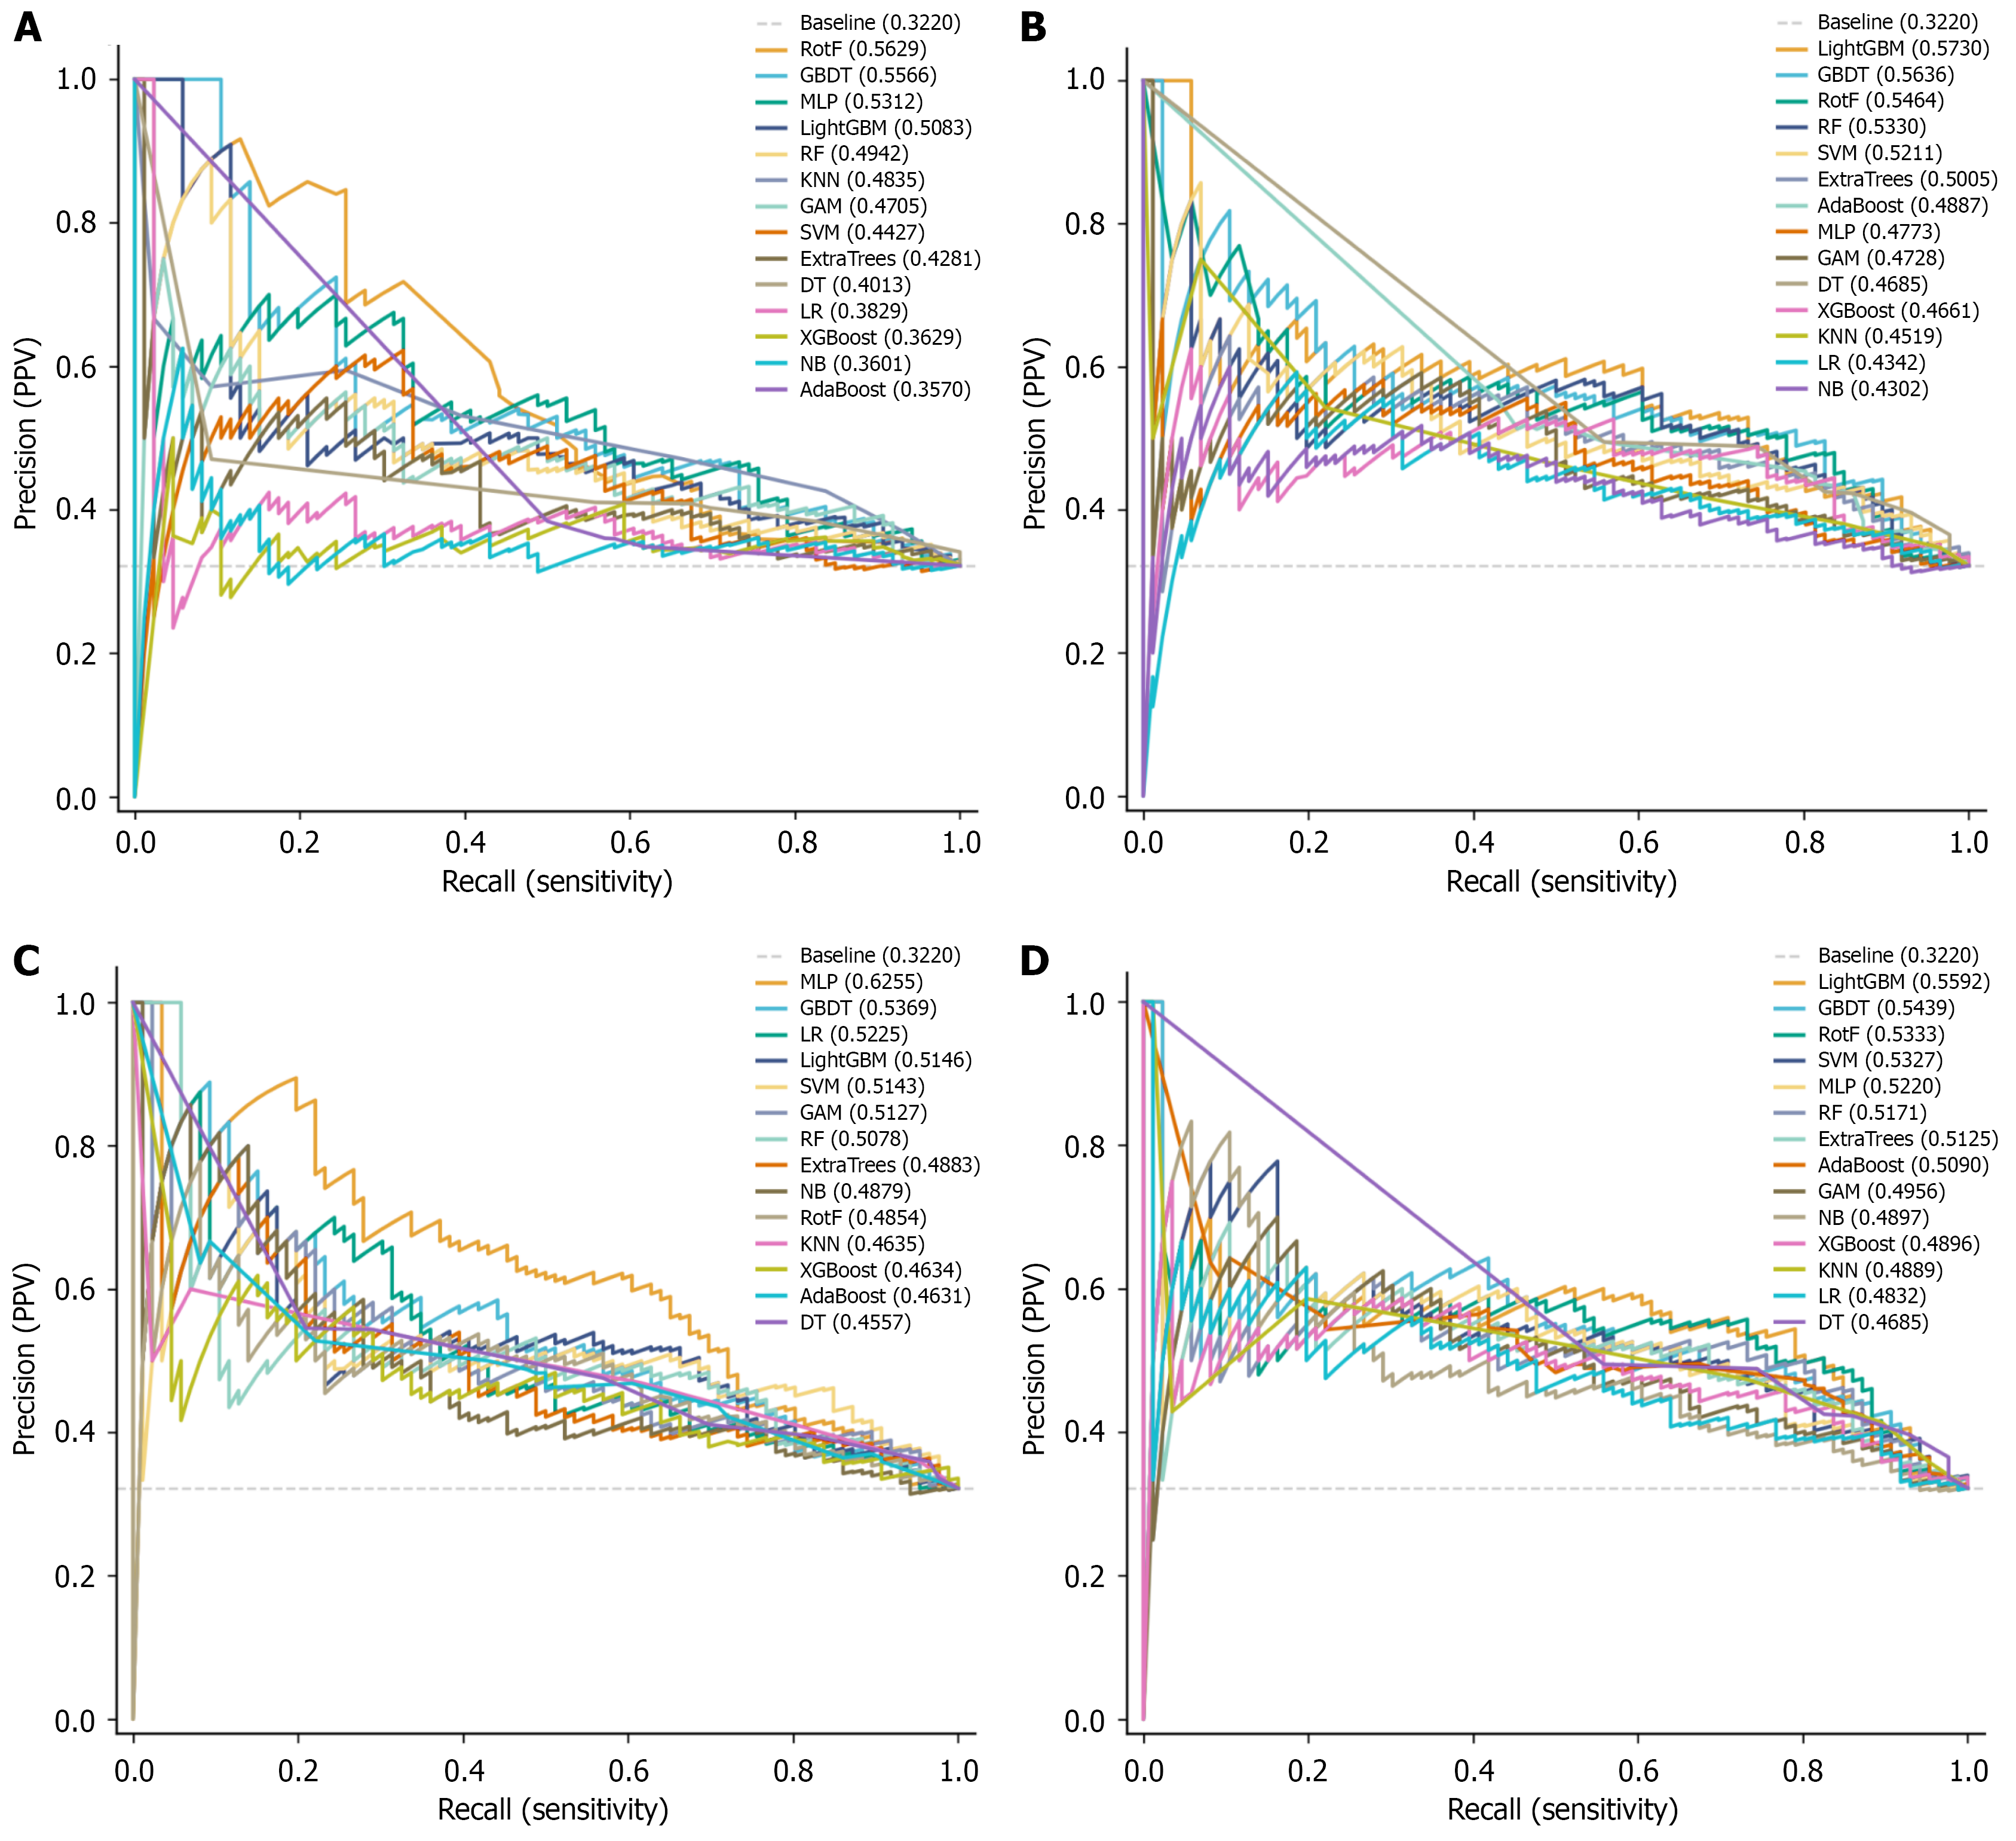
Figure 4 Precision-recall curves for the four-layer models.
A: Layer 1 precision-recall curves (demographics); B: Layer 2 precision-recall curves (demographics + inflammation); C: Layer 3 precision-recall curves (demographics + lipid); D: Layer 4 precision-recall curves (all features). PPV: Positive predictive value; RotF: Rotation Forest; GBDT: Gradient Boosting Decision Tree; MLP: Multi-Layer Perceptron; RF: Random Forest; KNN: K-Nearest Neighbors; GAM: Generalized Additive Model; SVM: Support Vector Machine; DT: Decision Tree; LR: Logistic regression; NB: Naive Bayes.
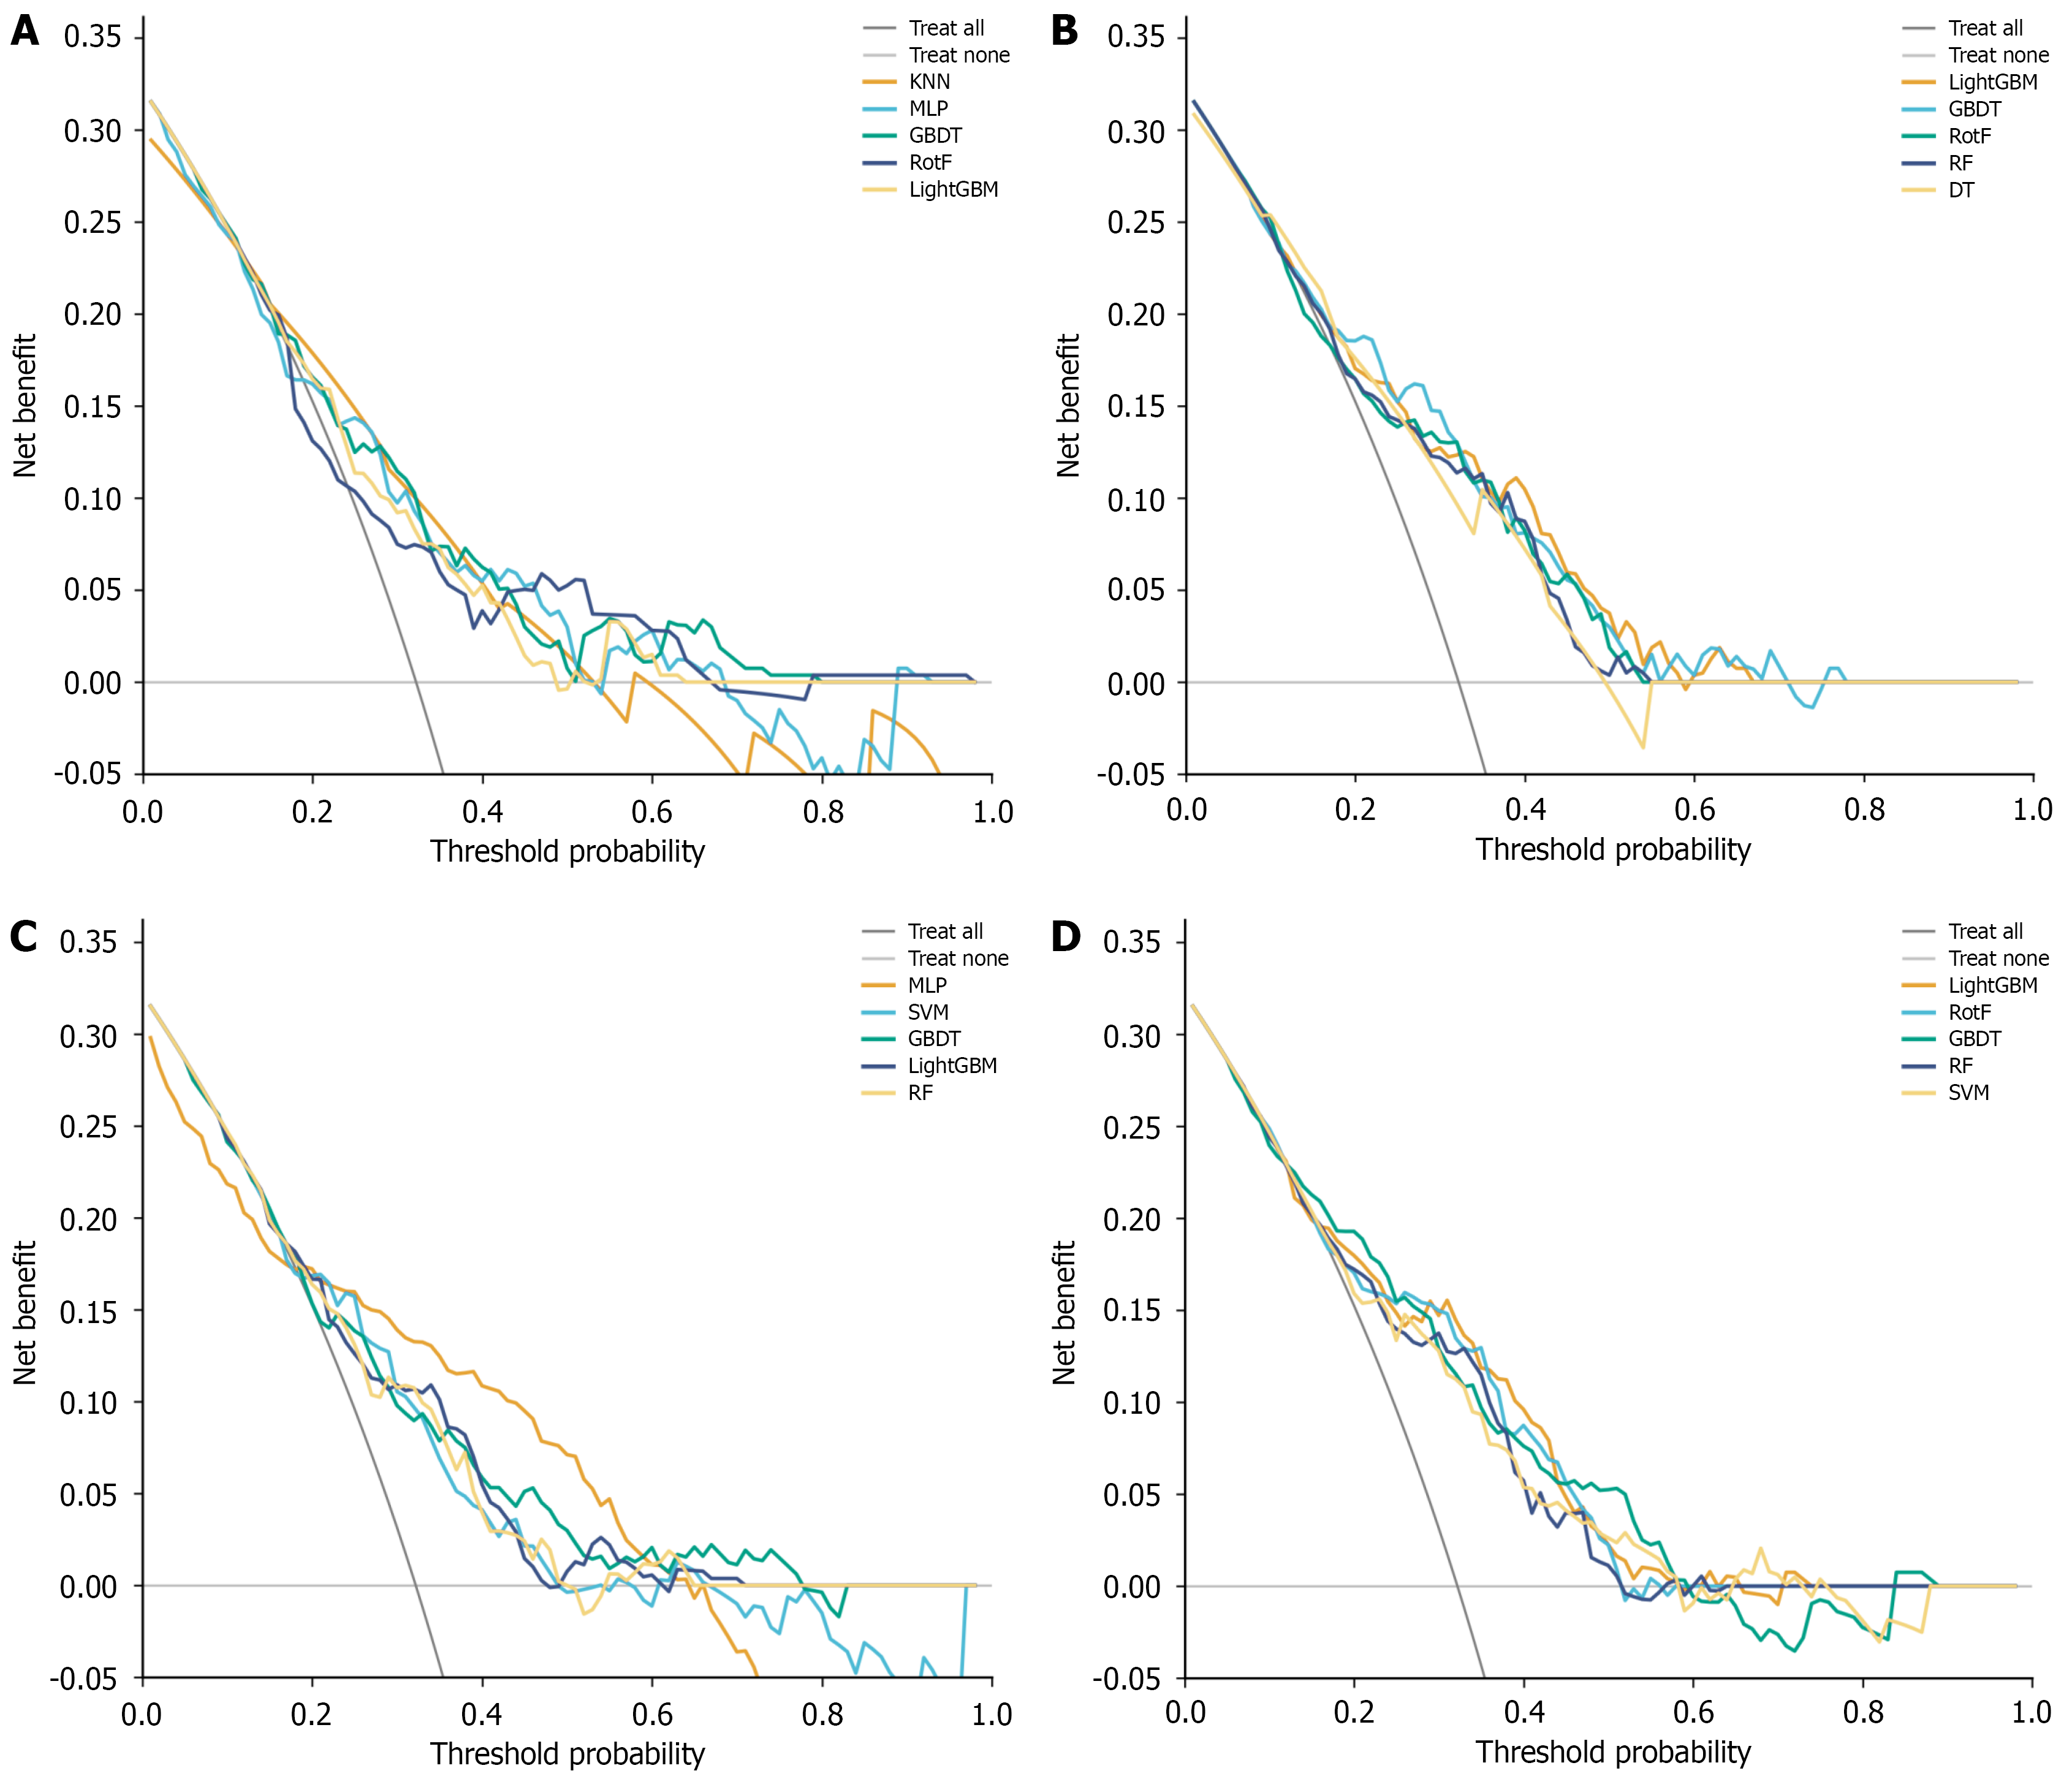
Figure 5 Decision curve analysis for the four-layer models.
A: Layer 1 decision curve analysis (demographics); B: Layer 2 decision curve analysis (demographics + inflammation); C: Layer 3 decision curve analysis (demographics + lipid); D: Layer 4 decision curve analysis (all features). KNN: K-Nearest Neighbors; MLP: Multi-Layer Perceptron; GBDT: Gradient Boosting Decision Tree; RotF: Rotation Forest; SVM: Support Vector Machine; RF: Random Forest.
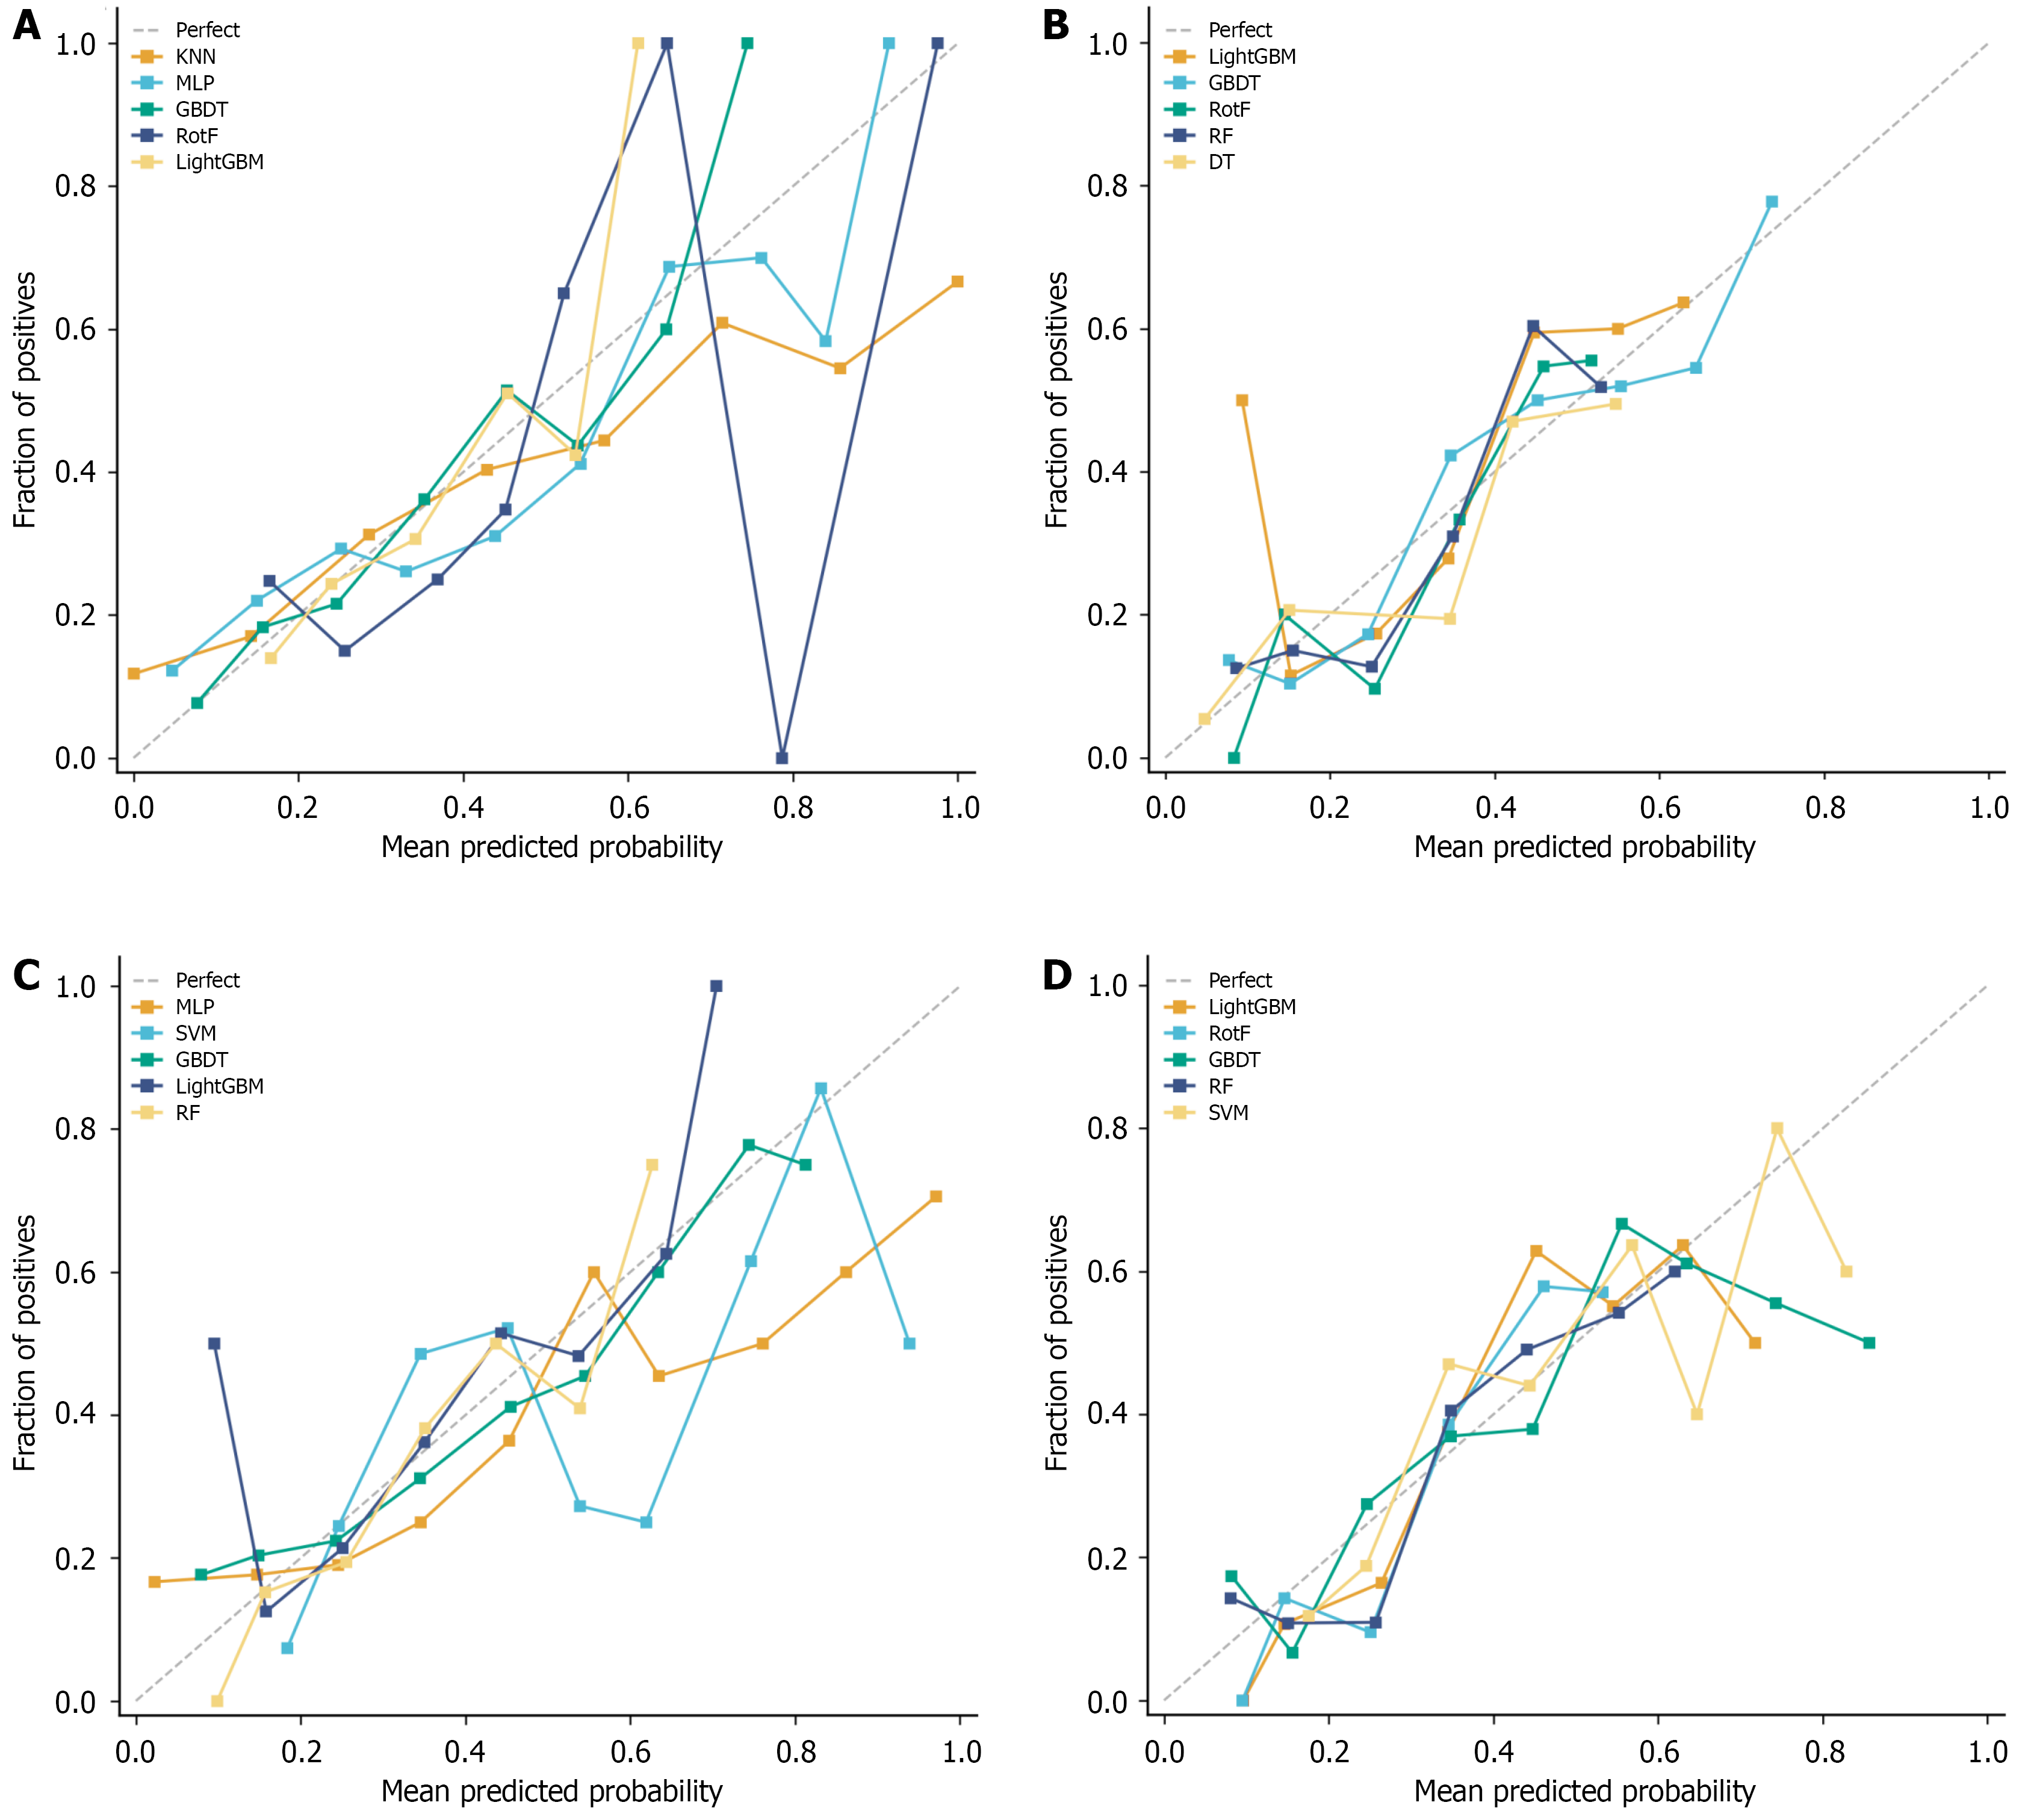
Figure 6 Calibration curves for the four-layer models.
A: Layer 1 calibration curves (demographics); B: Layer 2 calibration curves (demographics + inflammation); C: Layer 3 calibration curves (demographics + lipid); D: Layer 4 calibration curves (all features). KNN: K-Nearest Neighbors; MLP: Multi-Layer Perceptron; GBDT: Gradient Boosting Decision Tree; RotF: Rotation Forest; RF: Random Forest; DT: Decision Tree; SVM: Support Vector Machine.
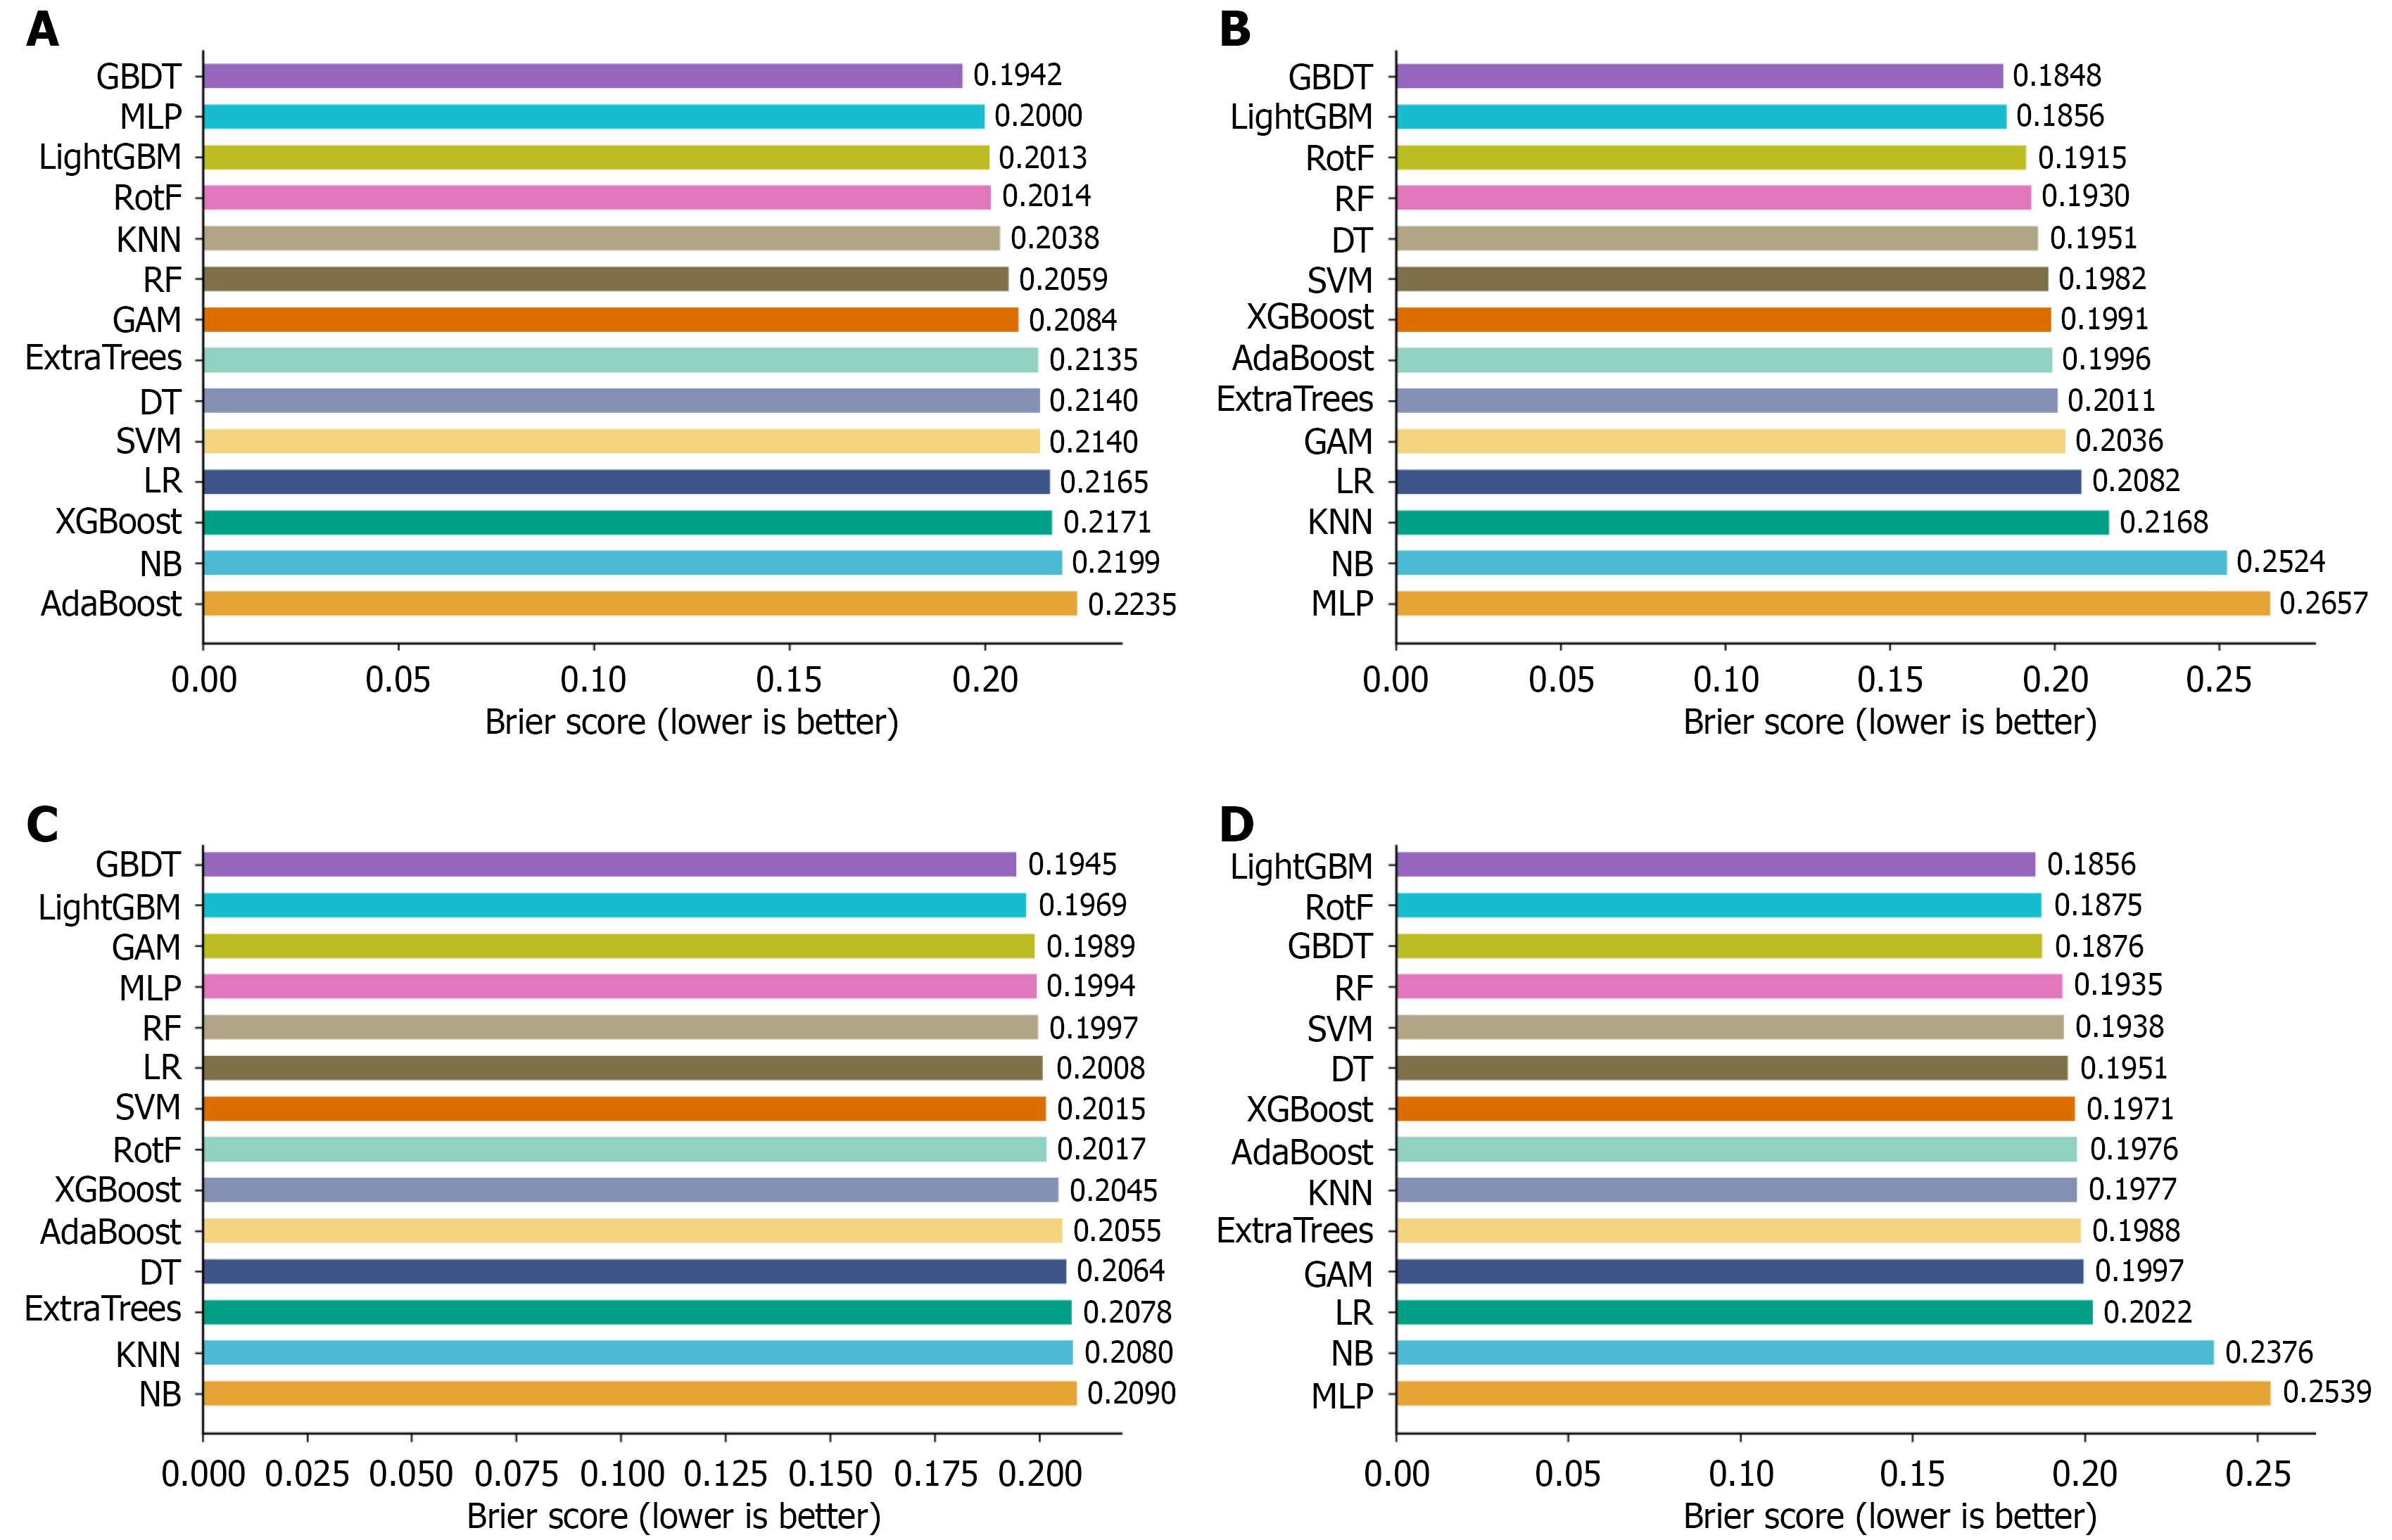
Figure 7 Brier scores for the four-layer models.
A: Layer 1 Brier scores (demographics); B: Layer 2 Brier scores (demographics + inflammation); C: Layer 3 Brier scores (demographics + lipid); D: Layer 4 Brier scores (all features). KNN: K-Nearest Neighbors; MLP: Multi-Layer Perceptron; GBDT: Gradient Boosting Decision Tree; RotF: Rotation Forest; RF: Random Forest; DT: Decision Tree; SVM: Support Vector Machine; LR: Logistic regression; NB: Naive Bayes; GAM: Generalized Additive Model.
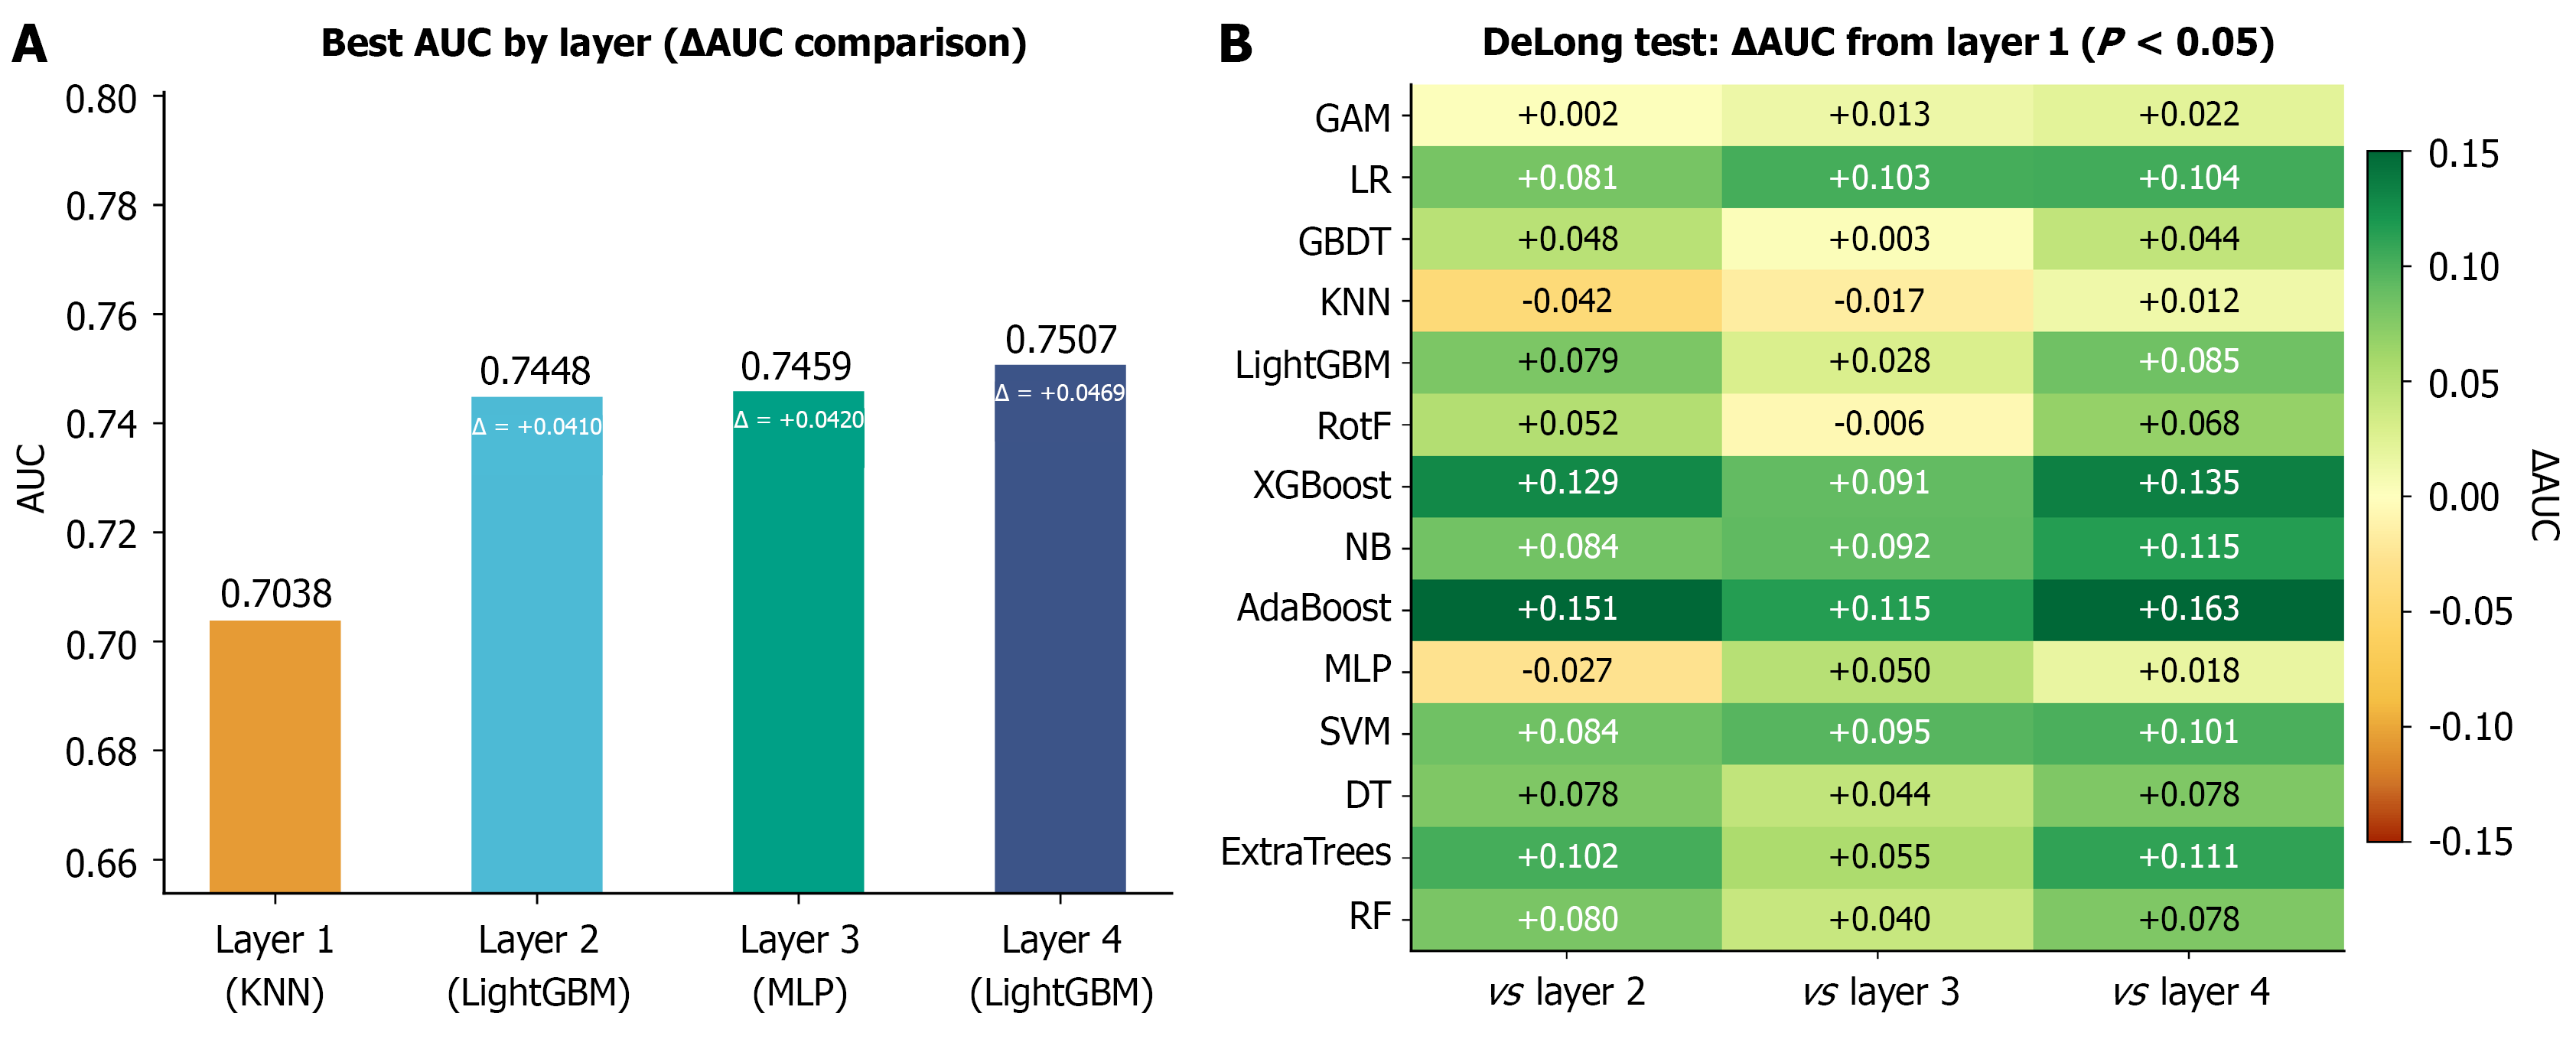
Figure 8 Cross-layer incremental analysis.
A: Area under the curve (AUC) comparison of best models across layers; B: P-value matrix of cross-layer AUC comparisons for each algorithm. AUC: Area under the curve; KNN: K-Nearest Neighbors; MLP: Multi-Layer Perceptron; LR: Logistic regression; GAM: Generalized Additive Model; GBDT: Gradient Boosting Decision Tree; RotF: Rotation Forest; RF: Random Forest; DT: Decision Tree; SVM: Support Vector Machine; NB: Naive Bayes.
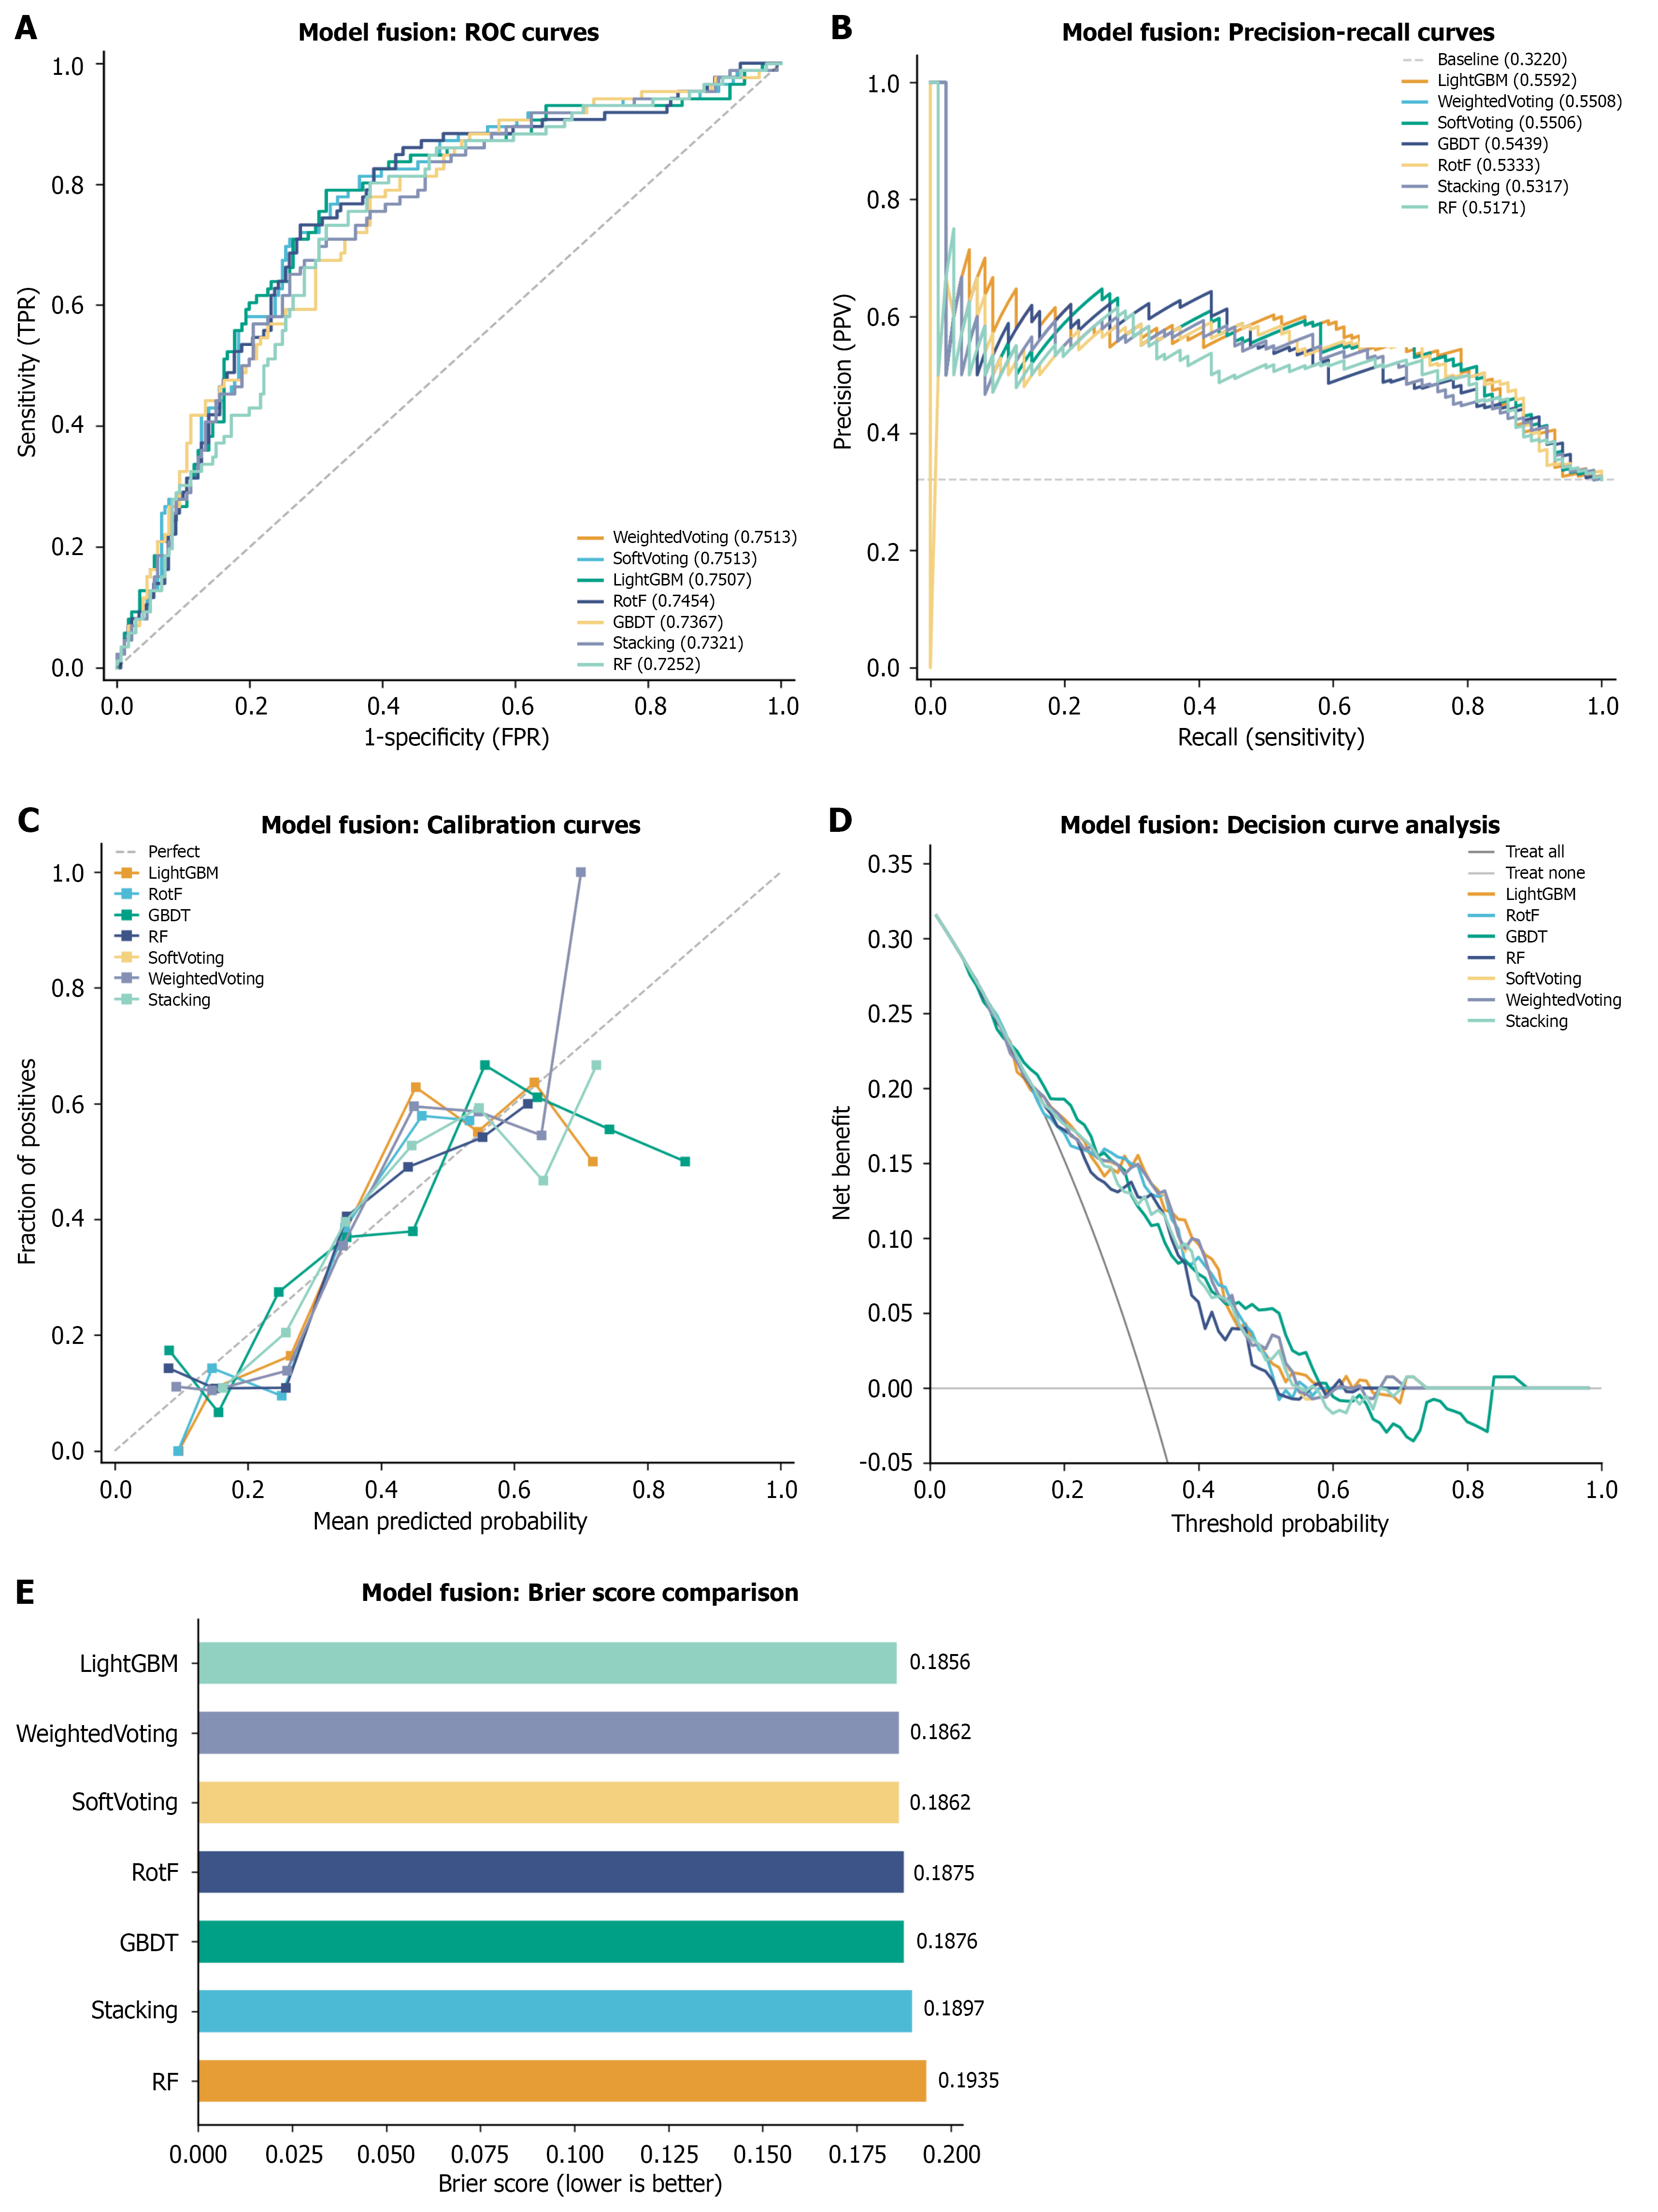
Figure 9 Internal performance of ensemble models.
A: Receiver operating characteristic curves; B: Precision-recall curves; C: Calibration curves; D: Decision curve analysis; E: Brier scores. PPV: Positive predictive value; ROC: Receiver operating characteristic; GBDT: Gradient Boosting Decision Tree; RotF: Rotation Forest; RF: Random Forest; TPR: True positive rate; FPR: False positive rate.
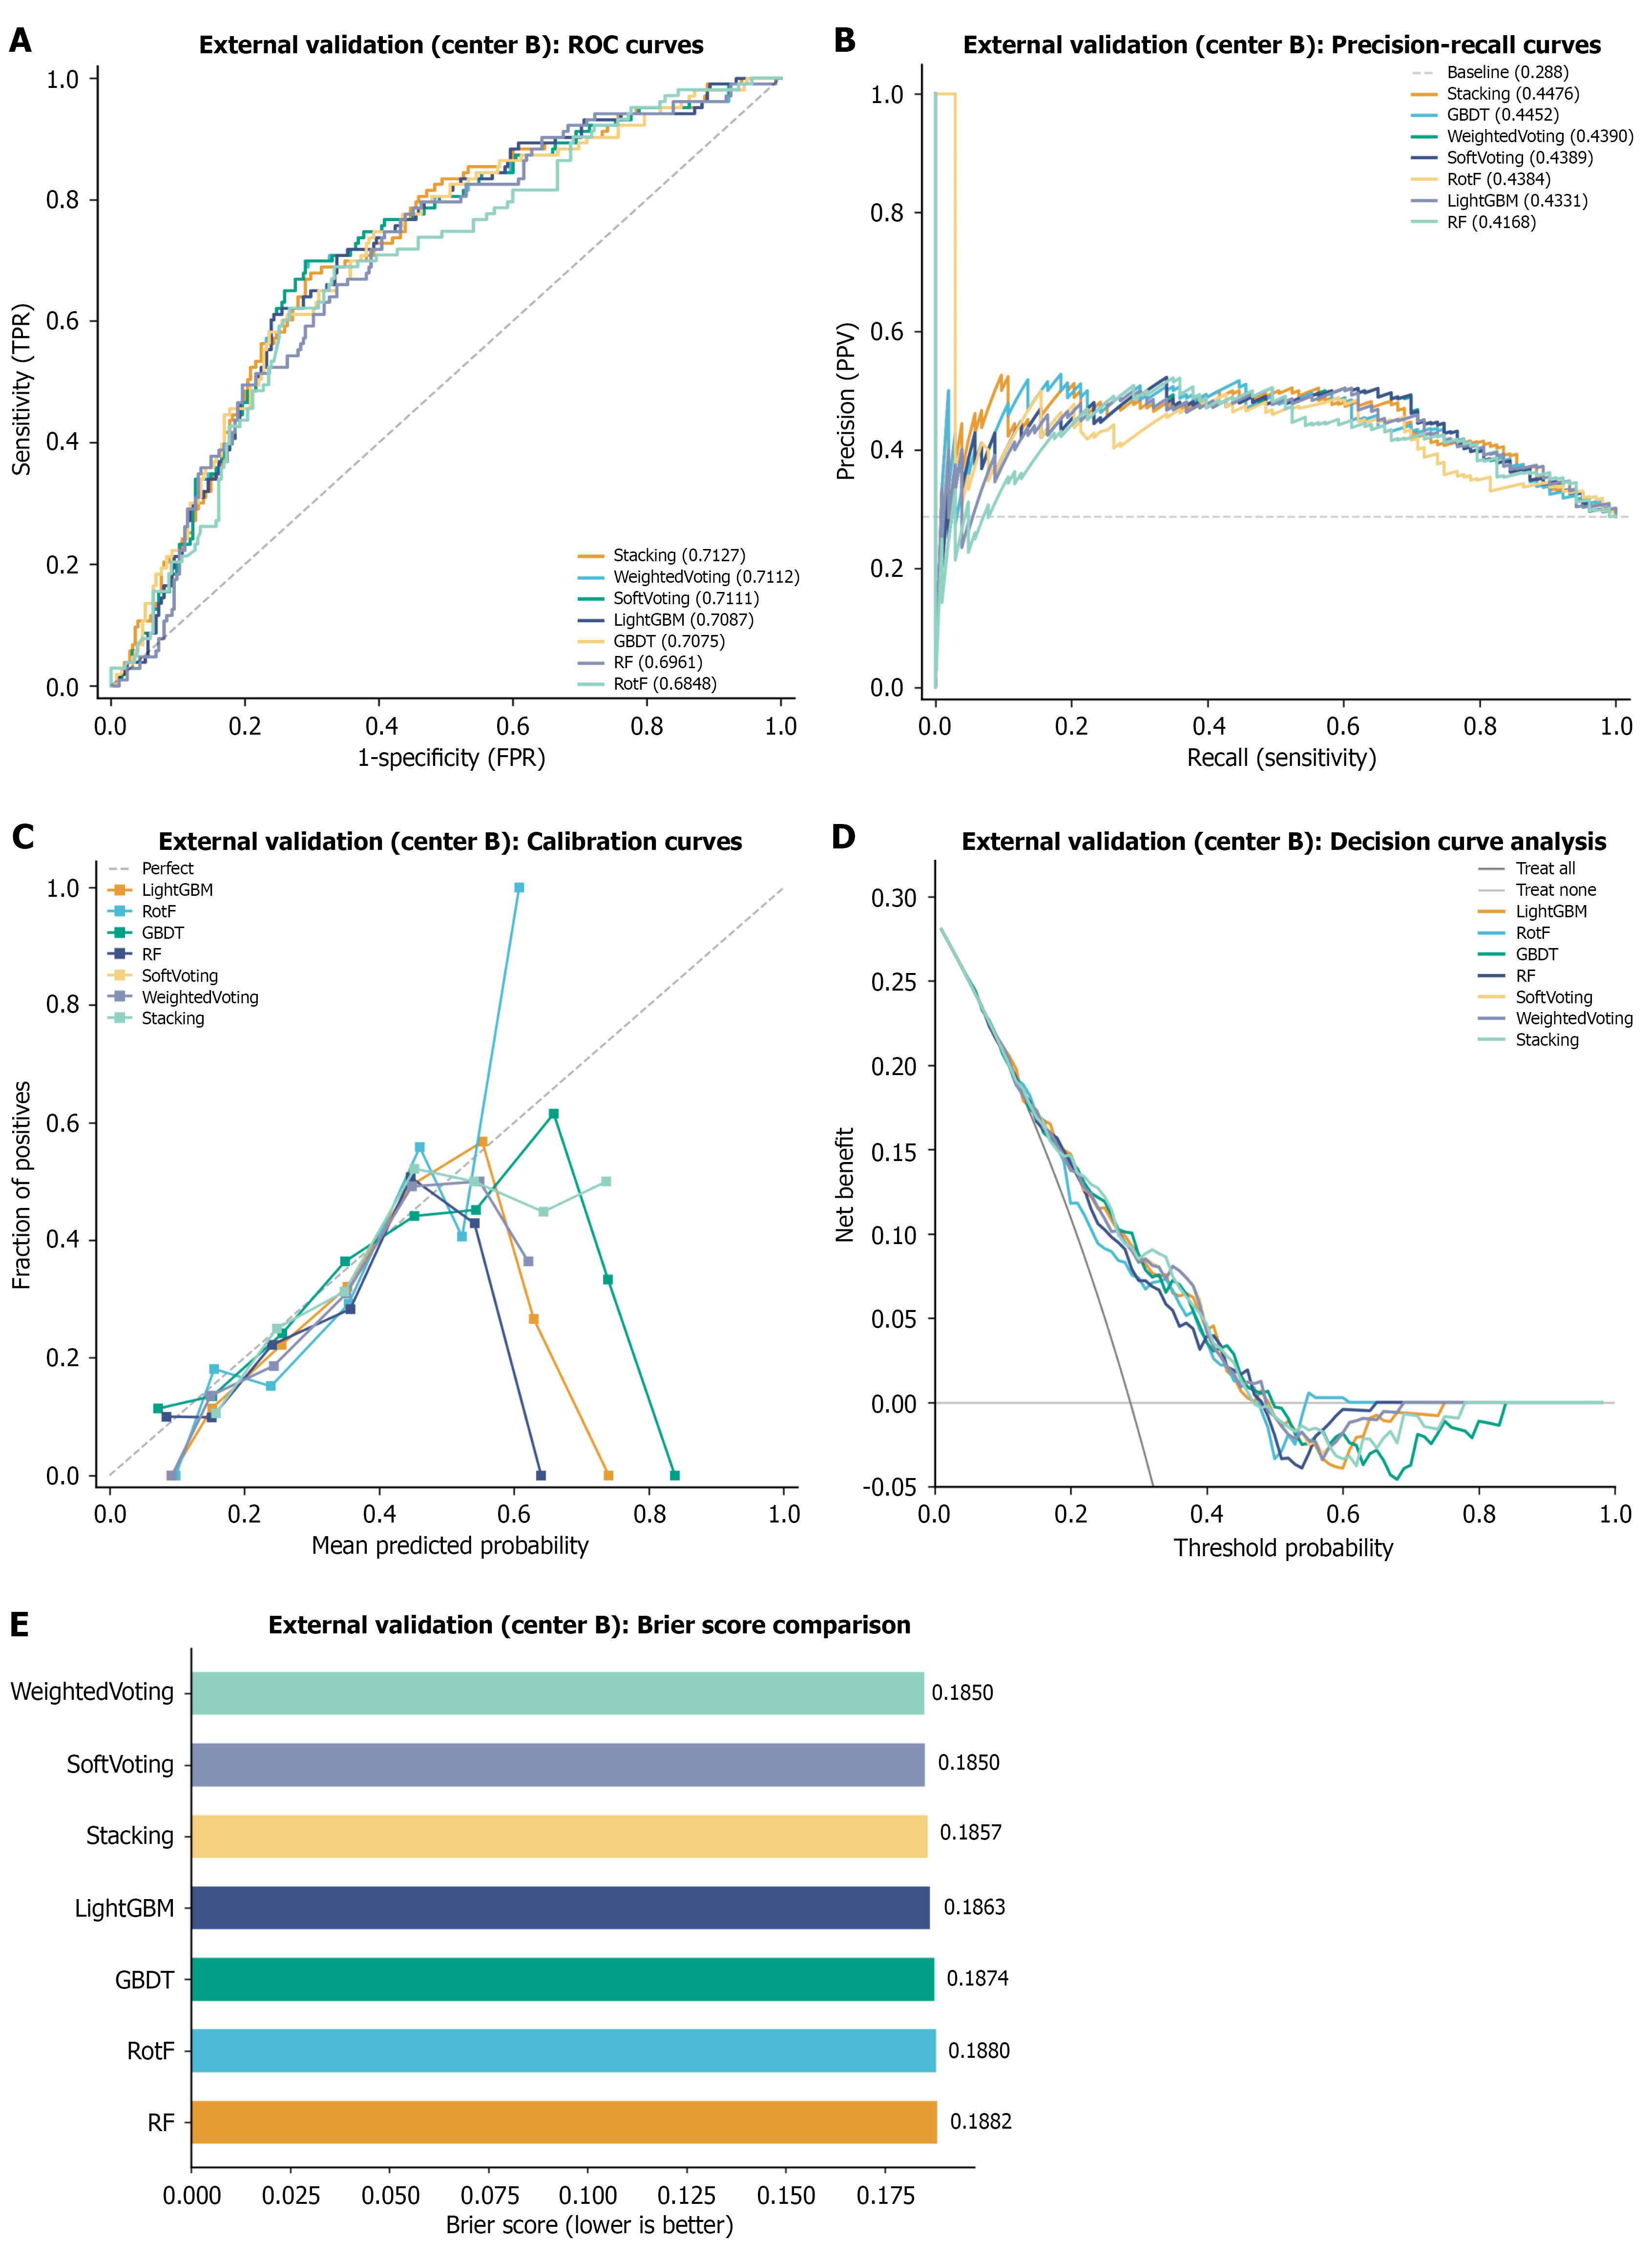
Figure 10 External validation performance.
A: Receiver operating characteristic curves; B: Precision-recall curves; C: Calibration curves; D: Decision curve analysis; E: Brier scores. PPV: Positive predictive value; ROC: Receiver operating characteristic; GBDT: Gradient Boosting Decision Tree; RotF: Rotation Forest; RF: Random Forest; TPR: True positive rate; FPR: False positive rate.
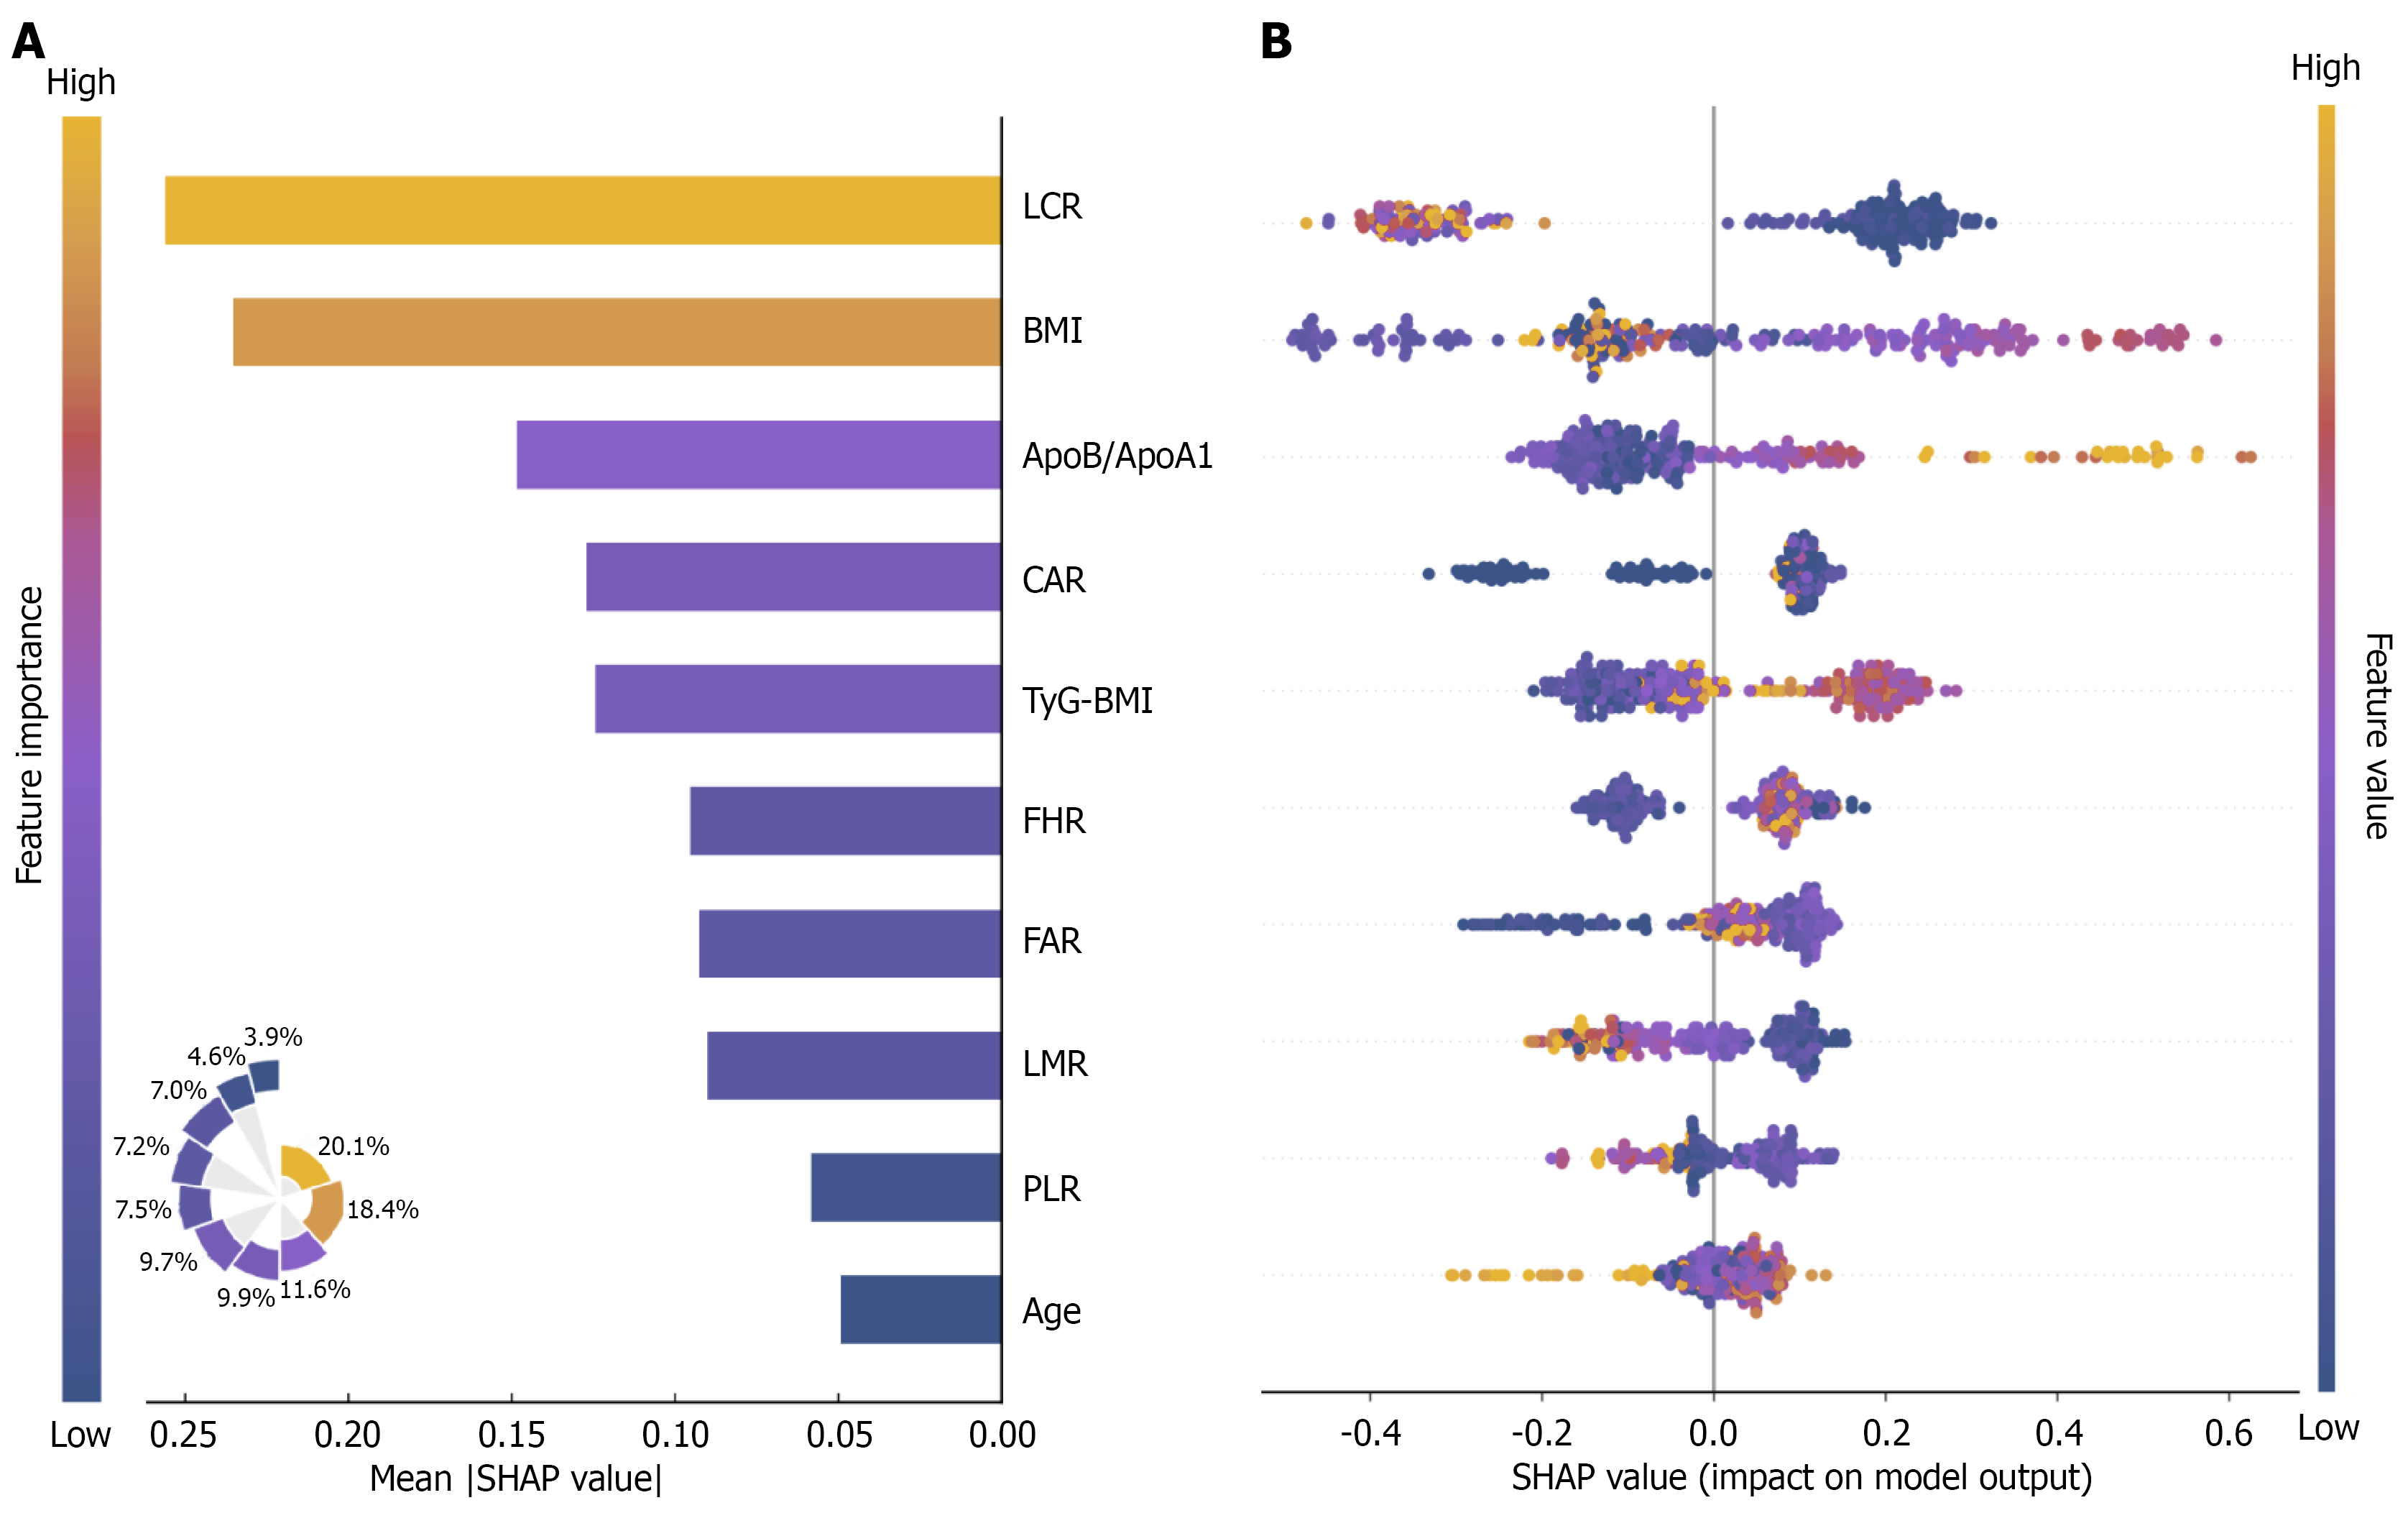
Figure 11 SHapley Additive exPlanations global analysis.
A: Feature importance bar chart and Nightingale rose chart. The bar chart ranks features in descending order by mean absolute SHapley Additive exPlanations value; bar length represents global importance. The Nightingale rose chart displays the relative contribution proportions of each feature; B: Beeswarm plot showing the directional impact and distribution of each feature on model predictions. LCR: Lymphocyte-to-C-reactive protein ratio; BMI: Body mass index; CAR: C-reactive protein-to-albumin ratio; FHR: Fibrinogen-to-high-density lipoprotein cholesterol ratio; ApoB/ApoA1: Apolipoprotein B-to-apolipoprotein A1 ratio; SHAP: SHapley Additive exPlanations; LMR: Lymphocyte-to-monocyte ratio; FAR: Fibrinogen-to-albumin ratio; PLR: Platelet-to-lymphocyte ratio; TyG-BMI: Triglyceride-glucose-body mass index.
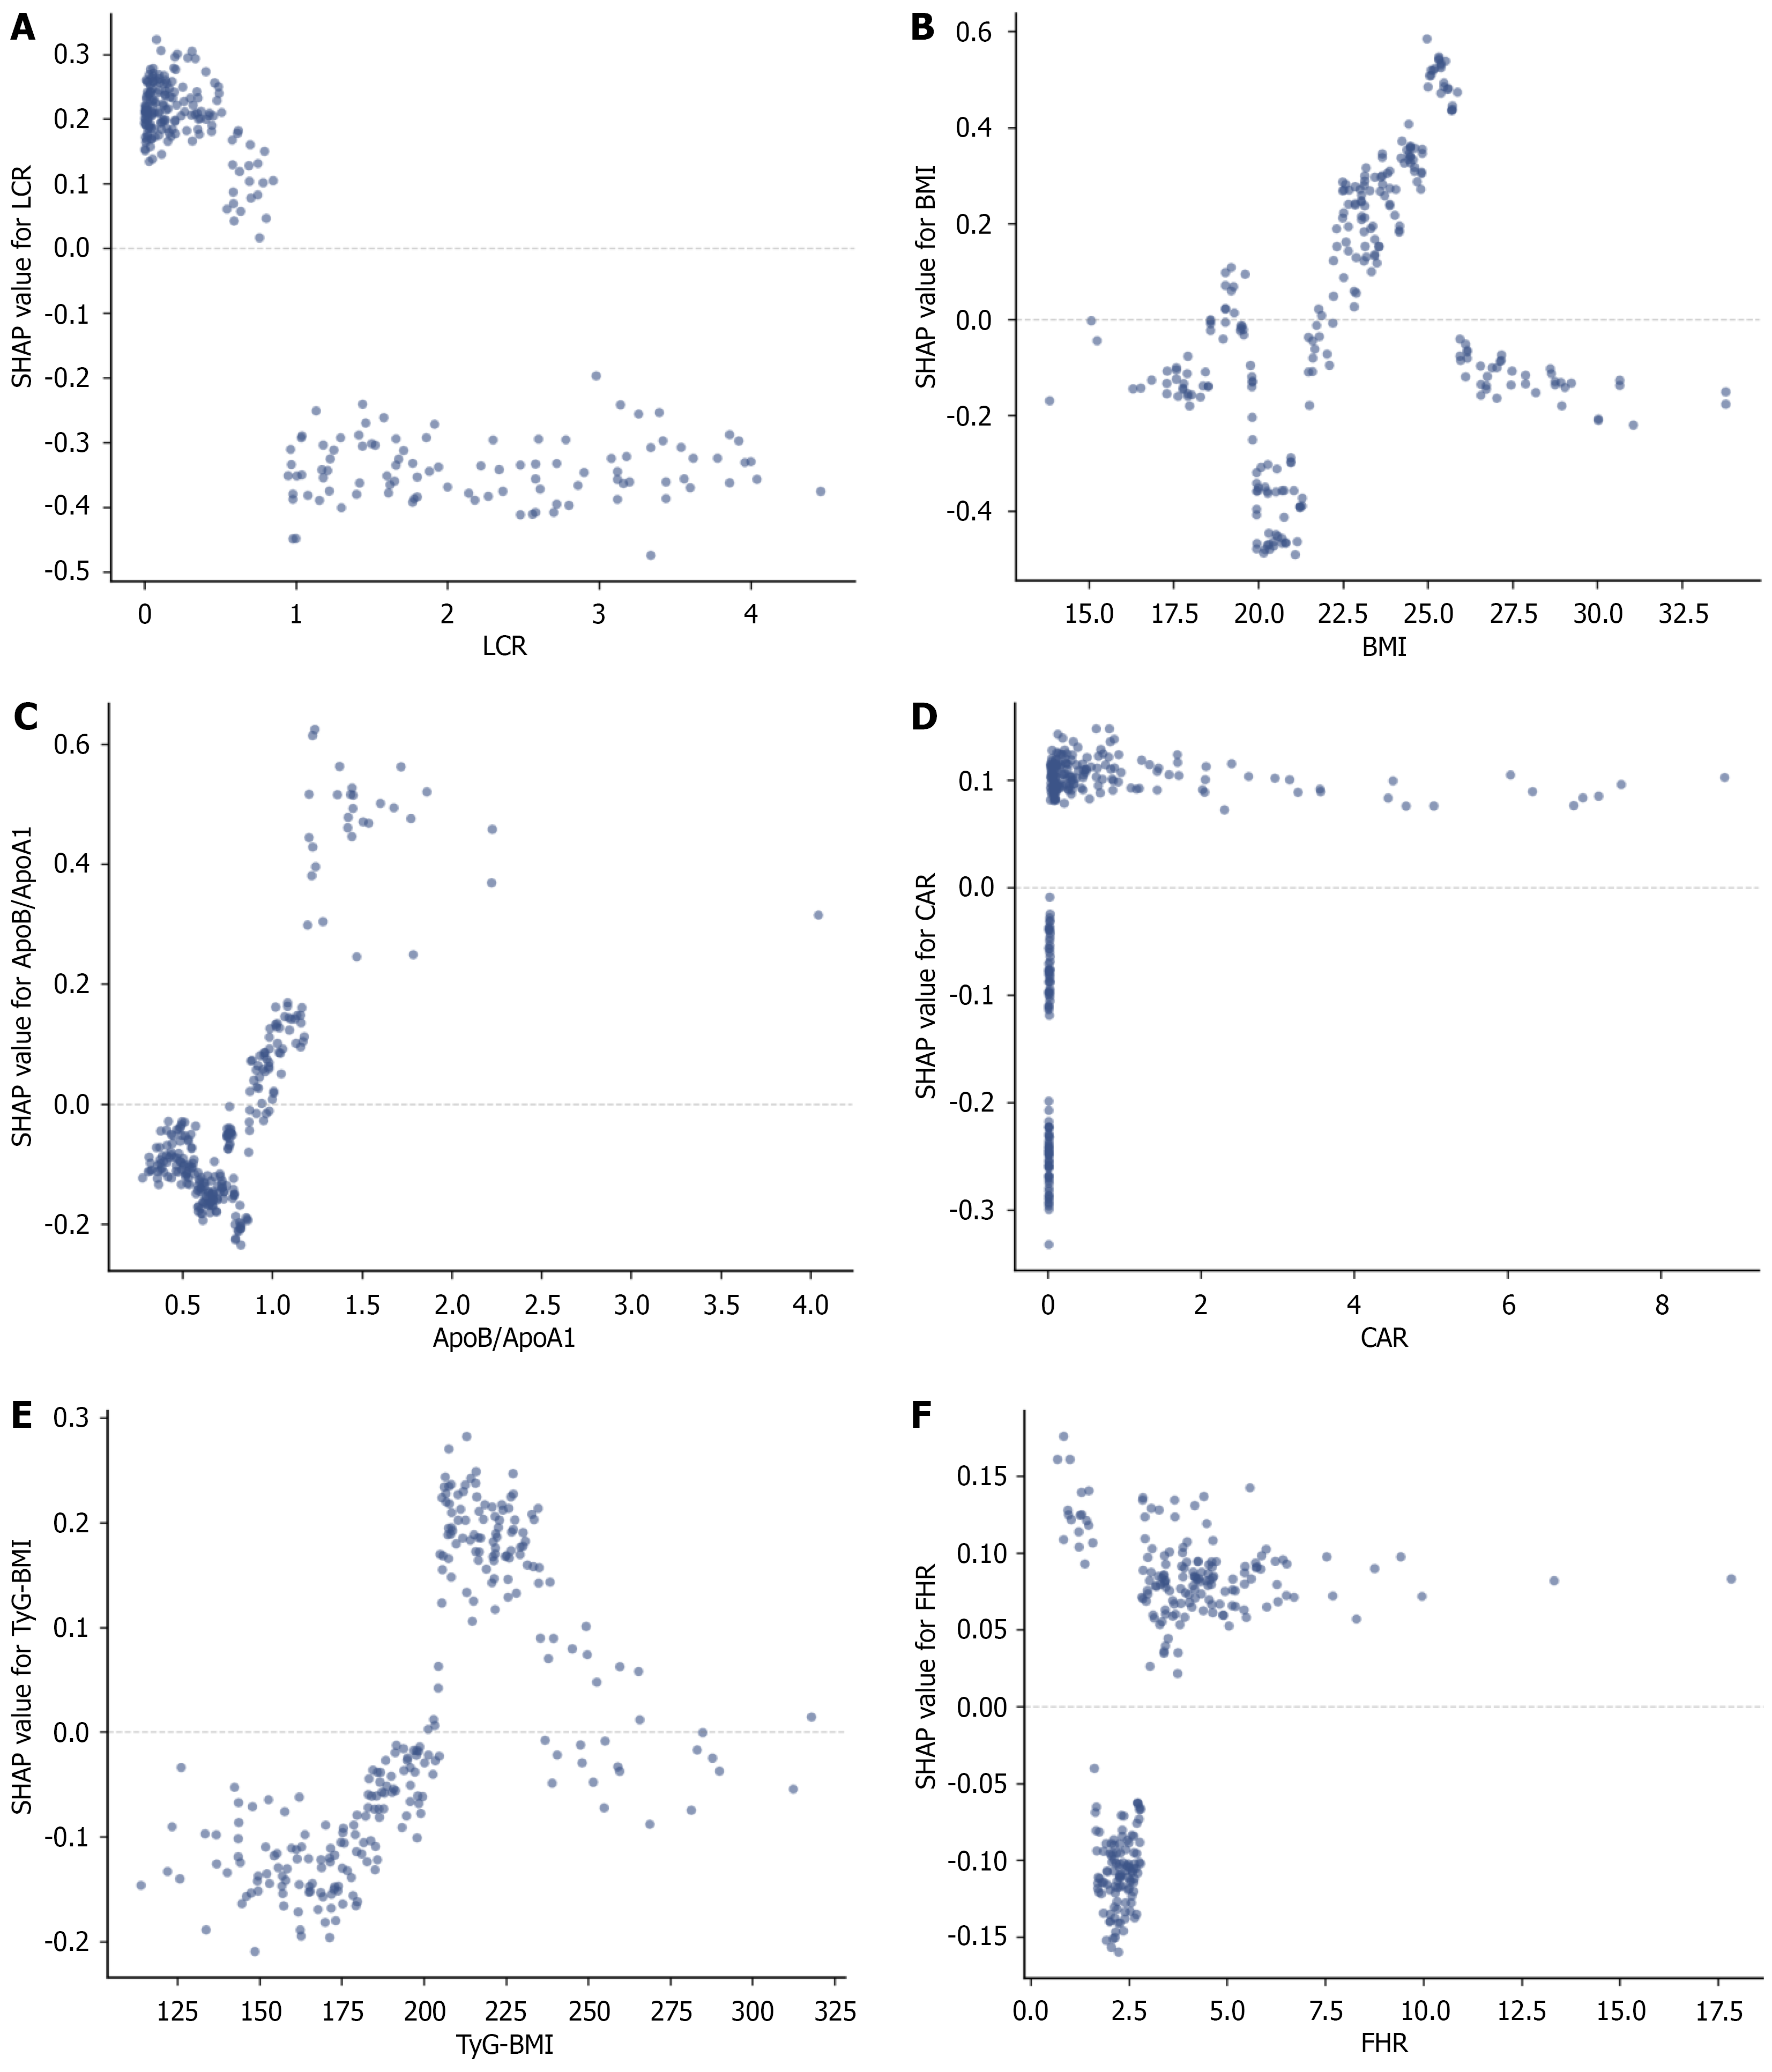
Figure 12 SHapley Additive exPlanations dependence plots.
A: Lymphocyte-to-C-reactive protein ratio; B: Body mass index; C: Apolipoprotein B-to-apolipoprotein A1 ratio; D: C-reactive protein-to-albumin ratio; E: Triglyceride-glucose-body mass index; F: Fibrinogen-to-high-density lipoprotein cholesterol ratio. LCR: Lymphocyte-to-C-reactive protein ratio; BMI: Body mass index; ApoB/ApoA1: Apolipoprotein B-to-apolipoprotein A1 ratio; SHAP: SHapley Additive exPlanations; CAR: C-reactive protein-to-albumin ratio; FHR: Fibrinogen-to-high-density lipoprotein cholesterol ratio; TyG-BMI: Triglyceride-glucose-body mass index.
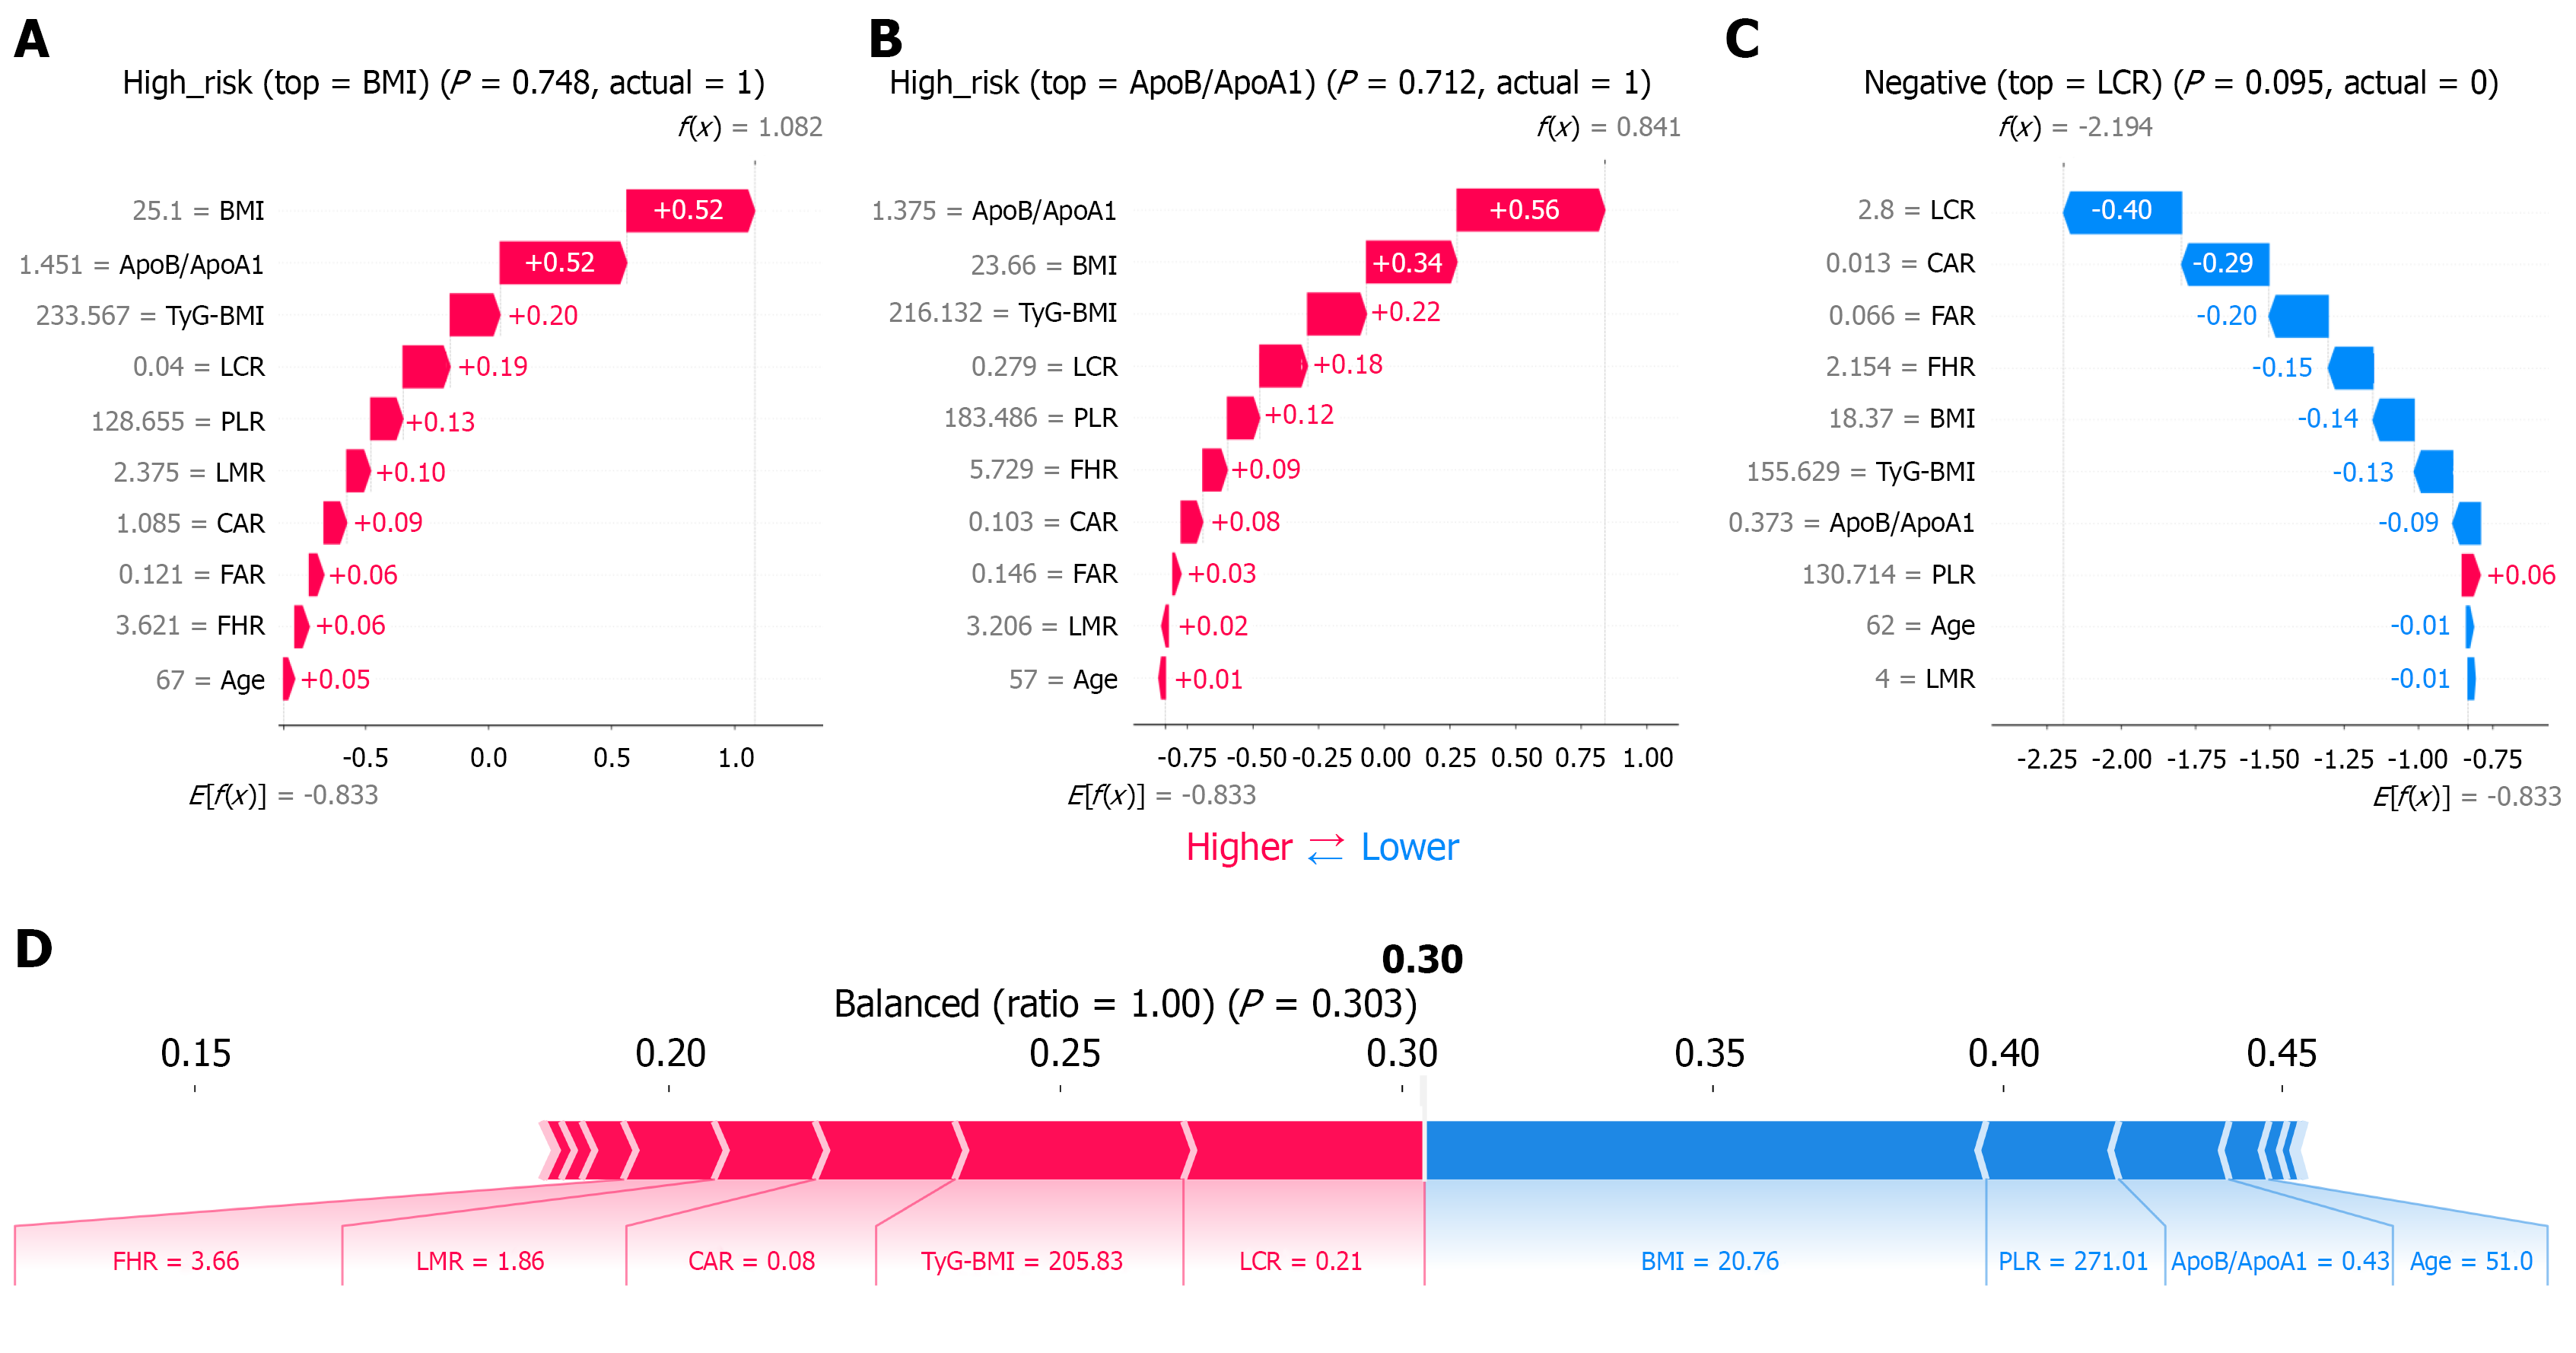
Figure 13 SHapley Additive exPlanations local model explanations.
A: Case 1; B: Case 2; C: Case 3; D: Case 4. BMI: Body mass index; ApoB/ApoA1: Apolipoprotein B-to-apolipoprotein A1 ratio; LCR: Lymphocyte-to-C-reactive protein ratio; CAR: C-reactive protein-to-albumin ratio; FHR: Fibrinogen-to-high-density lipoprotein cholesterol ratio; TyG-BMI: Triglyceride-glucose-body mass index; LMR: Lymphocyte-to-monocyte ratio; FAR: Fibrinogen-to-albumin ratio; PLR: Platelet-to-lymphocyte ratio.
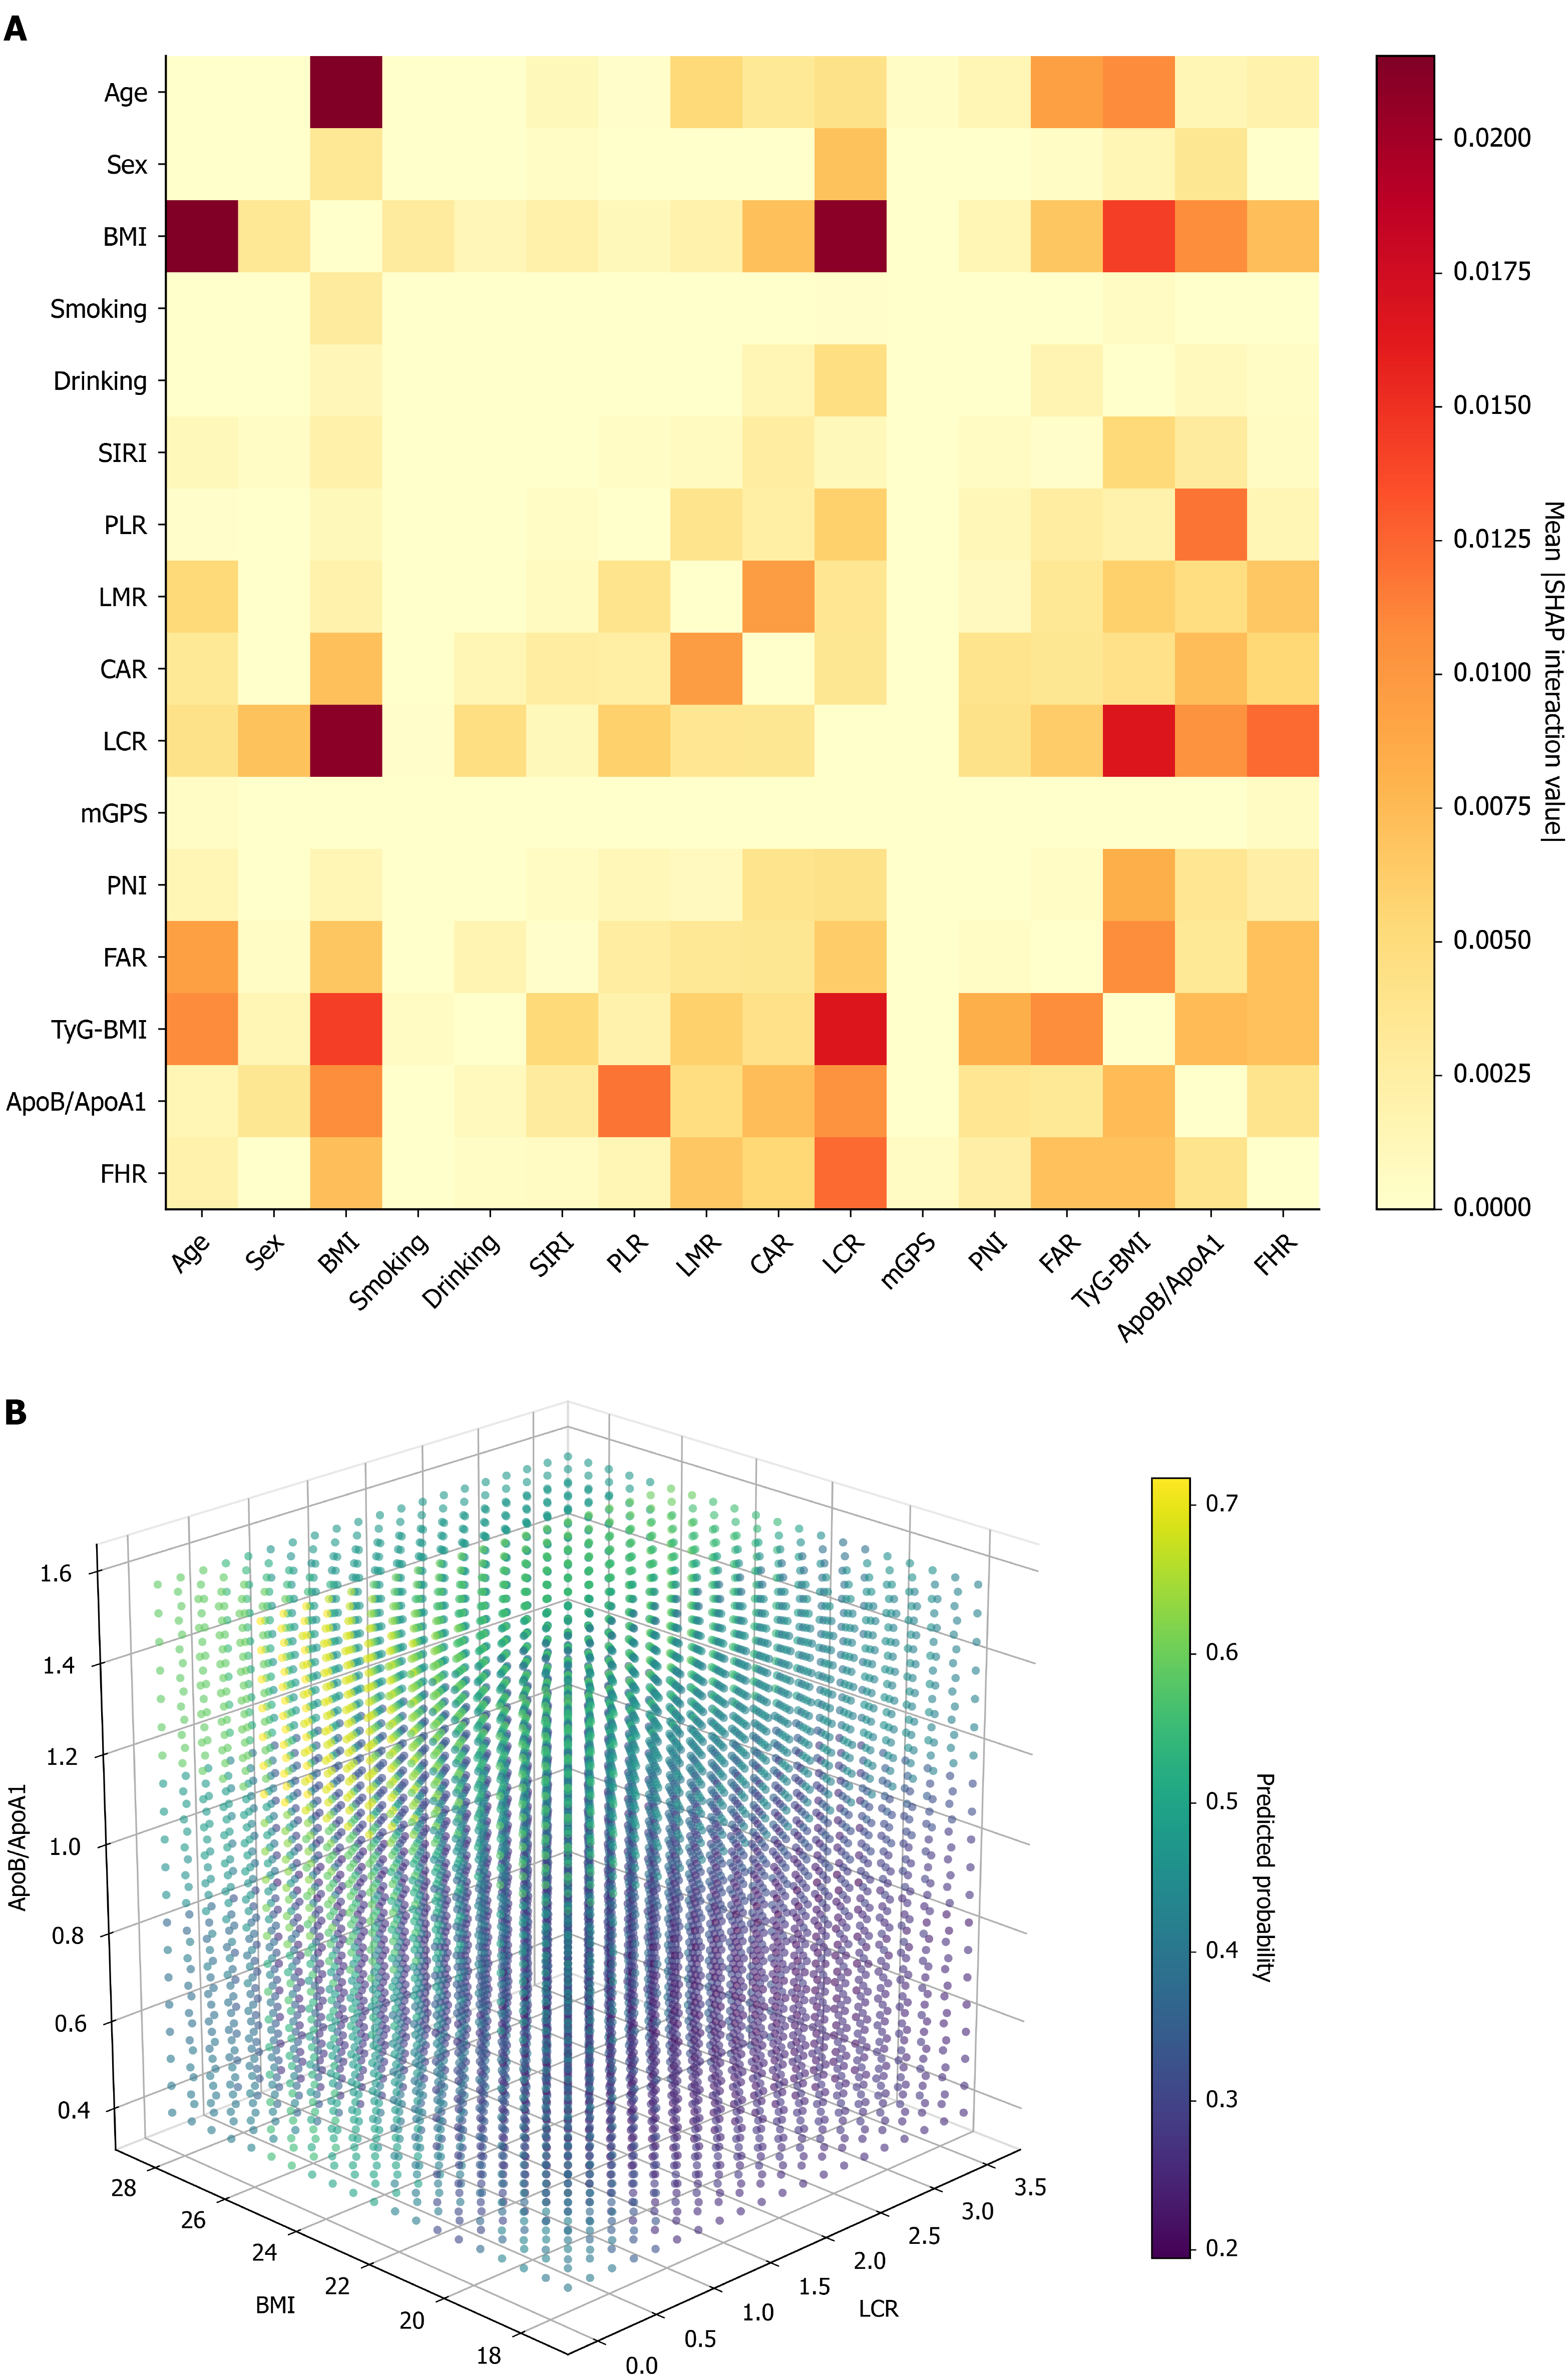
Figure 14 Feature interaction effects.
A: SHapley Additive exPlanations feature interaction value heatmap (Weighted Voting); B: Three-dimensional partial dependence plots. BMI: Body mass index; SIRI: Systemic inflammation response index; PLR: Platelet-to-lymphocyte ratio; LCR: Lymphocyte-to-C-reactive protein ratio; CAR: C-reactive protein-to-albumin ratio; LMR: Lymphocyte-to-monocyte ratio; FAR: Fibrinogen-to-albumin ratio; mGPS: Modified Glasgow Prognostic Score; PNI: Prognostic nutritional index; ApoB/ApoA1: Apolipoprotein B-to-apolipoprotein A1 ratio; FHR: Fibrinogen-to-high-density lipoprotein cholesterol ratio; TyG-BMI: Triglyceride-glucose-body mass index.
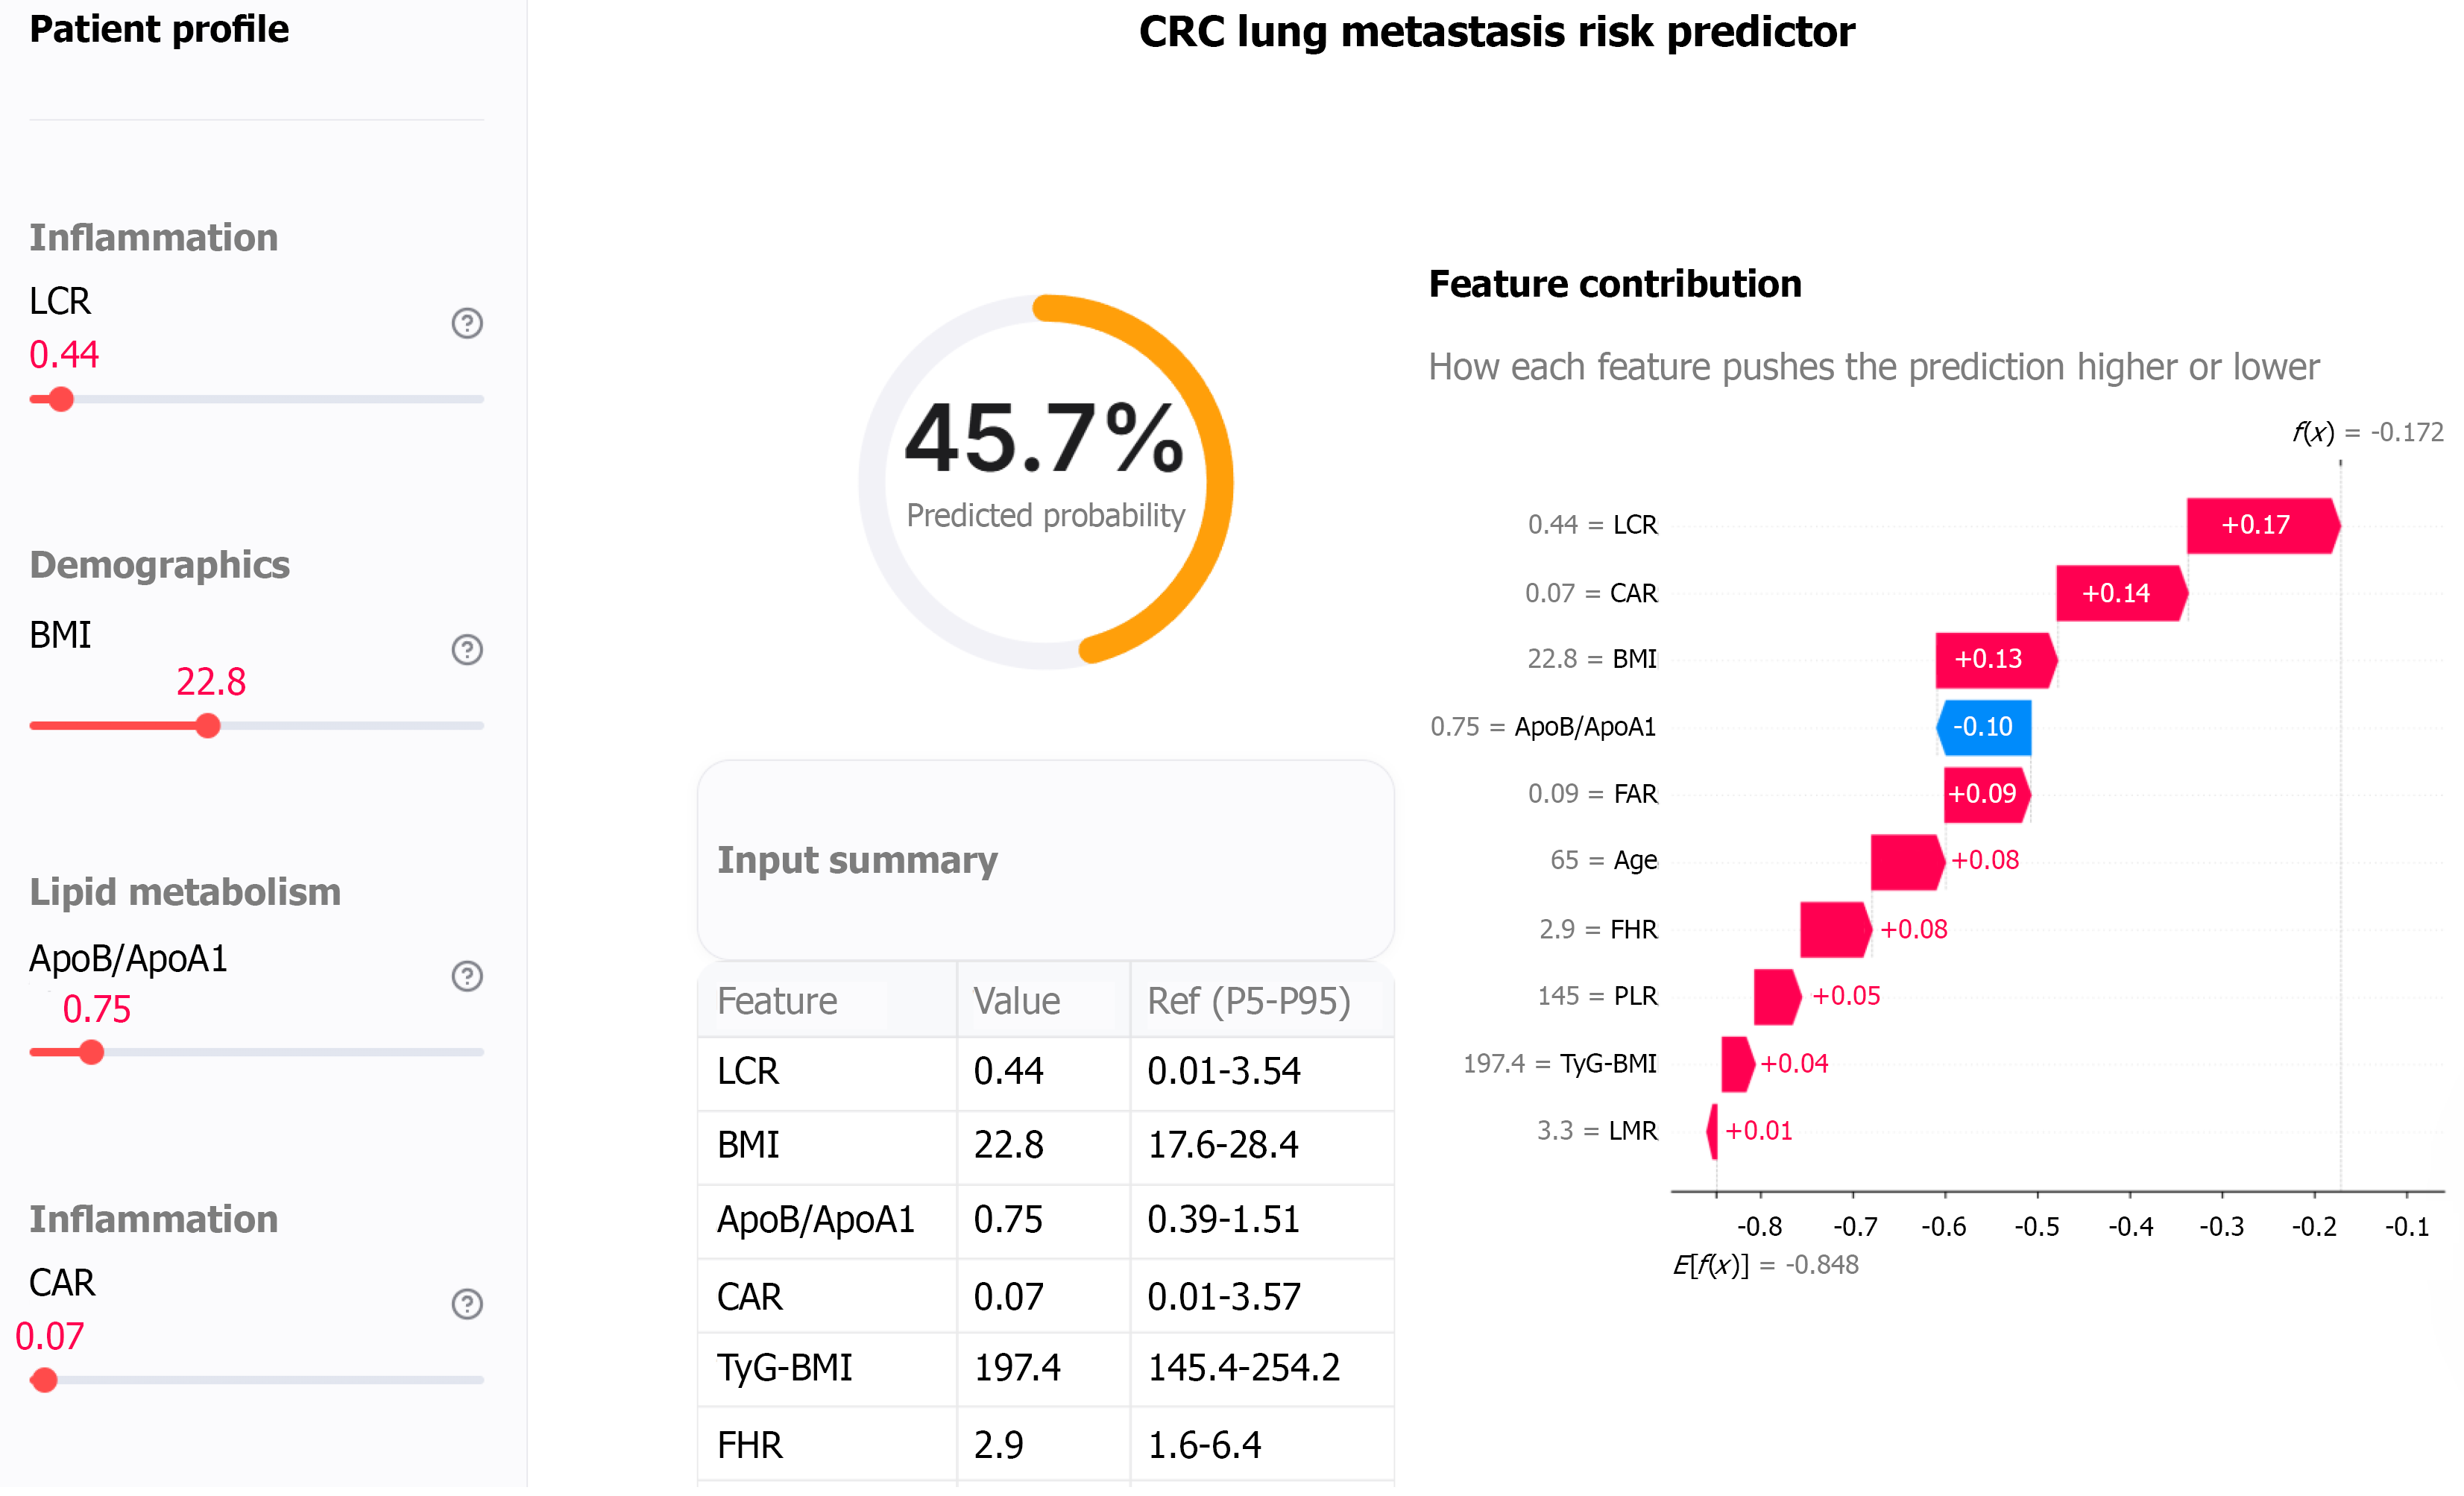
Figure 15 Clinical application tool.
CRC: Colorectal cancer; BMI: Body mass index; LCR: Lymphocyte-to-C-reactive protein ratio; CAR: C-reactive protein-to-albumin ratio; ApoB/ApoA1: Apolipoprotein B-to-apolipoprotein A1 ratio; FAR: Fibrinogen-to-albumin ratio; PLR: Platelet-to-lymphocyte ratio; FHR: Fibrinogen-to-high-density lipoprotein cholesterol ratio; LMR: Lymphocyte-to-monocyte ratio; TyG-BMI: Triglyceride-glucose-body mass index.
- Citation: Du YY, Liu YM, Fang RY, Zheng HG. Inflammation-lipid metabolism biomarker-based machine learning models for predicting postoperative pulmonary metastasis in colorectal cancer. World J Gastroenterol 2026; 32(46): 121708
- URL: https://www.wjgnet.com/1007-9327/full/v32/i46/121708.htm
- DOI: https://dx.doi.org/10.3748/wjg.121708