
















Copyright: ©Author(s) 2026.
World J Gastroenterol. Dec 14, 2026; 32(46): 121572
Published online Dec 14, 2026. doi: 10.3748/wjg.121572
Published online Dec 14, 2026. doi: 10.3748/wjg.121572
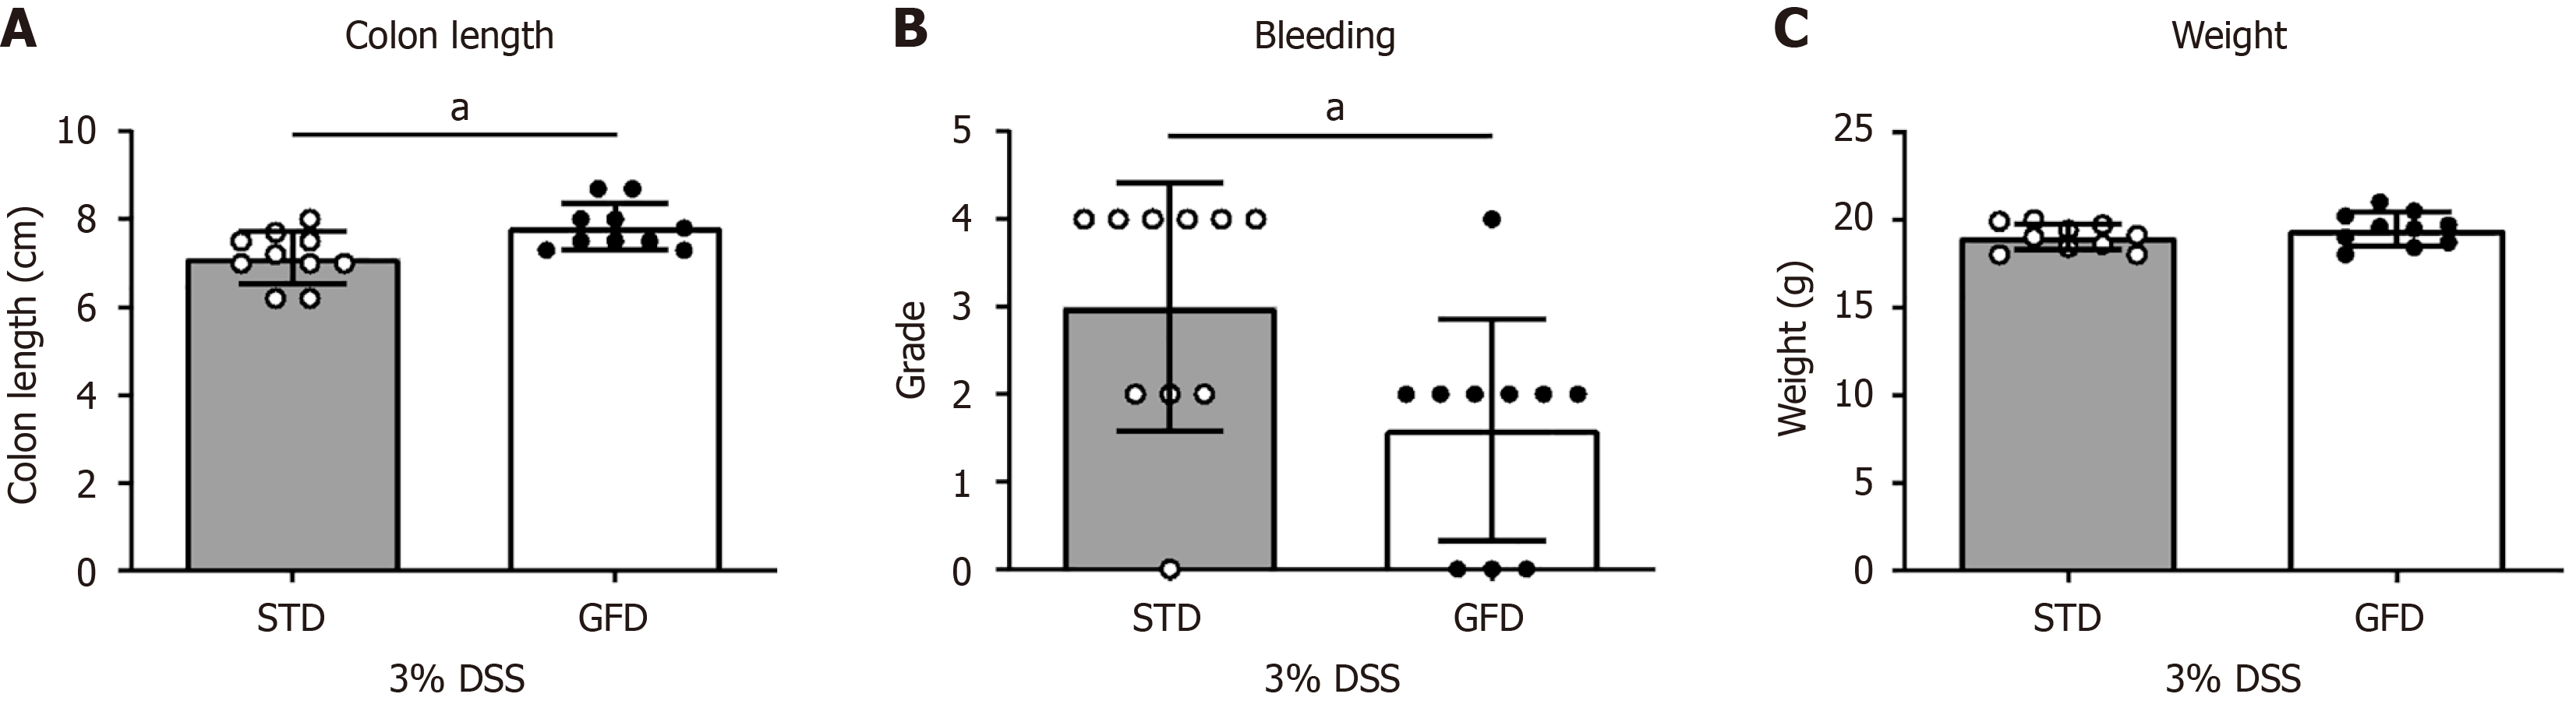
Figure 1 Gluten-free diet preserves colon length in dextran sulfate sodium-induced acute colitis.
In the first pilot experiment, colitis was induced with 3% dextran sulfate sodium (DSS) for 7 days in female BALB/c mice that had been maintained for 5 weeks on a gluten-free diet (GFD) (n = 10) or a standard diet (STD) (n = 10). A: Preservation of colon length in BALB/c mice on the GF or ST diet after DSS treatment (P < 0.05); B: Reduced intestinal bleeding scores (P < 0.05); C: No substantial changes in body weight during DSS-induced colitis. Data are expressed as mean ± SD. aP < 0.05. DSS: Dextran sulfate sodium; STD: Standard diet; GFD: Gluten-free diet.
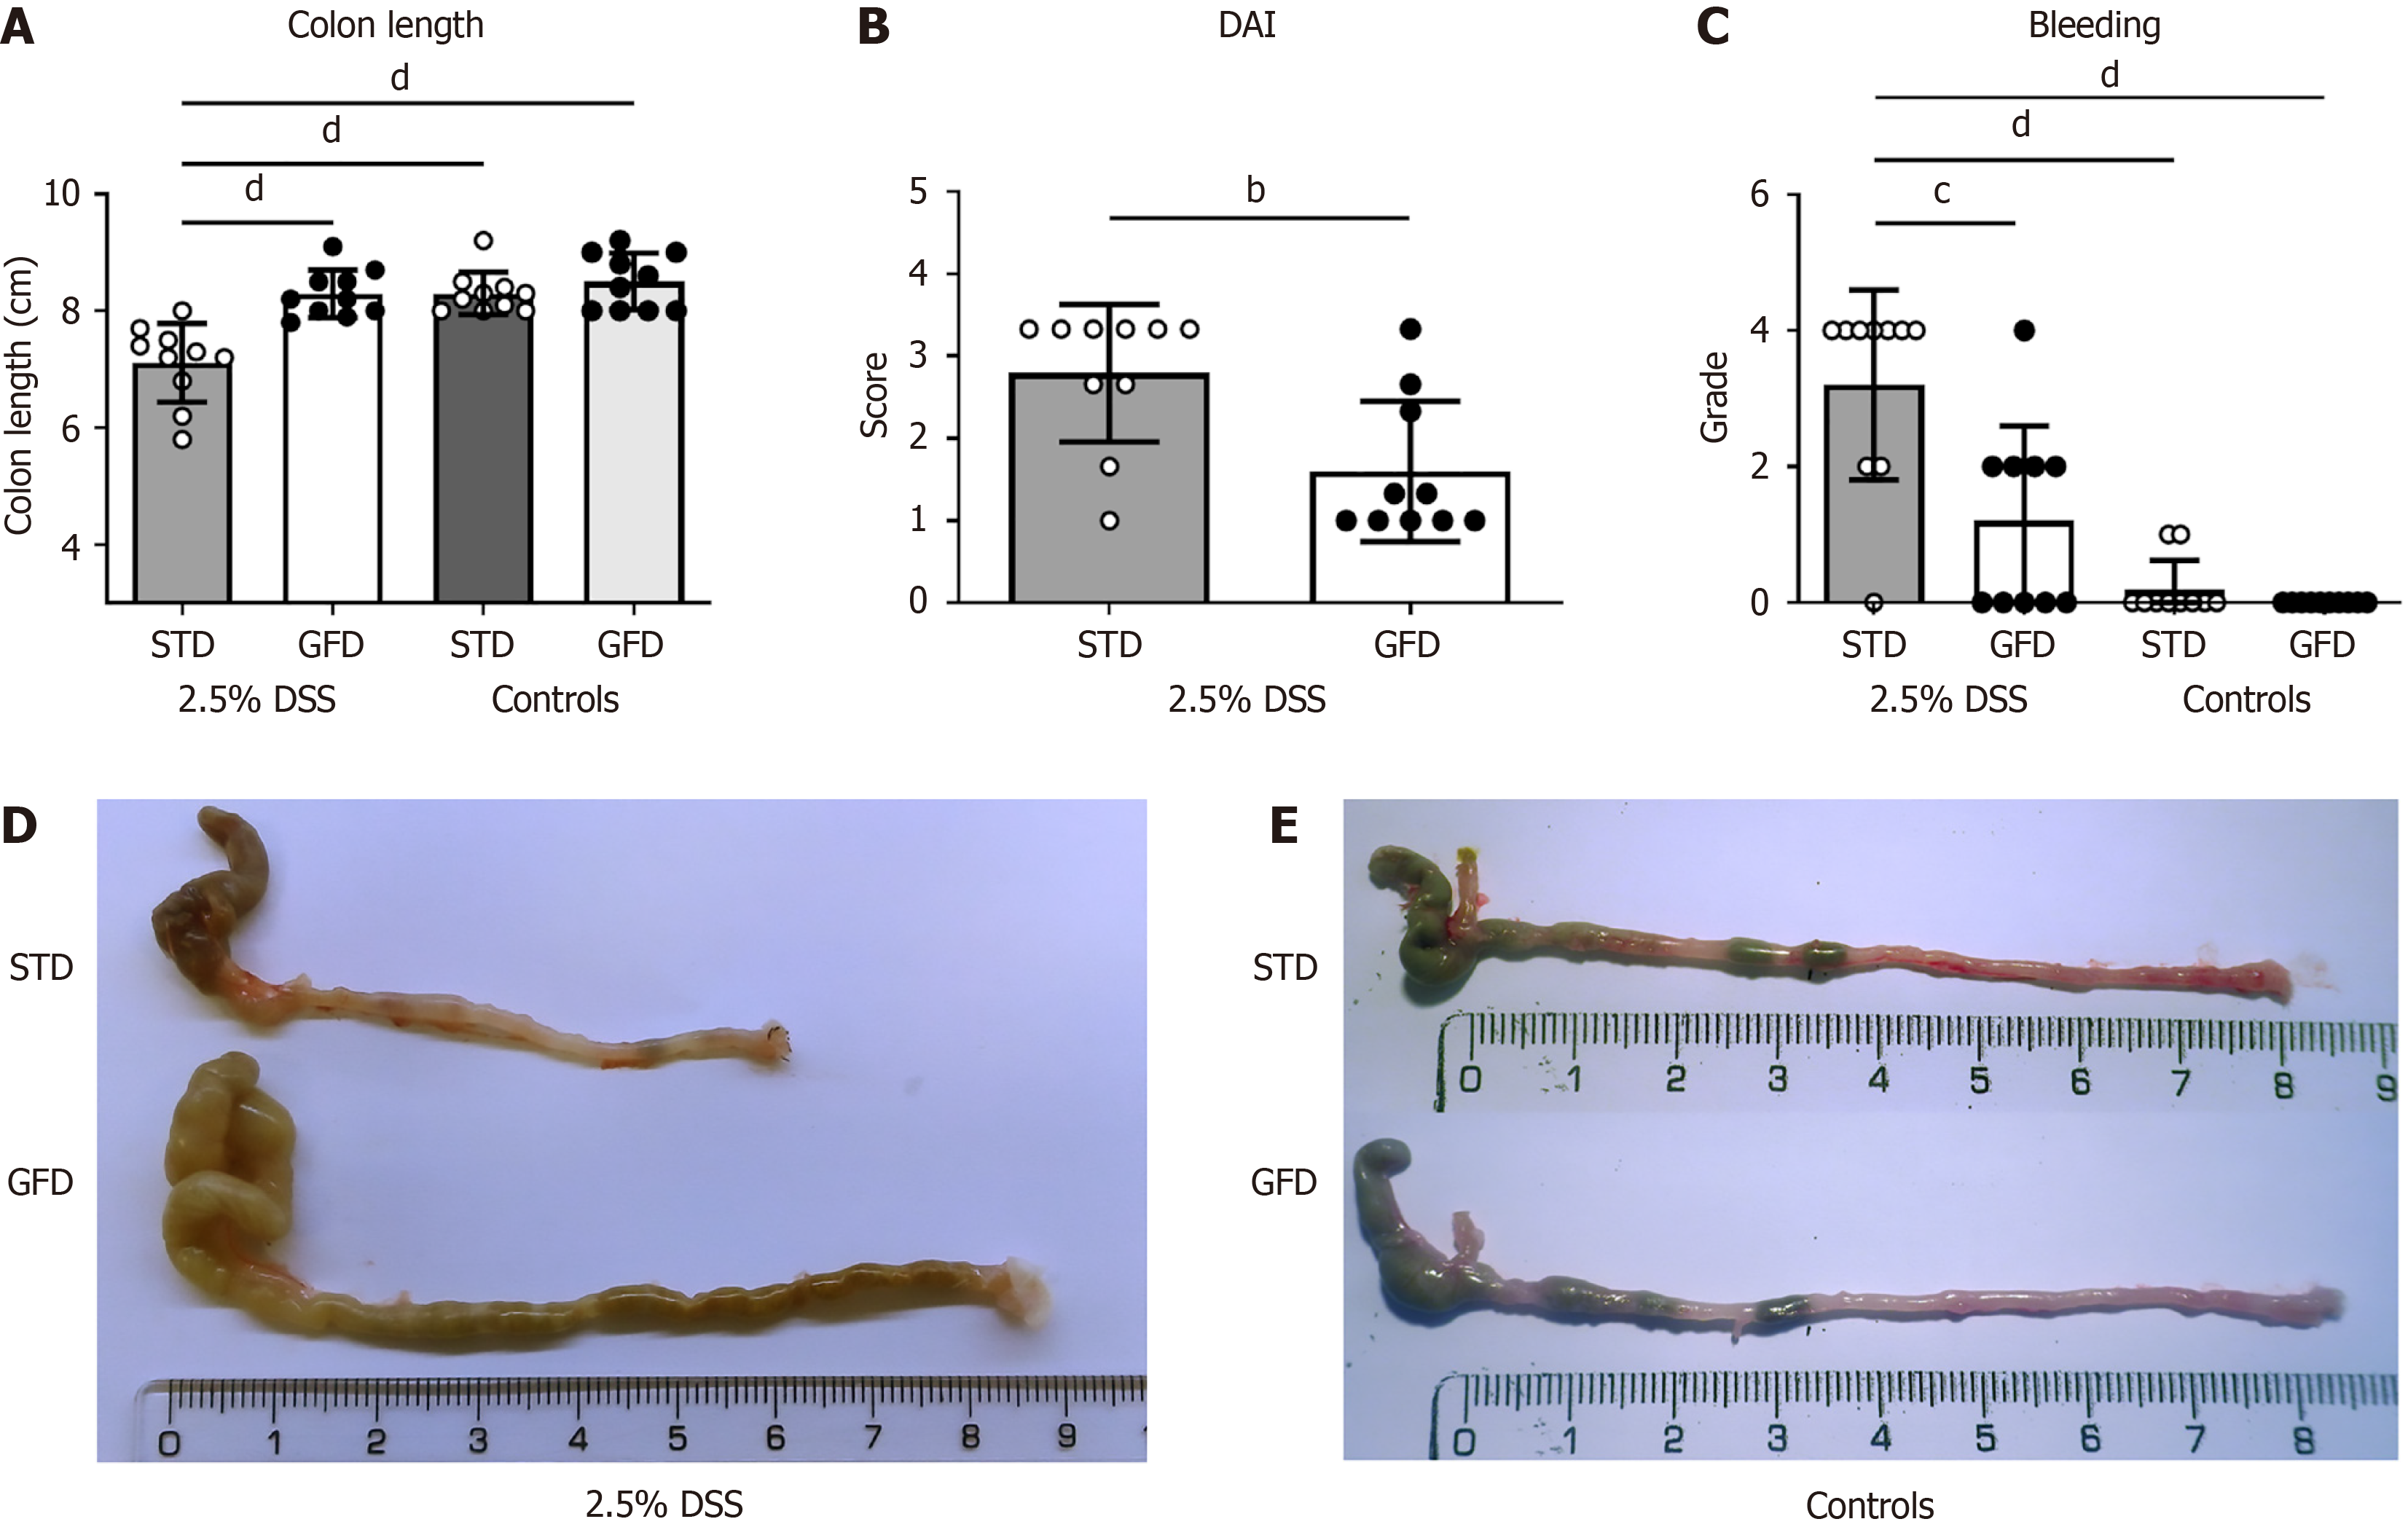
Figure 2 Gluten-free diet reduces severity of dextran sulfate sodium (2.
5%)-induced acute colitis in BALB/c mice. Eight-week-old female BALB/c mice fed the gluten-free diet (GFD) (n = 10) and standard diet (STD) (n = 10) from 4 weeks of age received 2.5% dextran sulfate sodium (DSS) in drinking water for 7 days and were sacrificed 3 days later. BALB/c mice on the STD (n = 10) and GFD (n = 10) without DSS exposure were used as controls. A: The GFD led to statistically significant preservation of colon length (P < 0.0001); B: Decreased disease activity index (P < 0.01); and C: Reduced intestinal bleeding (P < 0.001, P < 0.0001) in DSS-treated animals; D: Macroscopic images of representative colons from GFD and STD groups treated with 2.5% DSS; E: Controls. Data are expressed as mean ± SD. bP < 0.01. cP < 0.001. dP < 0.0001. P values were assessed by Student’s t-test or by one-way analysis of variance followed by Bonferroni’s post-test. DAI: Disease activity index; DSS: Dextran sulfate sodium; STD: Standard diet; GFD: Gluten-free diet.
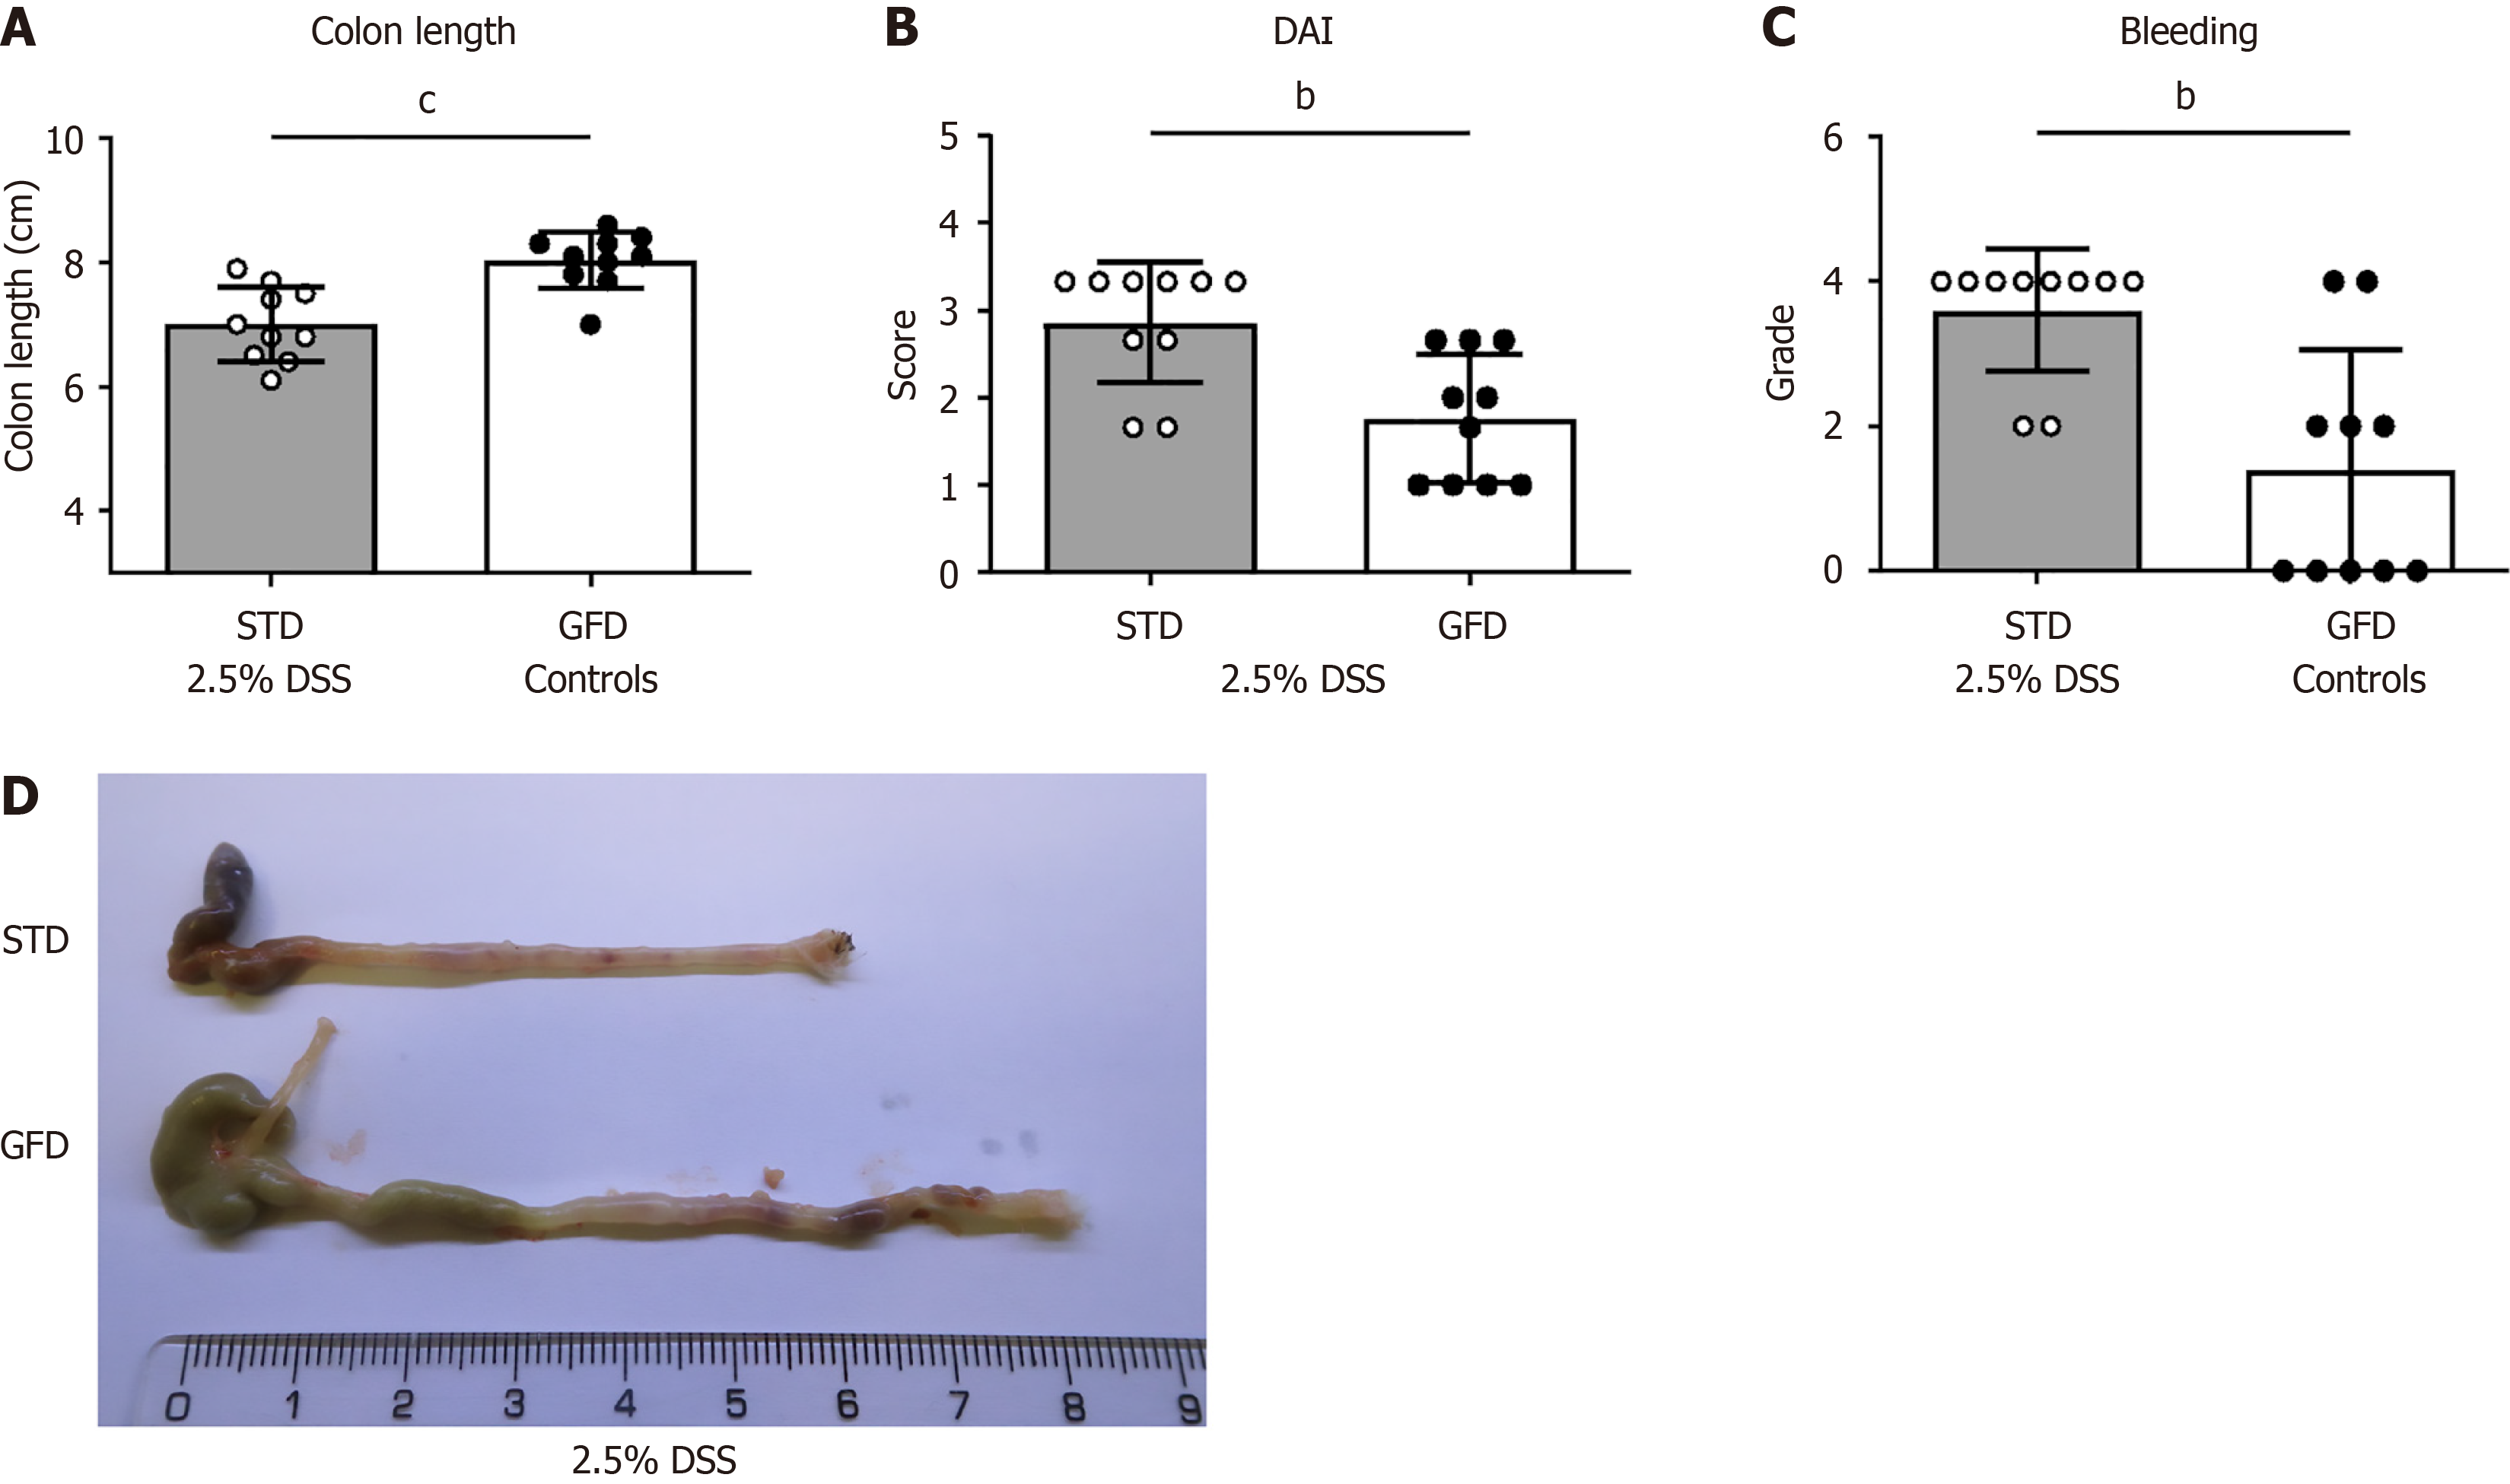
Figure 3 Effects of gluten-free diet on severity of dextran sulfate sodium (2.
5%)-induced acute colitis in BALB/c mice. Repeated experiment as in Figure 2, groups of 10 BALB/c females were exposed to 2.5% dextran sulfate sodium (DSS) in drinking water for 7 days at 8 weeks of age. A: The gluten-free diet (GFD) led to statistically significant preservation of colon length (P < 0.001); B: Decreased disease activity index (P < 0.01); and C: Reduced intestinal bleeding (P < 0.01) compared with DSS-treated animals on the standard diet (STD); D: Macroscopic images of representative colons from GFD and STD groups. Data are expressed as mean ± SD. bP < 0.01. cP < 0.001. DAI: Disease activity index; DSS: Dextran sulfate sodium; STD: Standard diet; GFD: Gluten-free diet.
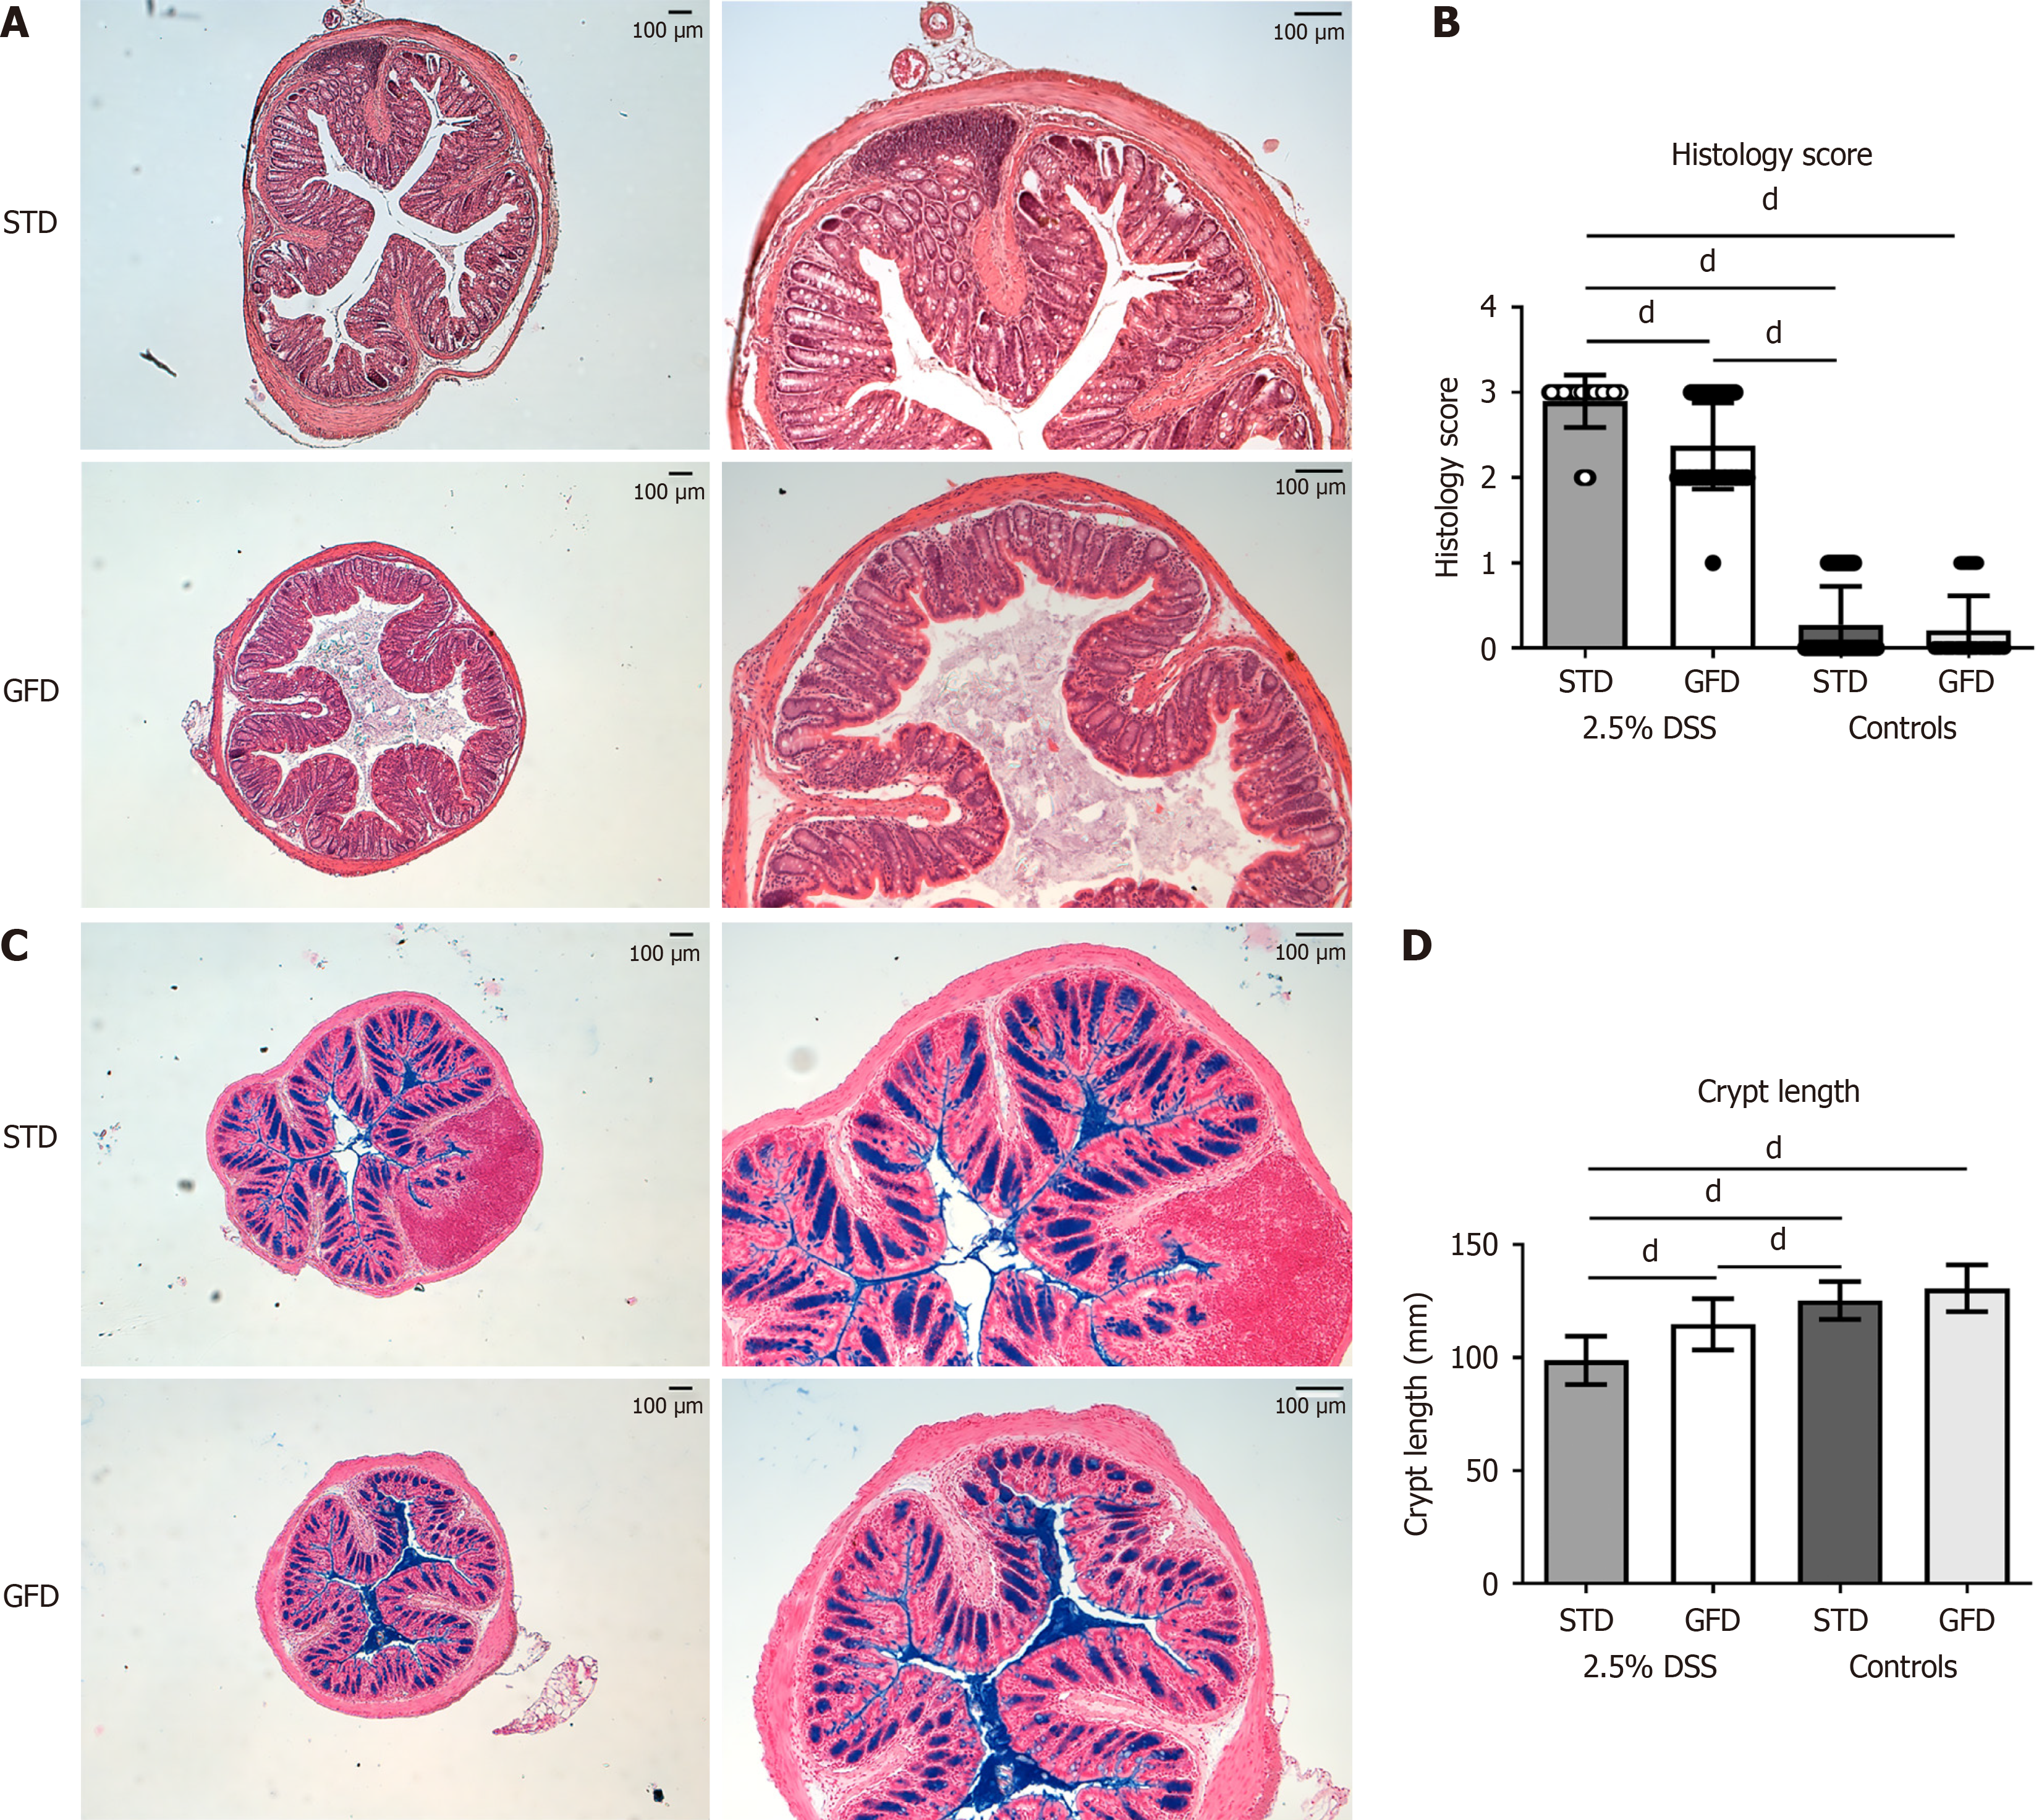
Figure 4 Colon morphology and histology of the dextran sulfate sodium-treated BALB/c mice fed gluten-free diet or standard diet.
A: Representative hematoxylin and eosin-stained colon sections from BALB/c mice treated with 2.5% dextran sulfate sodium (DSS) for 7 days and fed the gluten-free diet (GFD) or standard diet (STD) (n = 10), magnification 5 × or 10 ×; B: Histology score evaluating colonic mucosa in GFD- and STD-fed BALB/c mice (P < 0.0001, n = 10) after 7 days of 2.5% DSS exposure, including untreated controls; C: Representative histological specimens documenting mucin in colon and goblet cells within colonic epithelium (stained by Alcian blue and nuclear fast red) of BALB/c mice treated for 7 days with 2.5% DSS and fed GFD or STD (n = 10), magnification 5 × or 10 ×; D: Statistically significant (P < 0.0001) preservation of crypt length in GFD vs STD BALB/c mice (n = 10) exposed to 2.5% DSS. Example of two independent experiments. Data are expressed as mean ± SD. dP < 0.0001. DSS: Dextran sulfate sodium; STD: Standard diet; GFD: Gluten-free diet.
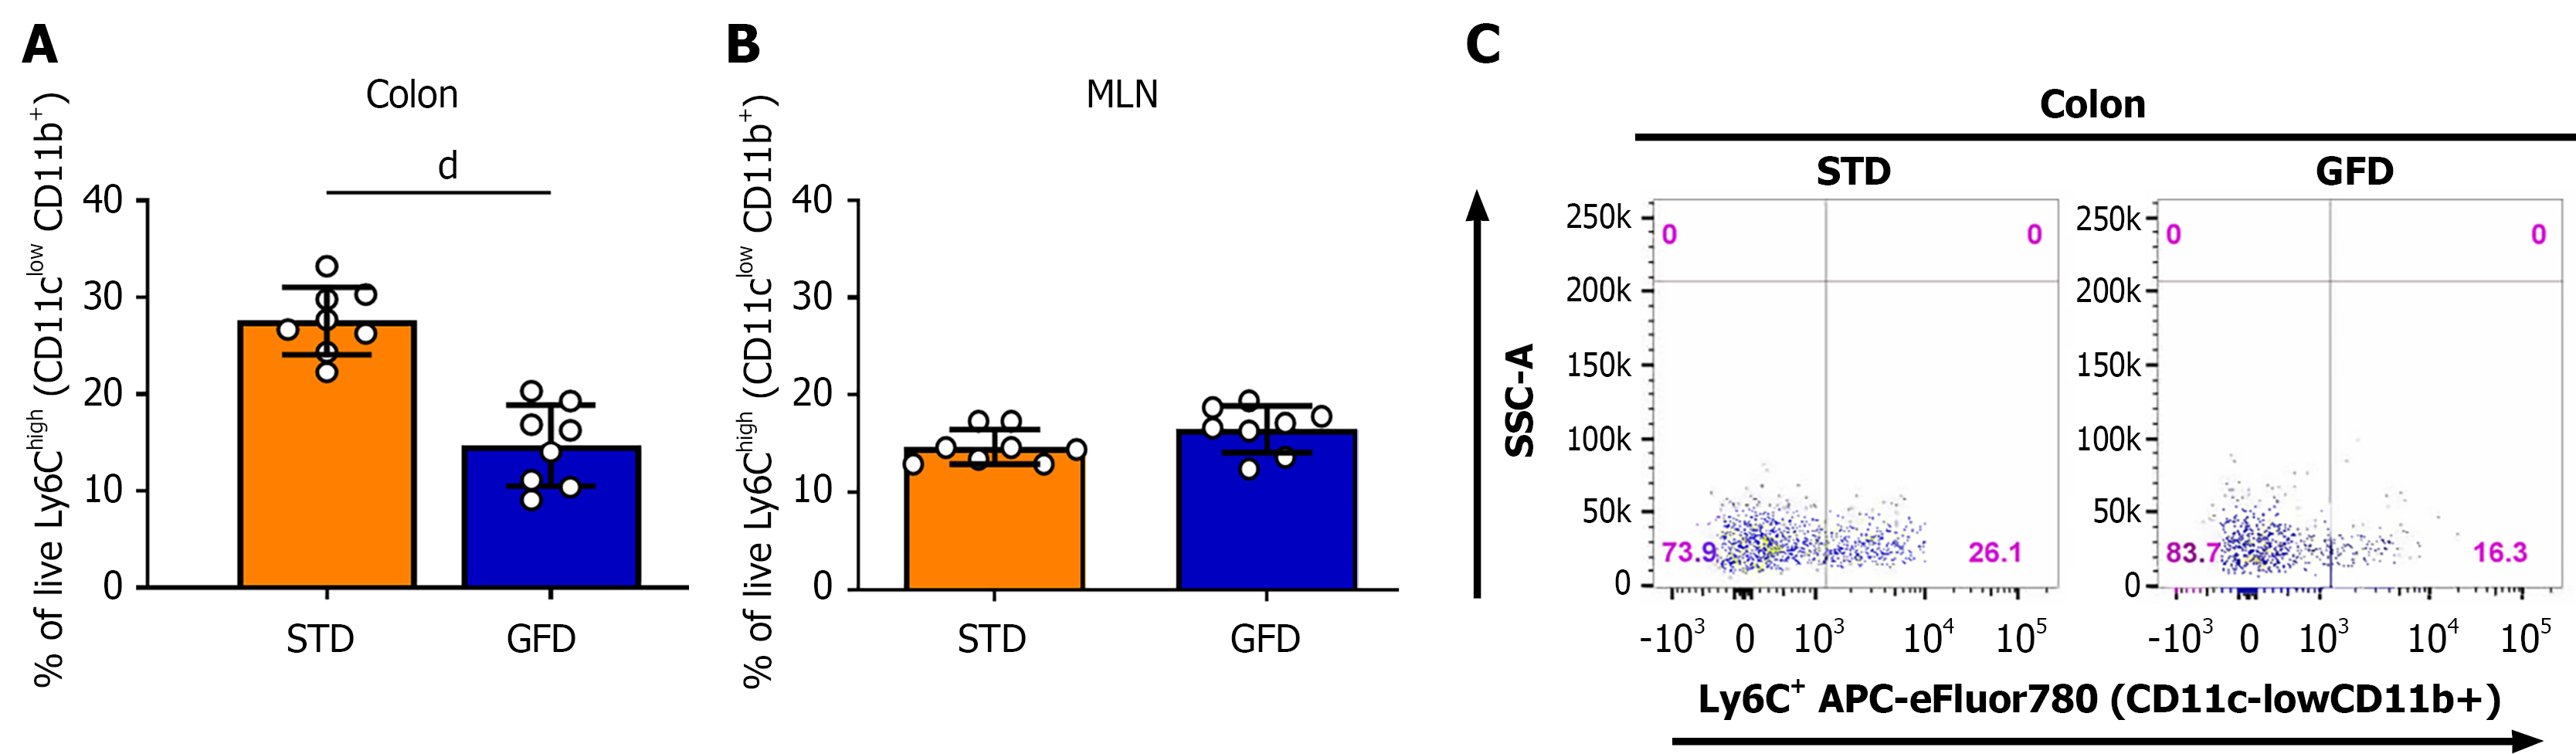
Figure 5 Monocyte infiltration in colon and mesenteric lymph nodes of dextran sulfate sodium-treated mice fed gluten-free diet vs standard diet.
Flow cytometry analysis of colon-infiltrating monocytes prepared according to Couter and Surana[37] and monocytes in mesenteric lymph nodes. After exclusion of debris and doublets, cells were further gated according to the side scatter, cluster of differentiation (CD) 45, and other markers and are displayed as a percentage of live CD11clow CD11b+ lymphocyte antigen 6C (Ly6C)high cells. A: Gluten-free diet (GFD)-fed mice displayed a statistically significant reduction in the proportion of colonic CD11clow CD11b+ Ly6Chigh cells (n = 8, P < 0.0001); B: Example dot plots of colonic monocytes from the dextran sulfate sodium-treated mice on the GFD and standard diet. Data are expressed as mean ± SD. dP < 0.0001. MLN: Mesenteric lymph nodes; CD: Cluster of differentiation; Ly6C: Lymphocyte antigen 6C; SSC-A: Side scatter-area; STD: Standard diet; GFD: Gluten-free diet.
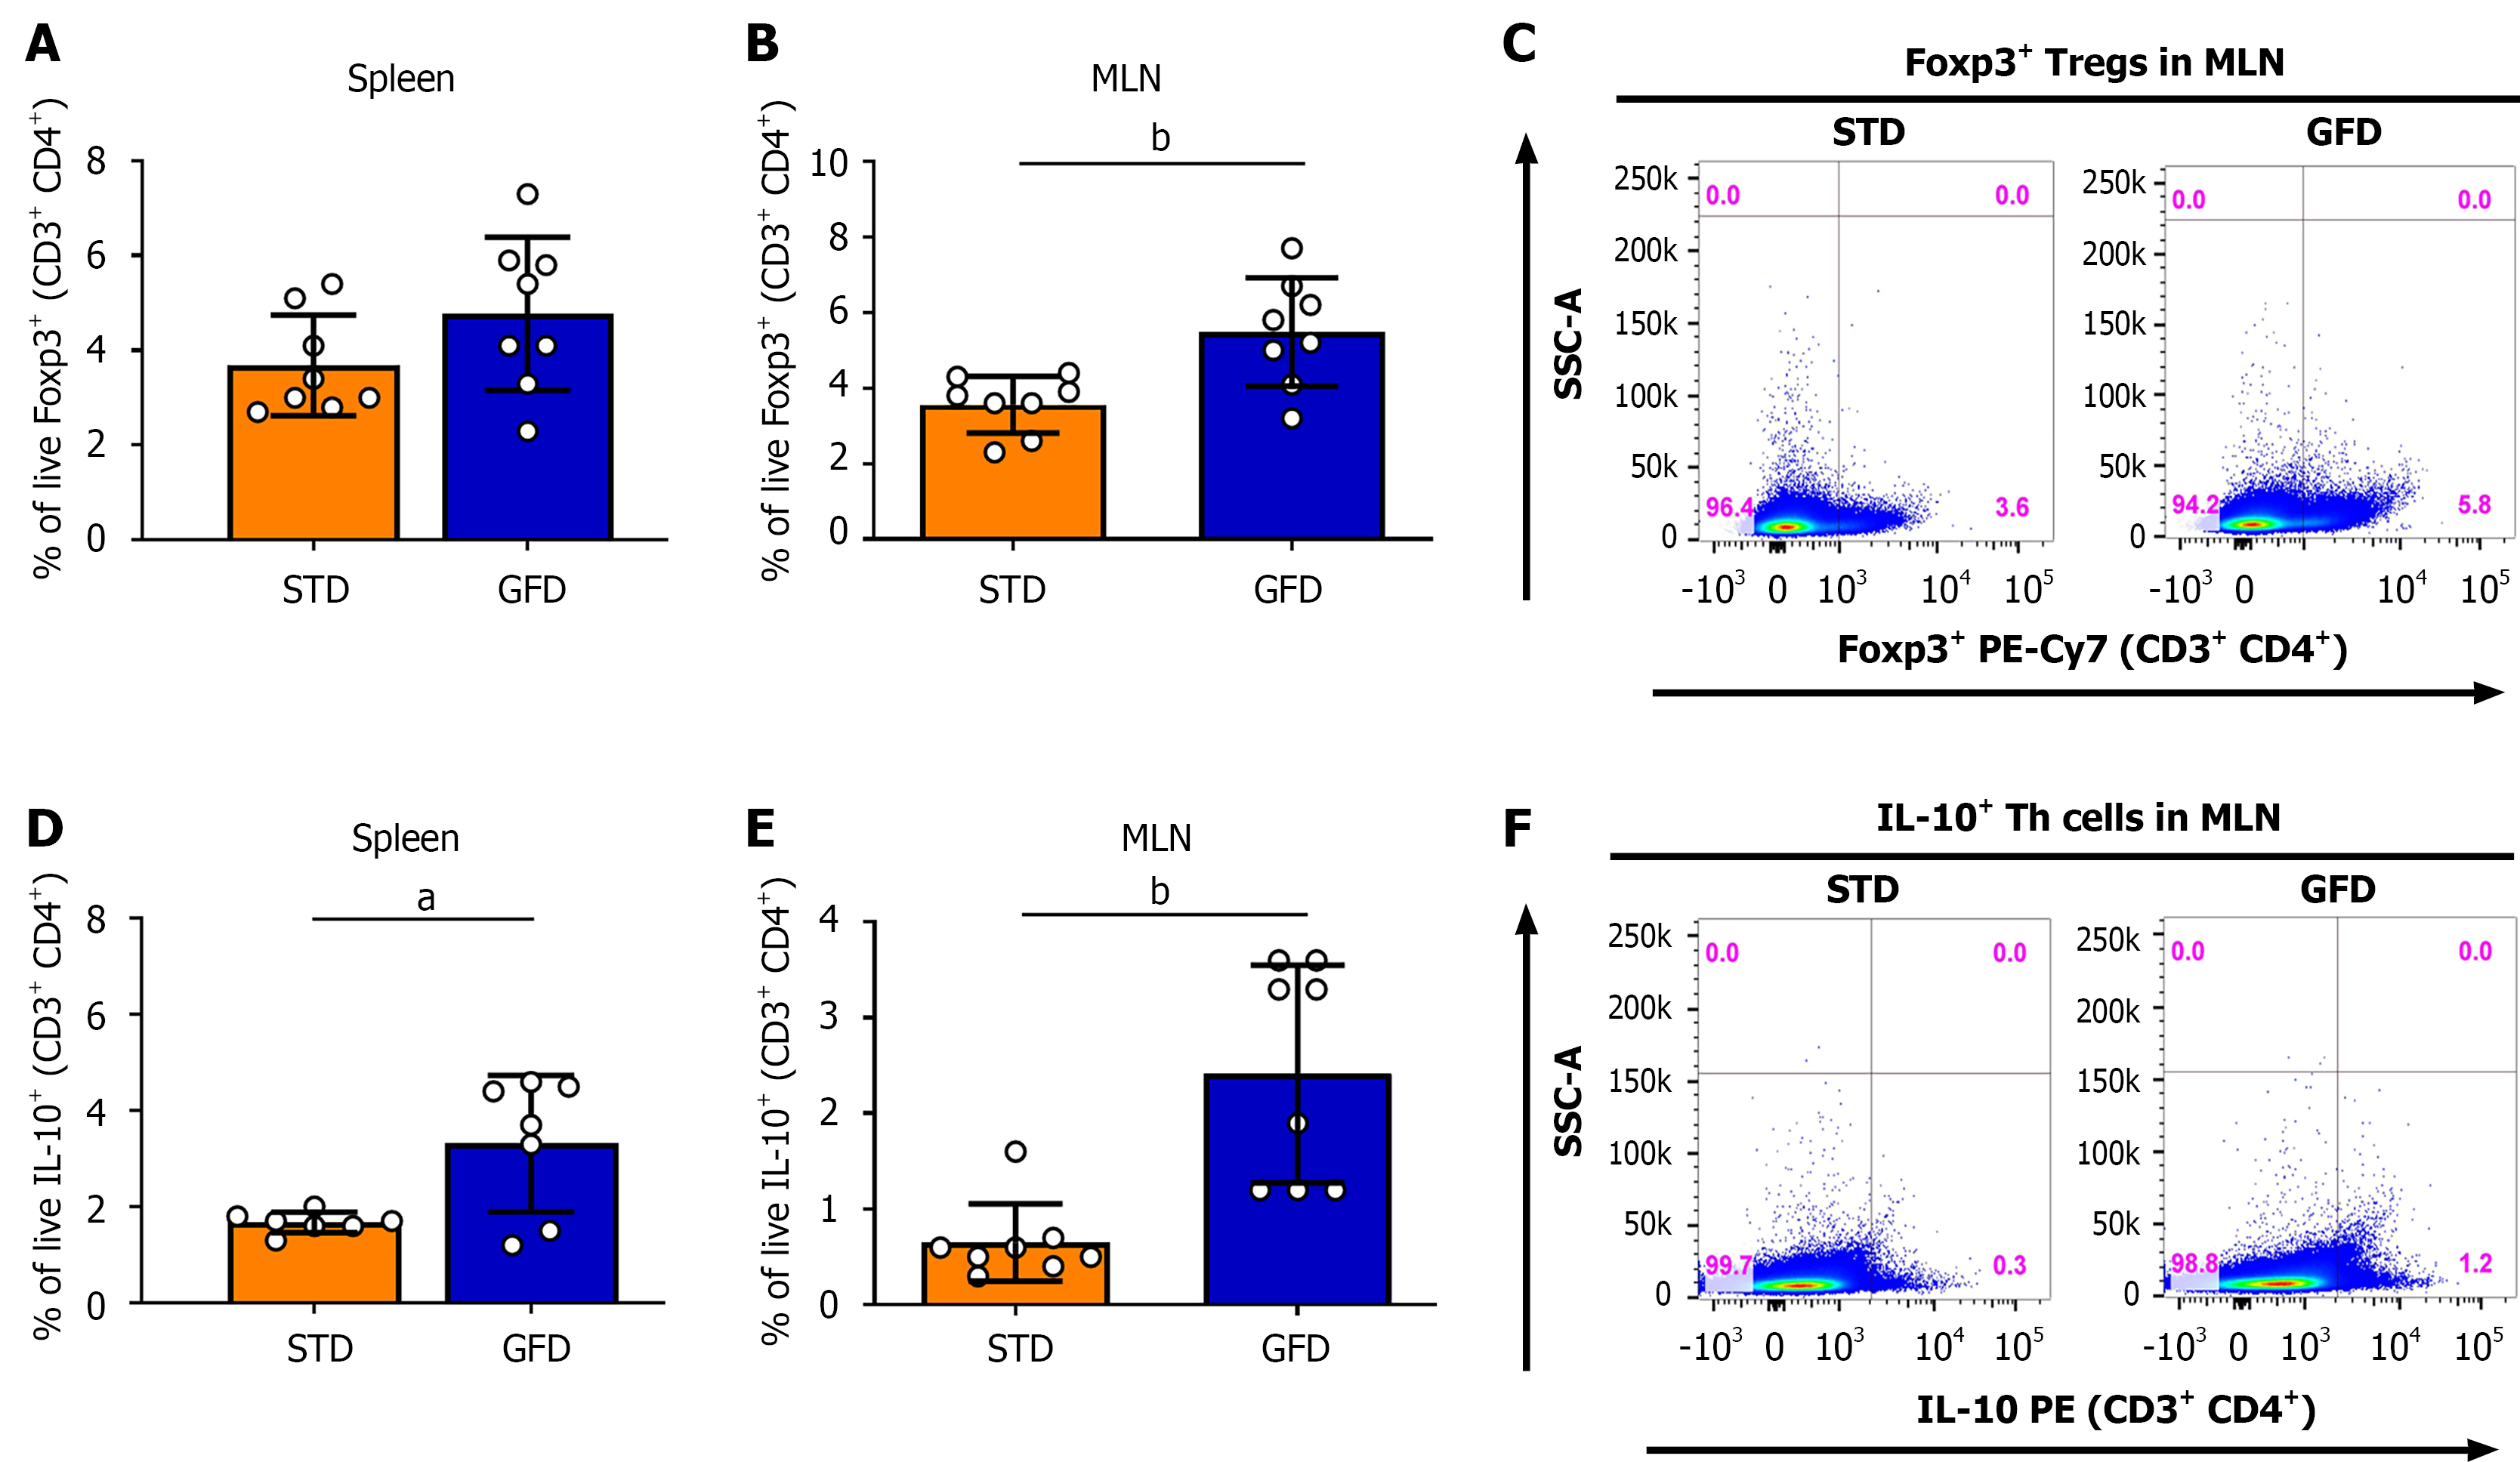
Figure 6 Effect of gluten-free diet on forkhead box P3+ regulatory T cells and interleukin-10+ T helper cells in mesenteric lymph nodes and spleen of dextran sulfate sodium-treated mice.
A: Proportion of cluster of differentiation (CD) 4+ forkhead box P3 (Foxp3)+ cells within T cells (CD3+-gated); B: Example dot plots of CD4+ Foxp3+ regulatory T cells in mesenteric lymph nodes (MLN); C: Proportion of interleukin (IL)-10+ T helper cells (CD3+ CD4+-gated) in MLN and spleen of female BALB/c mice fed gluten-free diet and standard diet (n = 8) that were treated for 7 days with 2.5% dextran sulfate sodium; D: IL-10+ (CD3+ CD4+) T helper cells. Data are expressed as mean ± SD. aP < 0.05. bP < 0.01. P values represent an example of two independent experiments. MLN: Mesenteric lymph nodes; STD: Standard diet; GFD: Gluten-free diet; CD: Cluster of differentiation; TCR: T cell receptor; IL: Interleukin; Foxp3: Forkhead box P3; SSC-A: Side scatter-area; Treg: Regulatory T cells; PE-Cy7: Phycoerythrin-cyanine 7; Th: T helper cell.
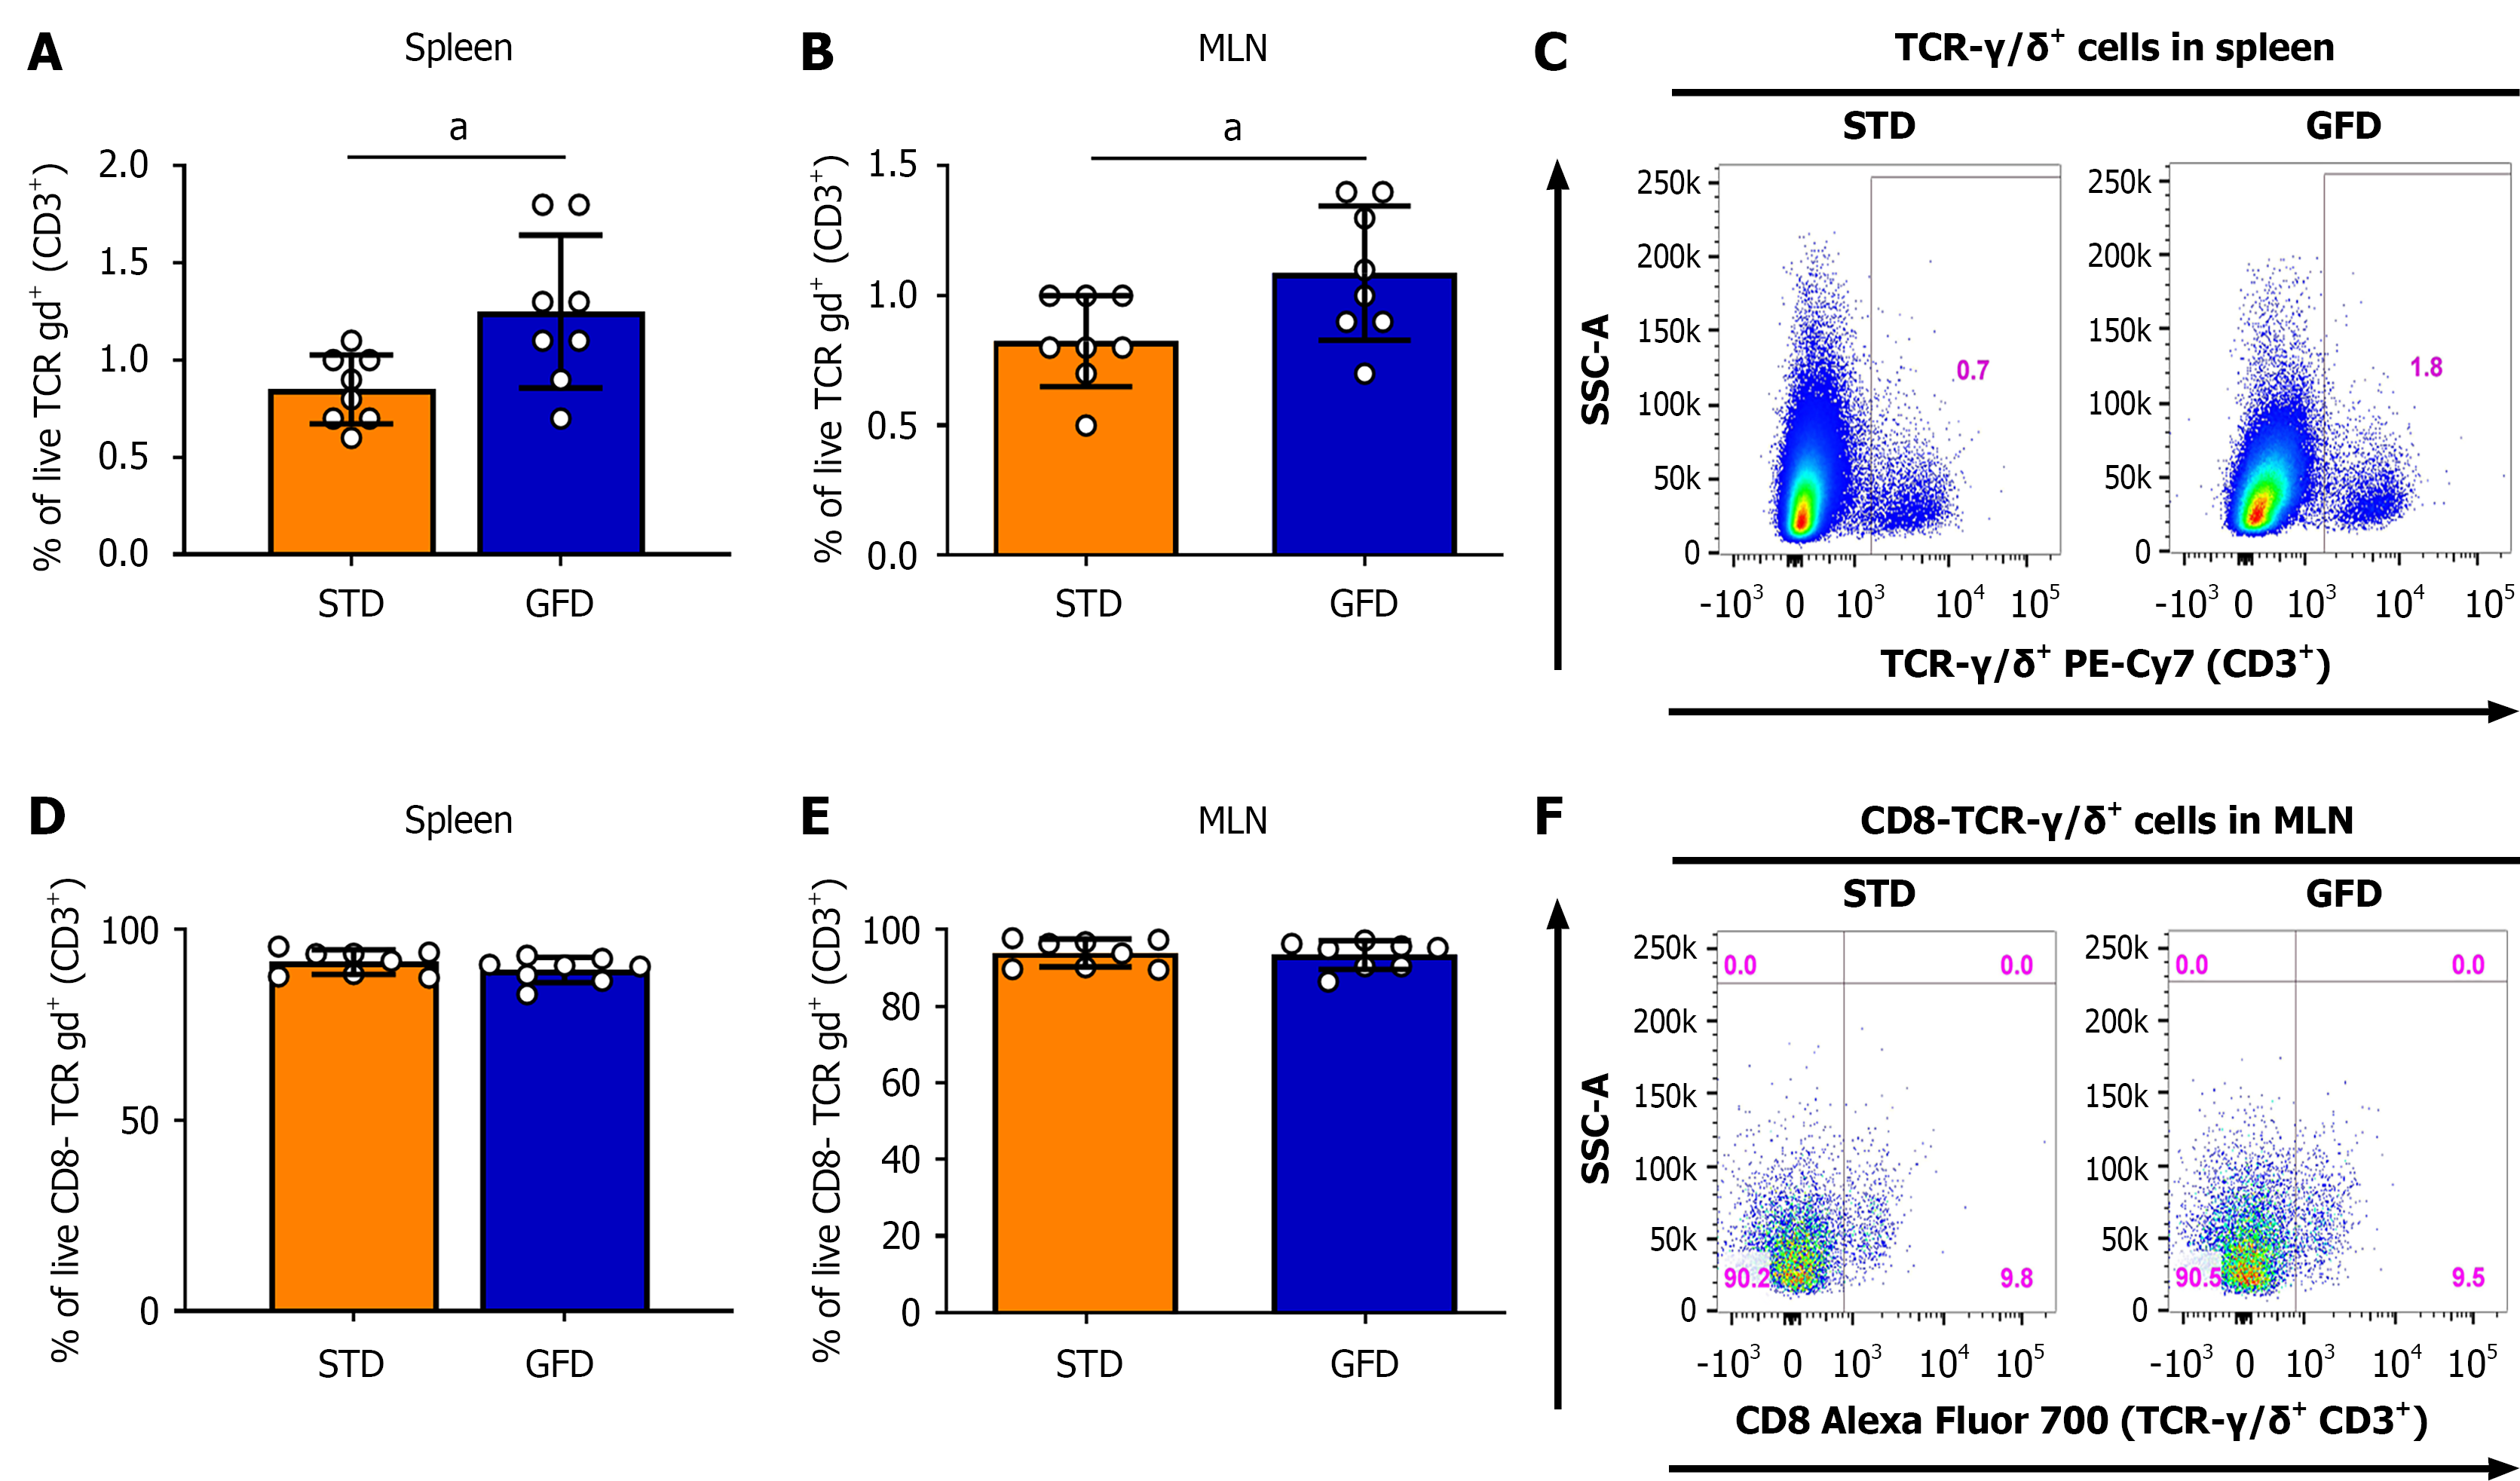
Figure 7 Changes of γδ T cells in mesenteric lymph nodes and spleen of dextran sulfate sodium-treated mice fed gluten-free diet and standard diet.
A: Increased proportion of cluster of differentiation (CD) 3+ γδ+ T cells in mesenteric lymph nodes (MLN) and spleen of female BALB/c mice fed gluten-free diet vs standard diet (n = 8, P < 0.05) after 7 days of 2.5% dextran sulfate sodium; B: Example dot plots of γδ T cells in spleen; C: There were no changes in the proportion of CD8- vs CD8+ γδ T-cell subsets; D: CD8-/CD8+ γδ+ T cells in MLN. Data are expressed as mean ± SD. aP < 0.05. The results represent an example from two independent experiments. MLN: Mesenteric lymph nodes; STD: Standard diet; GFD: Gluten-free diet; CD: Cluster of differentiation; TCR: T cell receptor; SSC-A: Side scatter-area; PE-Cy7: Phycoerythrin-cyanine 7.
- Citation: Funda D, Drabonova B, Golias J, Tejklova T, Cisarova R, Bartosova J, Drastich P. Gluten-free diet reduces severity of dextran sulfate sodium-induced colitis in BALB/c mice. World J Gastroenterol 2026; 32(46): 121572
- URL: https://www.wjgnet.com/1007-9327/full/v32/i46/121572.htm
- DOI: https://dx.doi.org/10.3748/wjg.121572