
















Copyright: ©Author(s) 2026.
World J Gastroenterol. Dec 14, 2026; 32(46): 121223
Published online Dec 14, 2026. doi: 10.3748/wjg.121223
Published online Dec 14, 2026. doi: 10.3748/wjg.121223
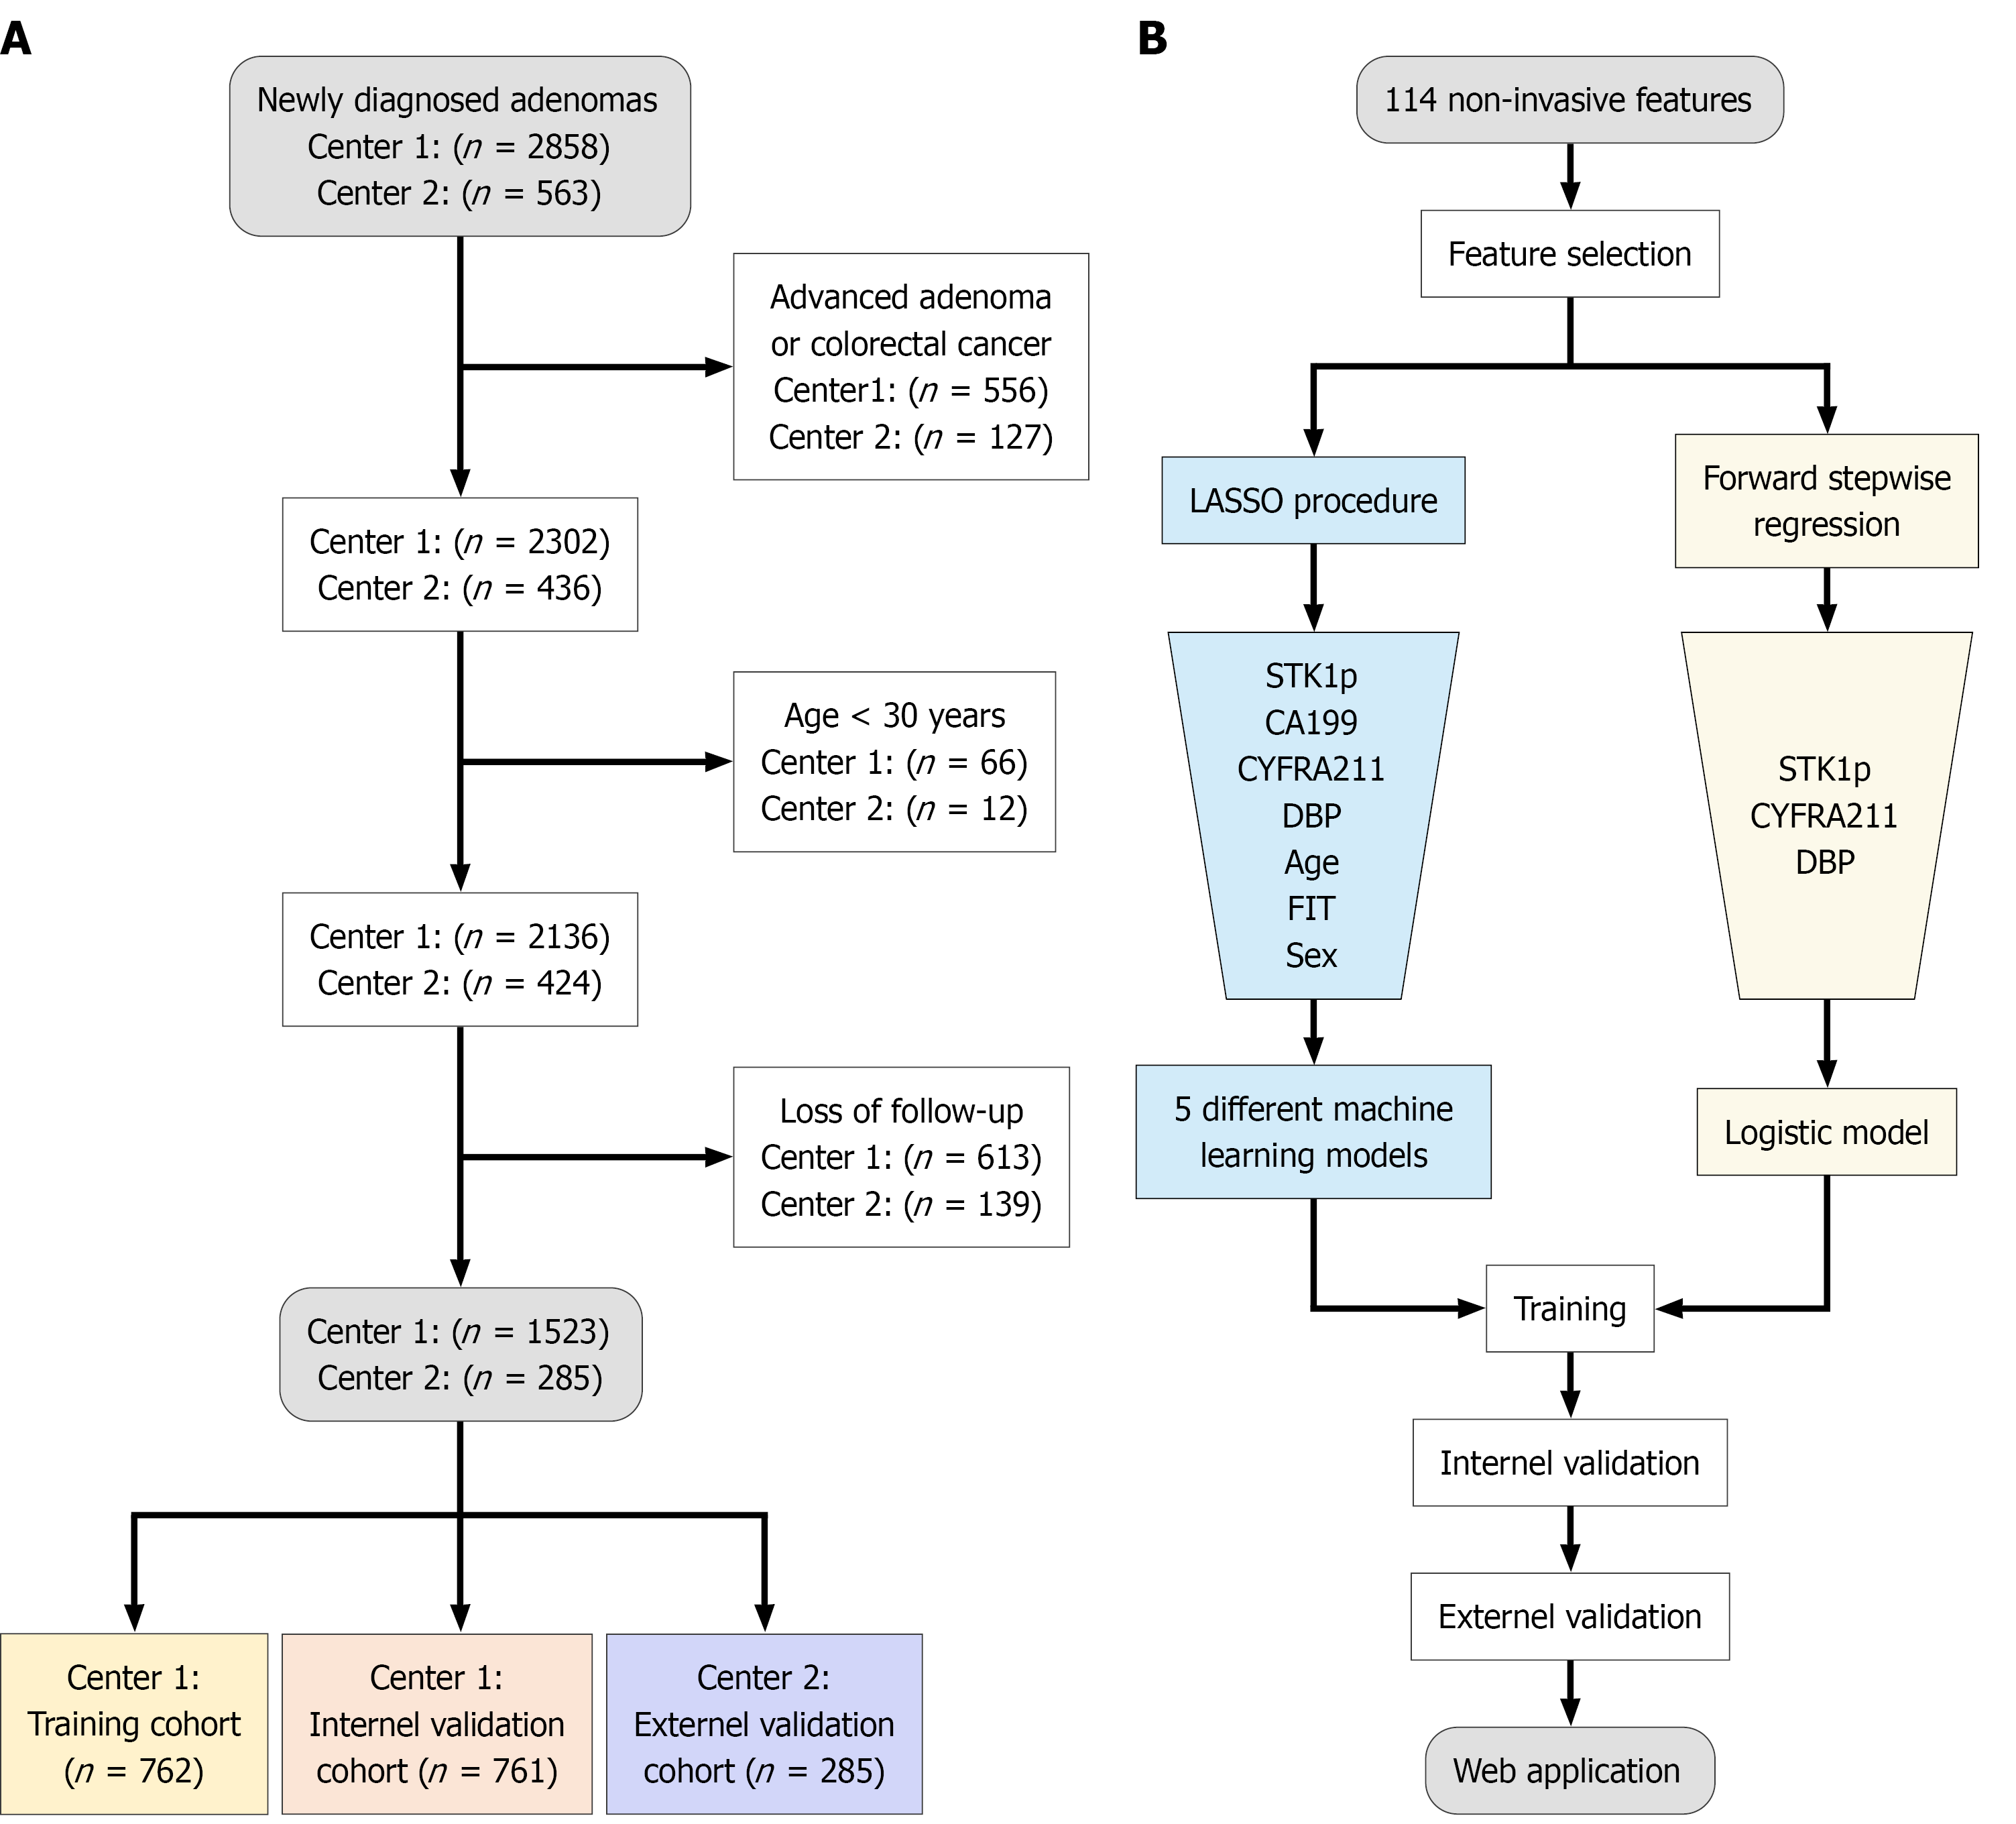
Figure 1 Study flow charts.
A: Flow chart of study participants. Center 1 was Shenzhen People’s Hospital and Center 2 was West China Longquan Hospital Sichuan University; B: Procedure for developing prediction models. CA19-9: Carbohydrate antigen 19-9; CYFRA21-1: Cytokeratin 19 fragment; DBP: Diastolic blood pressure; FIT: Fecal immunochemical test; LASSO: Least absolute shrinkage and selection operator; STK1p: Serum thymidine kinase 1 protein.
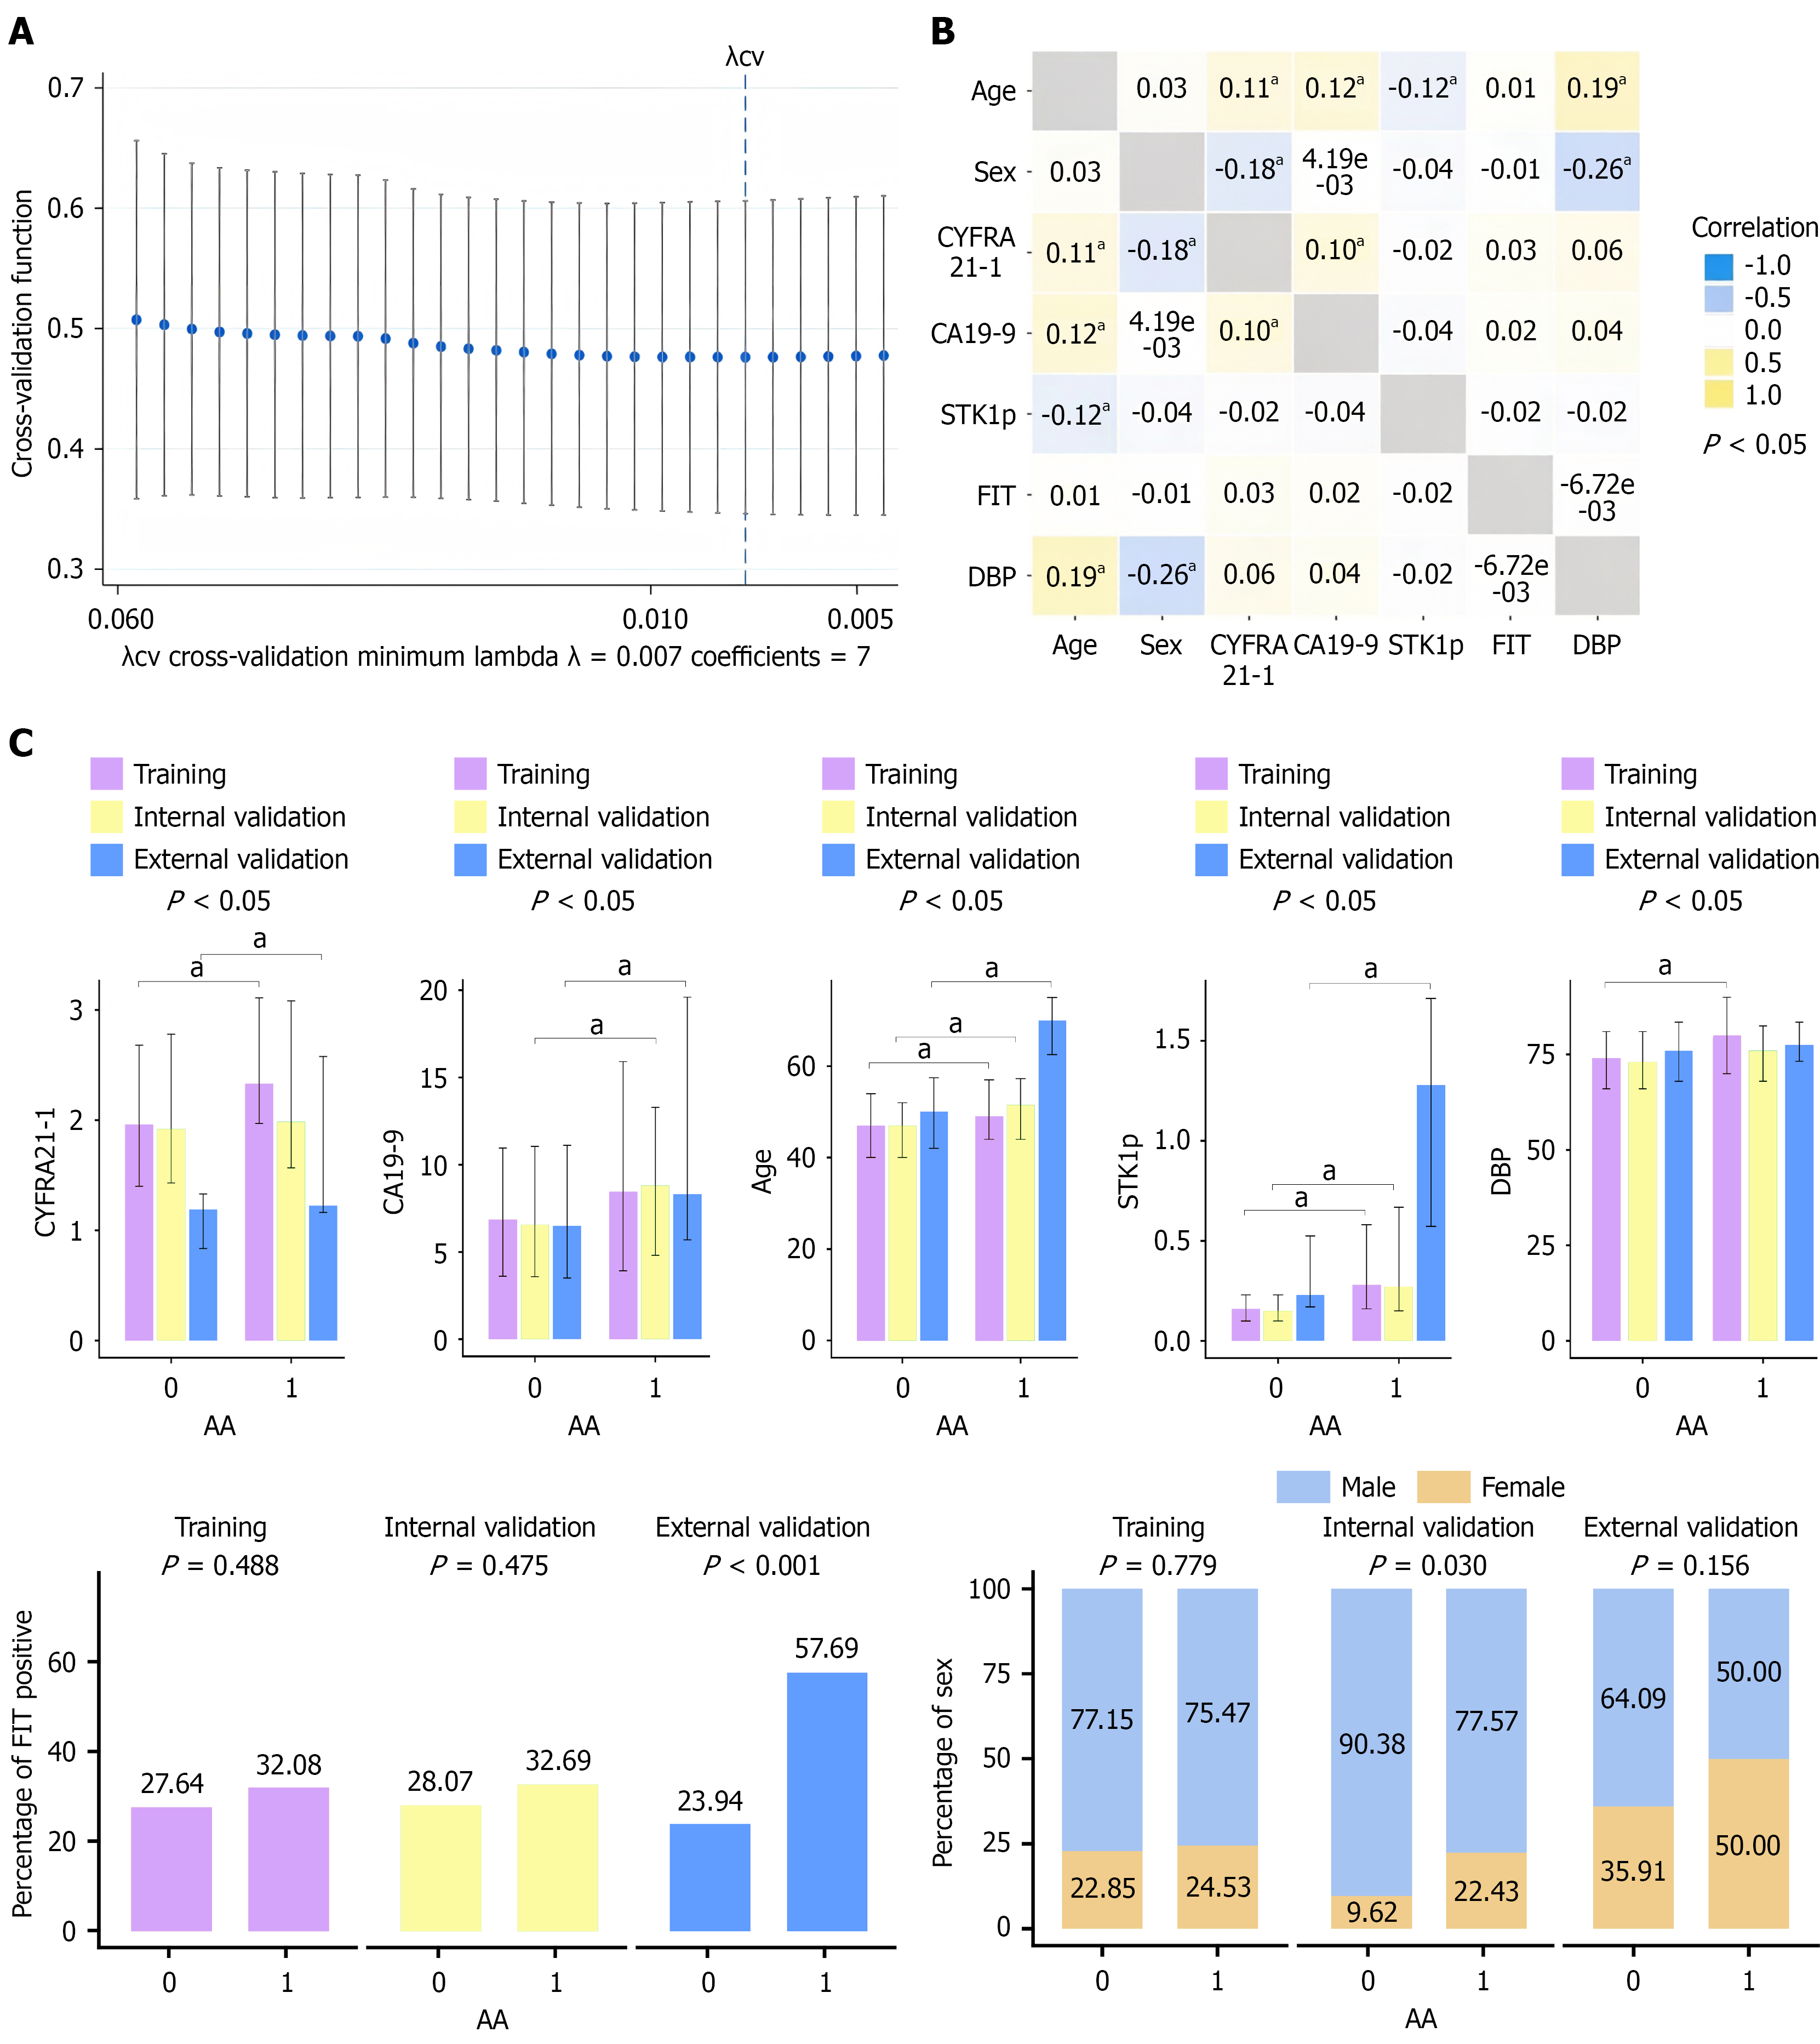
Figure 2 Model feature selection.
A: Least absolute shrinkage and selection operator procedure for selecting predictors in the training cohort; B: Spearman correlations between included predictors in the training cohort; C: Distribution of selected predictors in participants with and without incident advanced adenoma in the training and validation cohorts (data are medians with interquartile ranges or n (%)). aP < 0.05. AA: Advanced adenoma; CA19-9: Carbohydrate antigen 19-9; CYFRA21-1: Cytokeratin 19 fragment; DBP: Diastolic blood pressure; FIT: Fecal immunochemical test; STK1p: Serum thymidine kinase 1 protein.
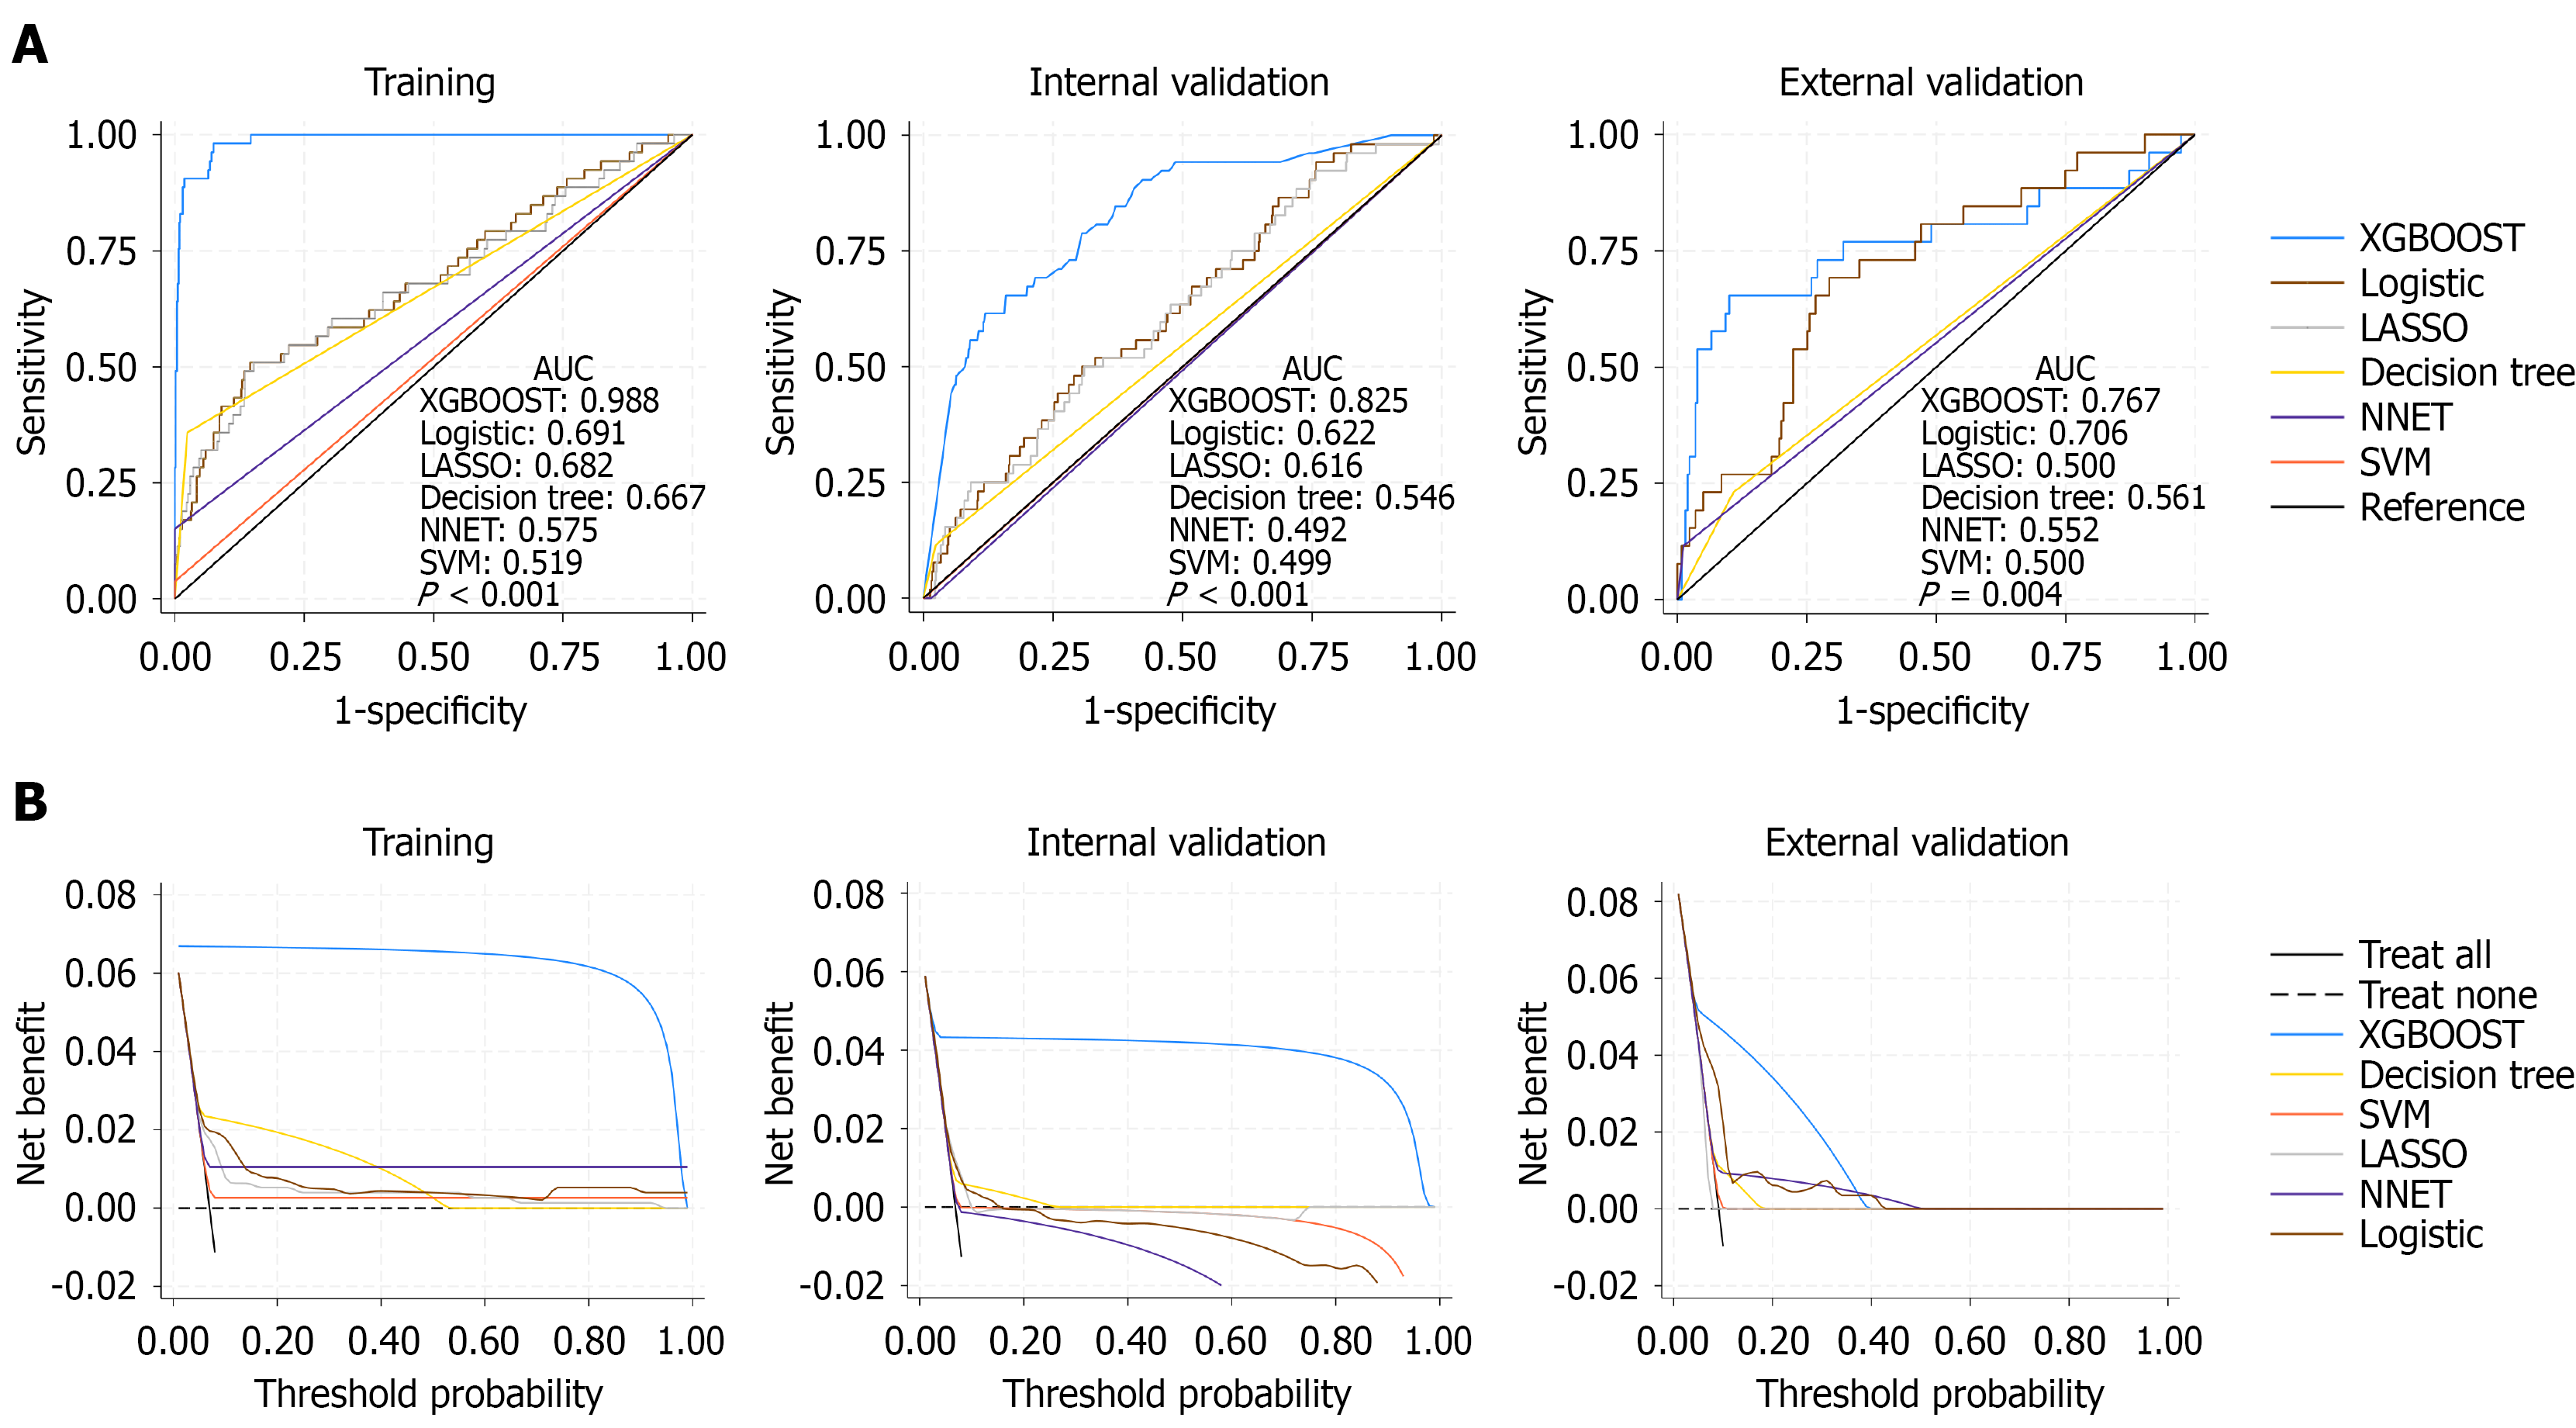
Figure 3 Model performance.
A: Receiver operating characteristic curves of different models in the training, internal validation, and external validation cohorts; B: Decision analyses of different models in the training, internal validation, and external validation cohorts. AUC: Area under the receiver operating characteristic; LASSO: Least absolute shrinkage and selection operator; NNET: Neural network; SVM: Support vector machine; XGBOOST: EXtreme Gradient Boosting.
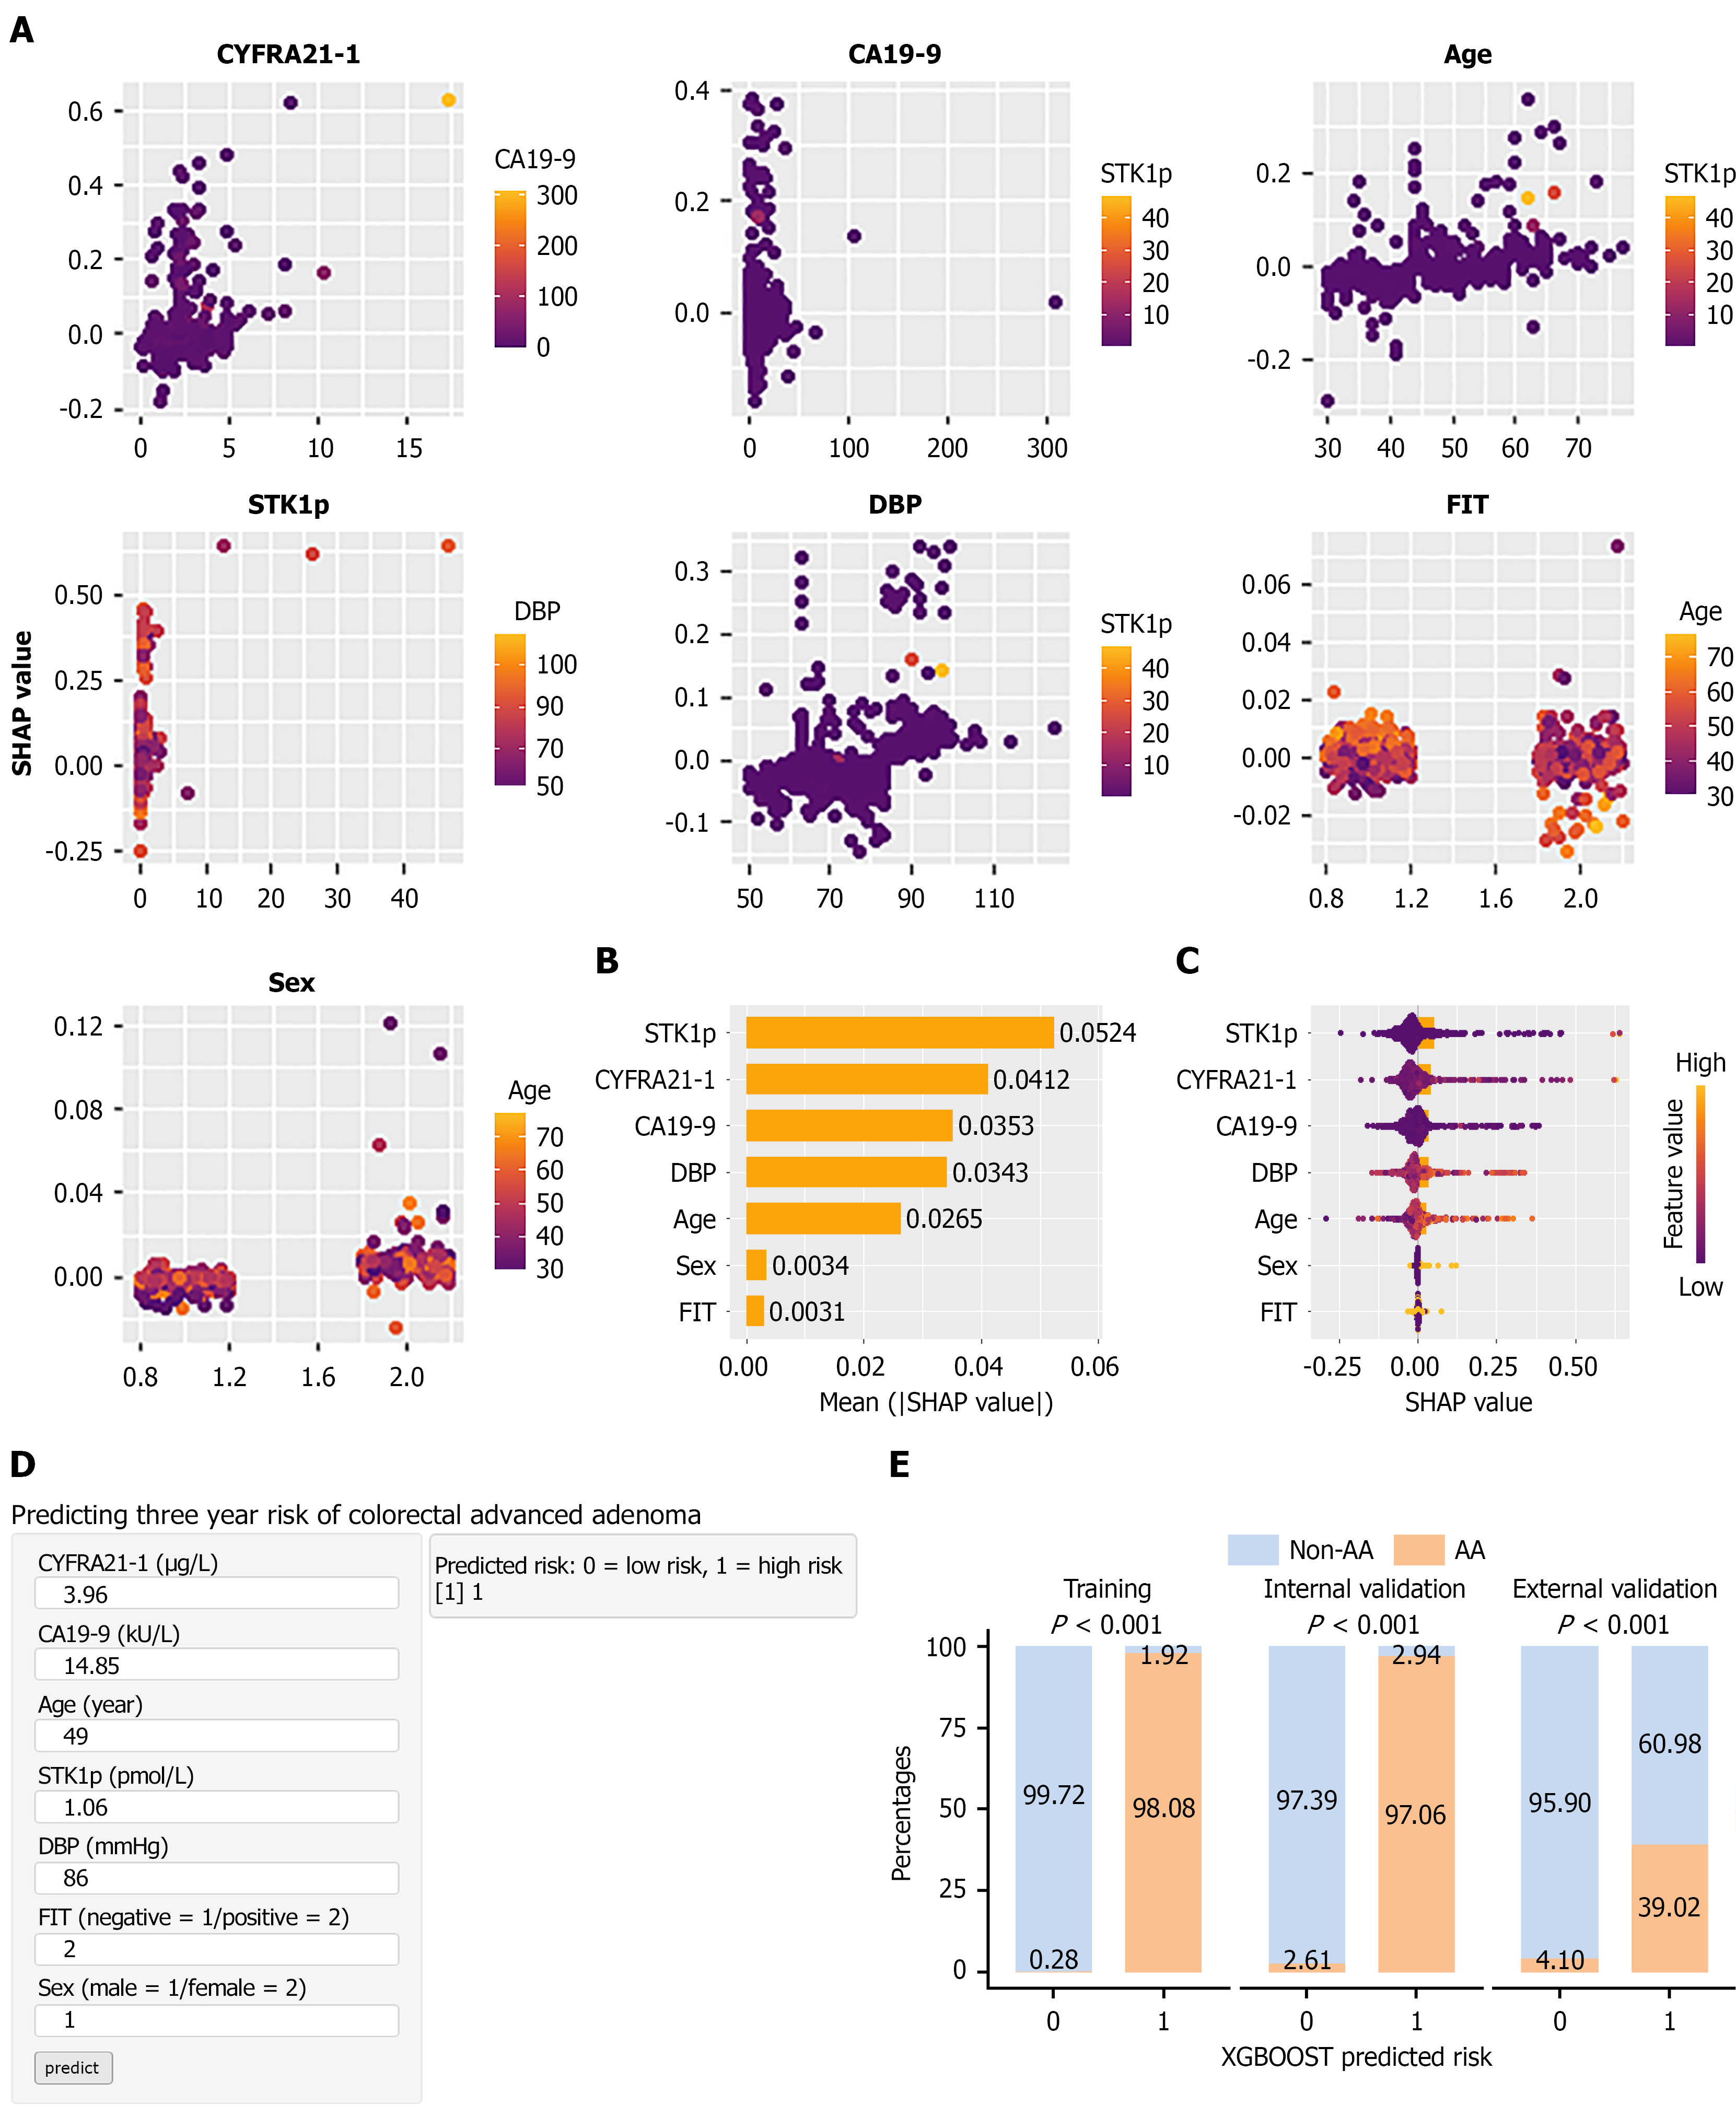
Figure 4 Model interpretation and application.
A: Scatter plots showing the relationship of actual values of included predictors with SHapley Additive exPlanations (SHAP) values and a second predictor with the strongest correlation; B: Feature importance ranked by mean absolute SHAP values; C: SHAP beeswarm plots illustrating impact distributions of included predictors; D: Online EXtreme Gradient Boosting prediction tool accessible at https://precrc.shinyapps.io/precrc/. A predicted probability ≥ 50% and < 50% is coded as 1 and 0, respectively; E: Percentage of incident advanced adenoma in EXtreme Gradient Boosting predicted high-risk and low-risk groups (0 = low risk, 1 = high risk). CA19-9: Carbohydrate antigen 19-9; CYFRA21-1: Cytokeratin 19 fragment; DBP: Diastolic blood pressure; FIT: Fecal immunochemical test; SHAP: SHapley Additive exPlanations; STK1p: Serum thymidine kinase 1 protein; XGBOOST: EXtreme Gradient Boosting.
- Citation: Huang XY, Zhao L, He H, Peng R, Xue H, Lai SM, Wu WX, Qiu XX, Cai XH, He JH, Qin WJ, Zhou WT, Wu WQ, Lin YP. Predicting three-year risk of incident colorectal precancerous conditions using non-invasive predictors and machine-learning algorithms: A multi-center retrospective study. World J Gastroenterol 2026; 32(46): 121223
- URL: https://www.wjgnet.com/1007-9327/full/v32/i46/121223.htm
- DOI: https://dx.doi.org/10.3748/wjg.121223