
















Copyright: ©Author(s) 2026.
World J Gastroenterol. Nov 21, 2026; 32(43): 122243
Published online Nov 21, 2026. doi: 10.3748/wjg.122243
Published online Nov 21, 2026. doi: 10.3748/wjg.122243
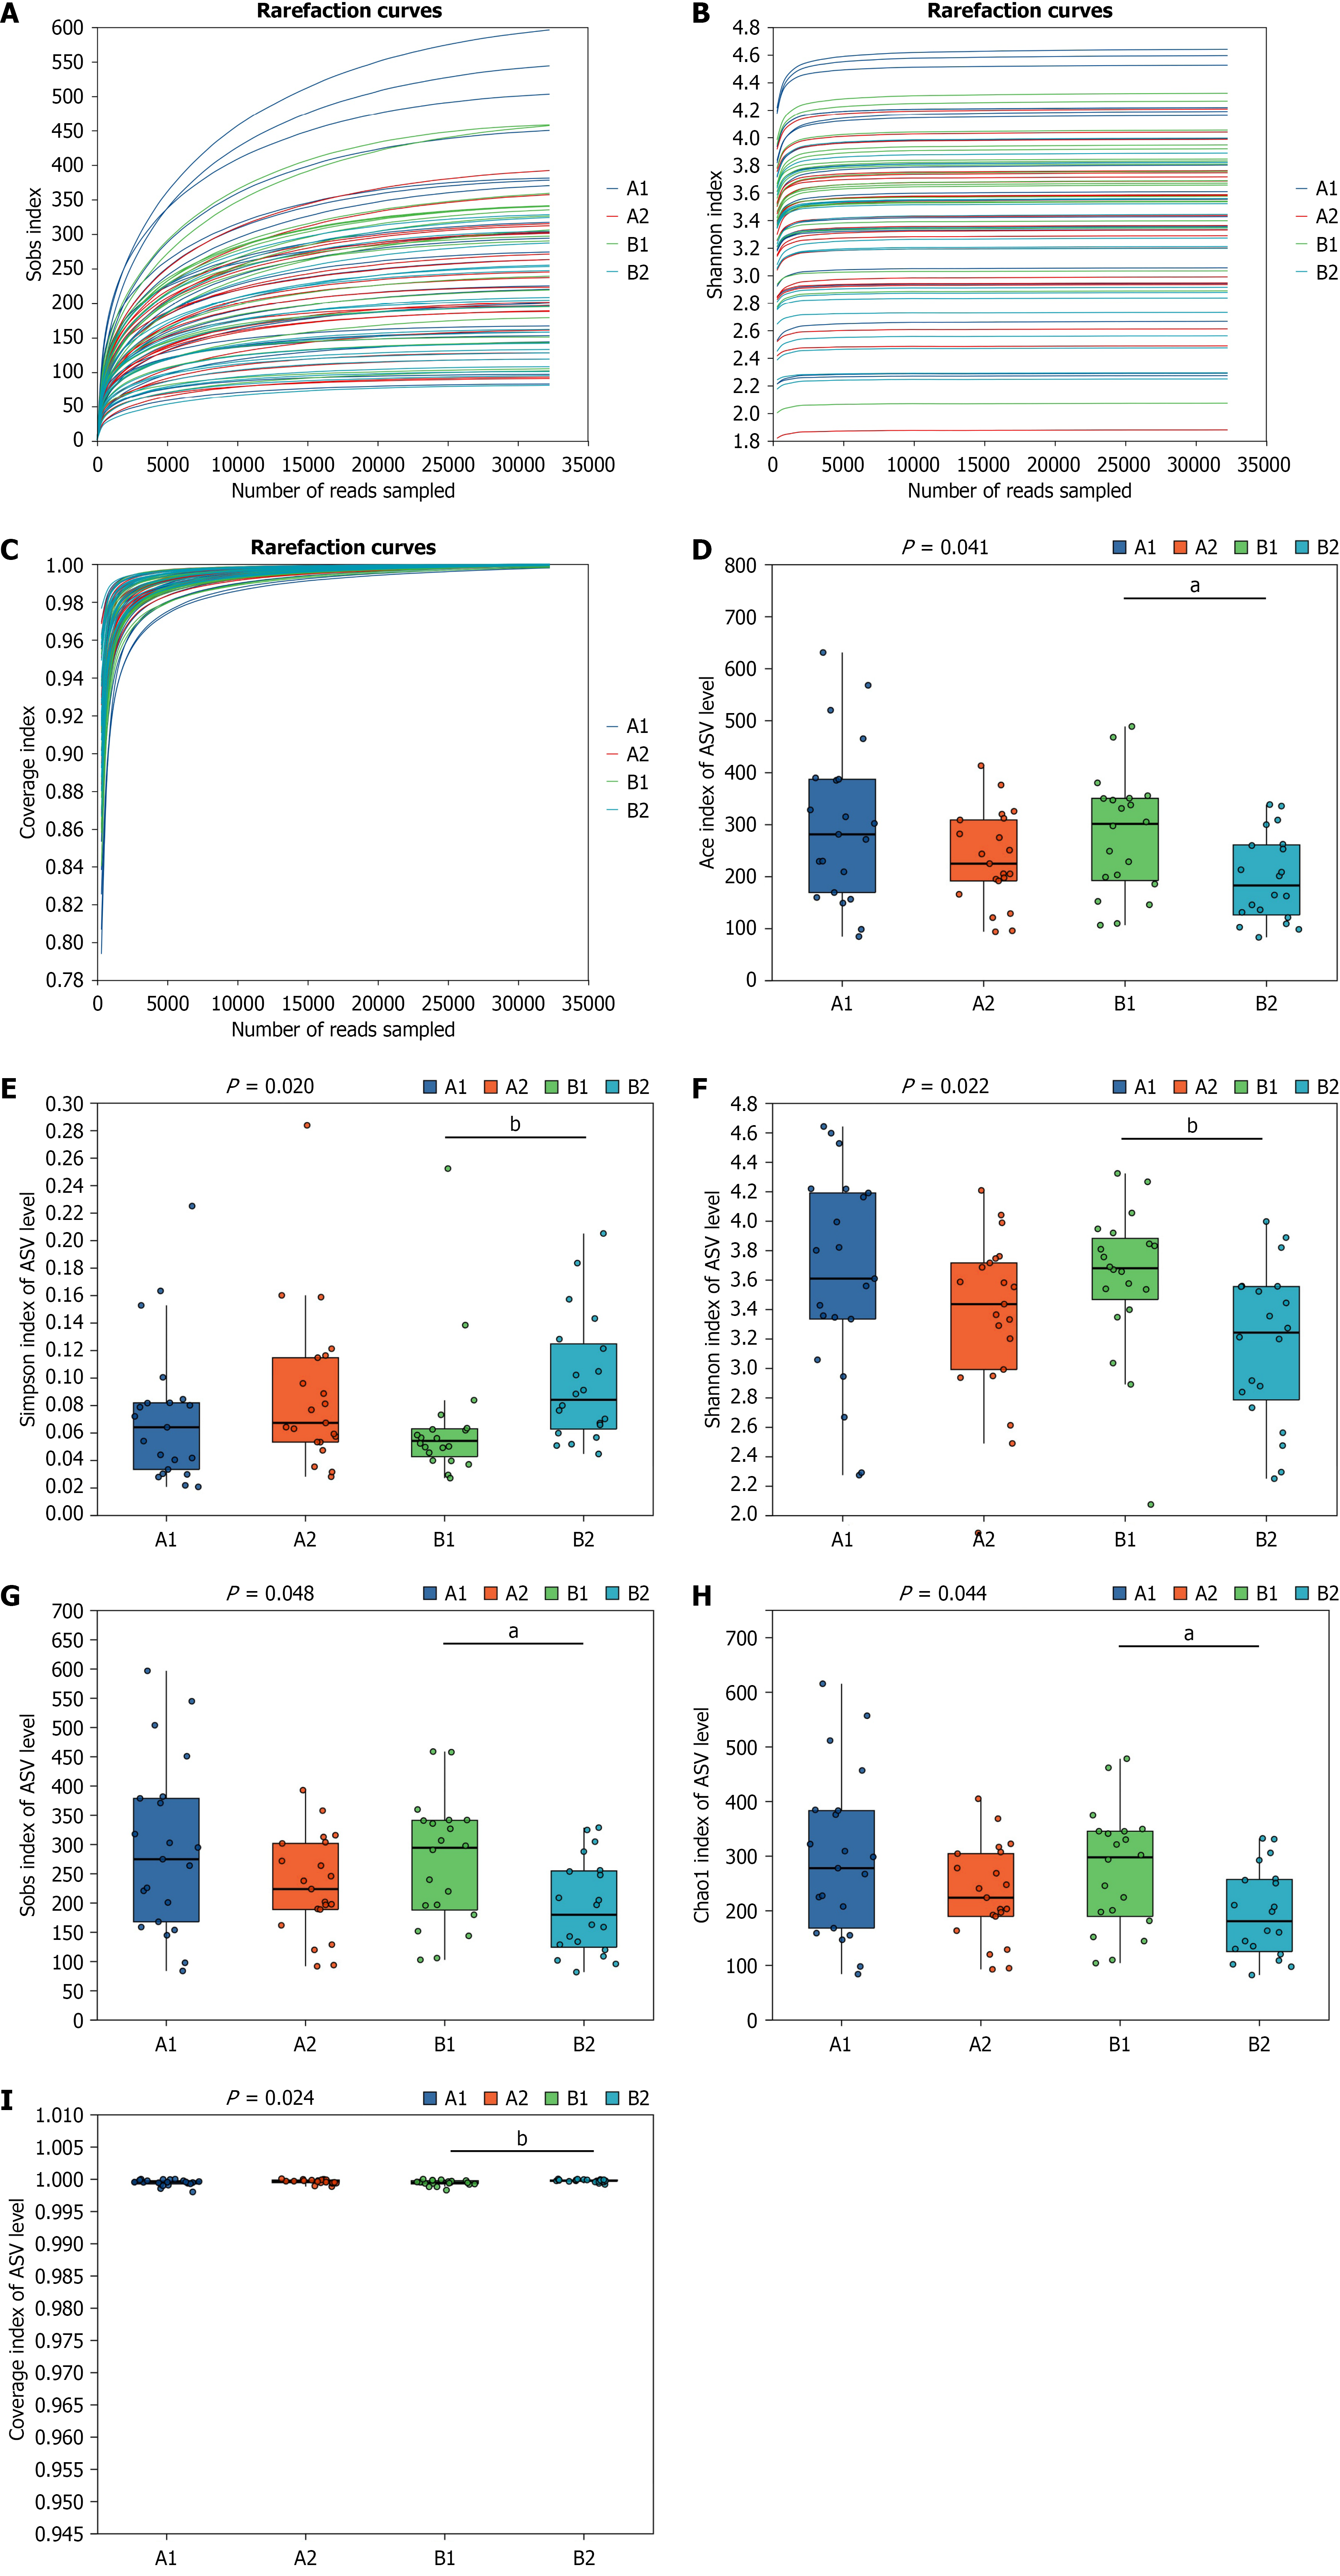
Figure 1 Rarefaction curves and comparison of alpha diversity indices of intestinal microbiota.
A: Rarefaction curves based on observed species (Sobs), X-axis: Randomly sampled sequencing data volume. Y-axis: Observed species number or diversity index; B: Rarefaction curves based on Shannon index, X-axis: Randomly sampled sequencing data volume. Y-axis: Observed species number or diversity index; C: Coverage index curves, X-axis: Randomly sampled sequencing data volume. Y-axis: Observed species number or diversity index; D-I: Comparisons of alpha diversity indices including ACE, Simpson, Shannon, Sobs, Chao1, and coverage among groups. Groups with significant differences are labeled as follows: 0.01 < aP < 0.05. bP ≤ 0.01. The X-axis represents group names, and the Y-axis represents the index value of each group. Group A (berberine group): A1, before treatment; A2, after treatment. Group B (clarithromycin group): B1, before treatment; B2, after treatment. ASV: Amplicon sequence variant.
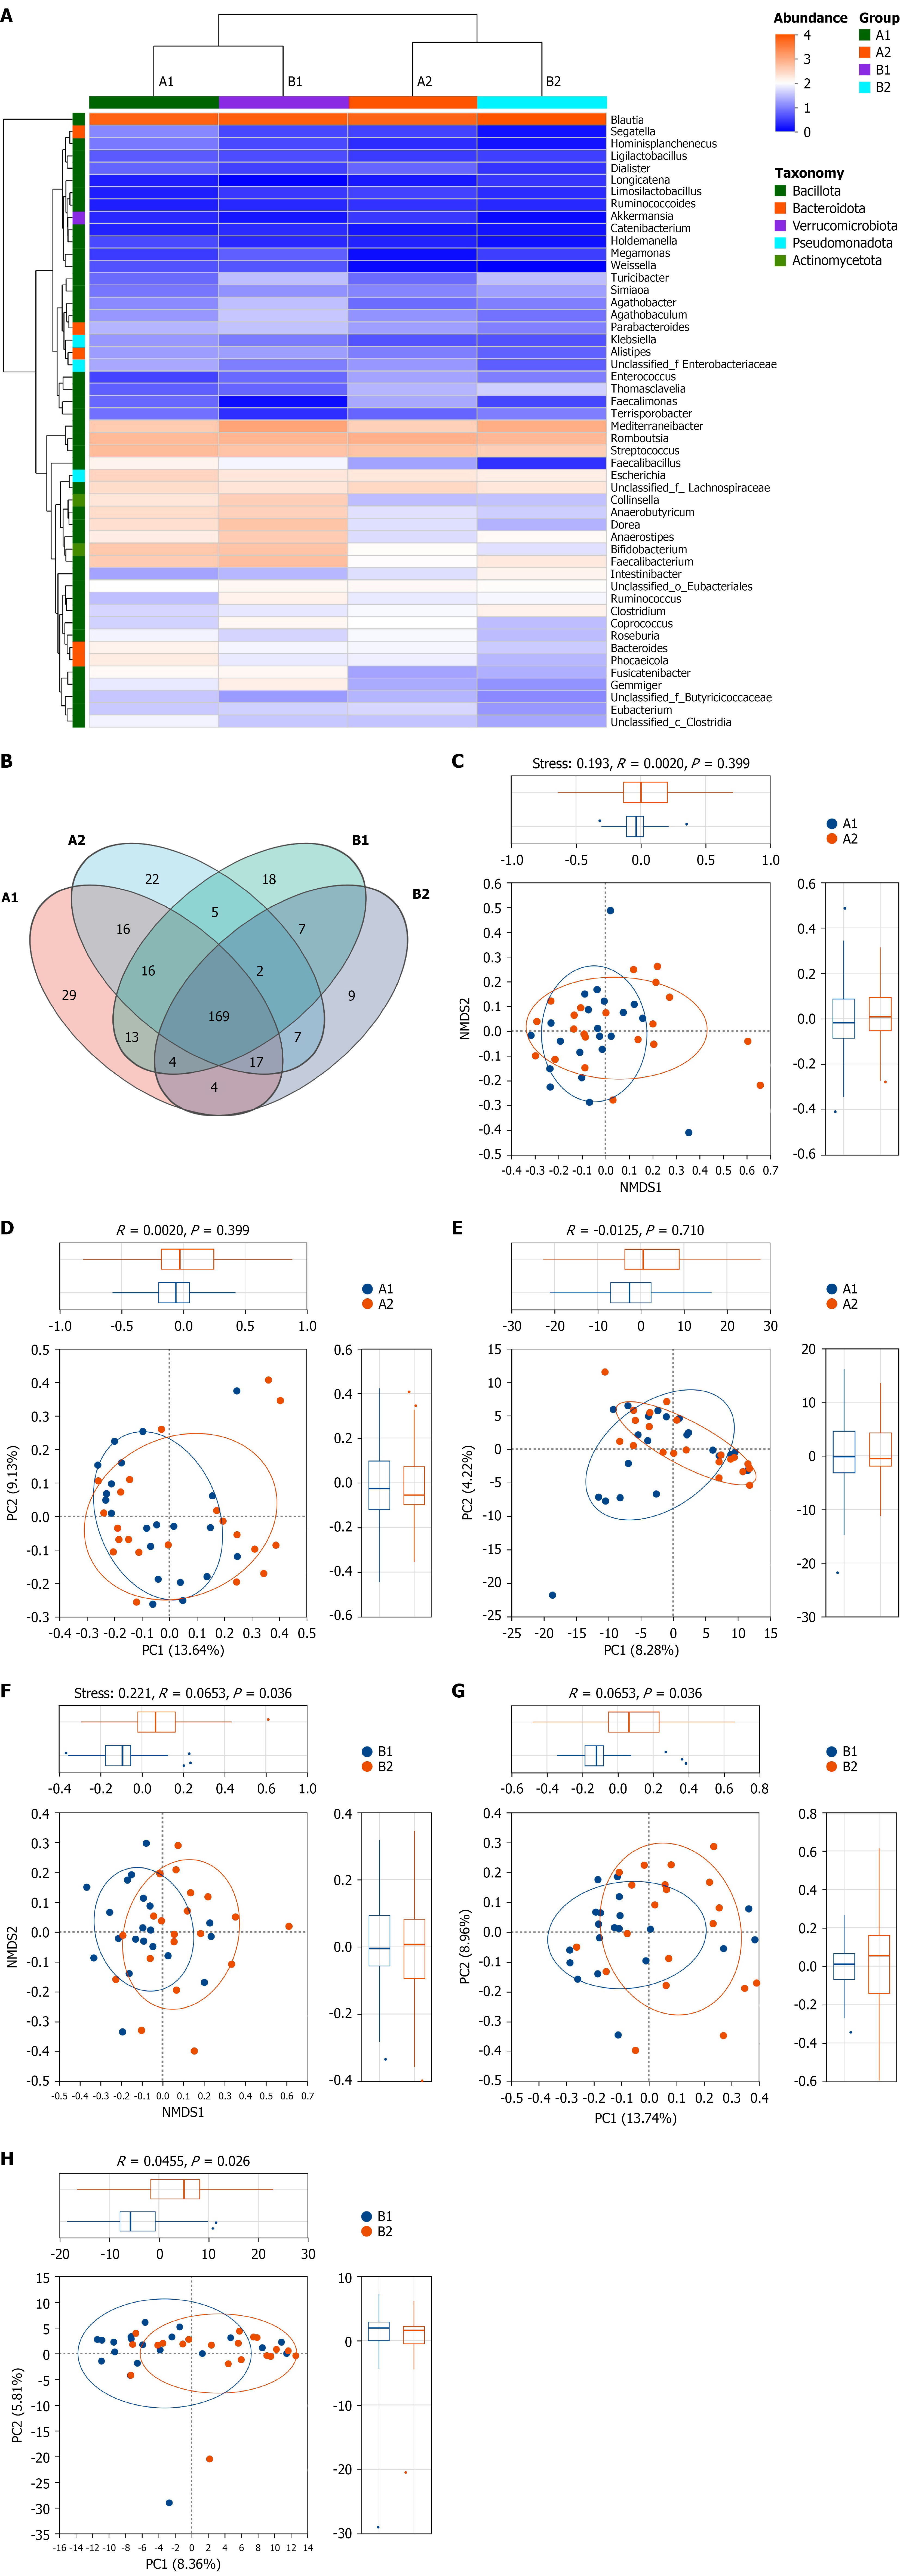
Figure 2 Beta diversity analysis of intestinal microbiota in berberine group and clarithromycin group before and after treatment.
A: Heatmap of microbial community composition at the genus level. The X-axis represents sample names, and the Y-axis represents species names. A color gradient is used to indicate the relative proportion of each species, with the corresponding values shown on the right side of the figure; B: Venn map at the genus level. Different colors represent different groups. The overlapping regions indicate species shared by multiple groups, while the non-overlapping regions represent unique species specific to that group. The numbers indicate the corresponding number of species; C-E: Non-metric multidimensional scaling (NMDS), principal co-ordinates analysis (PCoA), and principal components analysis (PCA) plots based on amplicon sequence variant (ASV) level of berberine group; F-H: NMDS, PCoA, and PCA plots based on ASV level of clarithromycin group. The horizontal and vertical axes represent the two selected principal coordinate components, and the percentages indicate the contribution of each principal coordinate component to the differences in sample composition. The scales of the horizontal and vertical axes are relative distances and have no actual physical meaning. Points of different colors or shapes represent samples from different groups. The closer two sample points are, the more similar their species composition. Group A (berberine group): A1, before treatment; A2, after treatment. Group B (clarithromycin group): B1, before treatment; B2, after treatment. NMDS: Non-metric multidimensional scaling; PC: Principal component.
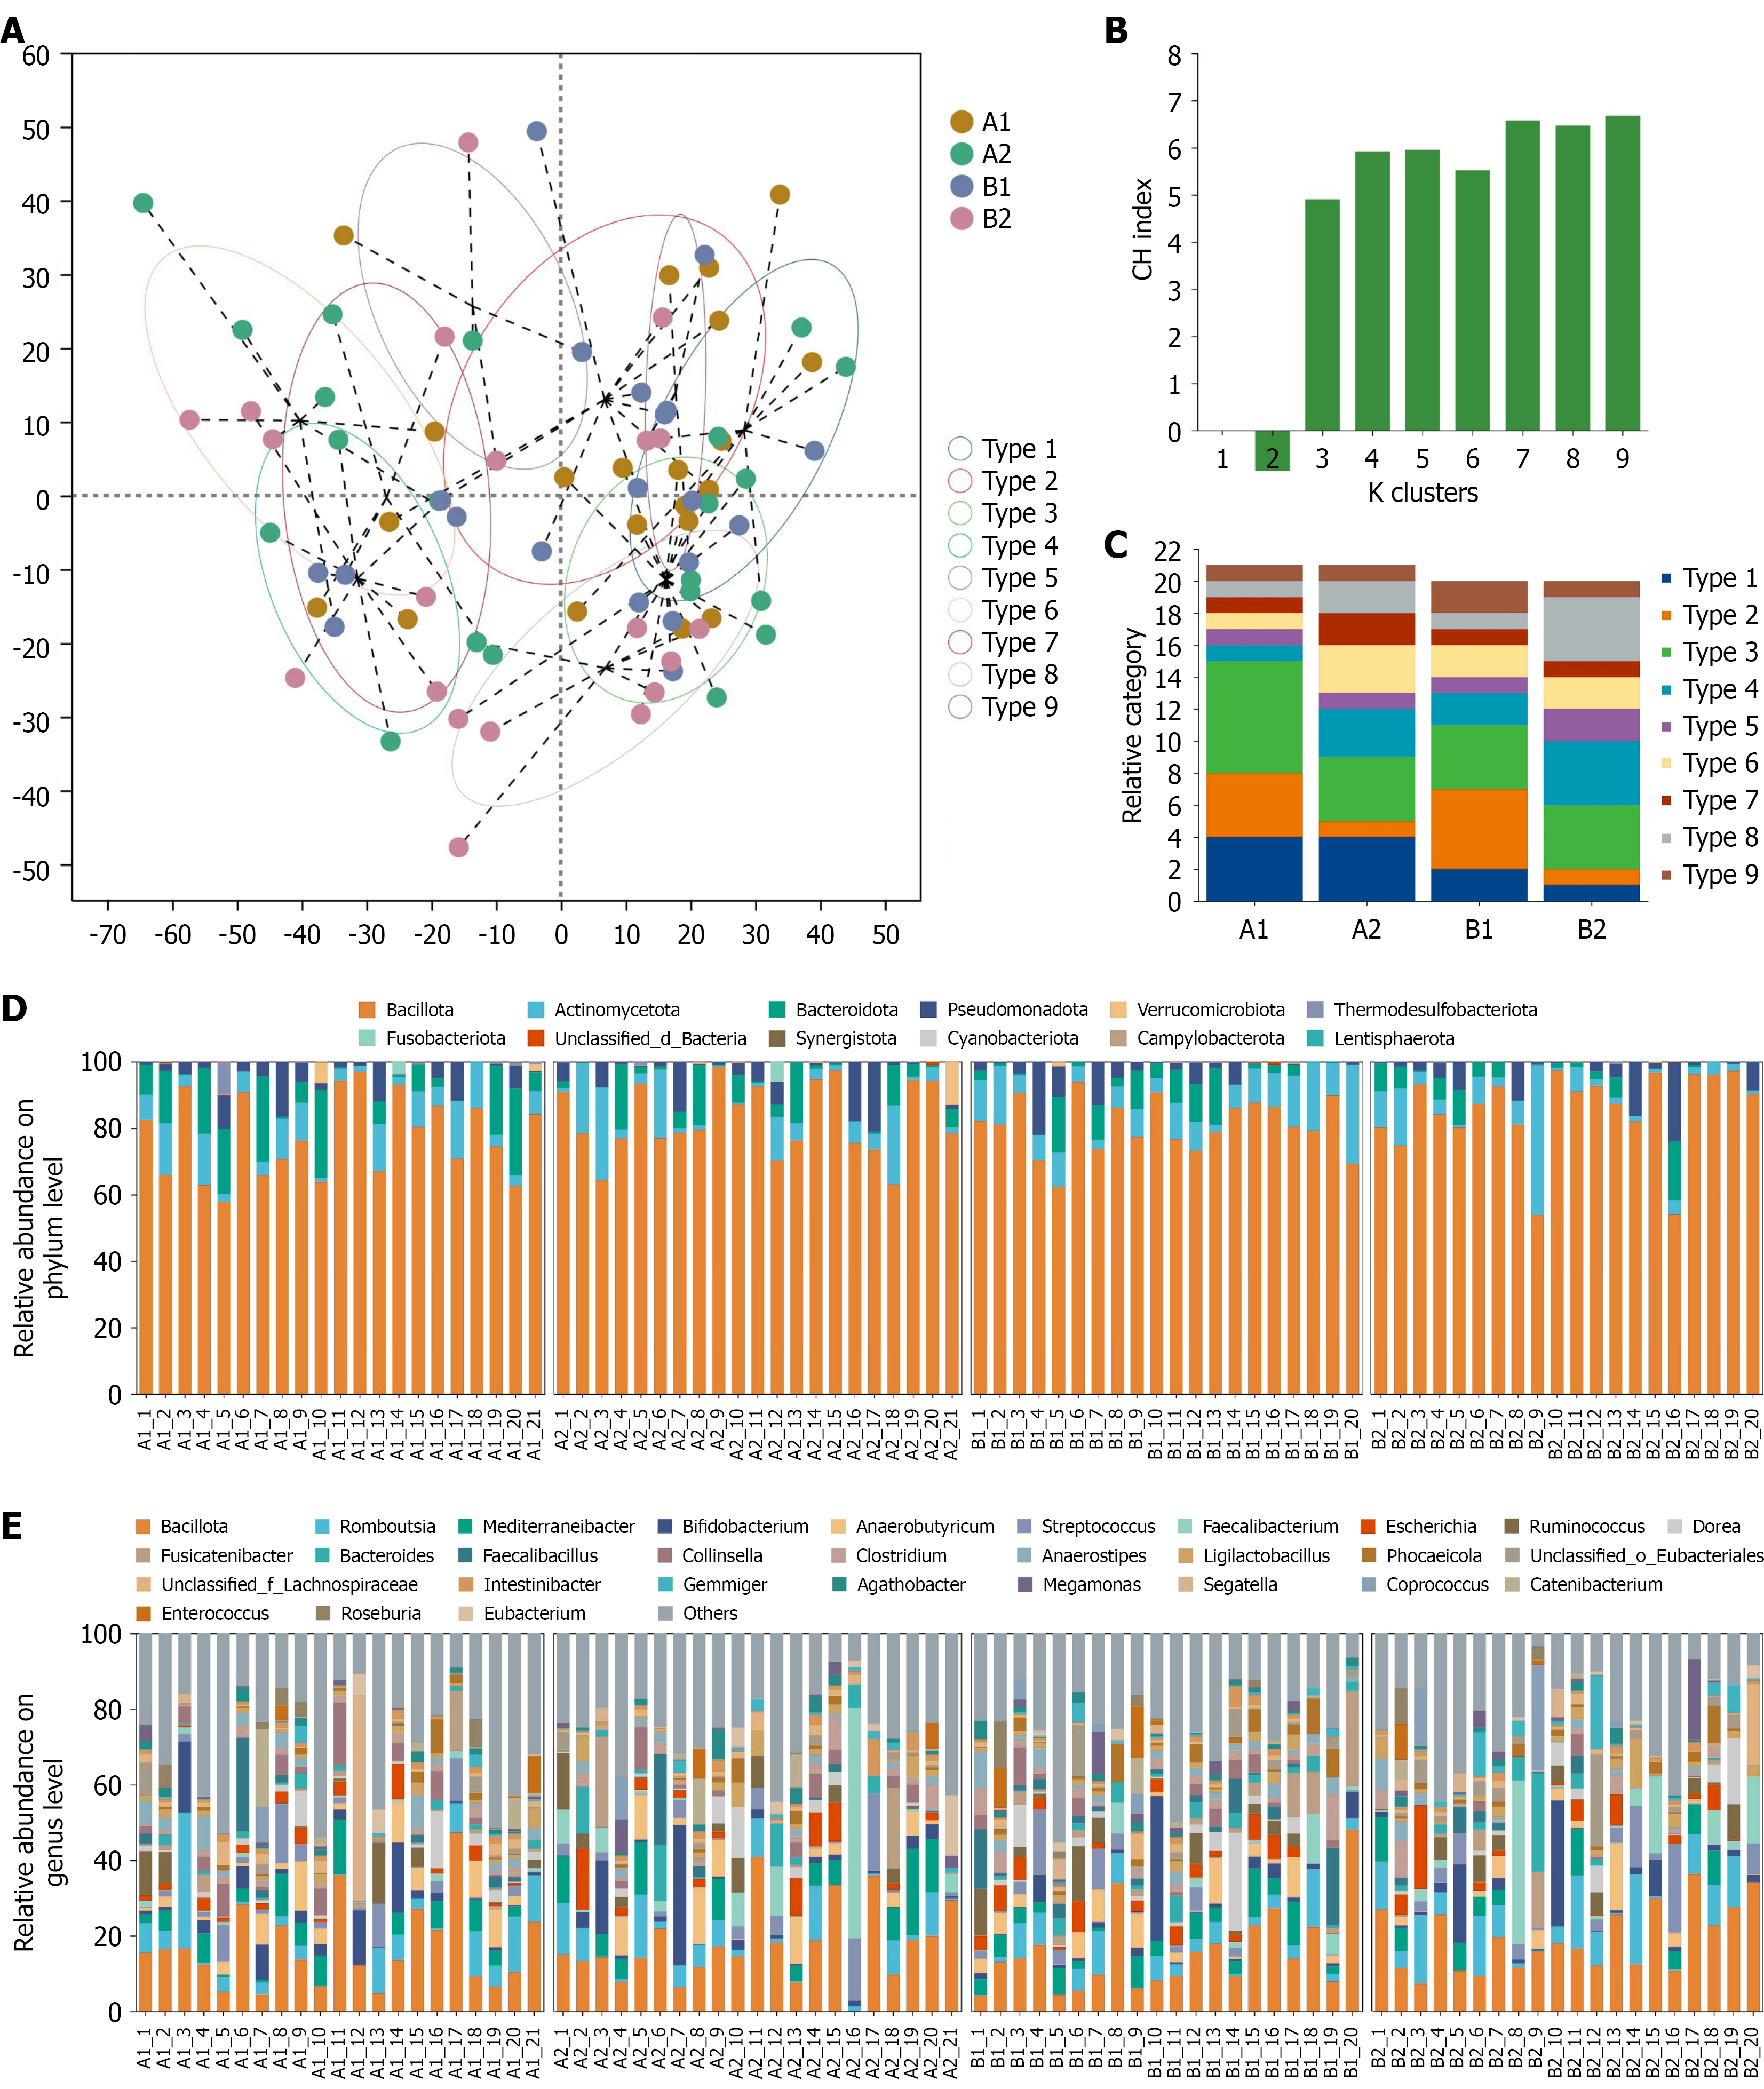
Figure 3 Composition and enterotype analysis of intestinal microbiota based on Jensen-Shannon divergence.
A: Enterotype distribution in each group. Enterotype of specific clinical samples is reflected by the structure of the dominant flora in each sample. The top right corner indicates the sample groups; different colors represent different types; the circles represent the range within the confidence interval; B: Optimal cluster number for enterotype classification selected by Calinski-Harabasz (CH) index values. The X-axis represents the number of clusters (k value), and the Y-axis denotes the magnitude of the CH index; C: Relative abundances of signature genera for each enterotype. The percentage bar chart shows the proportion of different types in each group of samples. The bar plot presents the typing composition of samples in each group, with different colors representing different types; D and E: Microbial composition at the phylum level and genus level. This figure shows the composition and proportion of the top abundant phylum/genus in all samples, with other low-abundance phylum/genus classified as others. It mainly illustrates the changes in dominant species composition across different samples/groups. The X-axis/Y-axis represents sample names, and the Y-axis/X-axis represents the relative proportion of each species in the sample. Bars of different colors represent different species, and the length of the bar indicates the relative proportion of the species. Group A (berberine group): A1, before treatment; A2, after treatment. Group B (clarithromycin group): B1, before treatment; B2, after treatment. CH: Calinski-Harabasz; BBR: Berberine; CLA: Clarithromycin.
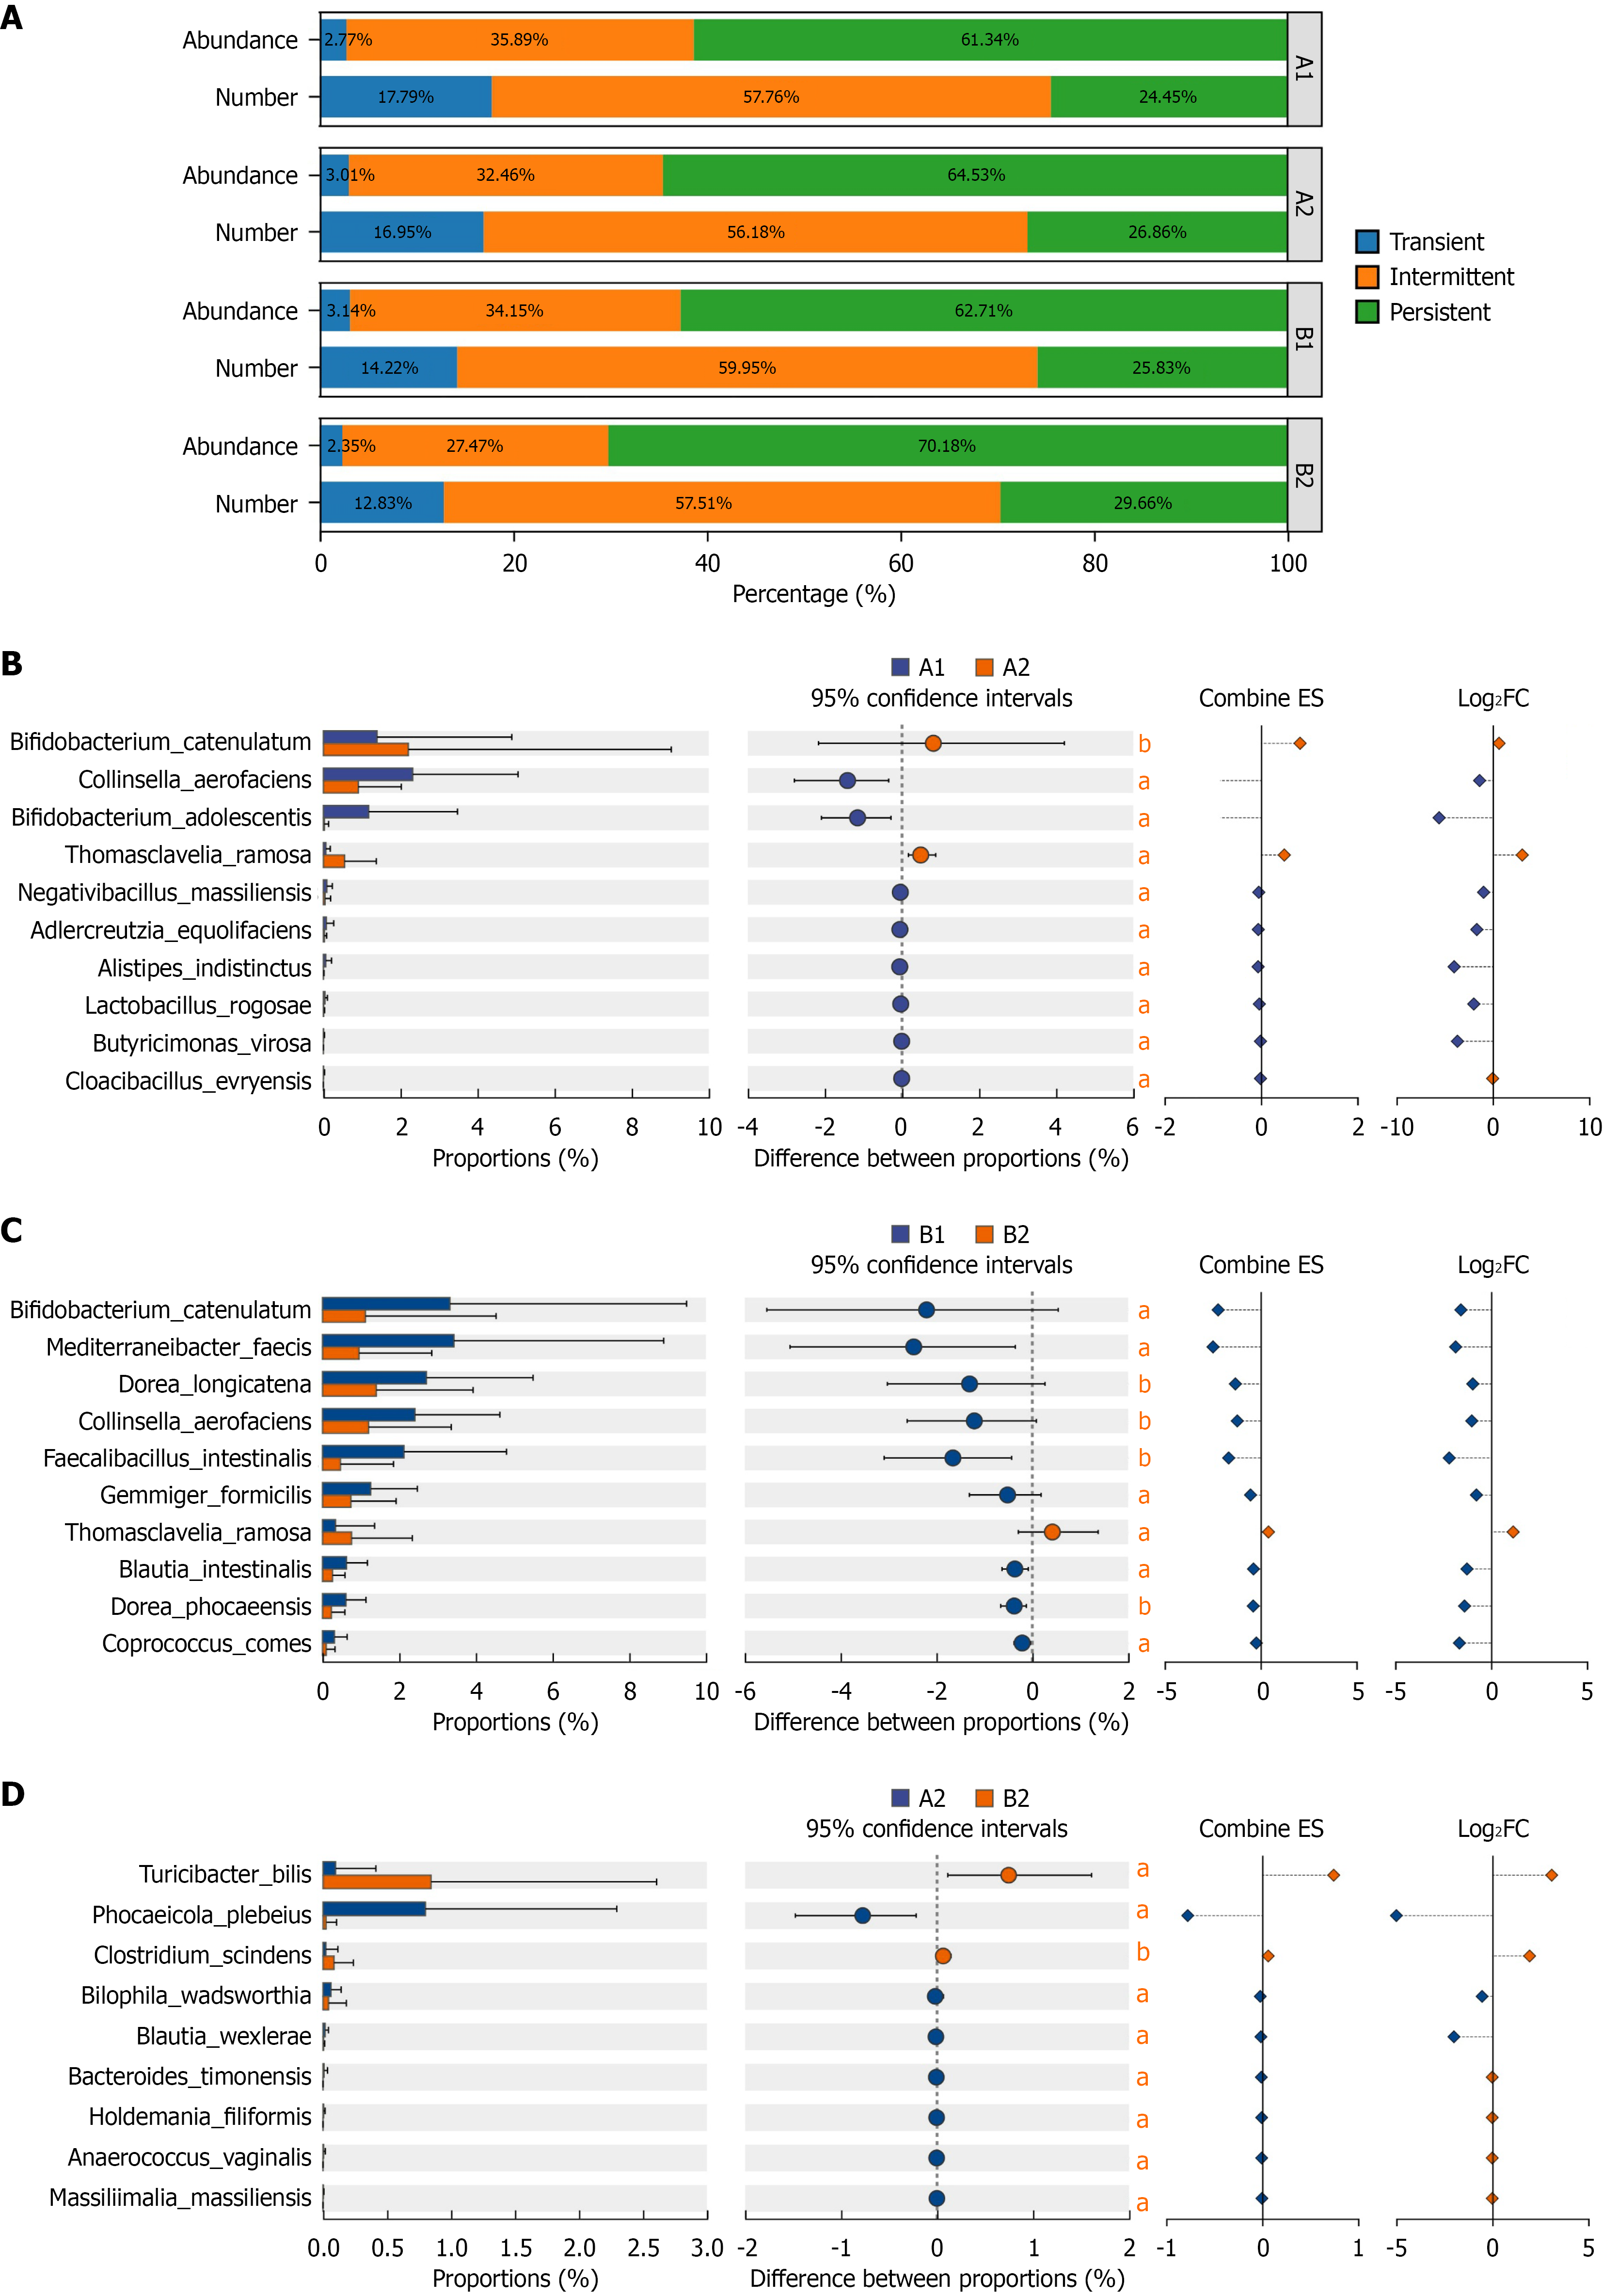
Figure 4 Species typing based on detection rate and differential species analysis of intestinal microbiota.
A: Microorganisms are classified according to environmental sensitivity and categorized into transient, intermediate, and persistent taxa based on their prevalence. This figure shows the proportion of average relative abundance and the proportion of detected number of transient, intermediate, and persistent species in the samples. The X-axis/Y-axis represents percentage, corresponding to average relative abundance or detected number; B-D: The differences in the average relative abundance of the same species among different groups, with annotations indicating the significance of differences, directly presenting the variation in average relative abundance of the same species across groups. The X-axis represents the species names at different taxonomic levels; the Y-axis represents the percentage value of the abundance of a given species in the sample; different colors represent different groups. The P value is shown on the far right. 0.01 < aP < 0.05. bP ≤ 0.01. Group A (berberine group): A1, before treatment; A2, after treatment. Group B (clarithromycin group): B1, before treatment; B2, after treatment. ES: Effect size; FC: Fold change.
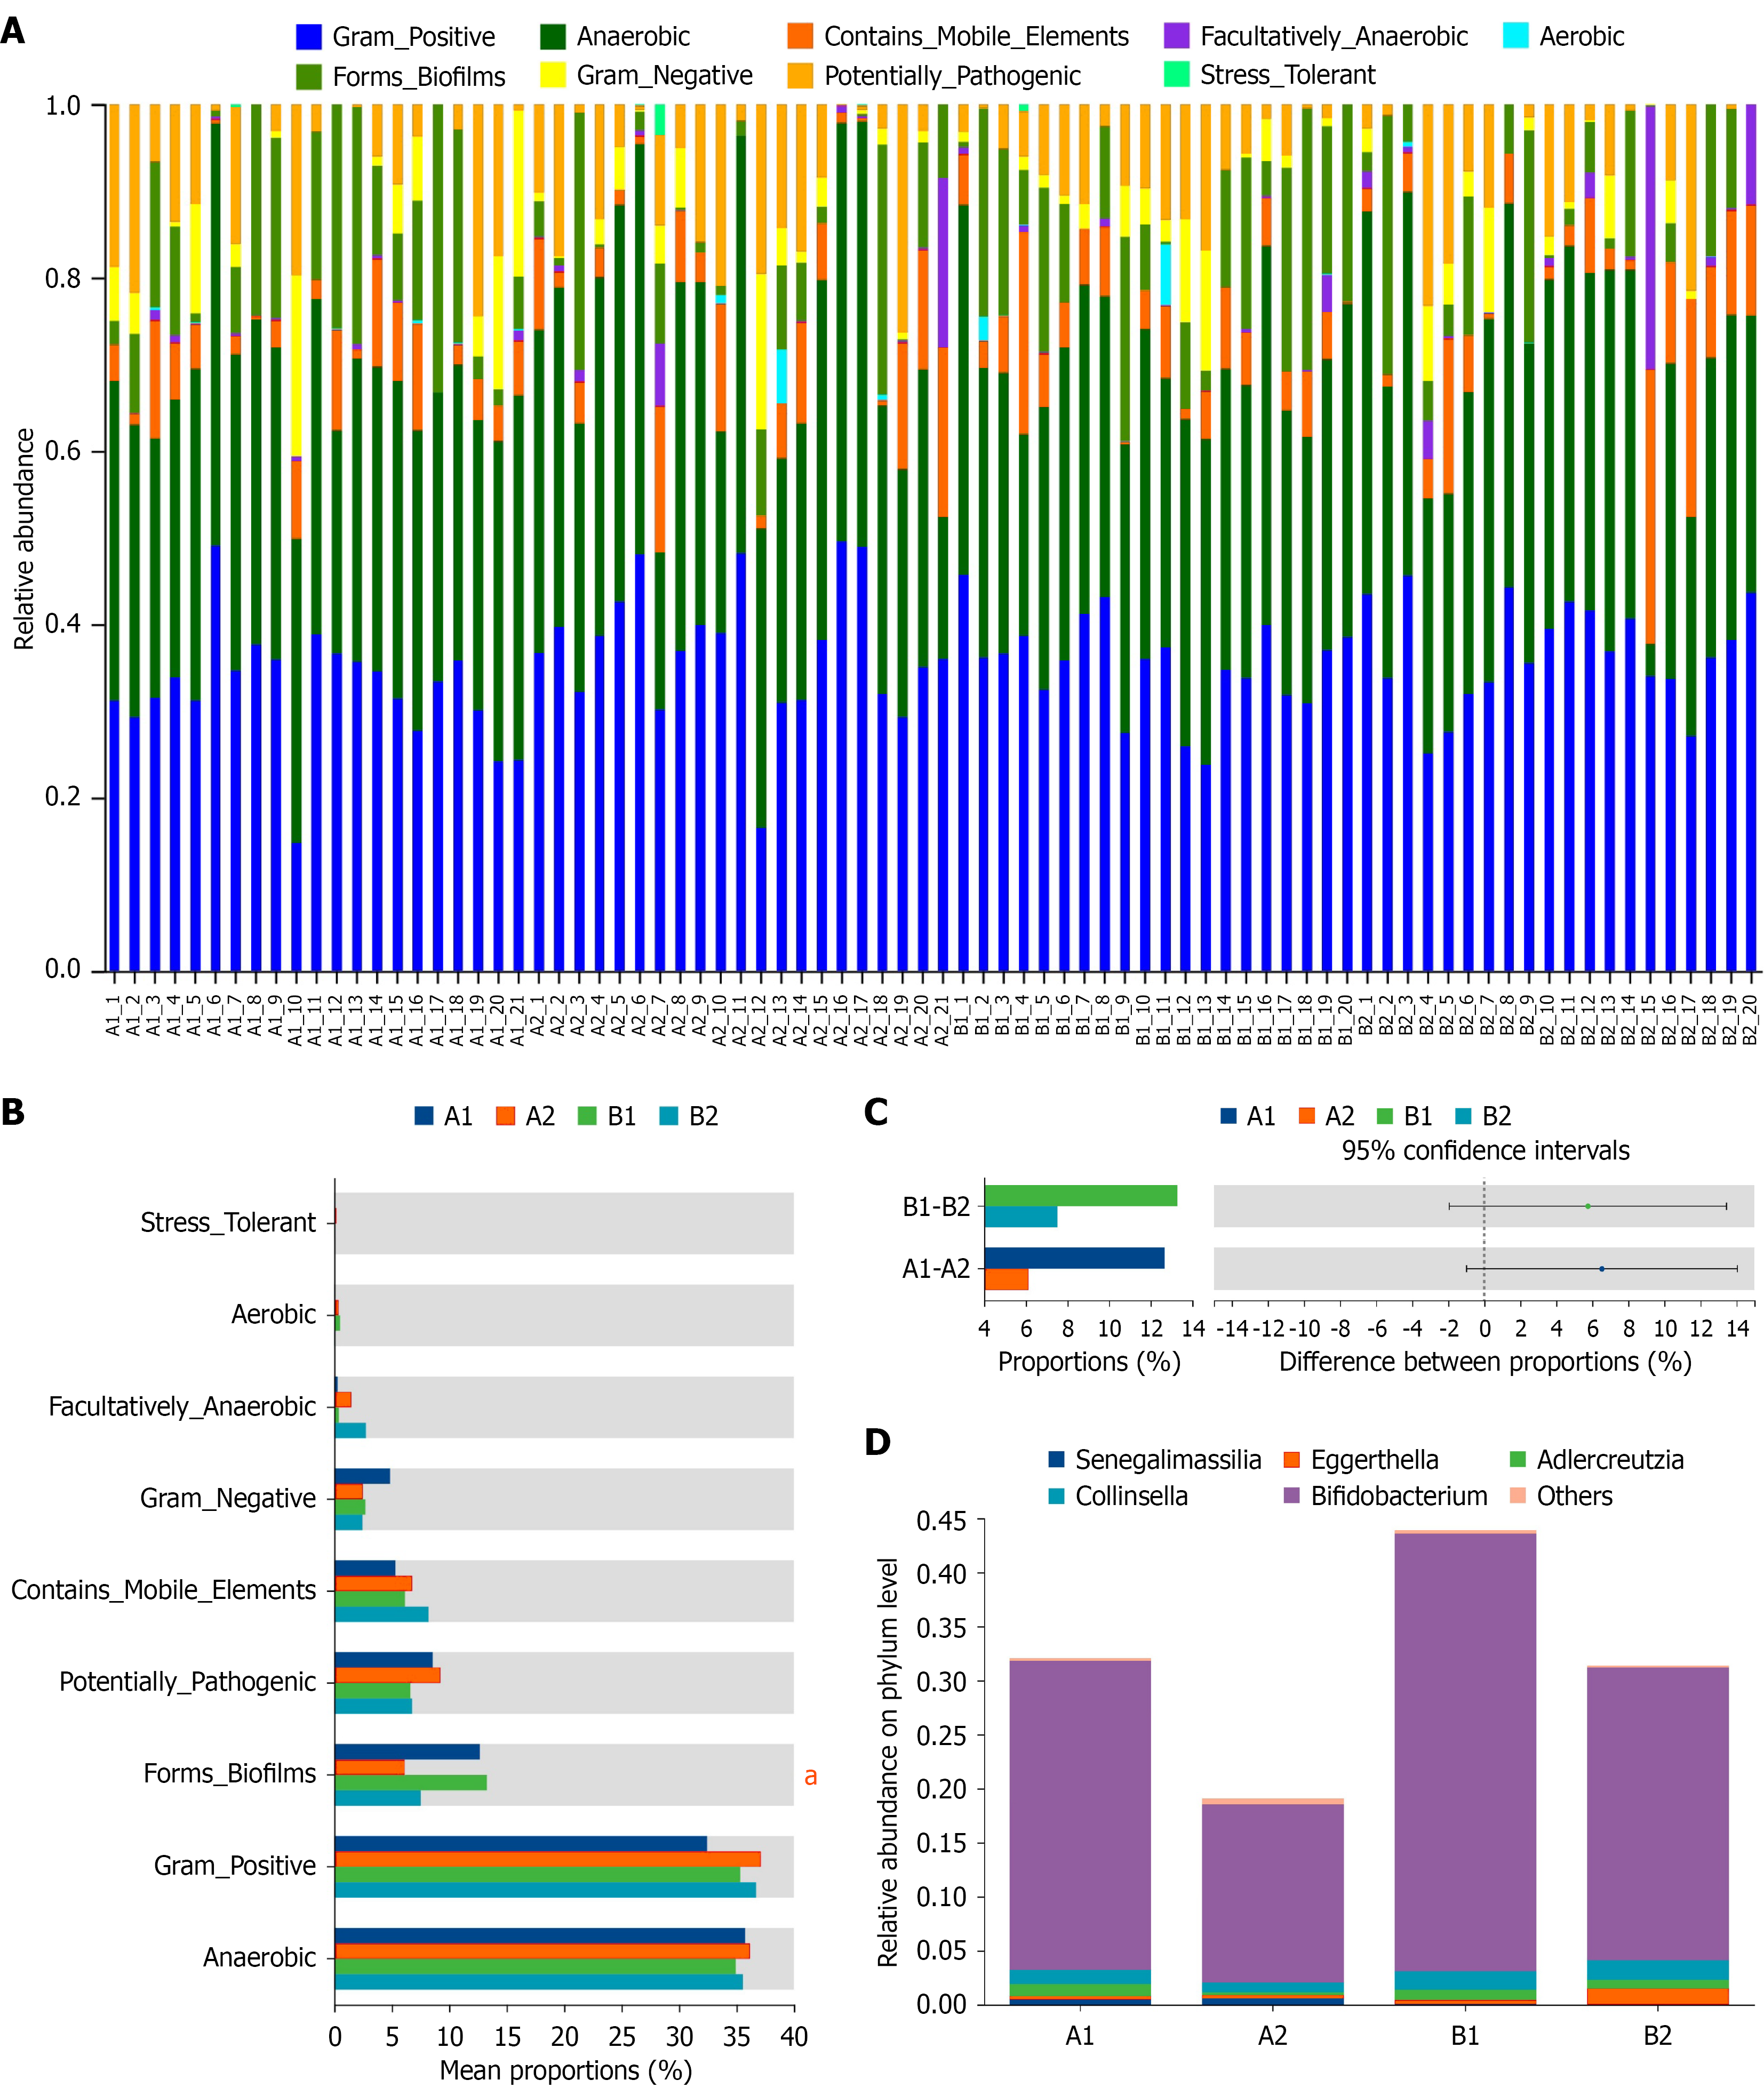
Figure 5 Phenotypic prediction of intestinal microbiota.
A: Variations in composition of phenotypes. The X-axis represents sample names, and the Y-axis represents relative abundance. The color gradient of the blocks shows the phenotypic categories; B: Kruskal-Wallis H test on phenotype. The X-axis represents the phenotypic categories, and the Y-axis shows the percentage value of the relative abundance of each phenotype in the samples. Different colors correspond to different groups. The rightmost column displays P values, aP < 0.05; C: Kruskal-Wallis H test for forms biofilms phenotype. The X-axis represents phenotypic categories, and the Y-axis indicates the percentage of relative abundance for each phenotype in samples. Different colors represent different groups; D: Prediction of species contribution to forms biofilms phenotype. This figure displays the dominant species composition of forms biofilms phenotypes, and reflects the matching relationship between species and forms biofilms phenotypes. The X-axis shows group names, different colors in the legend represent distinct species, the Y-axis represents the relative abundance values of each species under the target phenotype. The top 5 genera are shown. Group A (berberine group): A1, before treatment; A2, after treatment. Group B (clarithromycin group): B1, before treatment; B2, after treatment. BBR: Berberine; CLA: Clarithromycin.
- Citation: Cai TW, Chen ZK, Lv ZY, Jiang WJ, Sun YY, Jin LX, Xia CM, Li QQ, Chen X. Effects of berberine-containing vs clarithromycin-containing quadruple therapy on intestinal microbiota during Helicobacter pylori eradication. World J Gastroenterol 2026; 32(43): 122243
- URL: https://www.wjgnet.com/1007-9327/full/v32/i43/122243.htm
- DOI: https://dx.doi.org/10.3748/wjg.122243