
















Copyright: ©Author(s) 2026.
World J Gastroenterol. Nov 21, 2026; 32(43): 121477
Published online Nov 21, 2026. doi: 10.3748/wjg.121477
Published online Nov 21, 2026. doi: 10.3748/wjg.121477
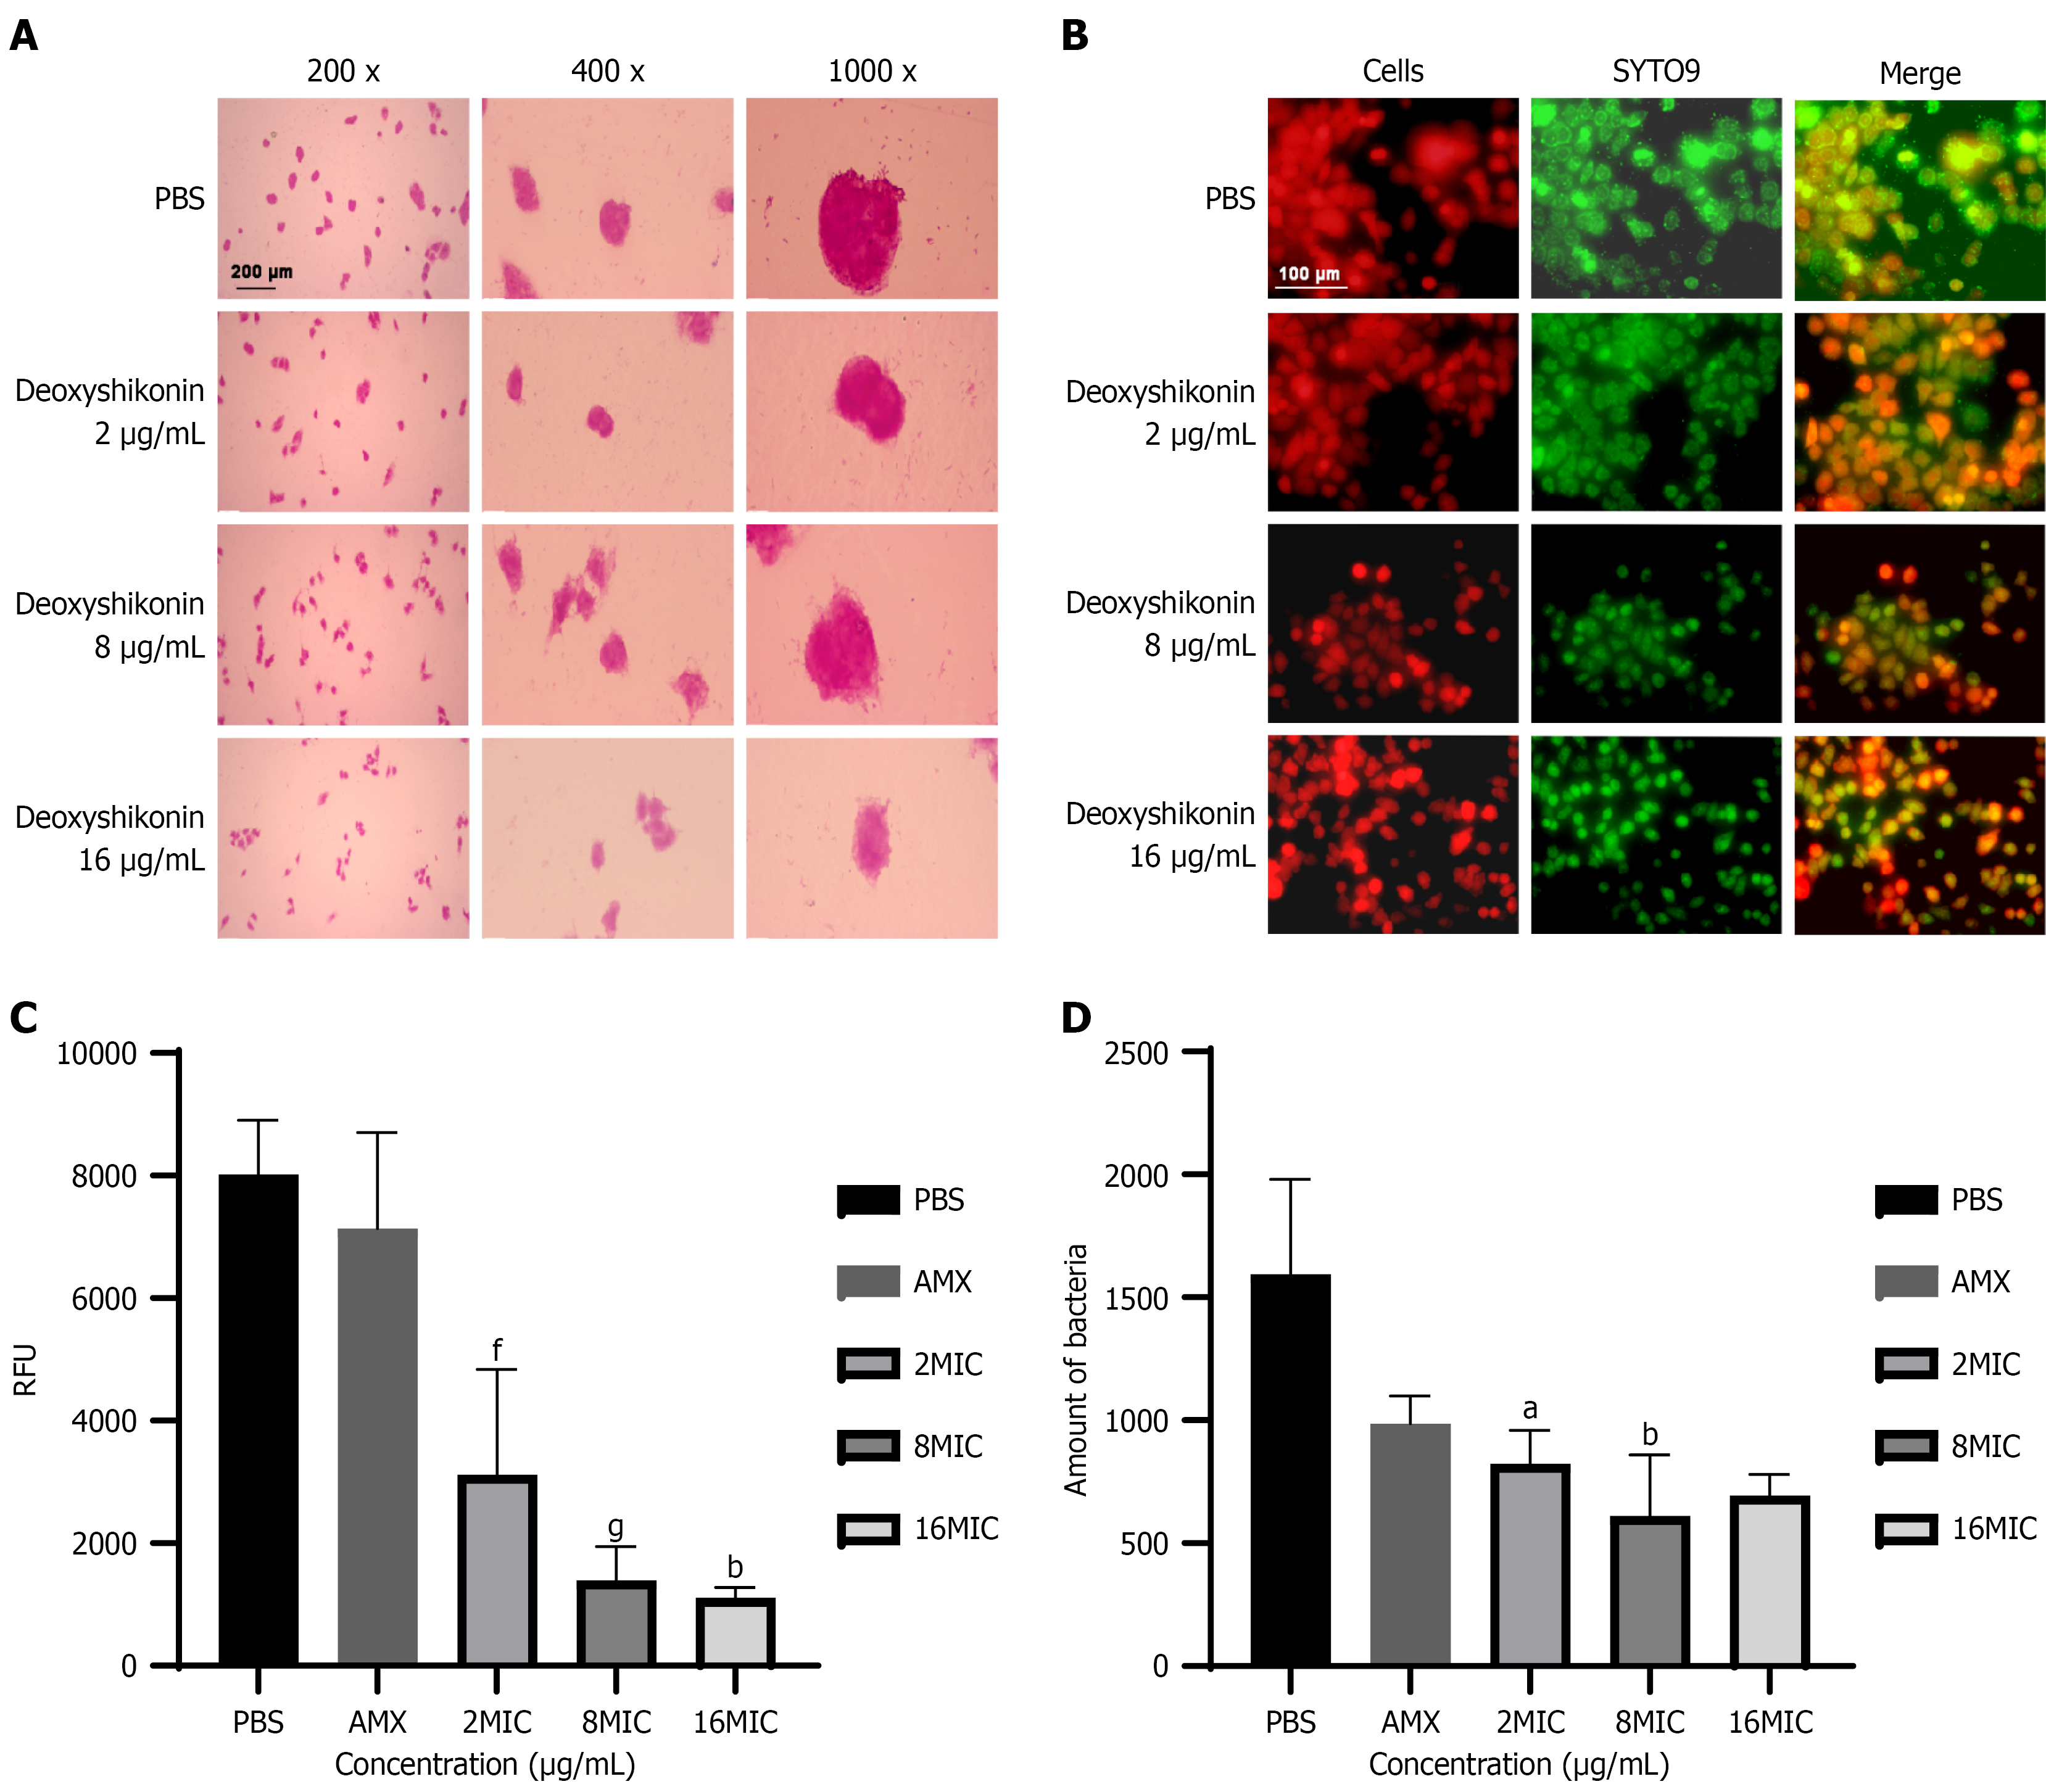
Figure 1 Anti-adhesion activity of deoxyshikonin on Helicobacter pylori.
A: Helicobacter pylori (H. pylori) adhesion to GES-1 cells after deoxyshikonin exposure, assessed by Gram staining; B: Adhesion of extracellular H. pylori to BGC823 cells after deoxyshikonin treatment, assessed by inverted fluorescence microscopy; C: Quantification of cell-associated H. pylori in BGC823 cells after deoxyshikonin exposure, assessed by the Alamar Blue assay; D: Inhibitory effect of deoxyshikonin on cell-associated H. pylori in BGC823 cells, assessed using the dilution plating method. aP < 0.05 vs phosphate-buffered saline, bP < 0.01 vs phosphate-buffered saline, fP < 0.01 vs amoxicillin, and gP < 0.001 vs amoxicillin. PBS: Phosphate-buffered saline; AMX: Amoxicillin; MIC: Minimum inhibitory concentration; RFU: Relative fluorescence units.
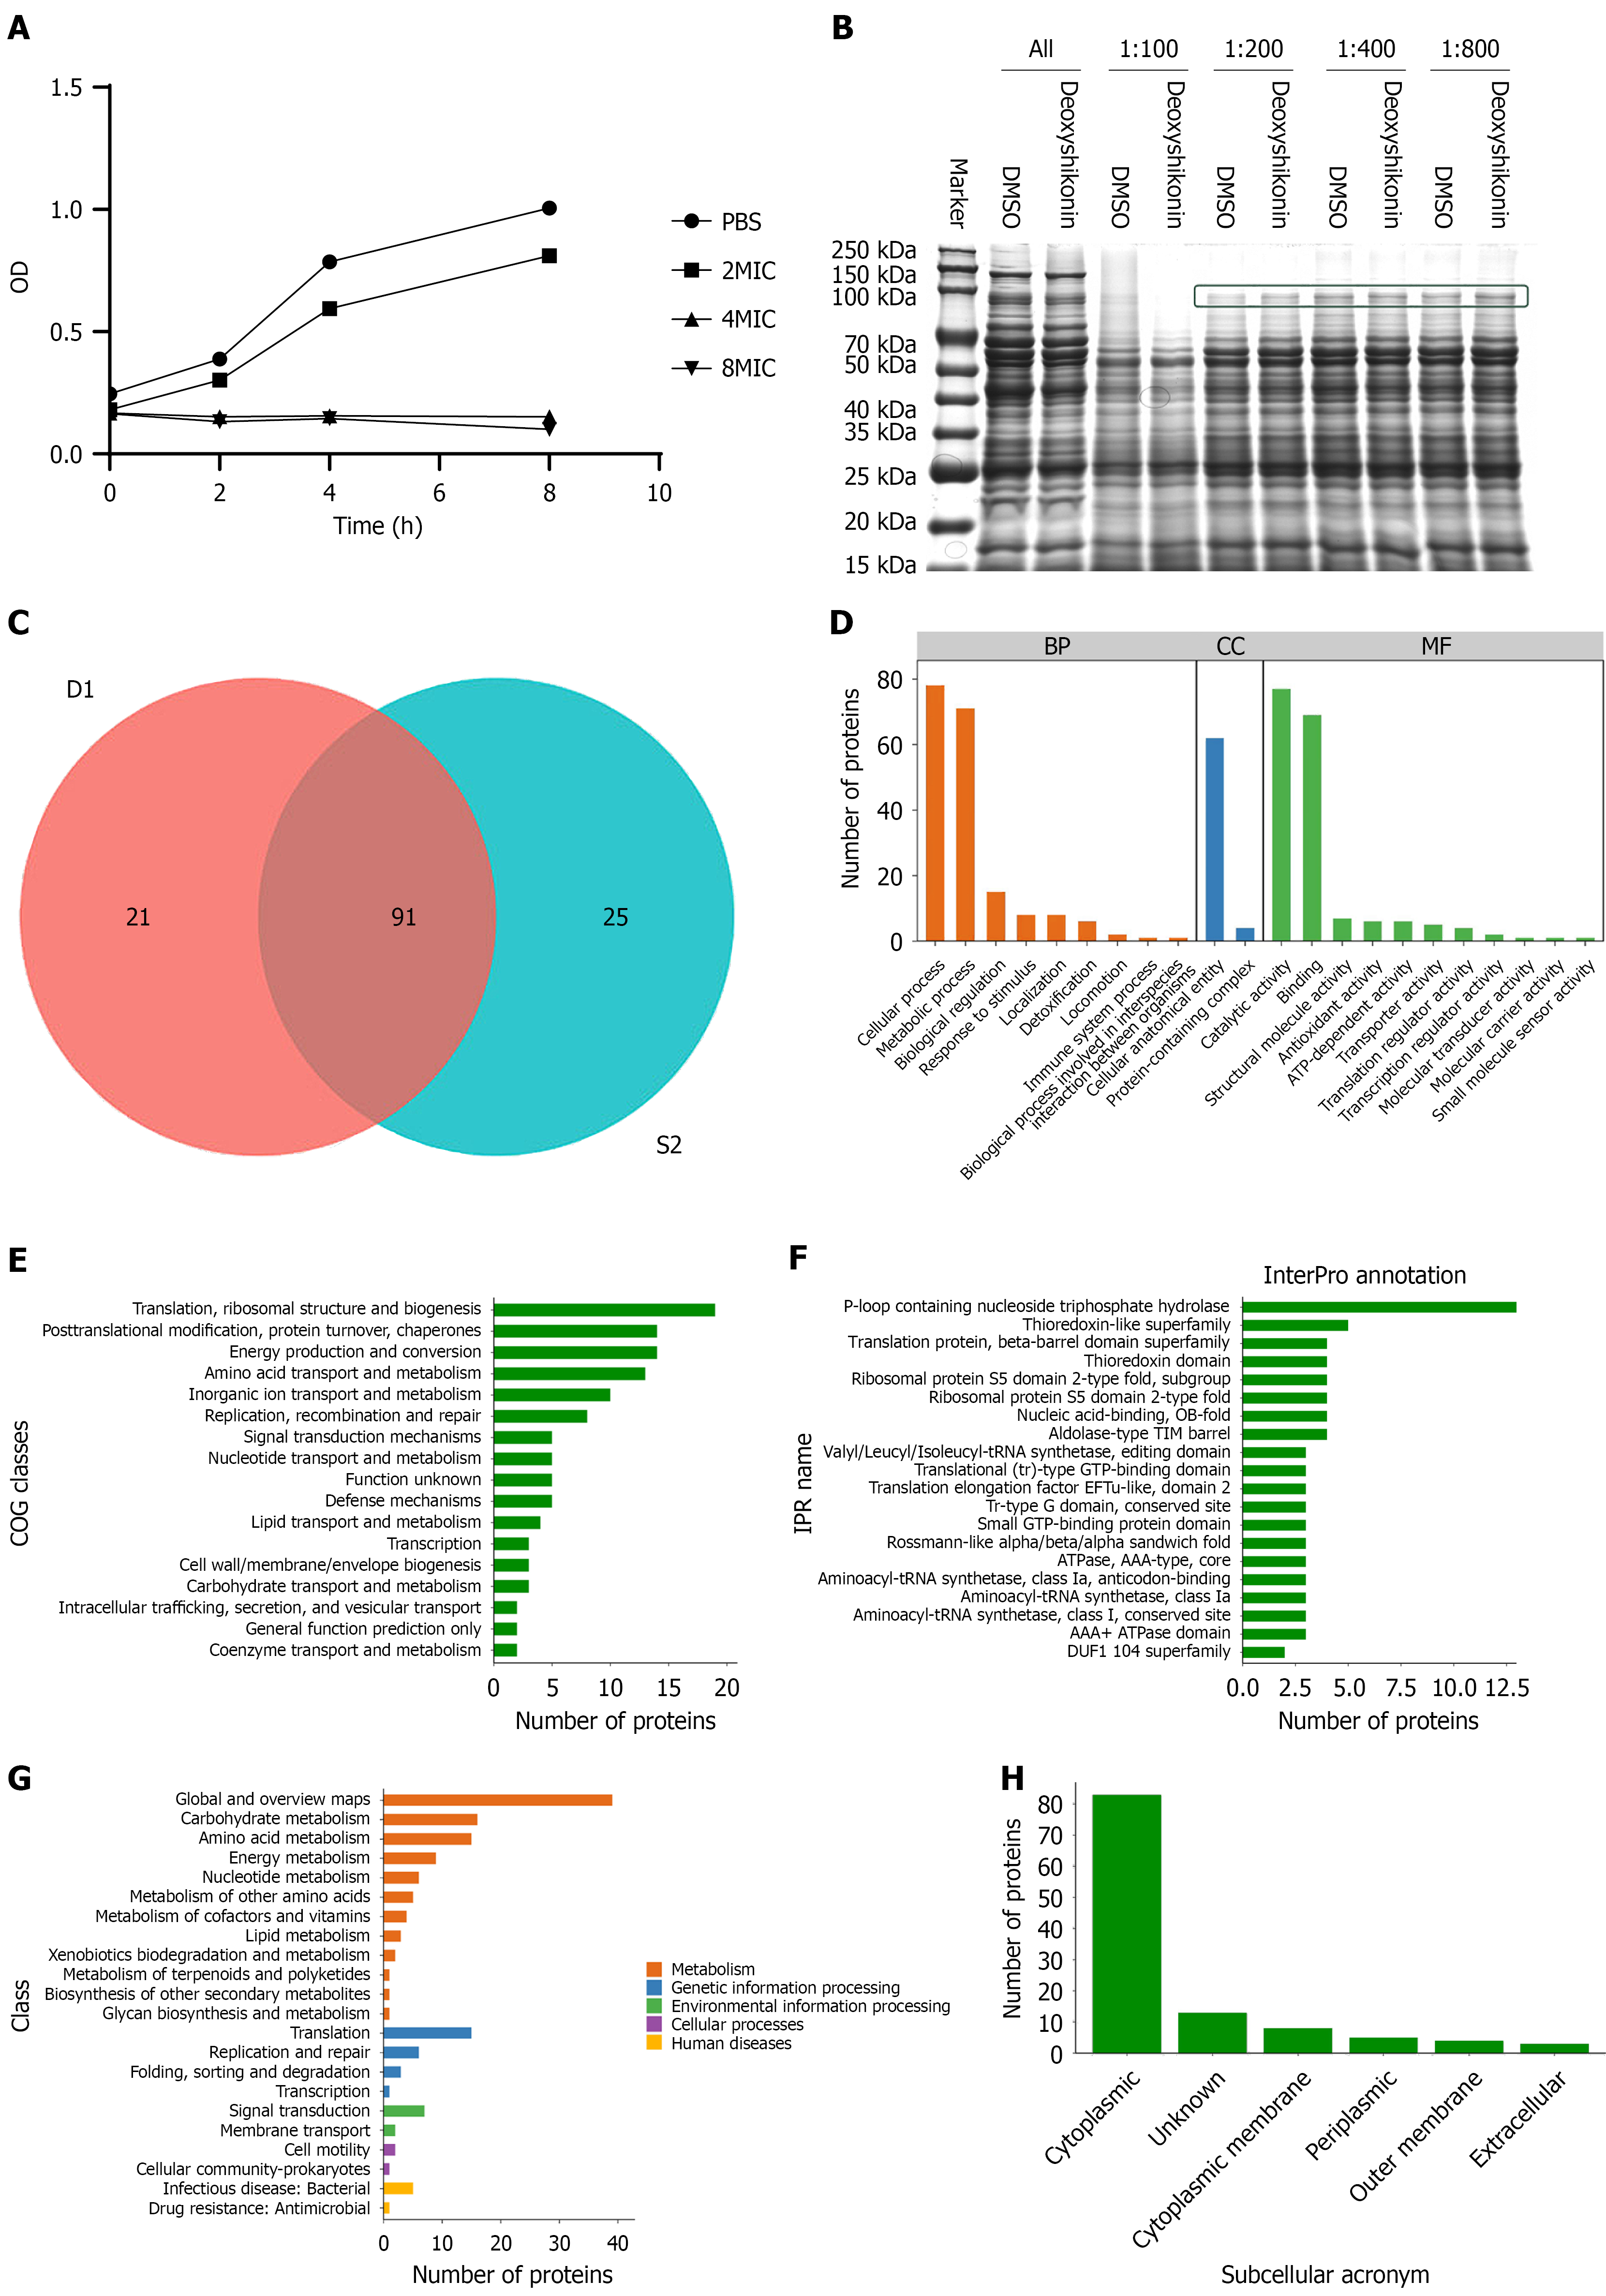
Figure 2 Drug affinity responsive target stability-based identification of candidate deoxyshikonin-binding proteins.
A: Half-maximal inhibitory concentration curve for deoxyshikonin against Helicobacter pylori G27; B: Sodium-dodecyl sulfate gel electrophoresis gel image showing differential protein bands generated at different protease concentrations; C: Venn diagram of identified proteins; D: Gene Ontology functional annotation; E: Cluster of Orthologous Groups functional annotation; F: Paralog analysis; G: Kyoto Encyclopedia of Genes and Genomes pathway enrichment analysis; H: Subcellular localization prediction. PBS: Phosphate-buffered saline; MIC: Minimum inhibitory concentration; COG: Cluster of Orthologous Groups.
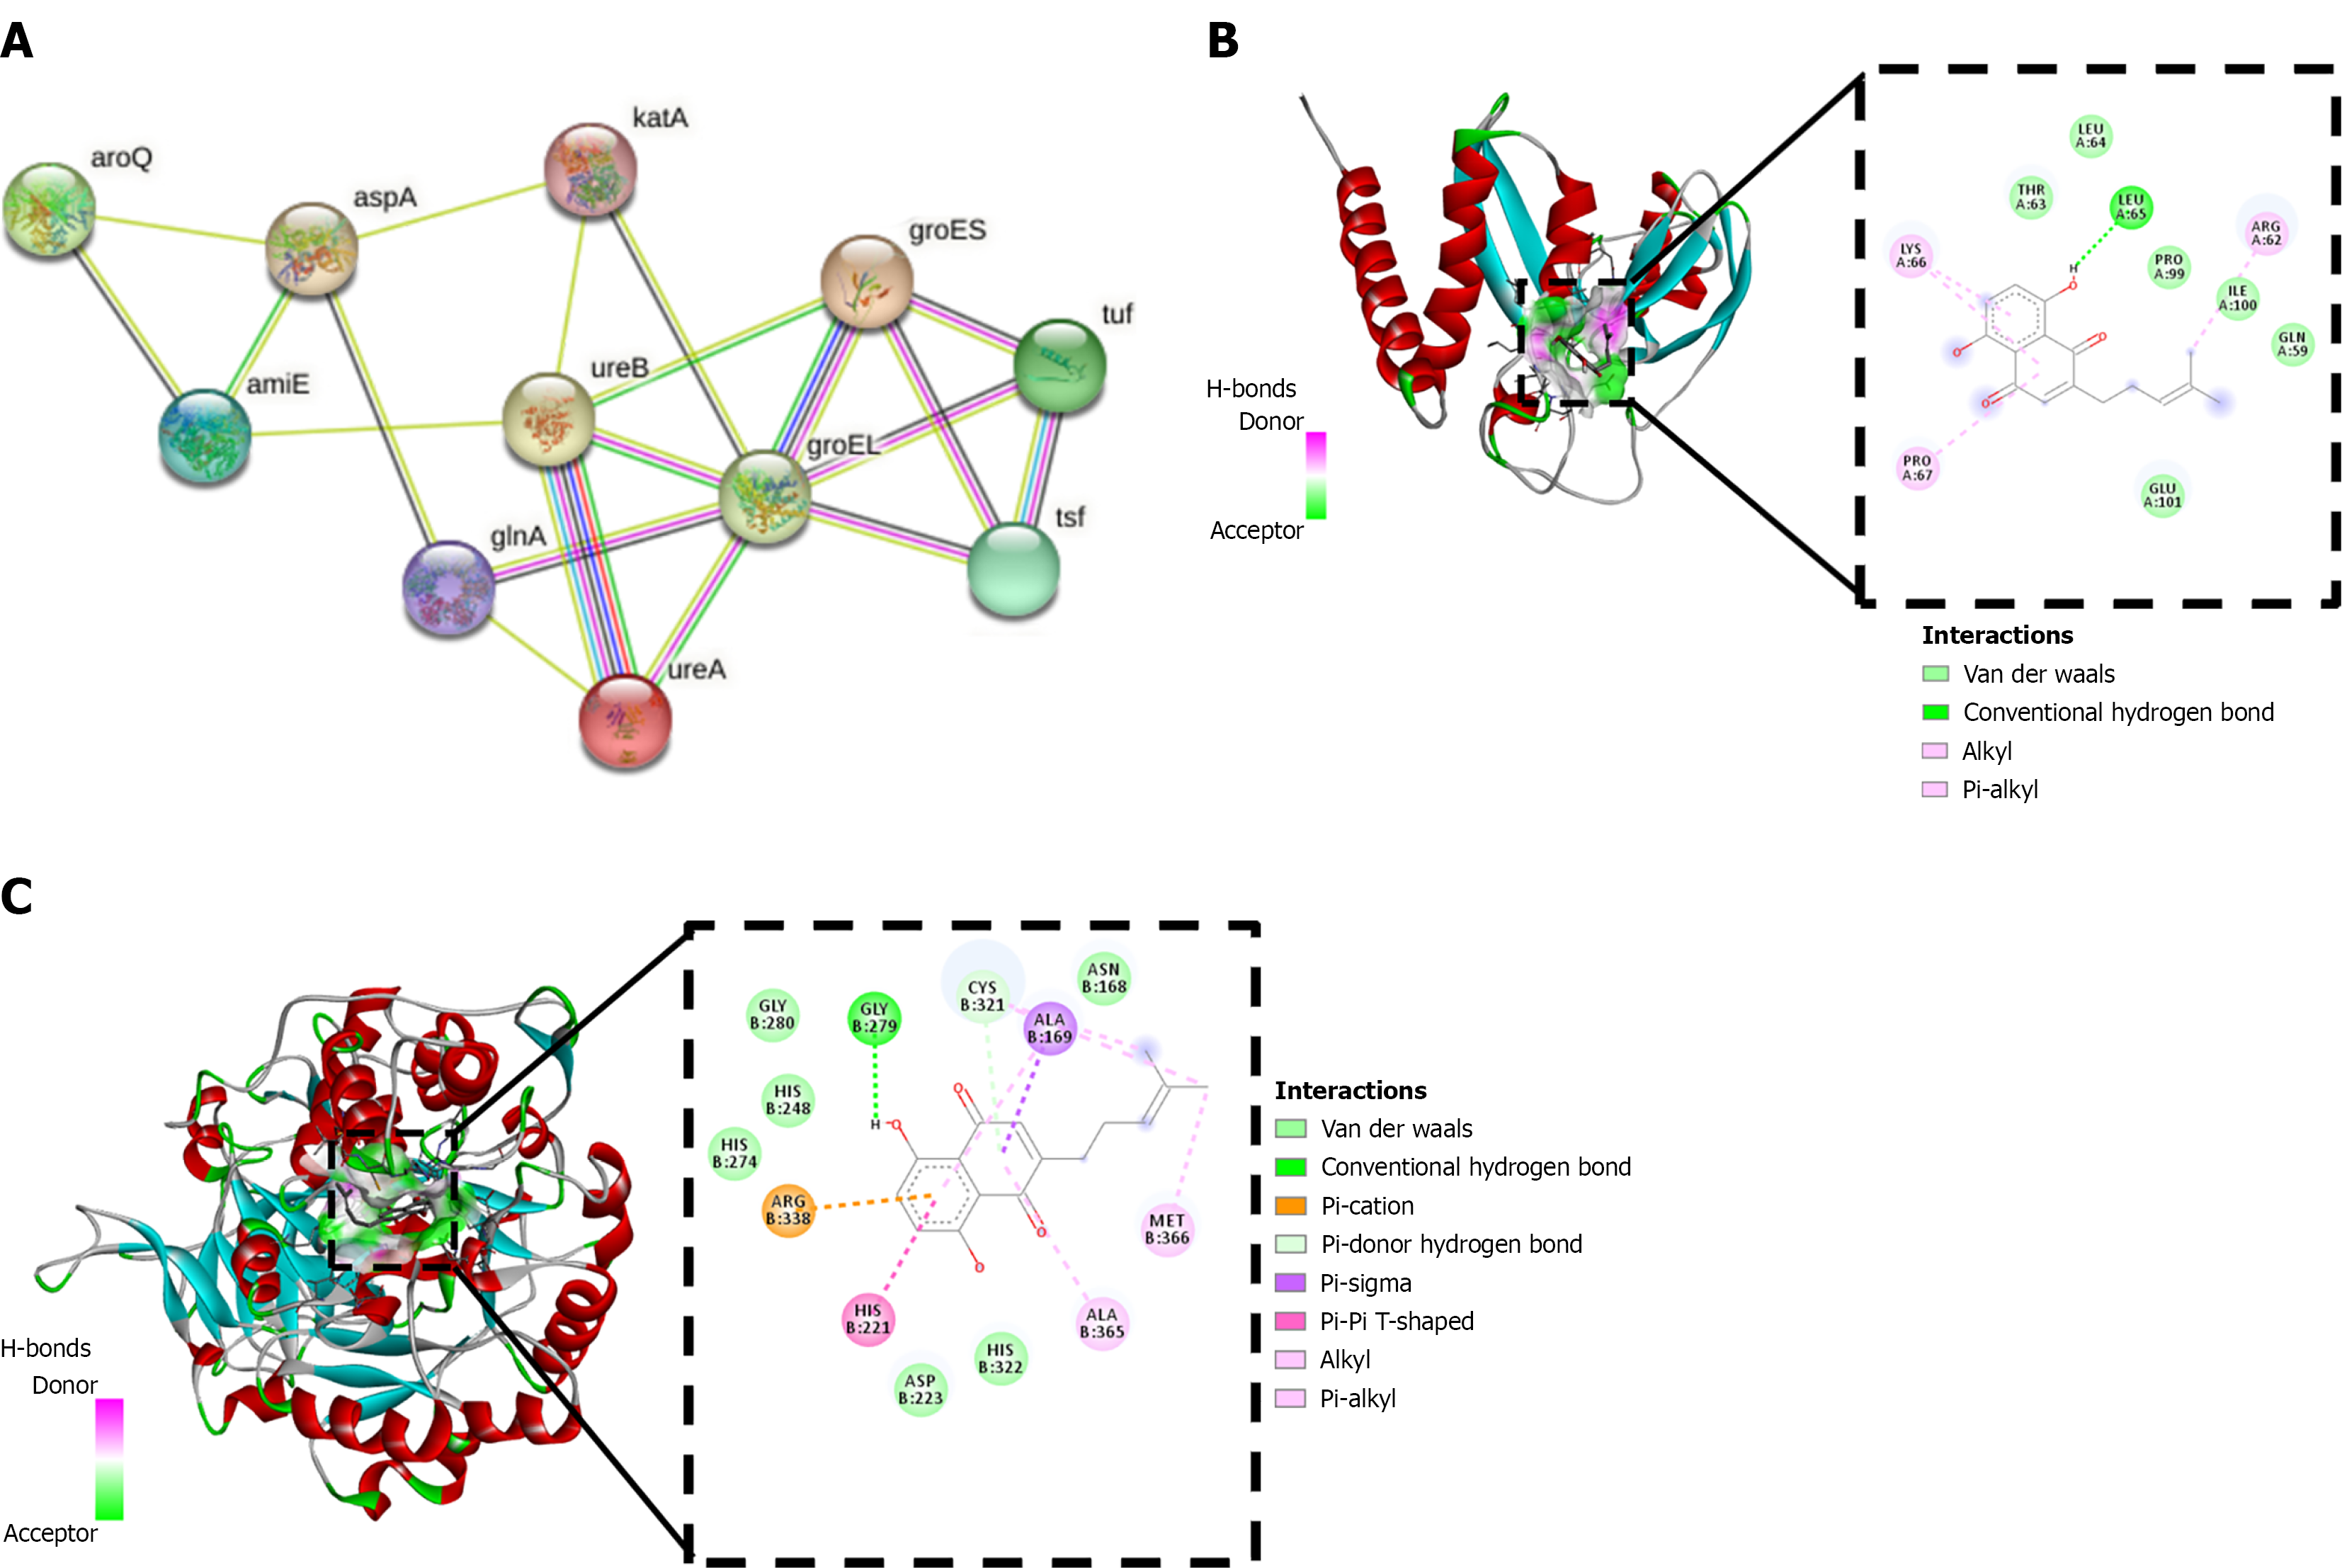
Figure 3 Molecular docking.
A: STRING protein interaction network; B: Docking model of deoxyshikonin bound to UreA; C: Docking model of deoxyshikonin bound to UreB.
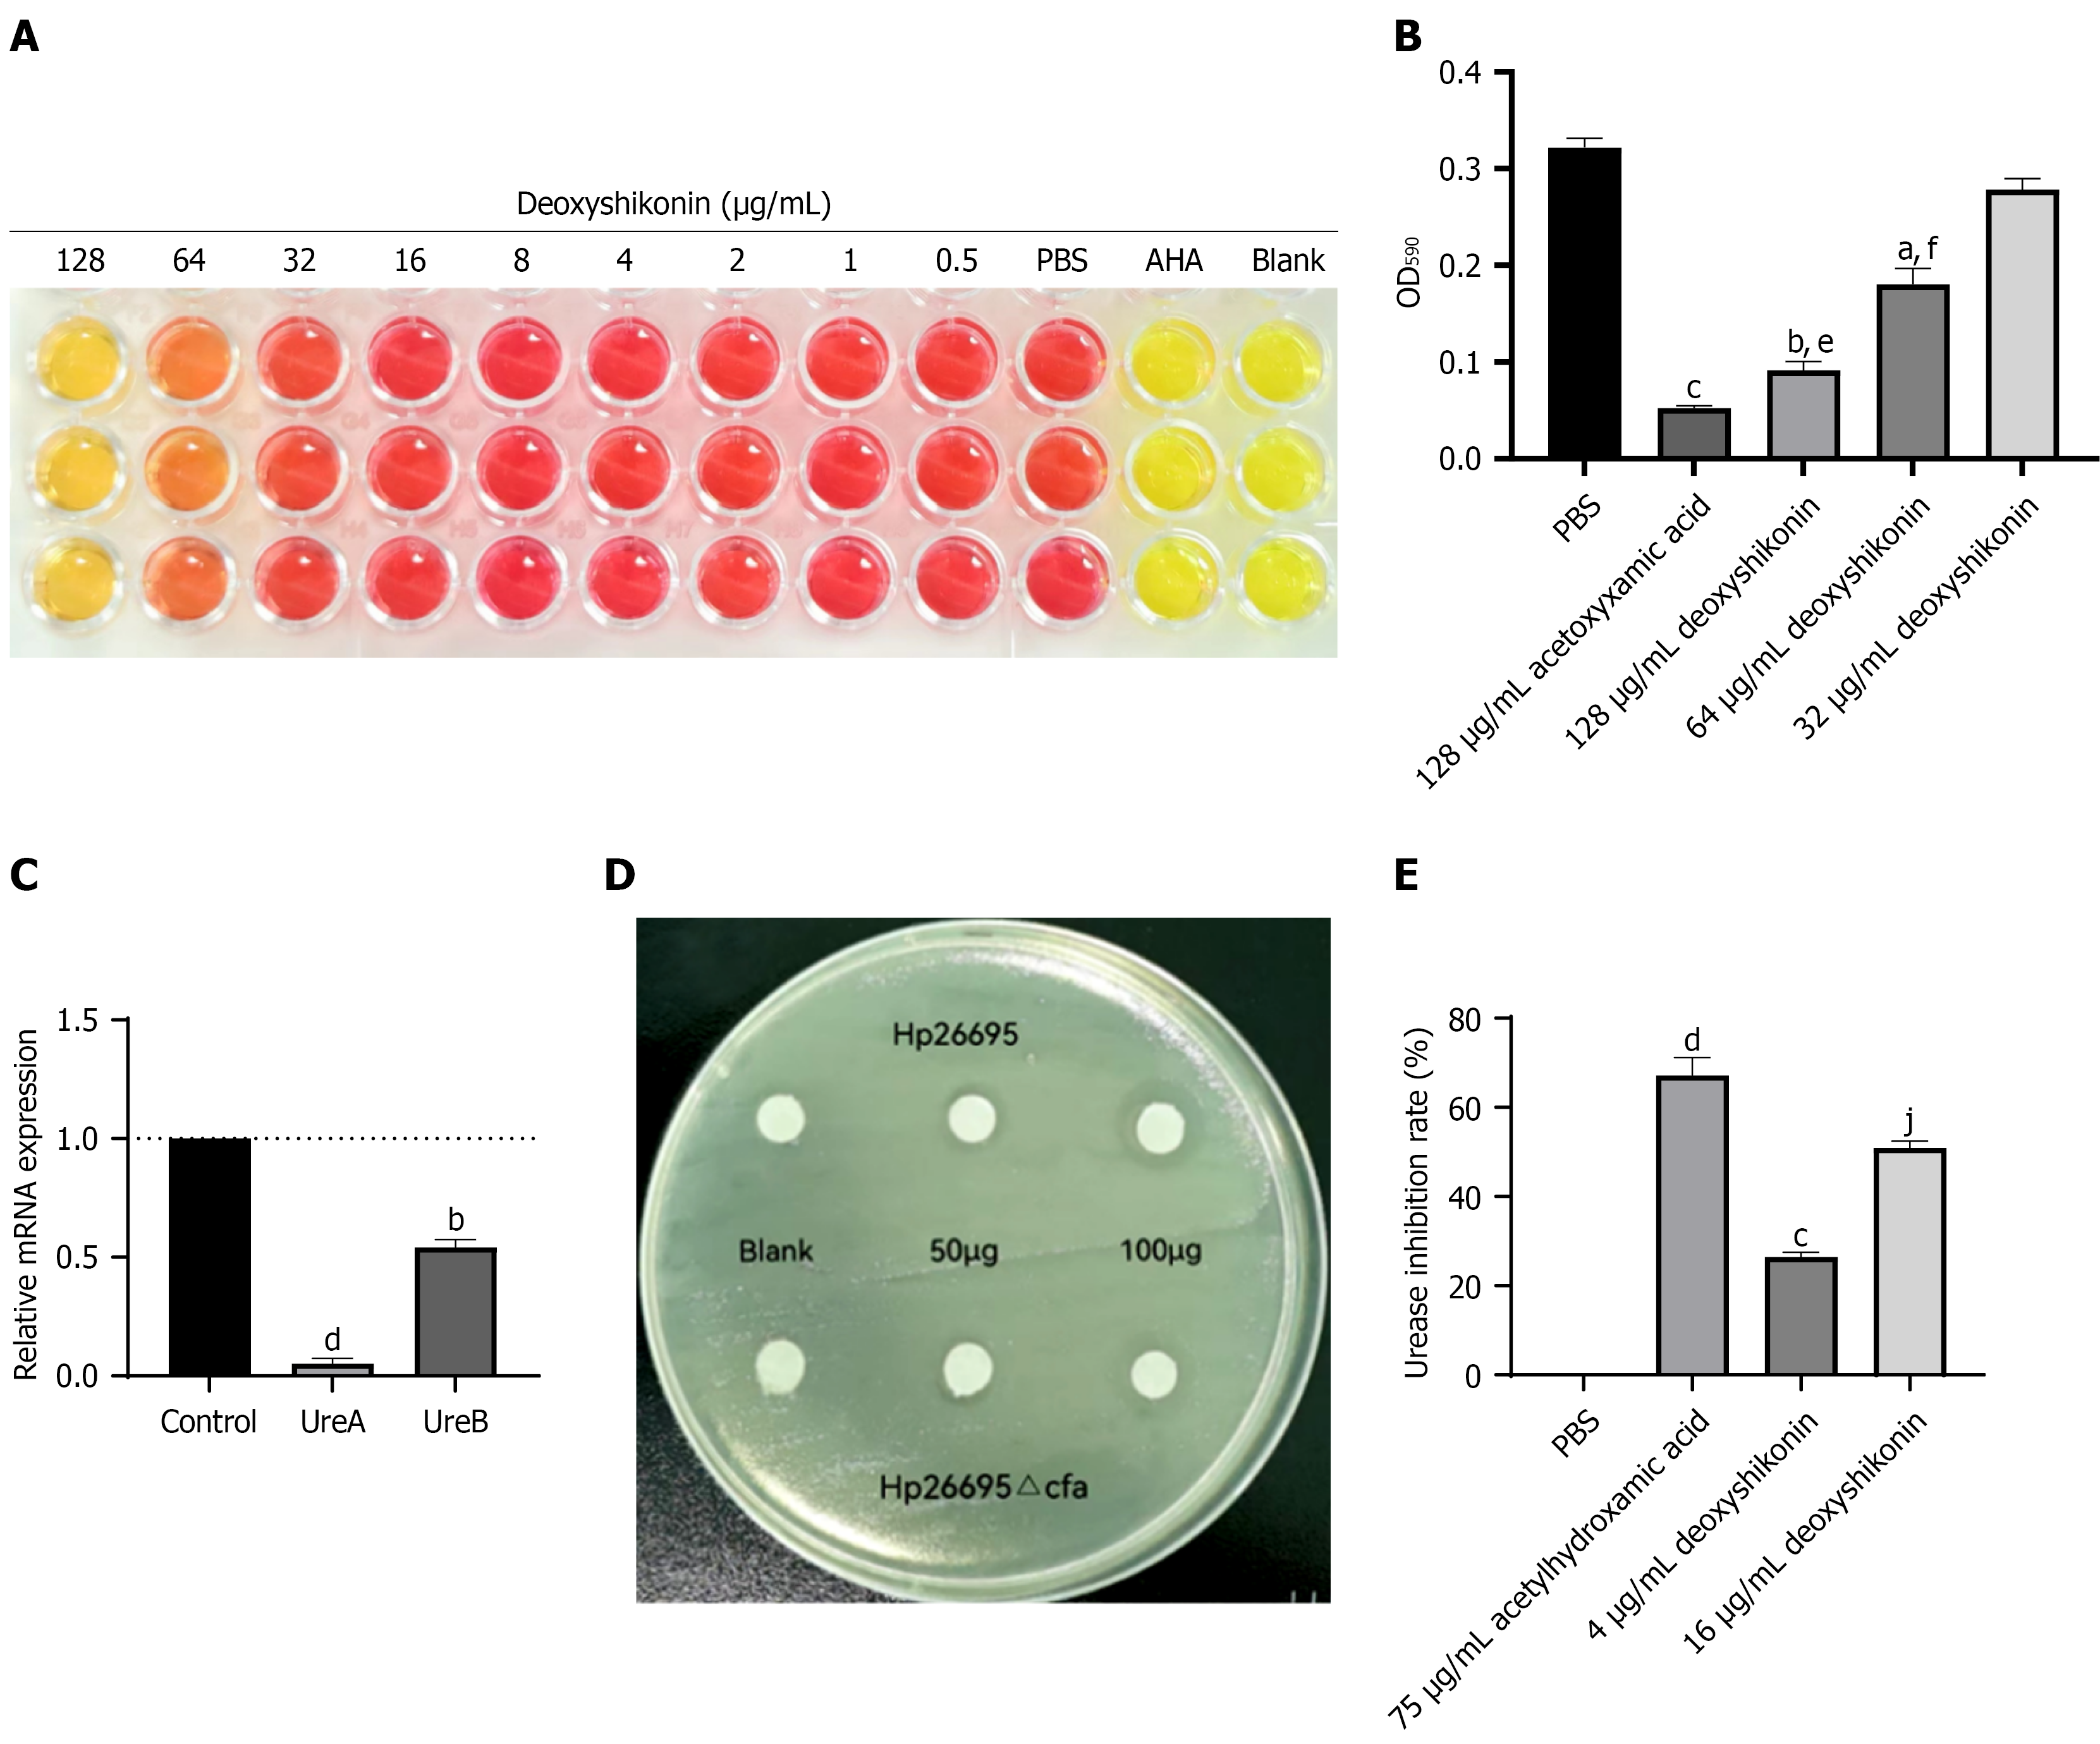
Figure 4 Deoxyshikonin-mediated inhibition of Helicobacter pylori urease activity.
A and B: Representative phenol red colorimetric images and quantitative analysis of deoxyshikonin-mediated urease inhibition in the G27 strain. aP < 0.05 vs phosphate-buffered saline, bP < 0.01 vs phosphate-buffered saline, cP < 0.001 vs phosphate-buffered saline, eP < 0.05 vs acetohydroxamic acid, and fP < 0.01 vs acetohydroxamic acid; C: Relative mRNA expression measured by reverse transcription-quantitative polymerase chain reaction in the standard Helicobacter pylori (H. pylori) 26695 strain and the mutant strain 26695Δcfa. bP < 0.01 vs control, dP < 0.0001 vs control; D: Inhibition-zone results for the standard H. pylori 26695 strain and the mutant strain H. pylori 26695Δcfa following exposure to different concentrations of deoxyshikonin; E: Inhibition rate of deoxyshikonin against urease activity in the G27 strain, determined using a urease assay kit. cP < 0.001 vs phosphate-buffered saline, dP < 0.0001 vs phosphate-buffered saline, and jP < 0.001 vs acetohydroxamic acid. PBS: Phosphate-buffered saline; AHA: Acetohydroxamic acid.
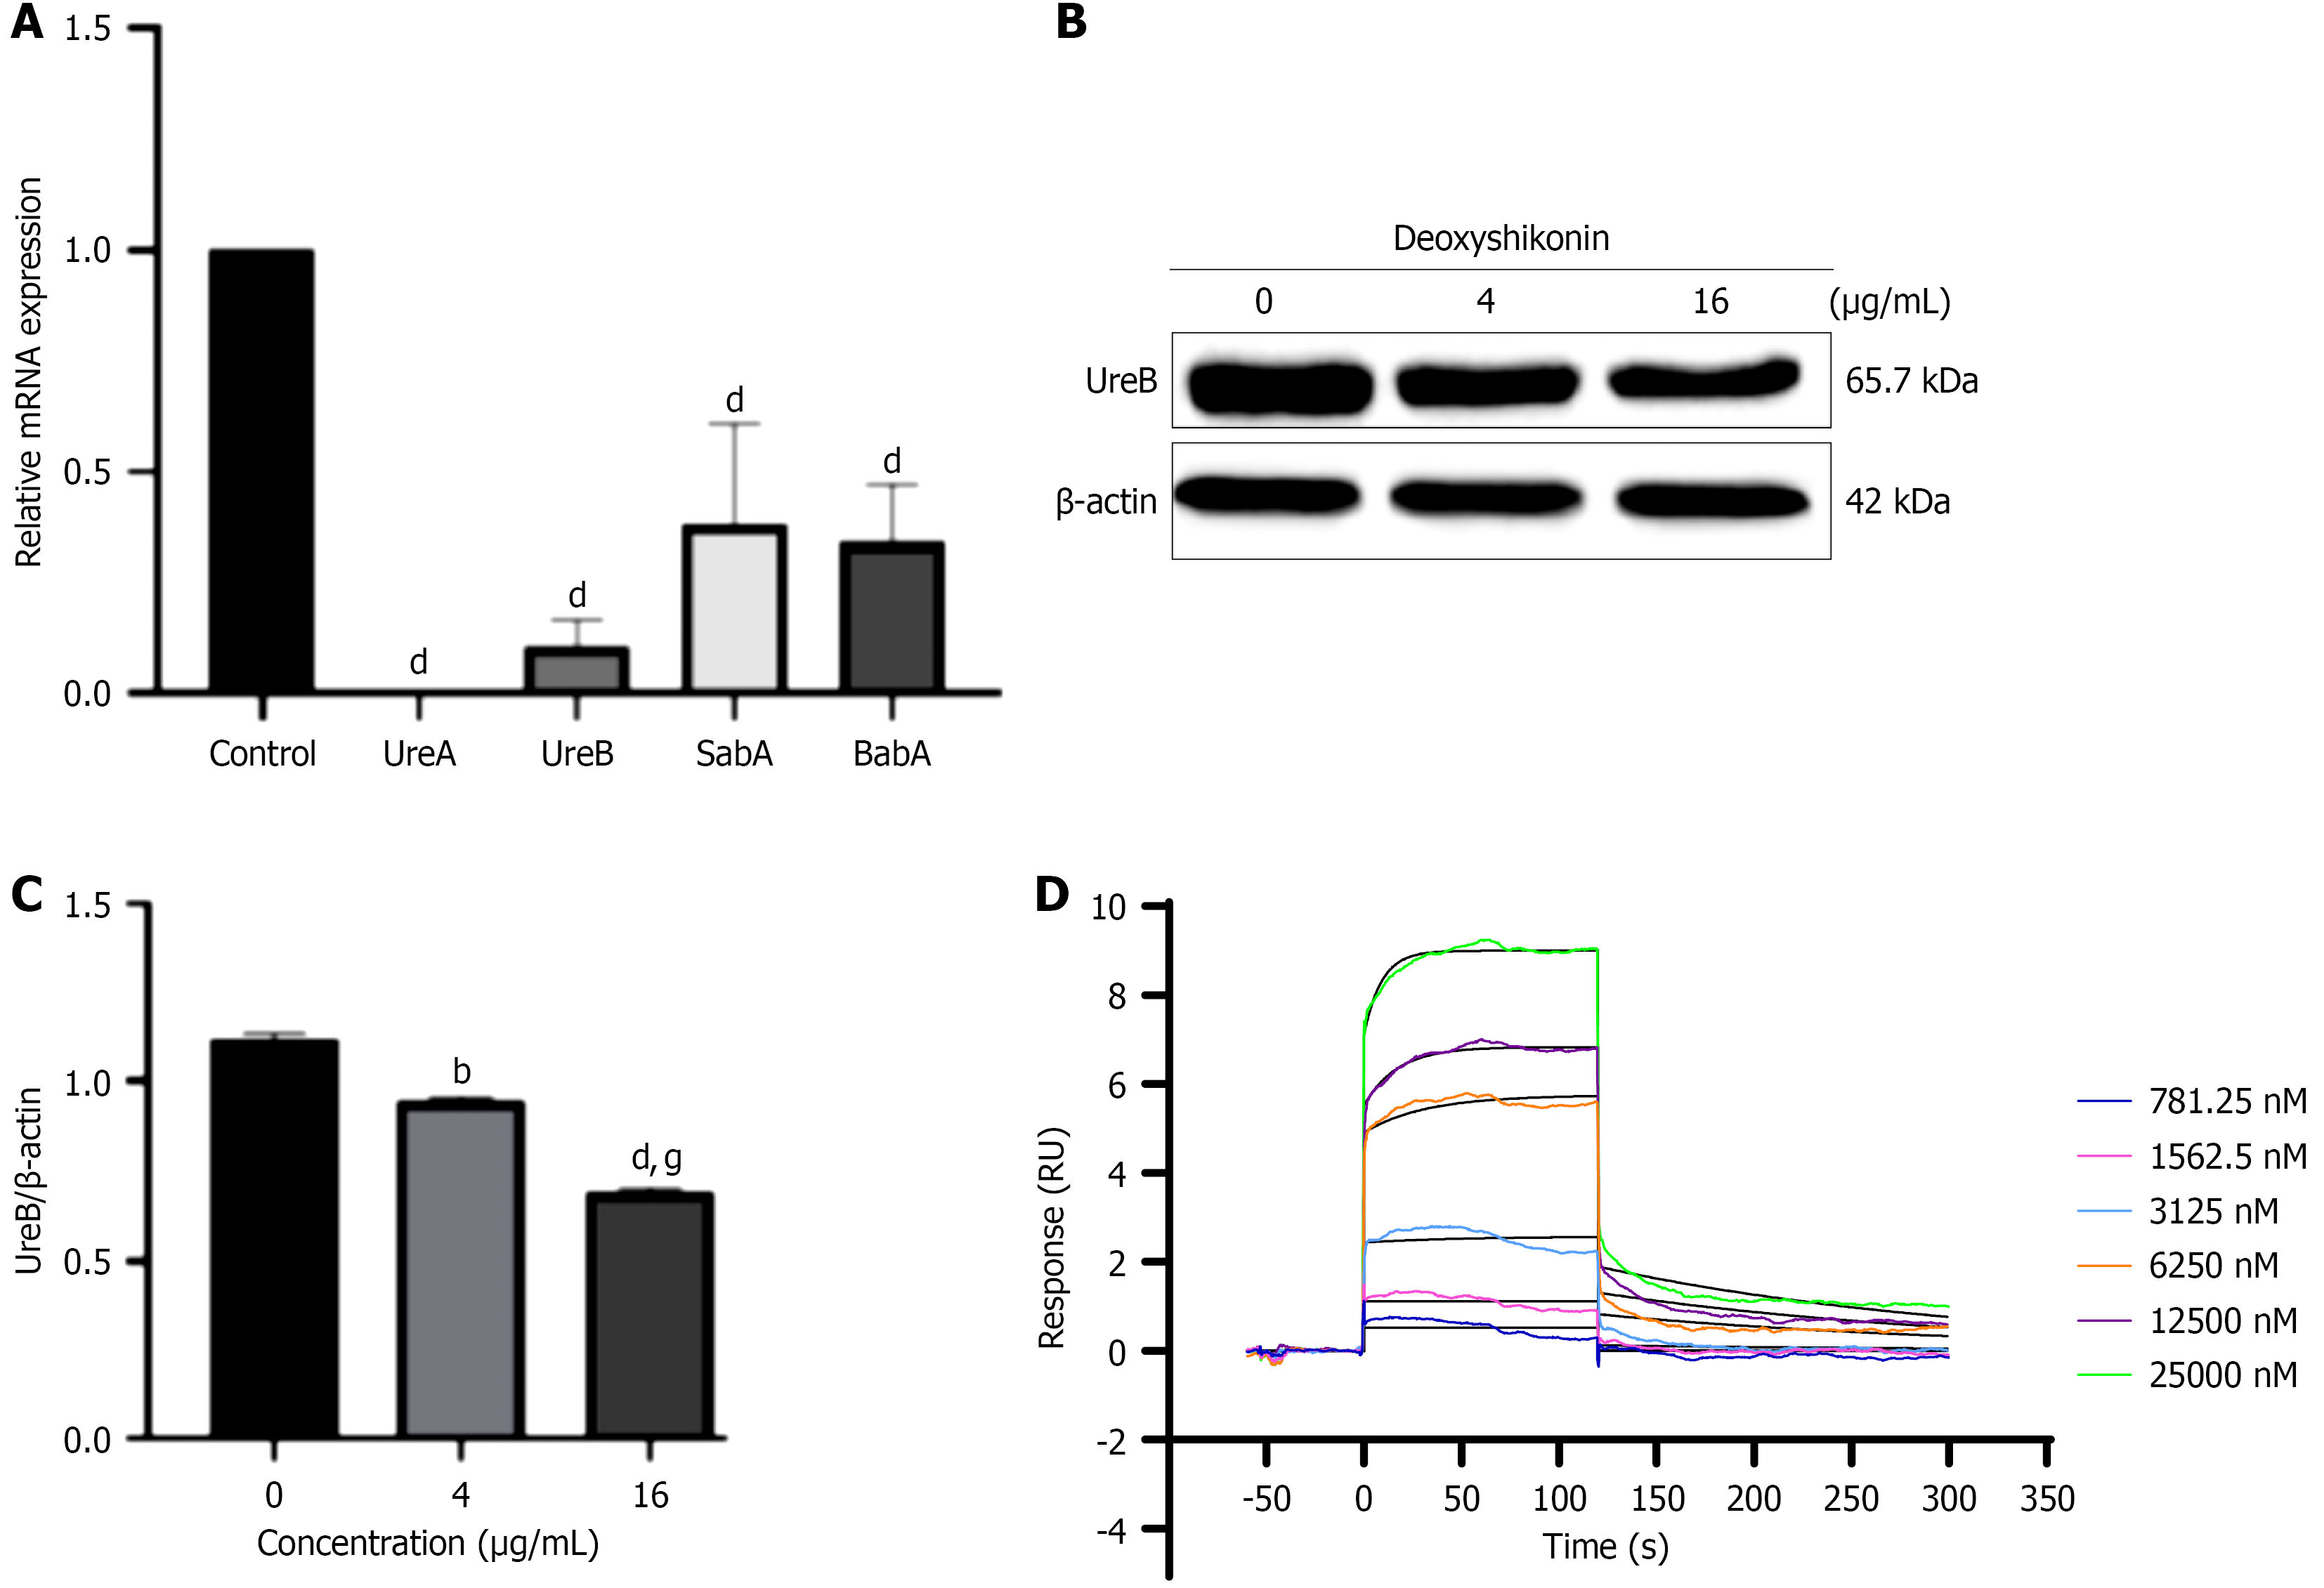
Figure 5 Deoxyshikonin reduces the expression of Helicobacter pylori adhesion- and urease-related genes.
A: Reverse transcription-quantitative polymerase chain reaction analysis of the relative mRNA expression levels of SabA, BabA, ureA, and ureB after deoxyshikonin treatment; dP < 0.0001 vs the control group; B: Representative western blot showing UreB protein expression in Helicobacter pylori treated with 0, 4, and 16 μg/mL deoxyshikonin; C: Quantification of UreB protein expression normalised to total protein loading; bP < 0.01 vs the 0 μg/mL deoxyshikonin group, dP < 0.0001 vs the 0 μg/mL deoxyshikonin group, gP < 0.001 vs the 4 μg/mL deoxyshikonin; D: Surface plasmon resonance sensorgrams showing the binding interaction between deoxyshikonin and UreB protein.
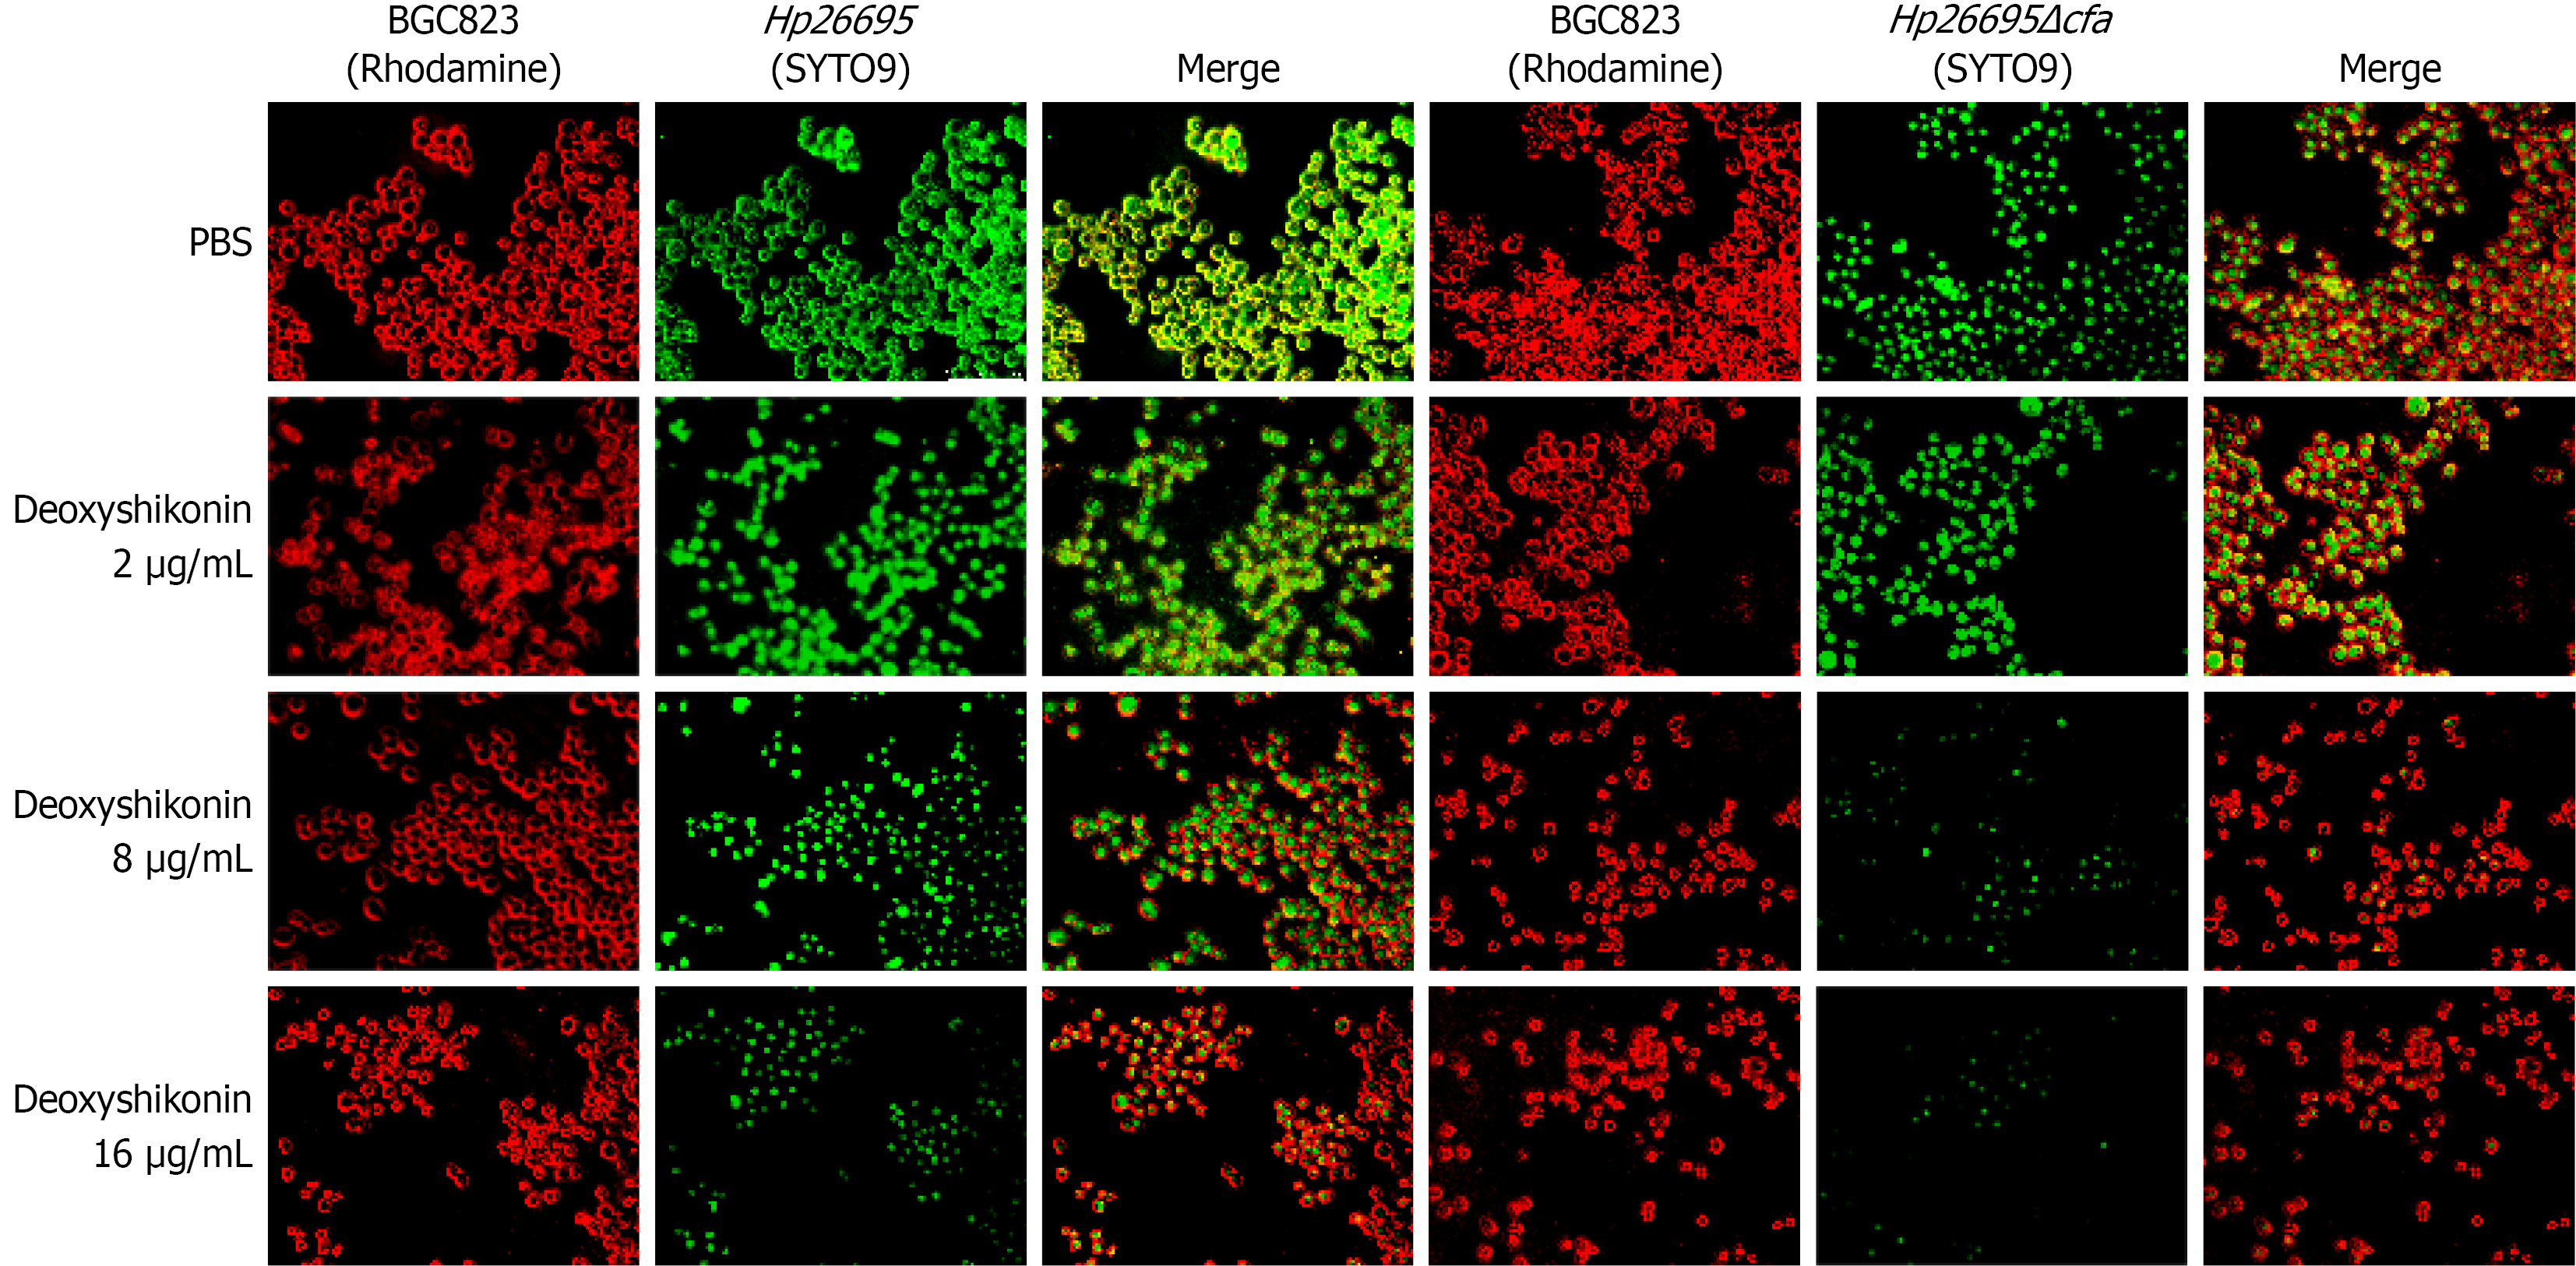
Figure 6 Deoxyshikonin reduces the adhesion of wild-type and low-urease-expression Helicobacter pylori strains to BGC823 cells.
PBS: Phosphate-buffered saline.
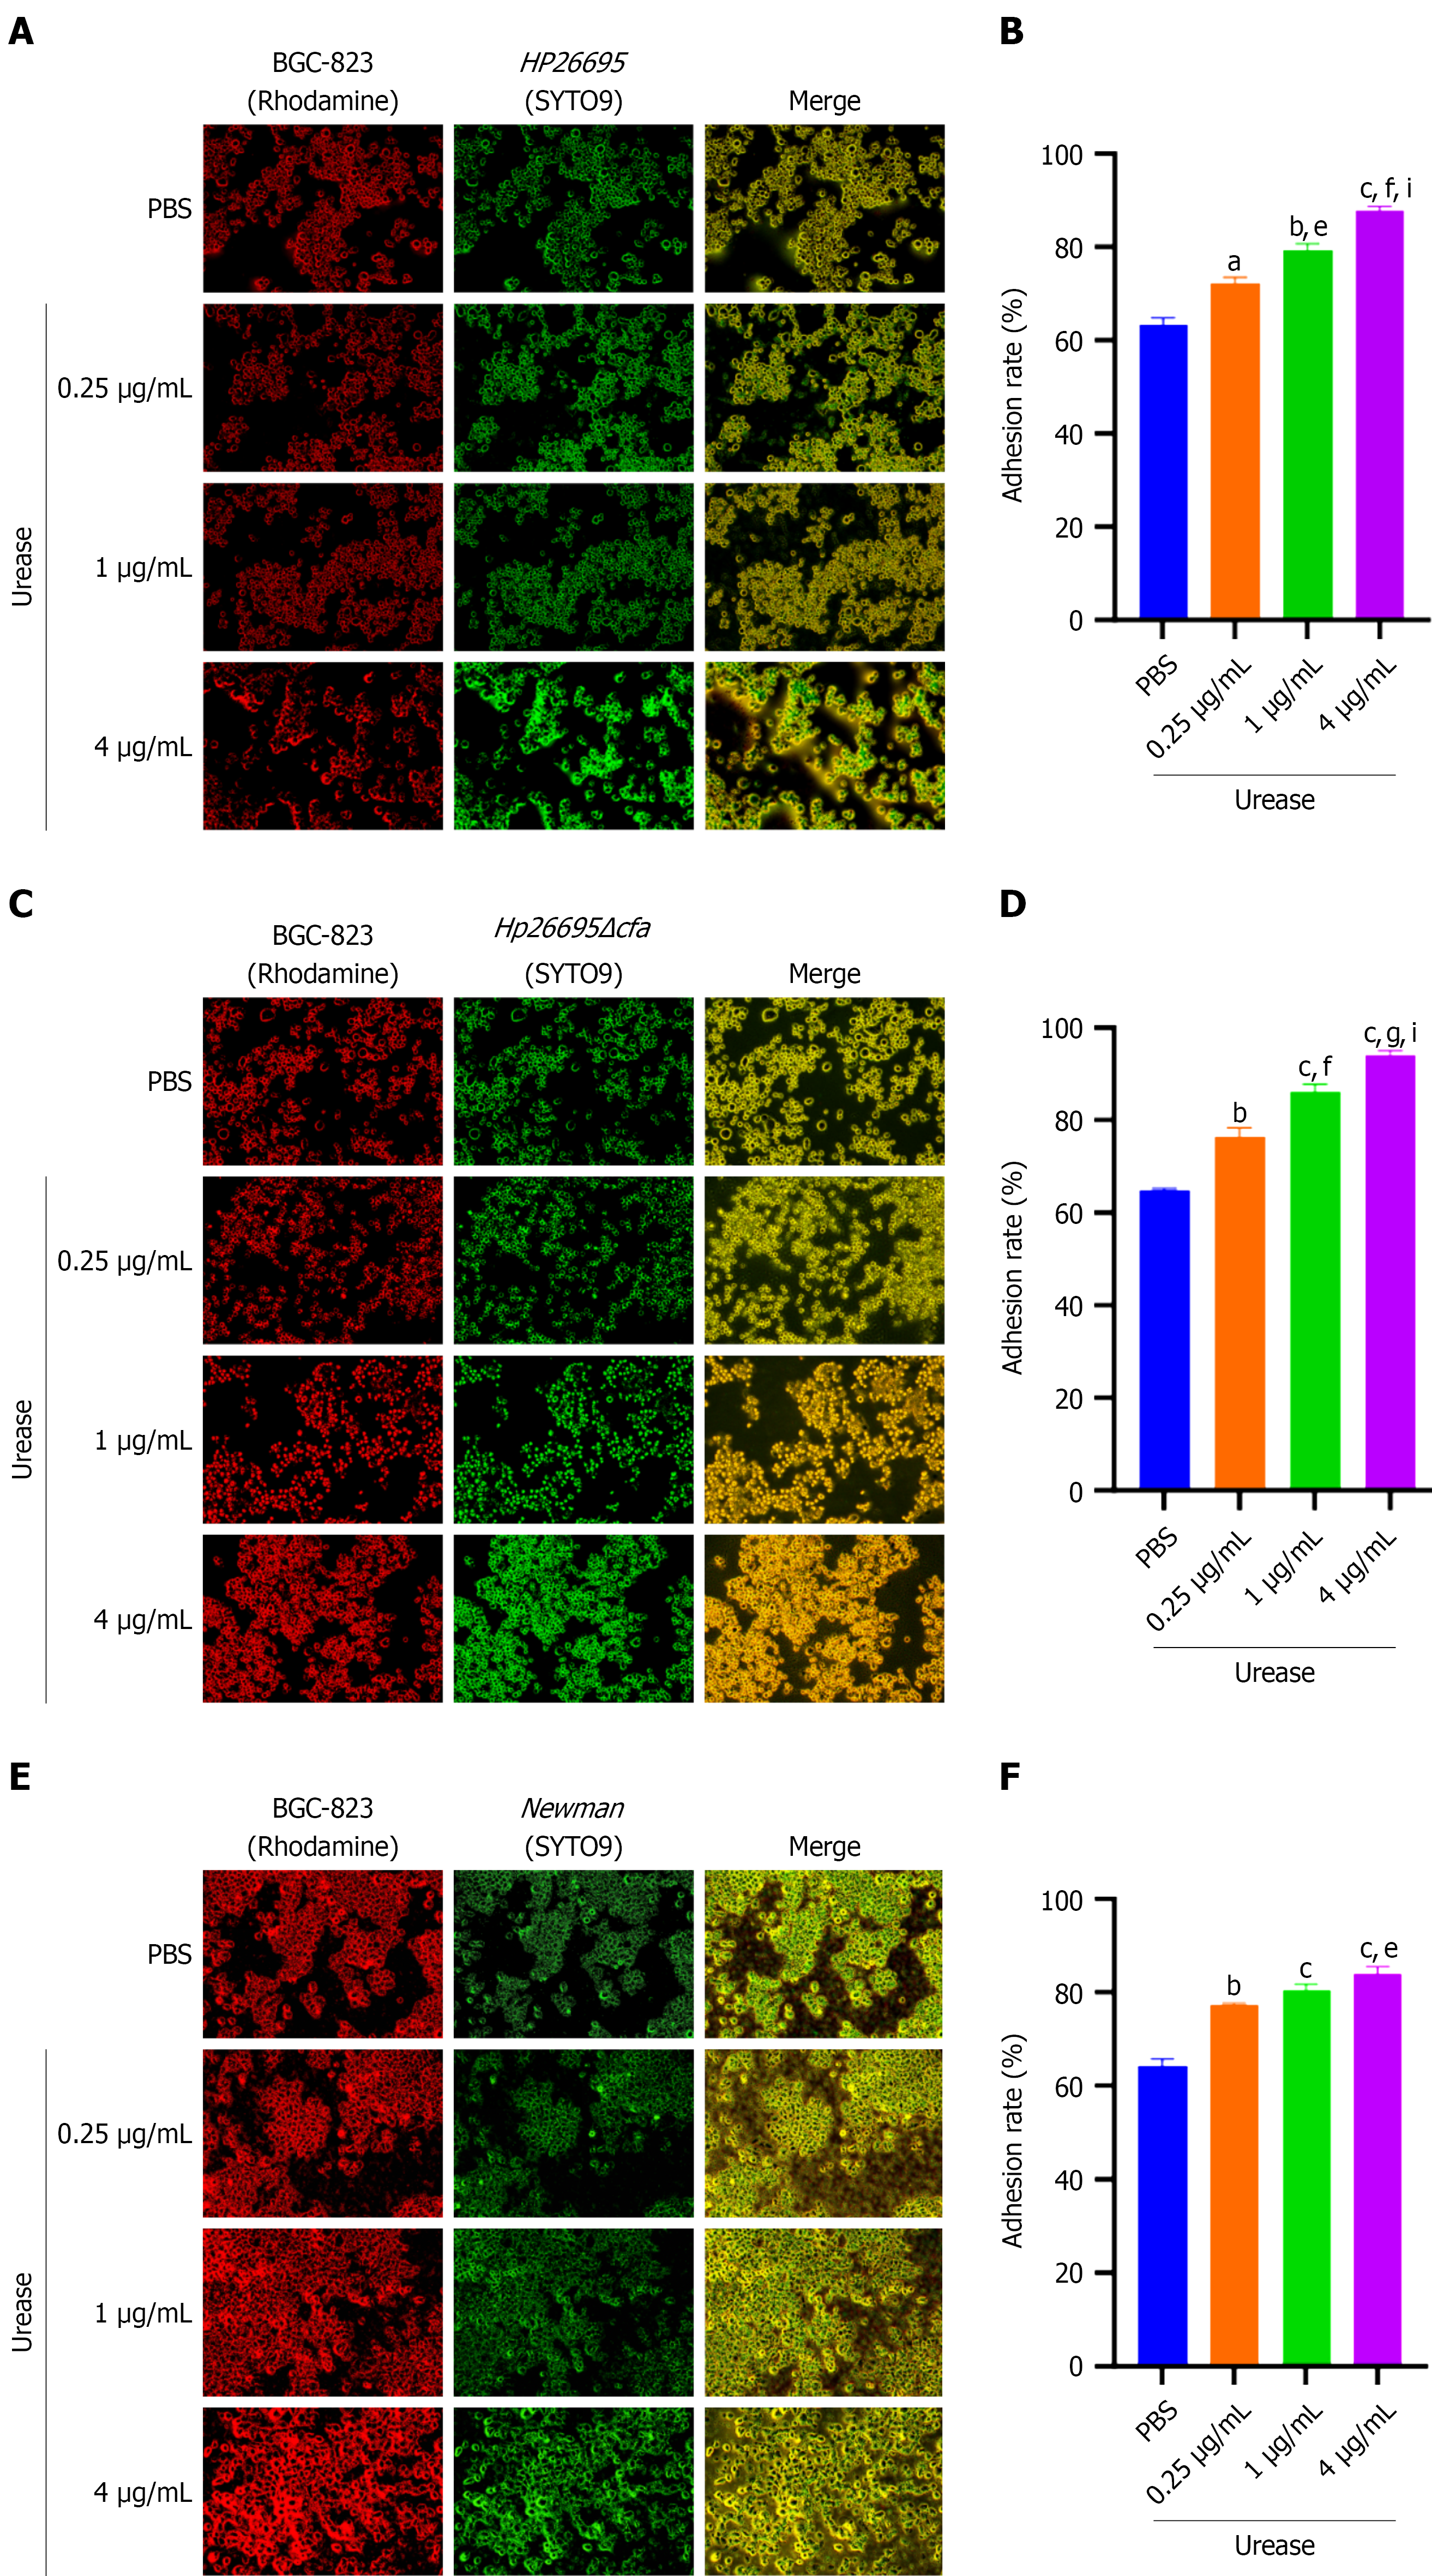
Figure 7 Exogenous urease enhances bacterial adhesion to BGC823 cells.
A and B: Representative fluorescence images and quantification of Helicobacter pylori 26695 adhesion to BGC823 cells in the presence of exogenous urease; C and D: Representative fluorescence images and quantitative analysis of Helicobacter pylori 26695Δcfa adhesion to BGC823 cells in the presence of exogenous urease; E and F: Representative fluorescence images and quantitative analysis of the adhesion of the Newman strain to BGC823 cells in the presence of exogenous urease. BGC823 cells are shown in rhodamine red, bacteria are labelled with SYTO9 green, and merged images show bacterial attachment to host cells. aP < 0.05 vs phosphate-buffered saline, bP < 0.01 vs phosphate-buffered saline, cP < 0.001 vs phosphate-buffered saline, eP < 0.05 vs 0.25 μg/mL urease, fP < 0.01 vs 0.25 μg/mL urease, gP < 0.001 vs 0.25 μg/mL urease, iP < 0.05 vs 1 μg/mL urease. PBS: Phosphate-buffered saline.
- Citation: Pang GF, Xu JY, Guan AX, Yang SX, Duangsonk K, Huang YQ, Zhou QH, Zhou WT. Study on the adhesive effect of deoxyshikonin on Helicobacter pylori. World J Gastroenterol 2026; 32(43): 121477
- URL: https://www.wjgnet.com/1007-9327/full/v32/i43/121477.htm
- DOI: https://dx.doi.org/10.3748/wjg.121477