
















Copyright: ©Author(s) 2026.
World J Gastroenterol. Nov 21, 2026; 32(43): 121090
Published online Nov 21, 2026. doi: 10.3748/wjg.121090
Published online Nov 21, 2026. doi: 10.3748/wjg.121090
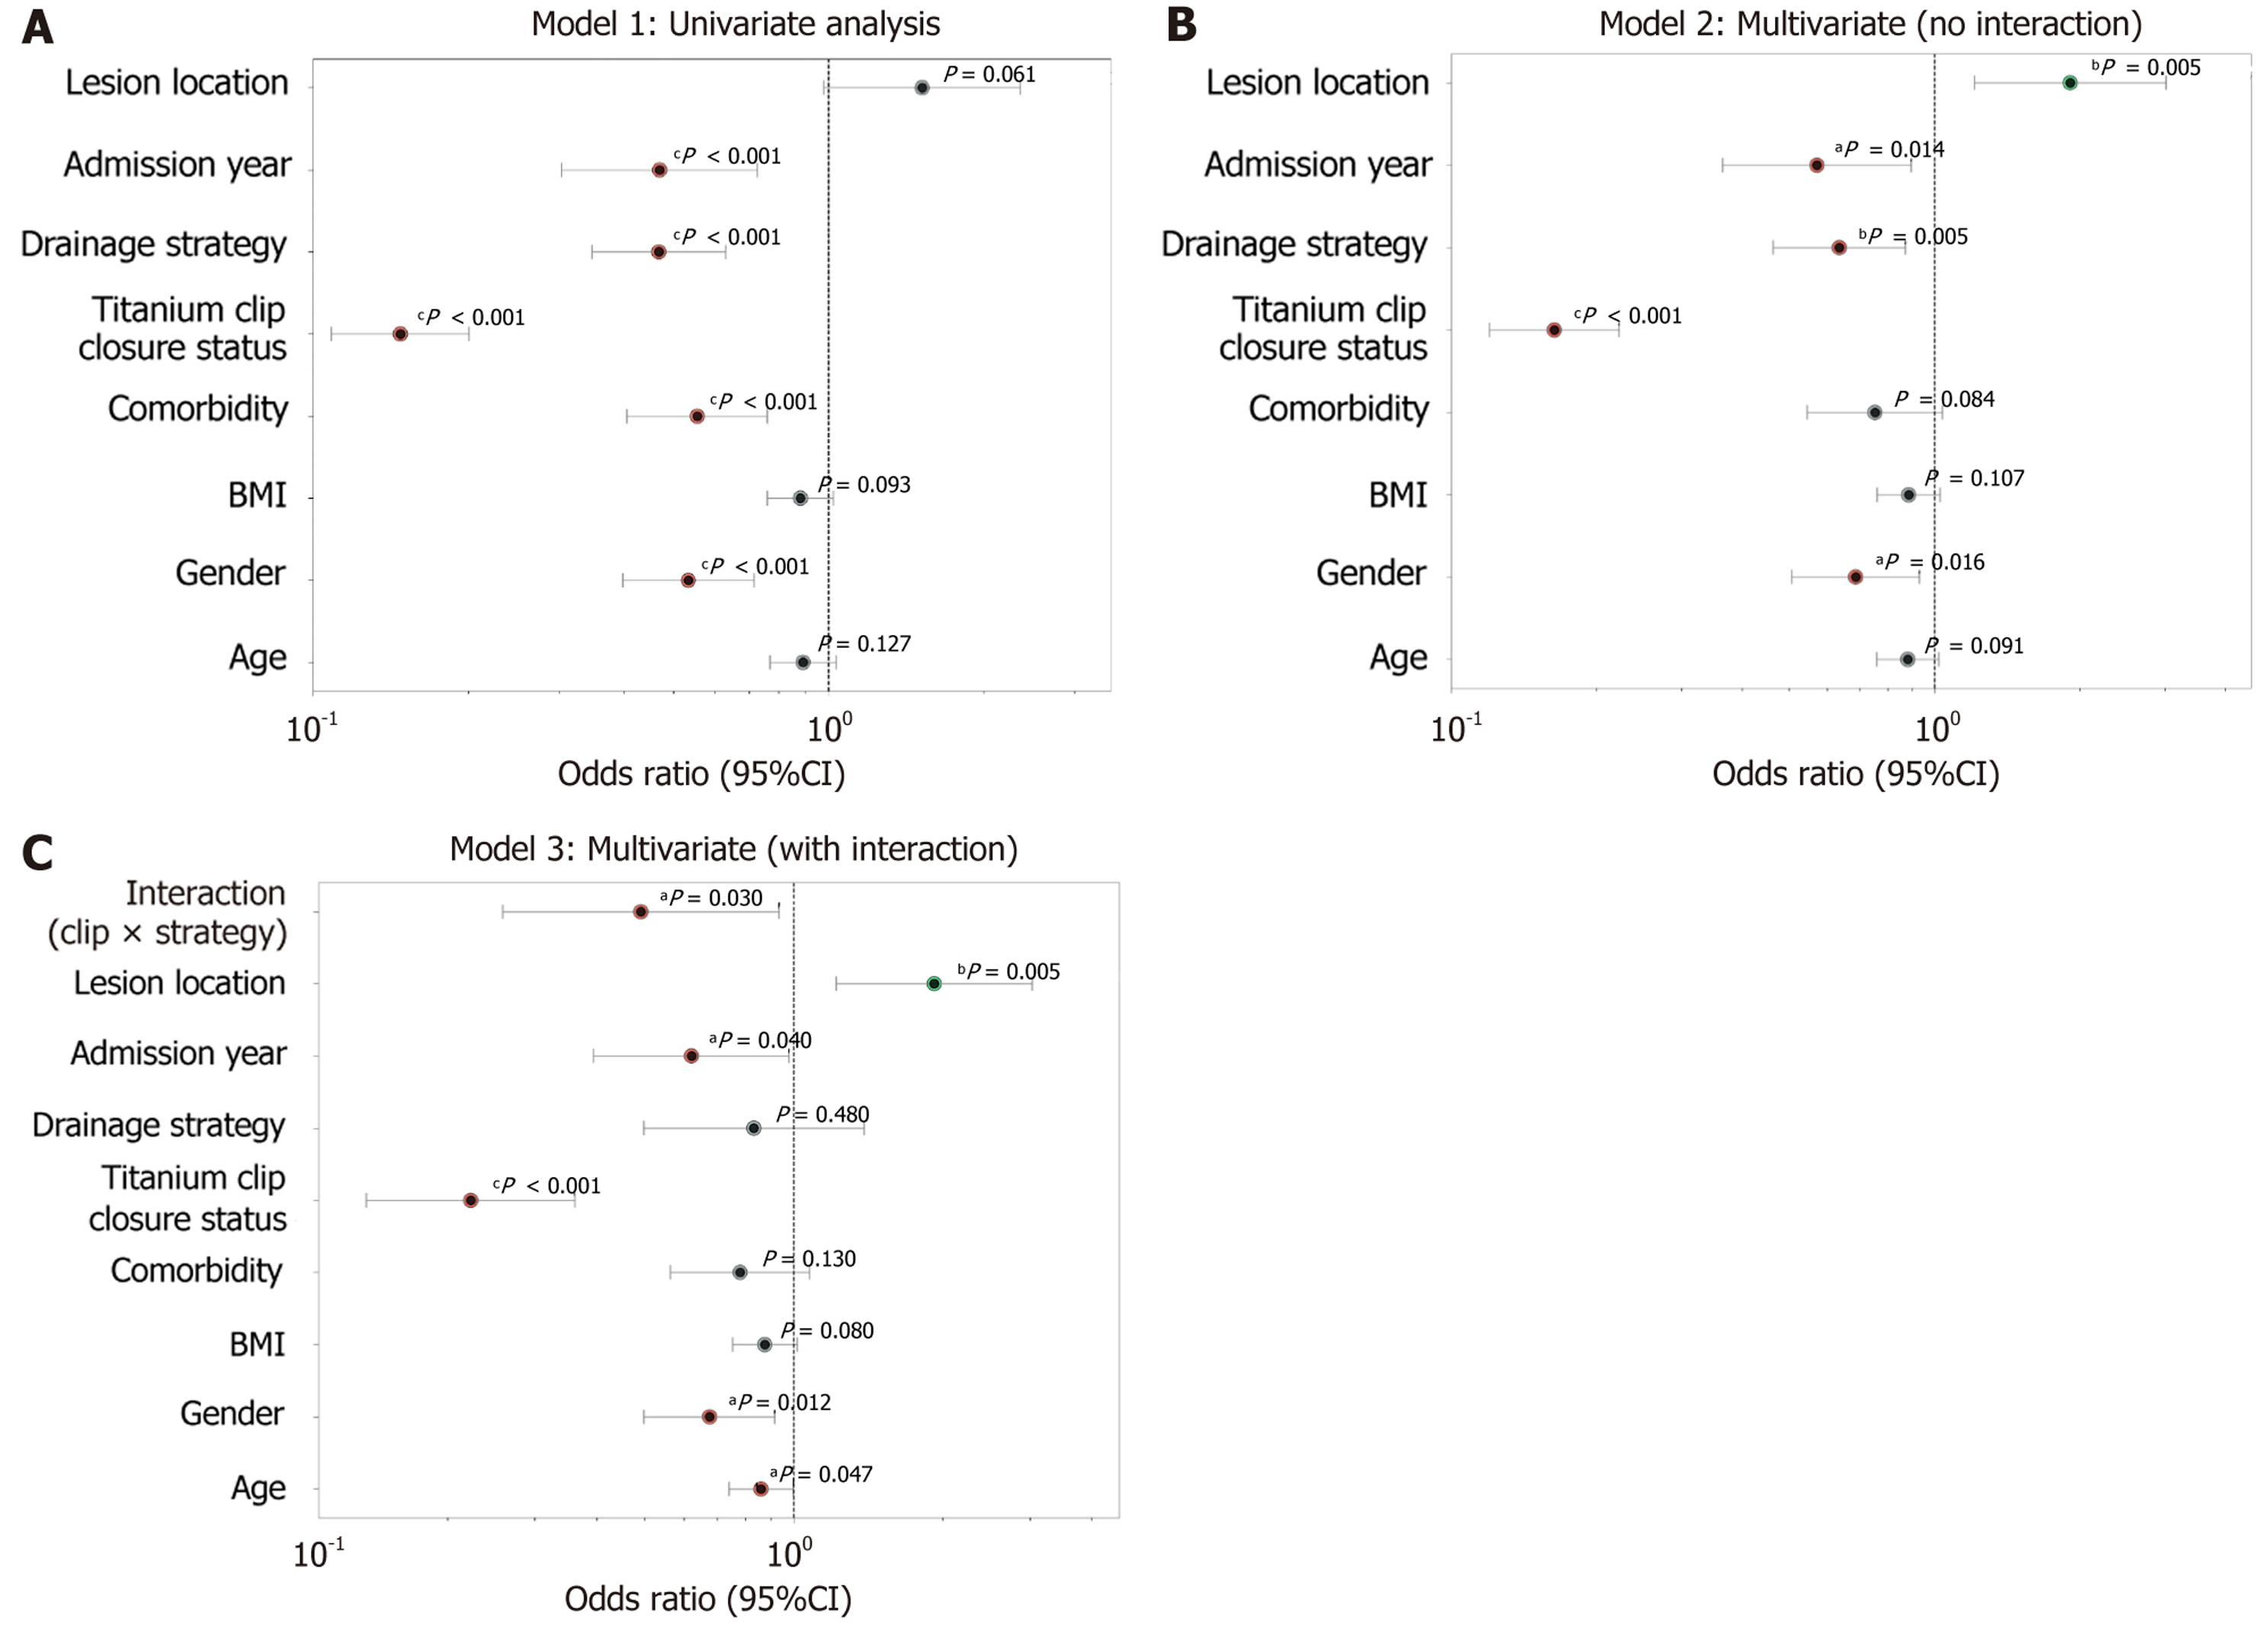
Figure 1 Forest plot of univariate and multivariate logistic regression for delayed adverse events following duodenal endoscopic sub
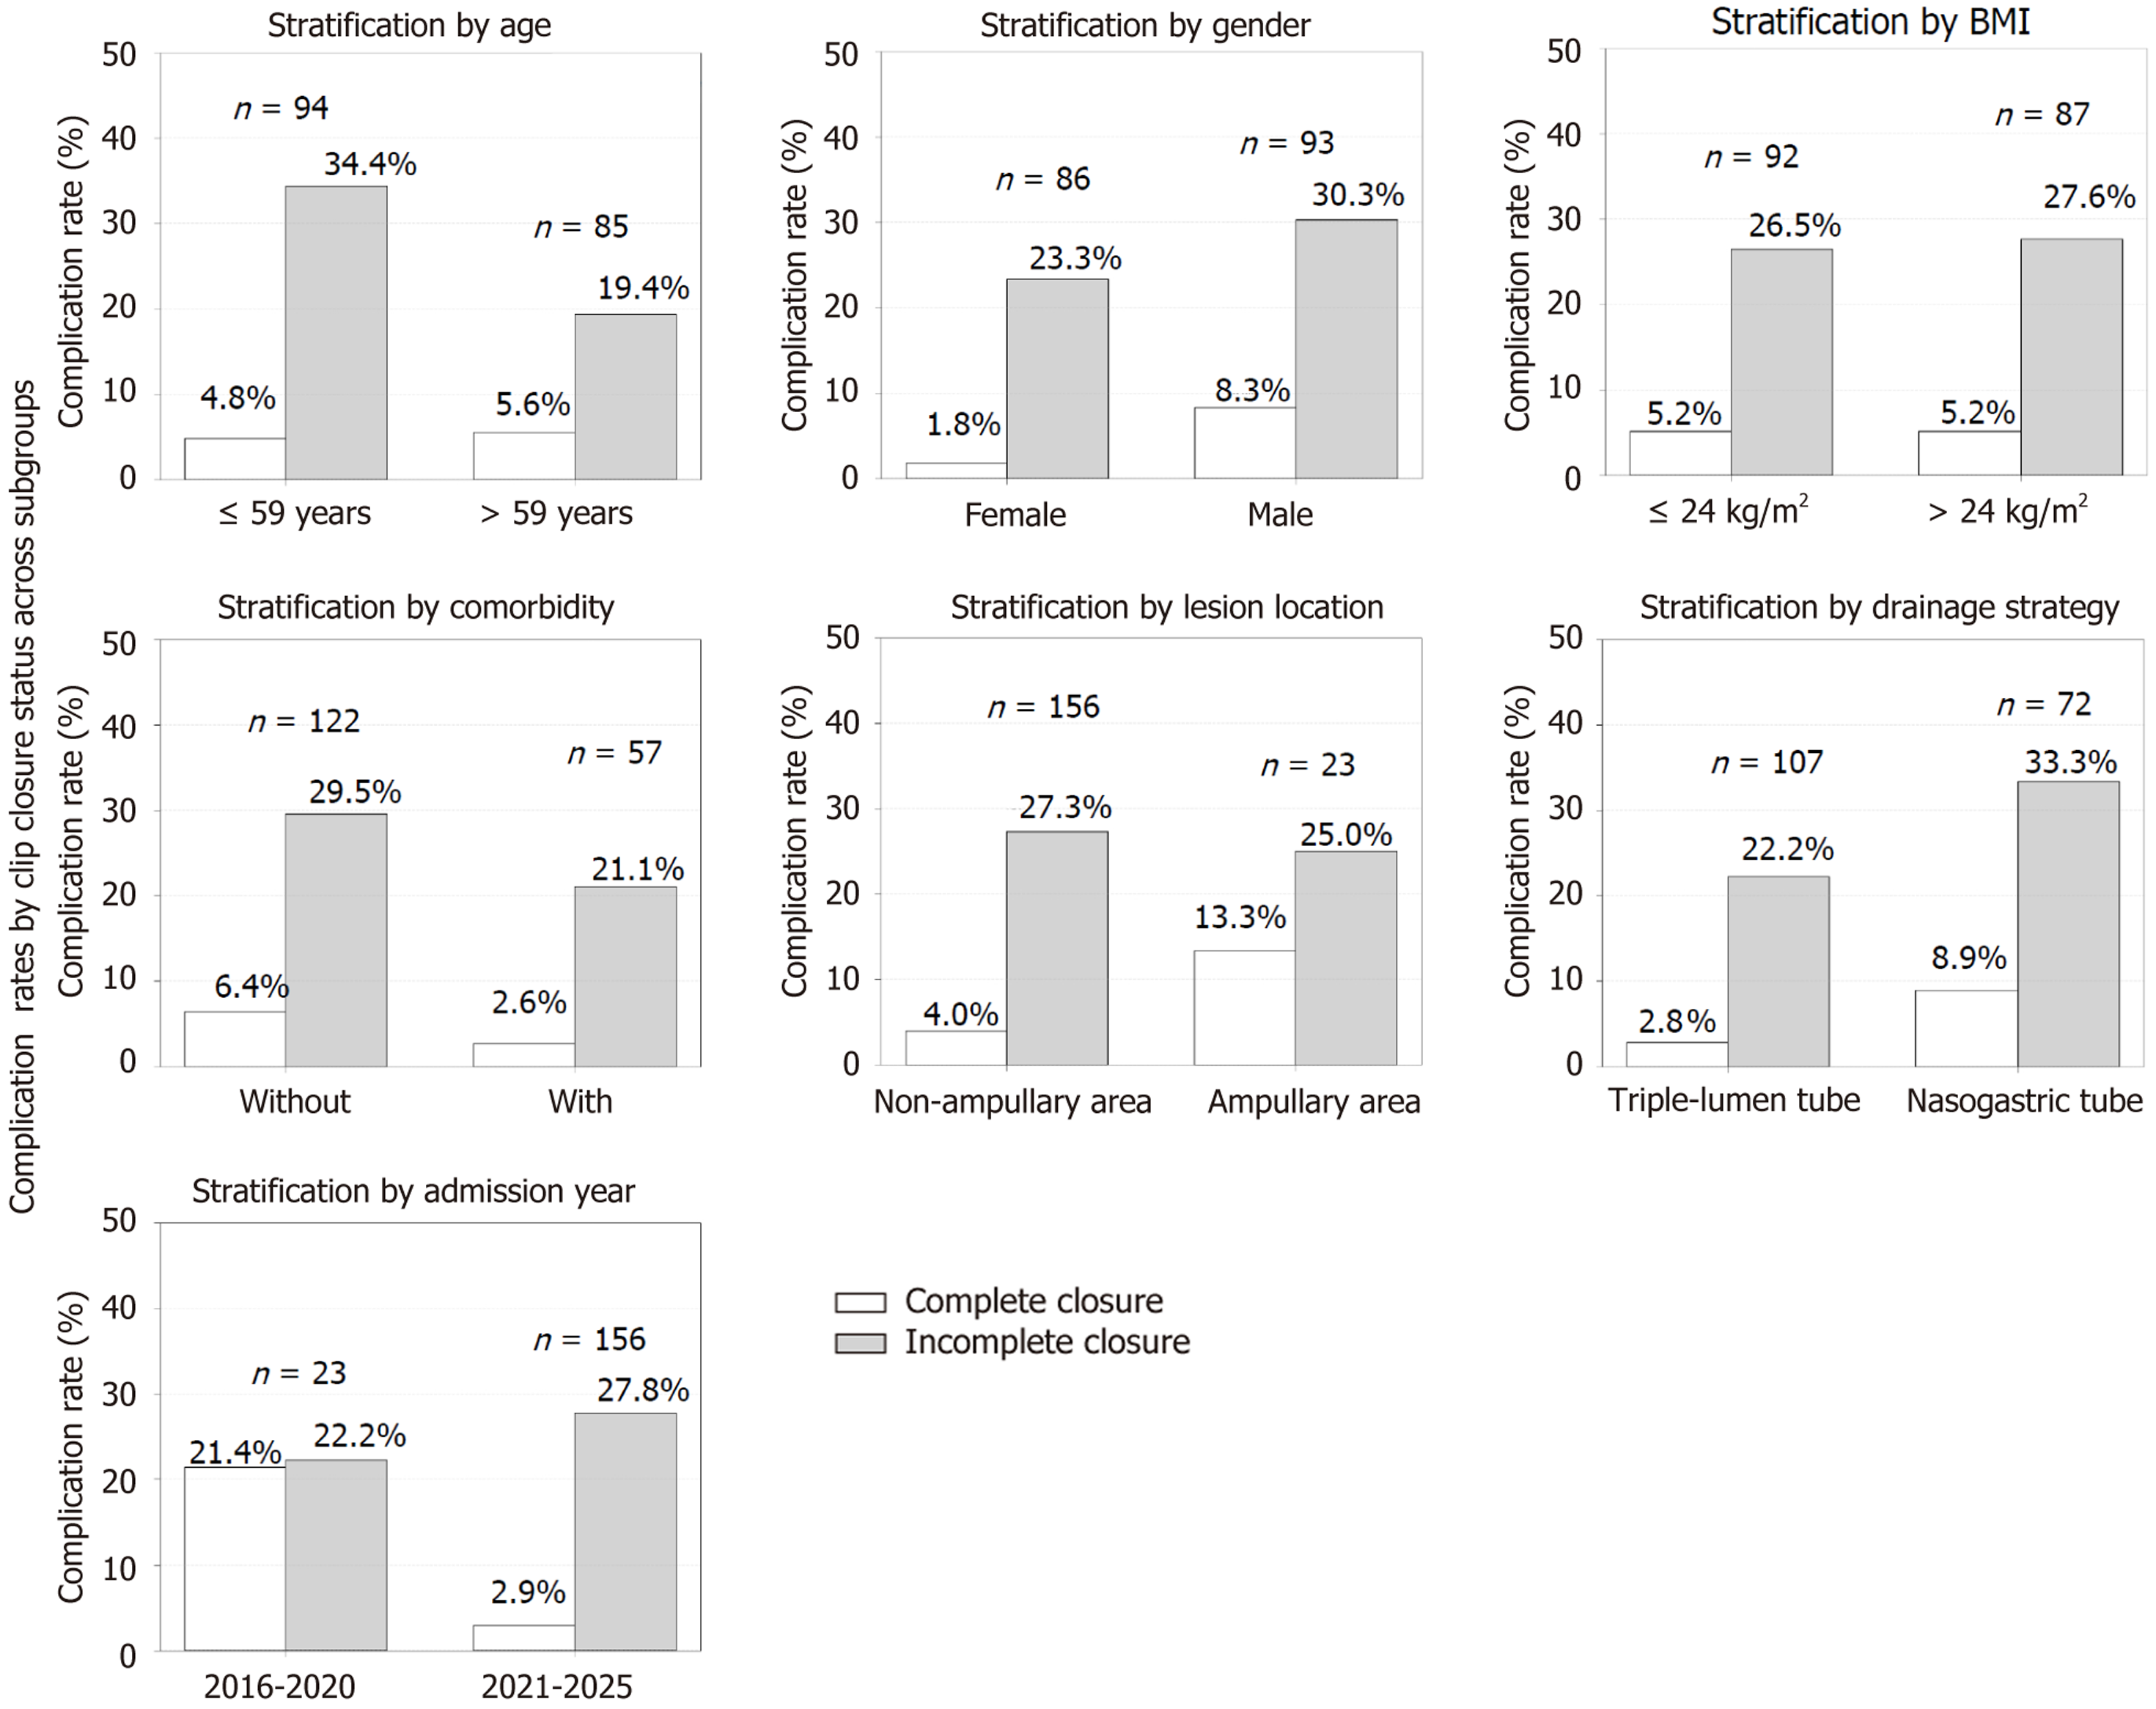
Figure 2 Subgroup χ2 analyses of the association between titanium clip closure quality and postoperative complications after duodenal endoscopic submucosal dissection.
The patients were stratified by age, gender, body mass index, comorbidity, lesion location, drainage strategy, and year of admission. The χ2 test was used within each subgroup to compare the incidence of complications between the two groups. BMI: Body mass index.
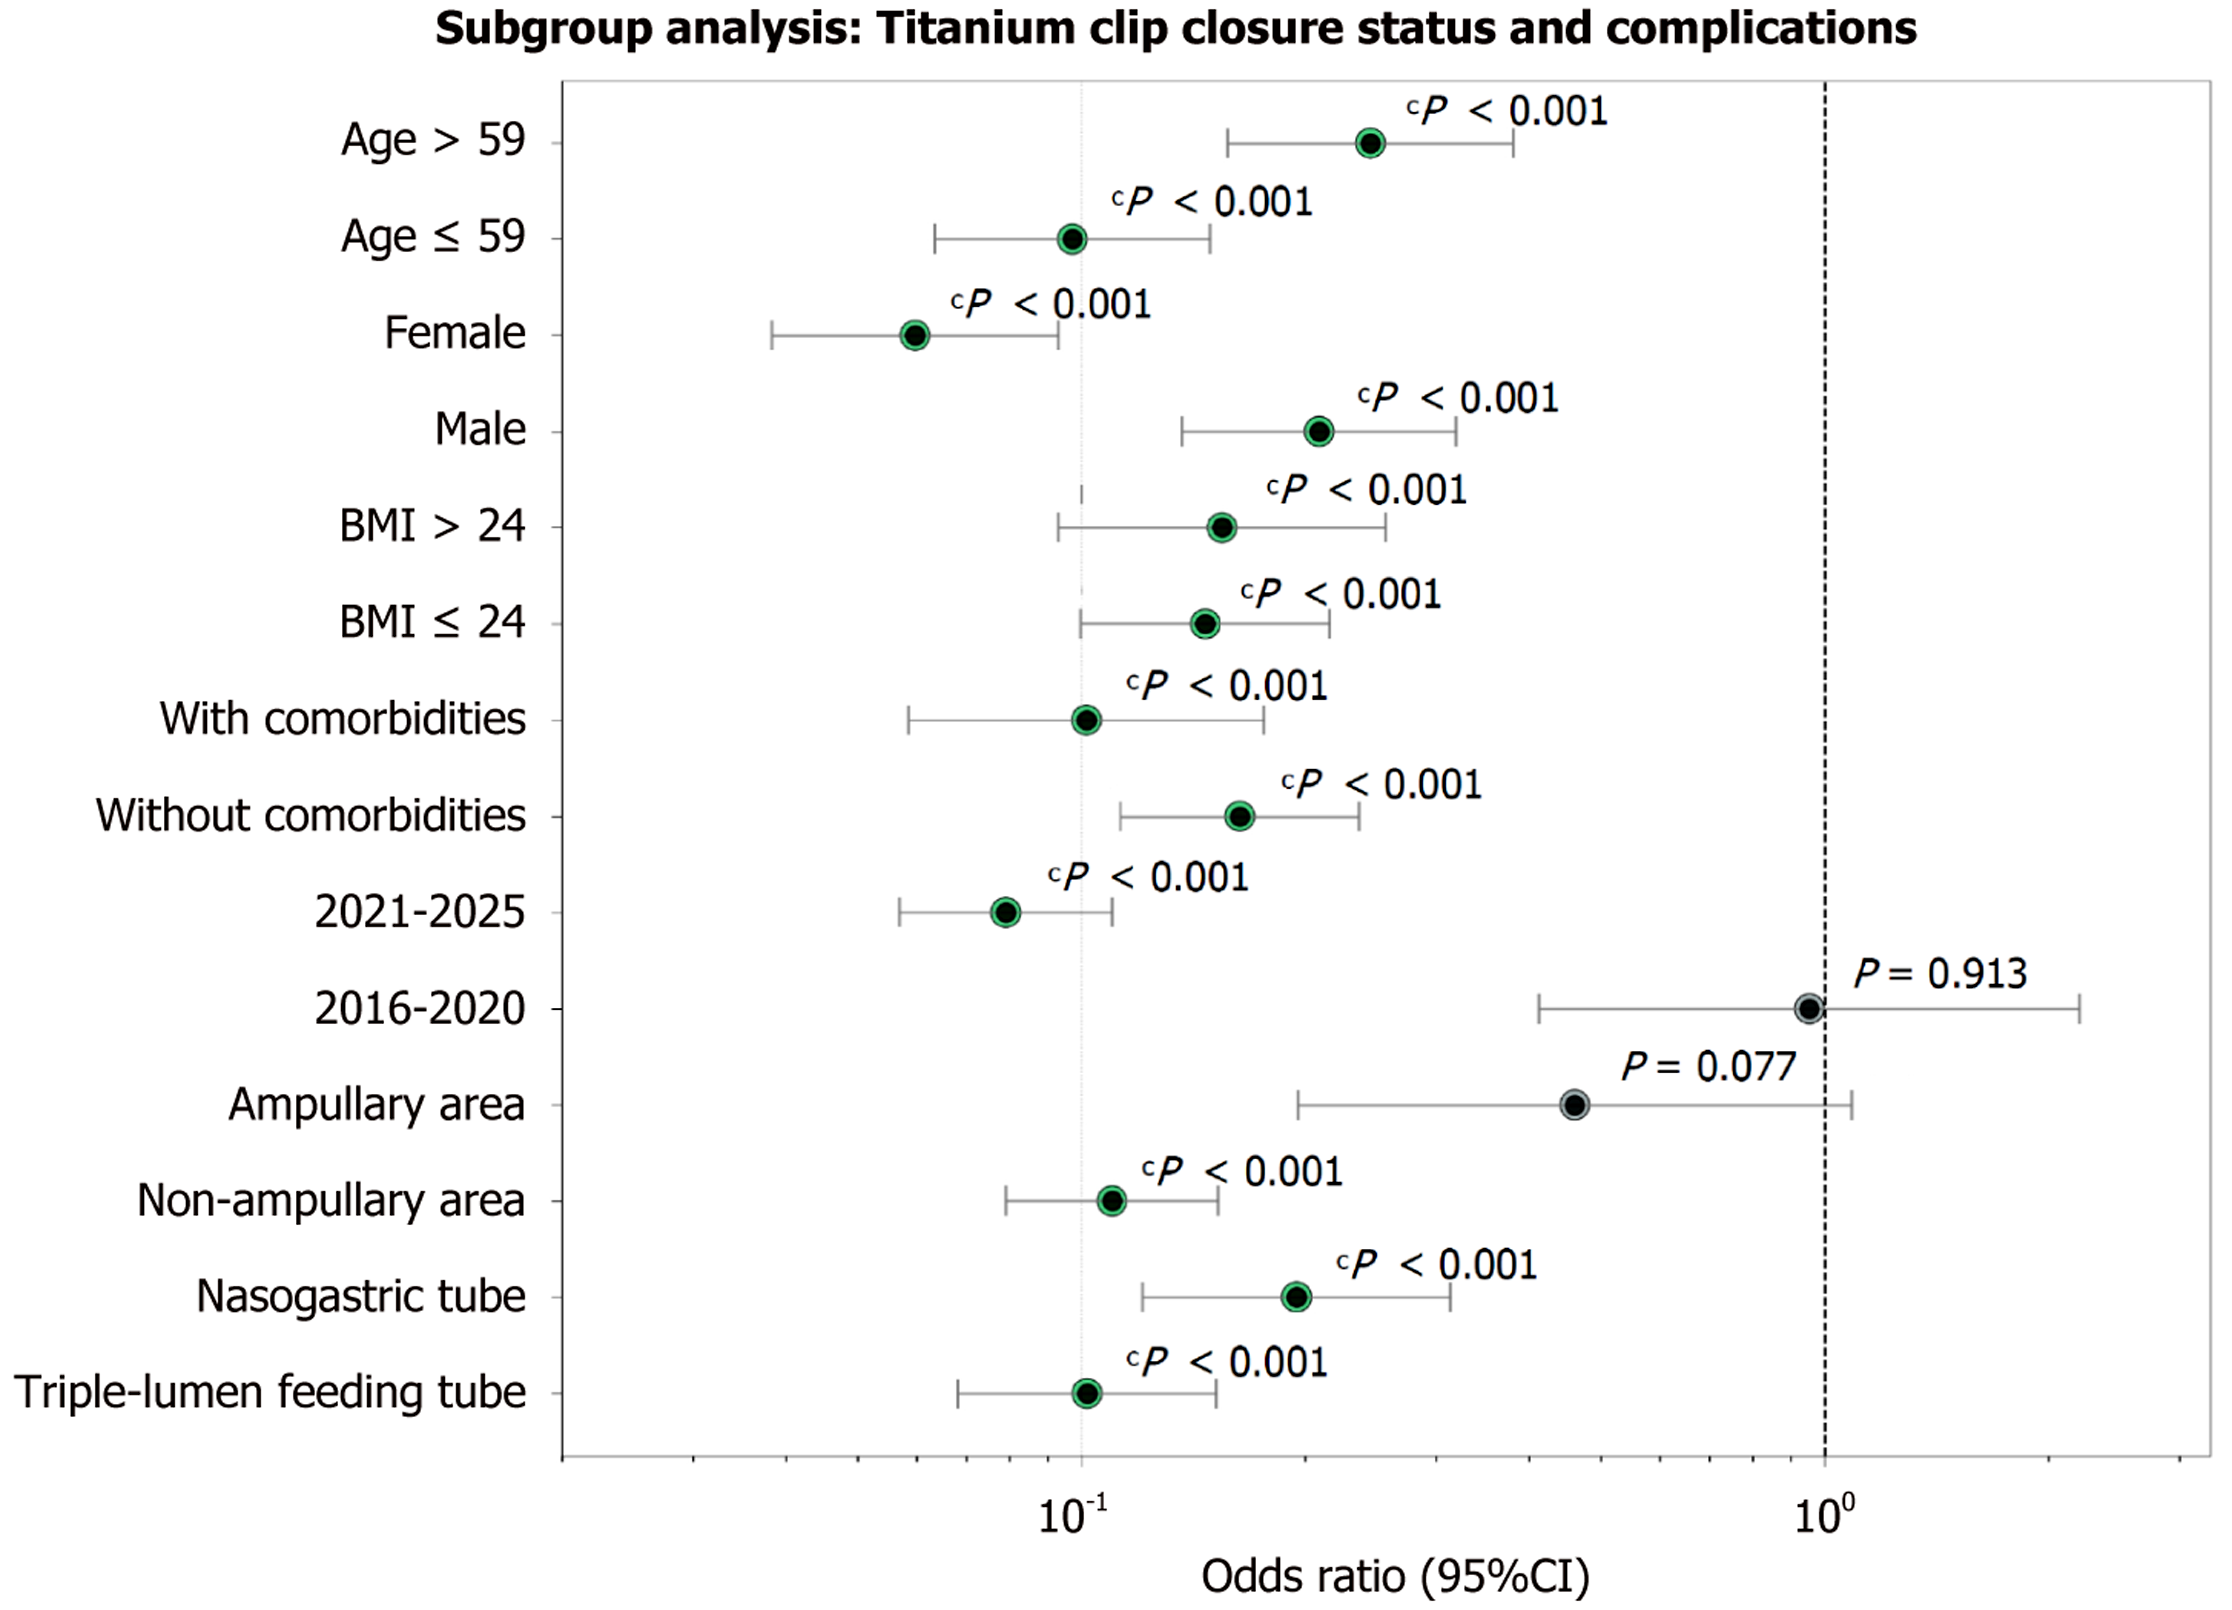
Figure 3 Subgroup logistic regression forest plot of titanium clip closure quality and postoperative complications following duodenal endoscopic submucosal dissection.
cP < 0.001. BMI: Body mass index; CI: Confidence interval.
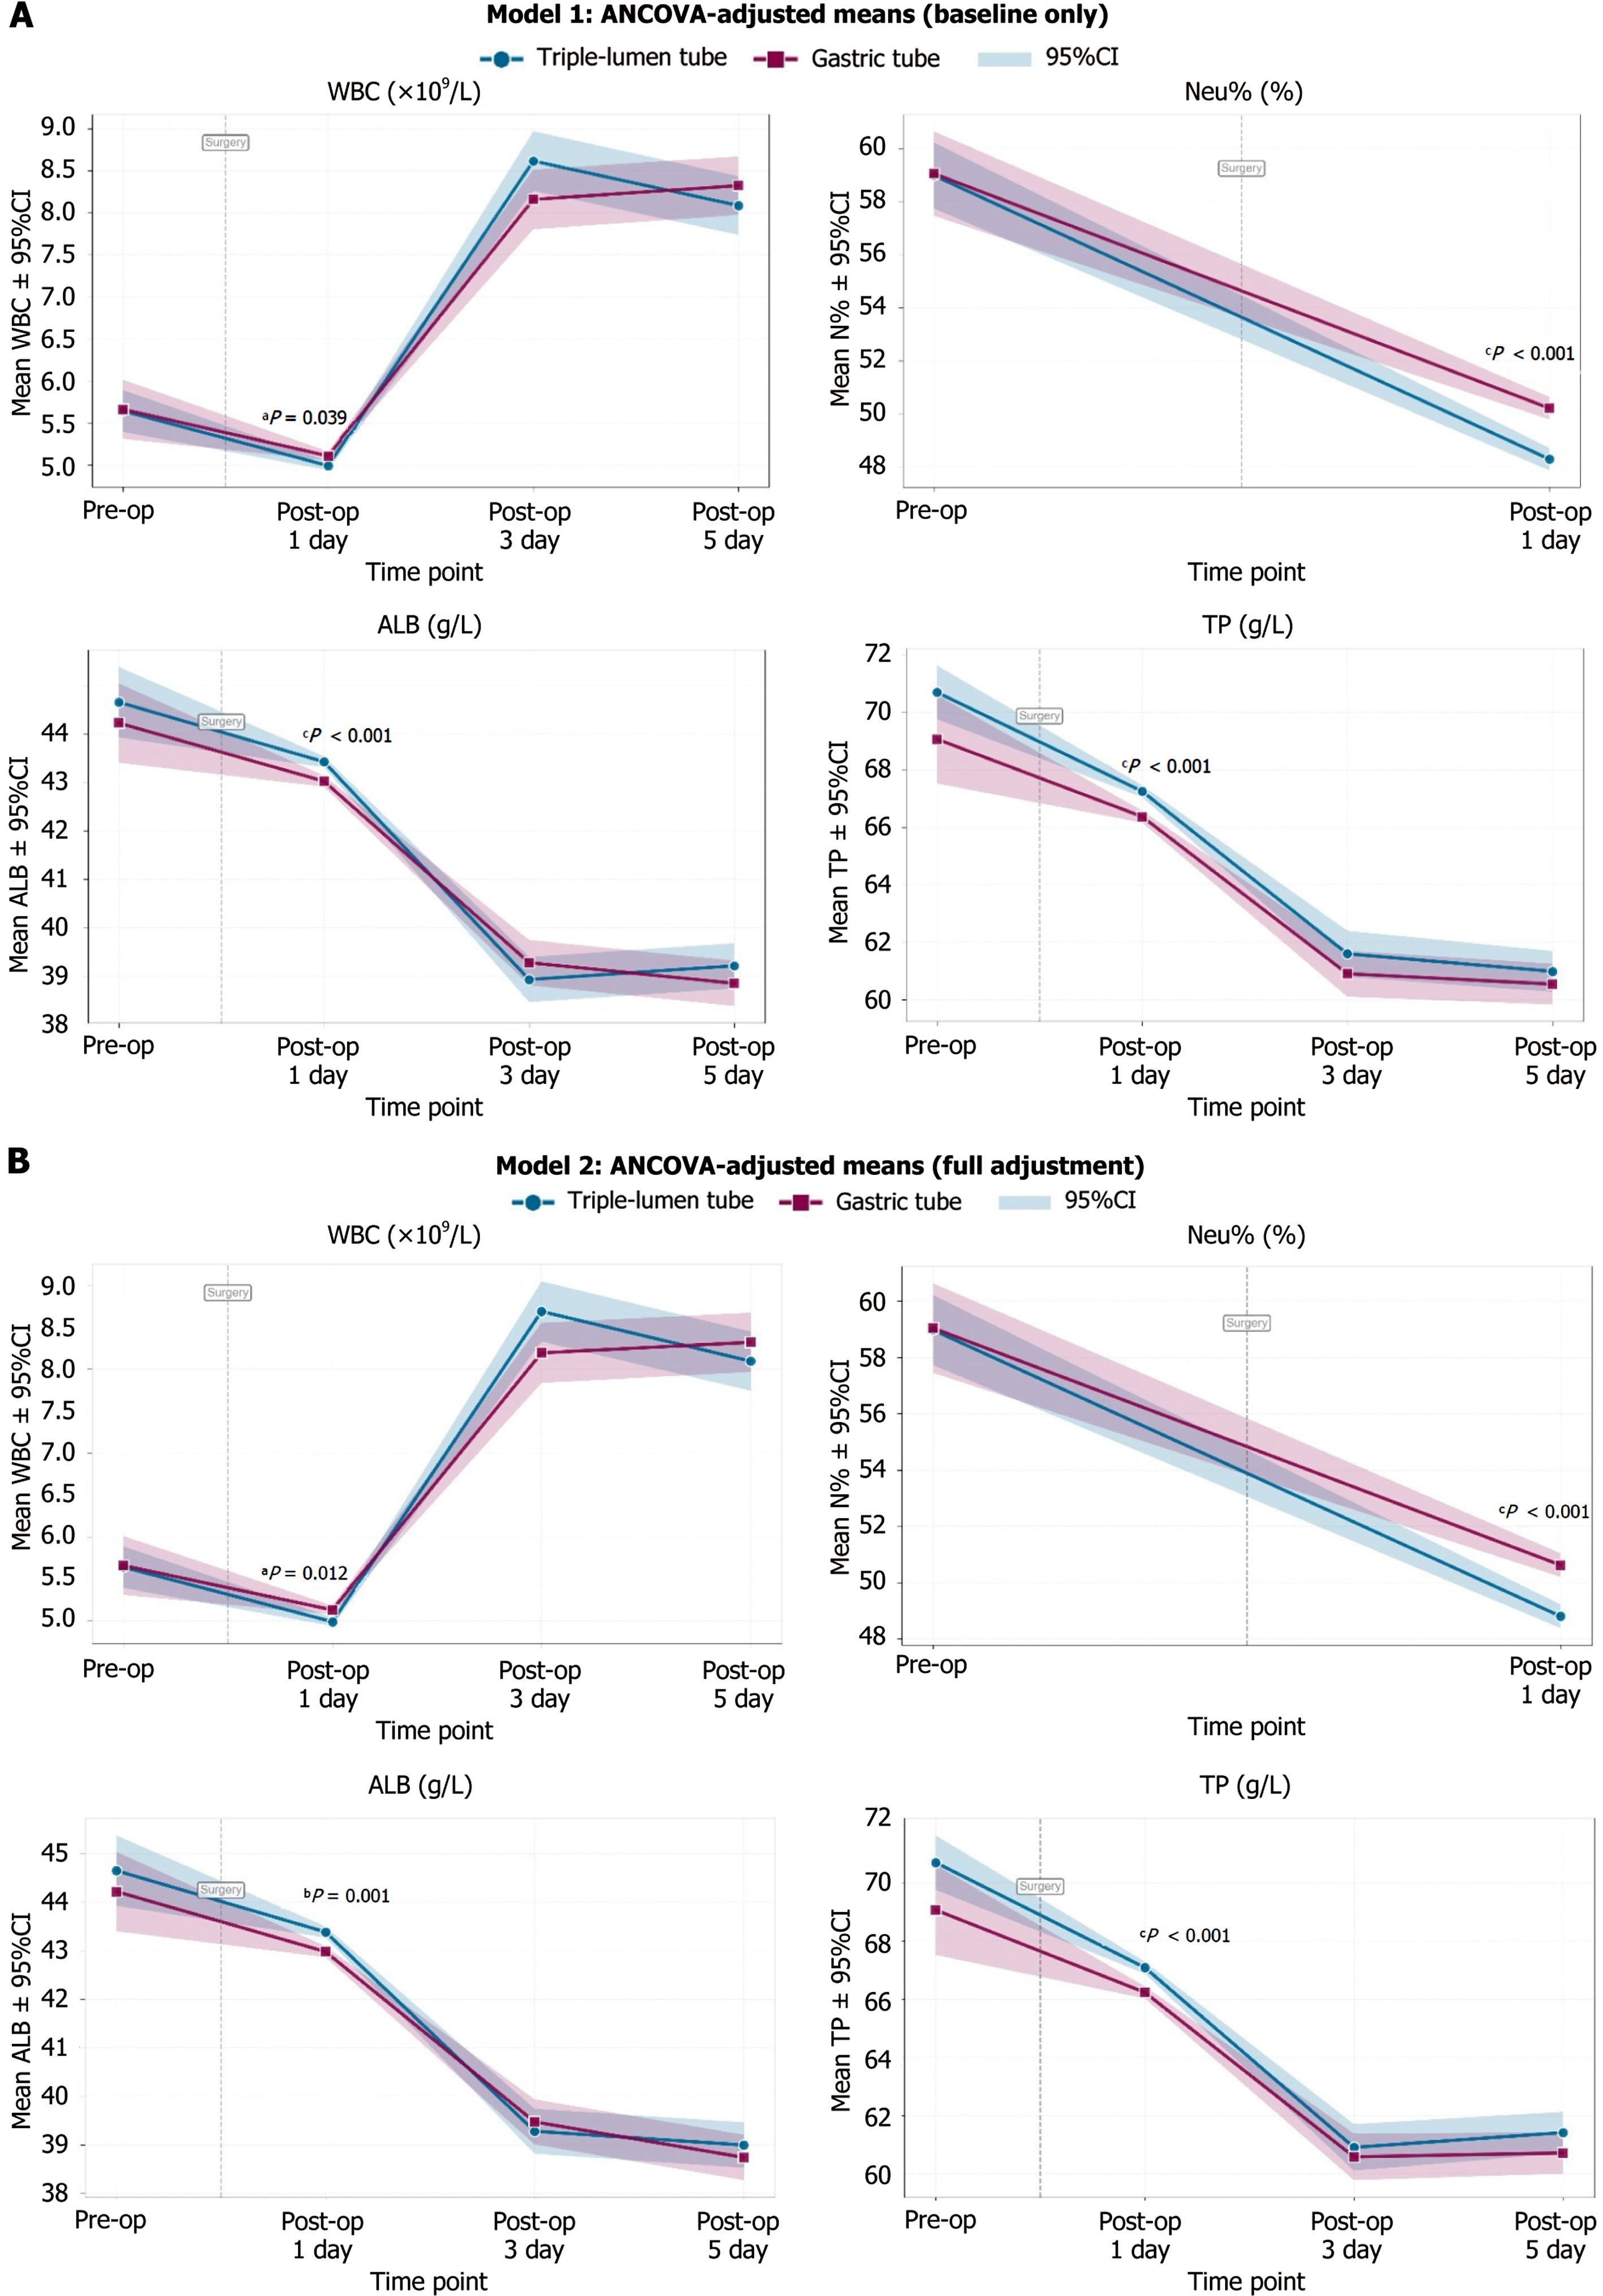
Figure 4 Associations between postoperative drainage methods and inflammatory and nutritional indicators following duodenal endoscopic submucosal dissection.
A: Model 1. The crude associations between drainage methods and postoperative indicators were assessed using analysis of covariance. Model 1 was adjusted for preoperative baseline values; B: Model 2. Based on model 1, adjustments for age, gender, body mass index, comorbidity, year of admission, lesion location, and titanium clip closure status were made using analysis of covariance to comprehensively control for potential confounding by baseline patient characteristics and analyze the associations between drainage methods and postoperative indicators. aP < 0.05. bP < 0.01. cP < 0.001. ANCOVA: Analysis of covariance; CI: Confidence interval; WBC: White blood cell; TP: Total protein; Neu%: Neutrophil percentage; ALB: Albumin.
- Citation: Song Y, Wang J, Meng F, Wu Q. Complete clip closure with staged triple-lumen feeding tube reduces delayed adverse events after duodenal endoscopic submucosal dissection. World J Gastroenterol 2026; 32(43): 121090
- URL: https://www.wjgnet.com/1007-9327/full/v32/i43/121090.htm
- DOI: https://dx.doi.org/10.3748/wjg.121090