
















Copyright: ©Author(s) 2026.
World J Gastroenterol. Nov 21, 2026; 32(43): 120660
Published online Nov 21, 2026. doi: 10.3748/wjg.120660
Published online Nov 21, 2026. doi: 10.3748/wjg.120660
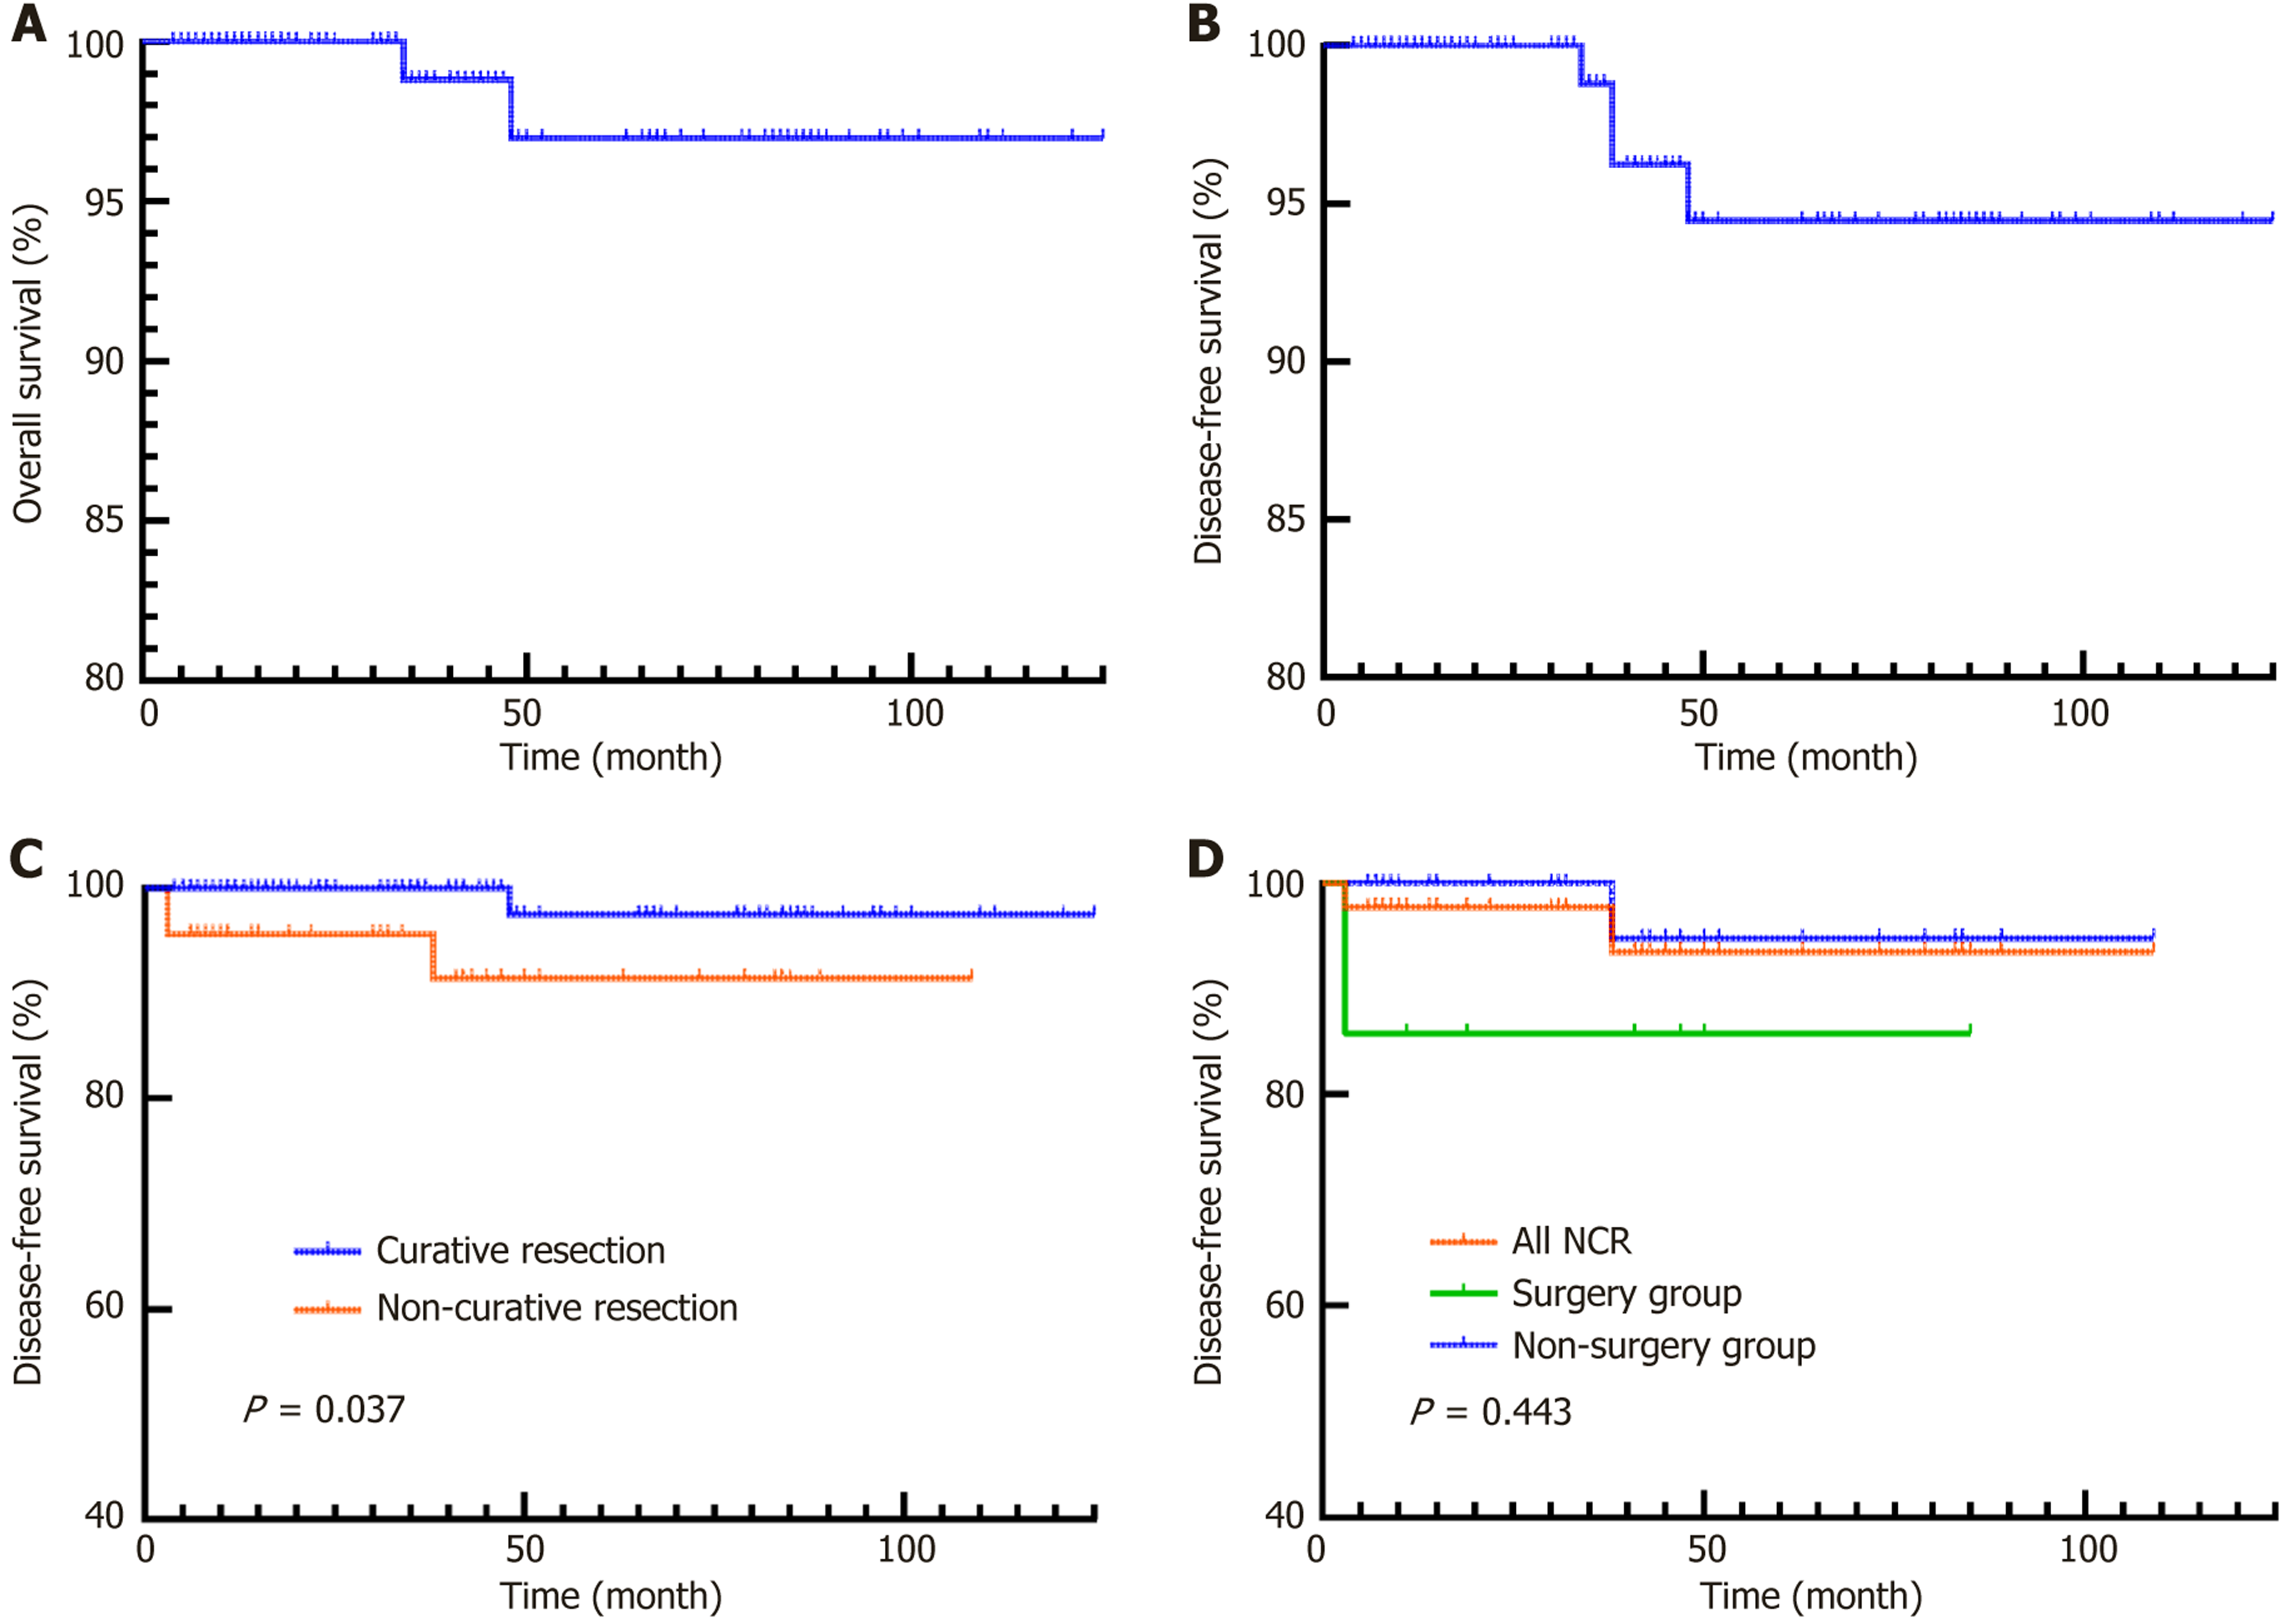
Figure 1 Kaplan-Meier curves show overall survival and disease-free survival during follow-up.
A: Overall survival; B: Disease-free survival (DFS); C: DFS curve in the curative resection subgroup; D: DFS curve in the non-curative resection subgroup. NCR: Non-curative resection.
- Citation: Zhu N, Chen MY, Li KQ, Li FL, Qin B, Jiang J, Wang SH, Wu J, Xi WT, Liu SY, Li YH, Zou BC. Endoscopic diagnosis and treatment of early gastric cardia neoplasms: Efficacy and management of non-curative resection. World J Gastroenterol 2026; 32(43): 120660
- URL: https://www.wjgnet.com/1007-9327/full/v32/i43/120660.htm
- DOI: https://dx.doi.org/10.3748/wjg.120660