
















Copyright: ©Author(s) 2026.
World J Gastroenterol. Nov 21, 2026; 32(43): 120562
Published online Nov 21, 2026. doi: 10.3748/wjg.120562
Published online Nov 21, 2026. doi: 10.3748/wjg.120562
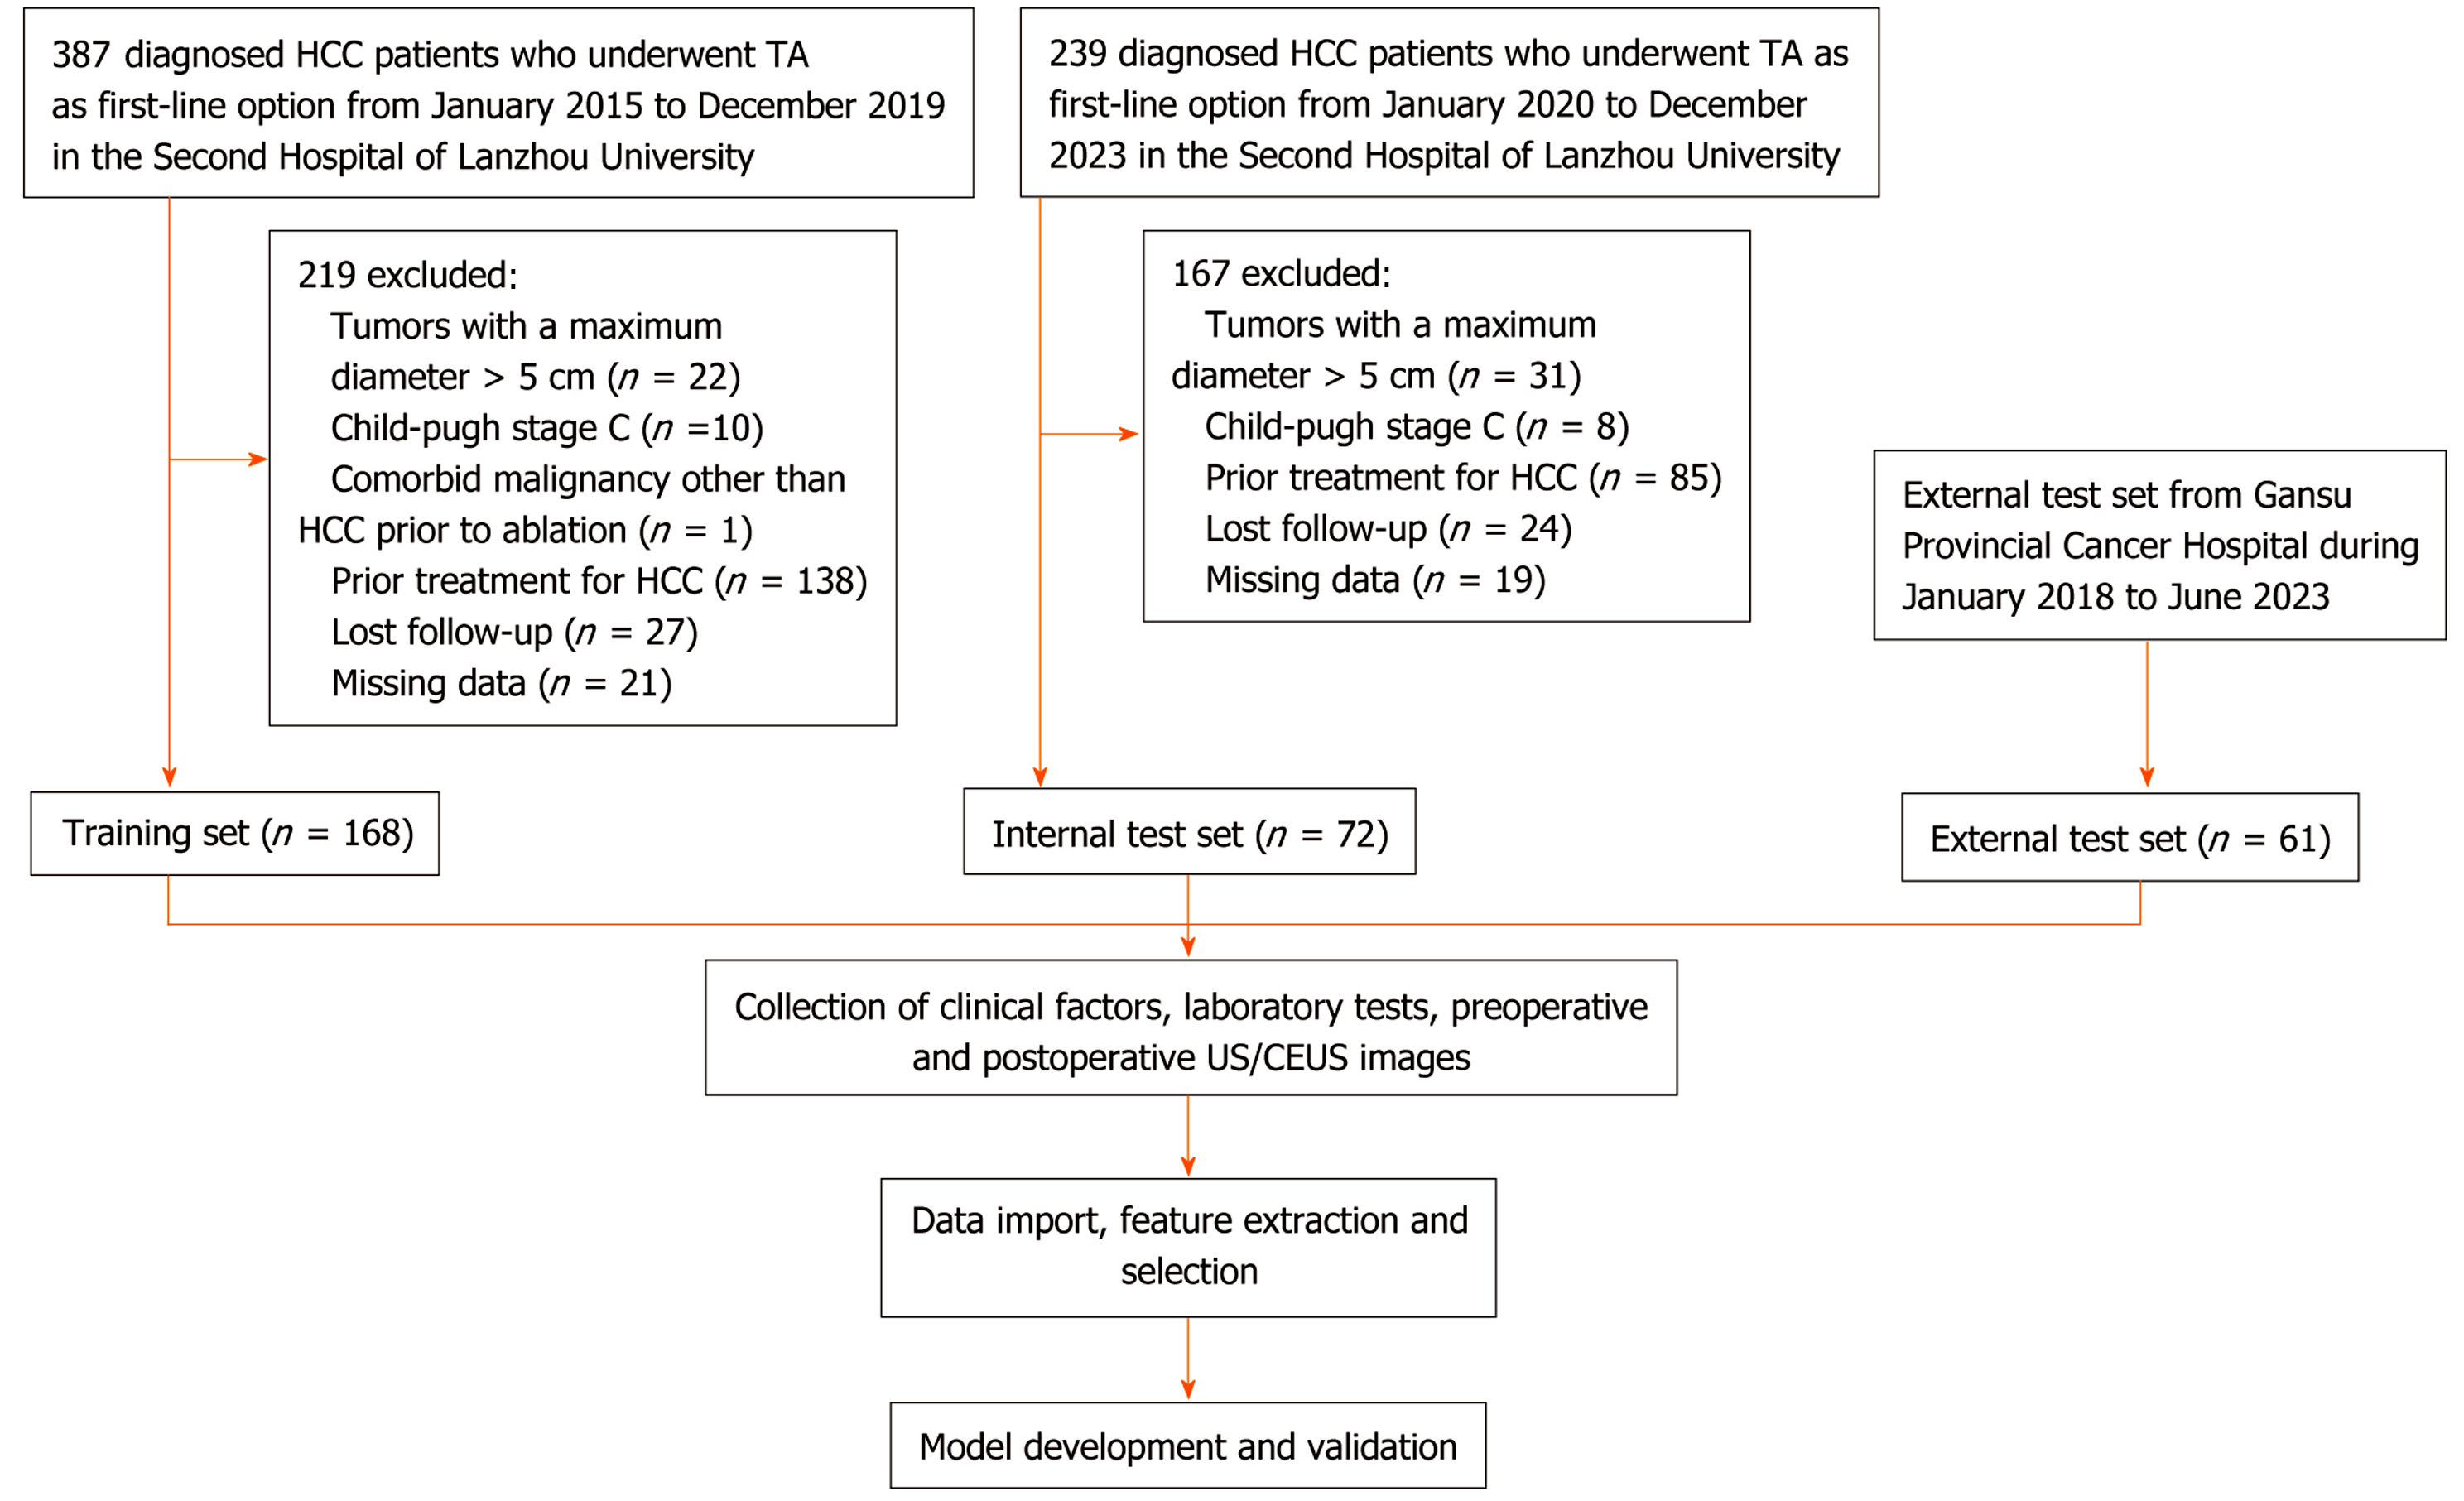
Figure 1 Study inclusion and exclusion flowchart.
HCC: Hepatocellular carcinoma; TA: Thermal ablation; US: Ultrasound; CEUS: Contrast-enhanced ultrasound.
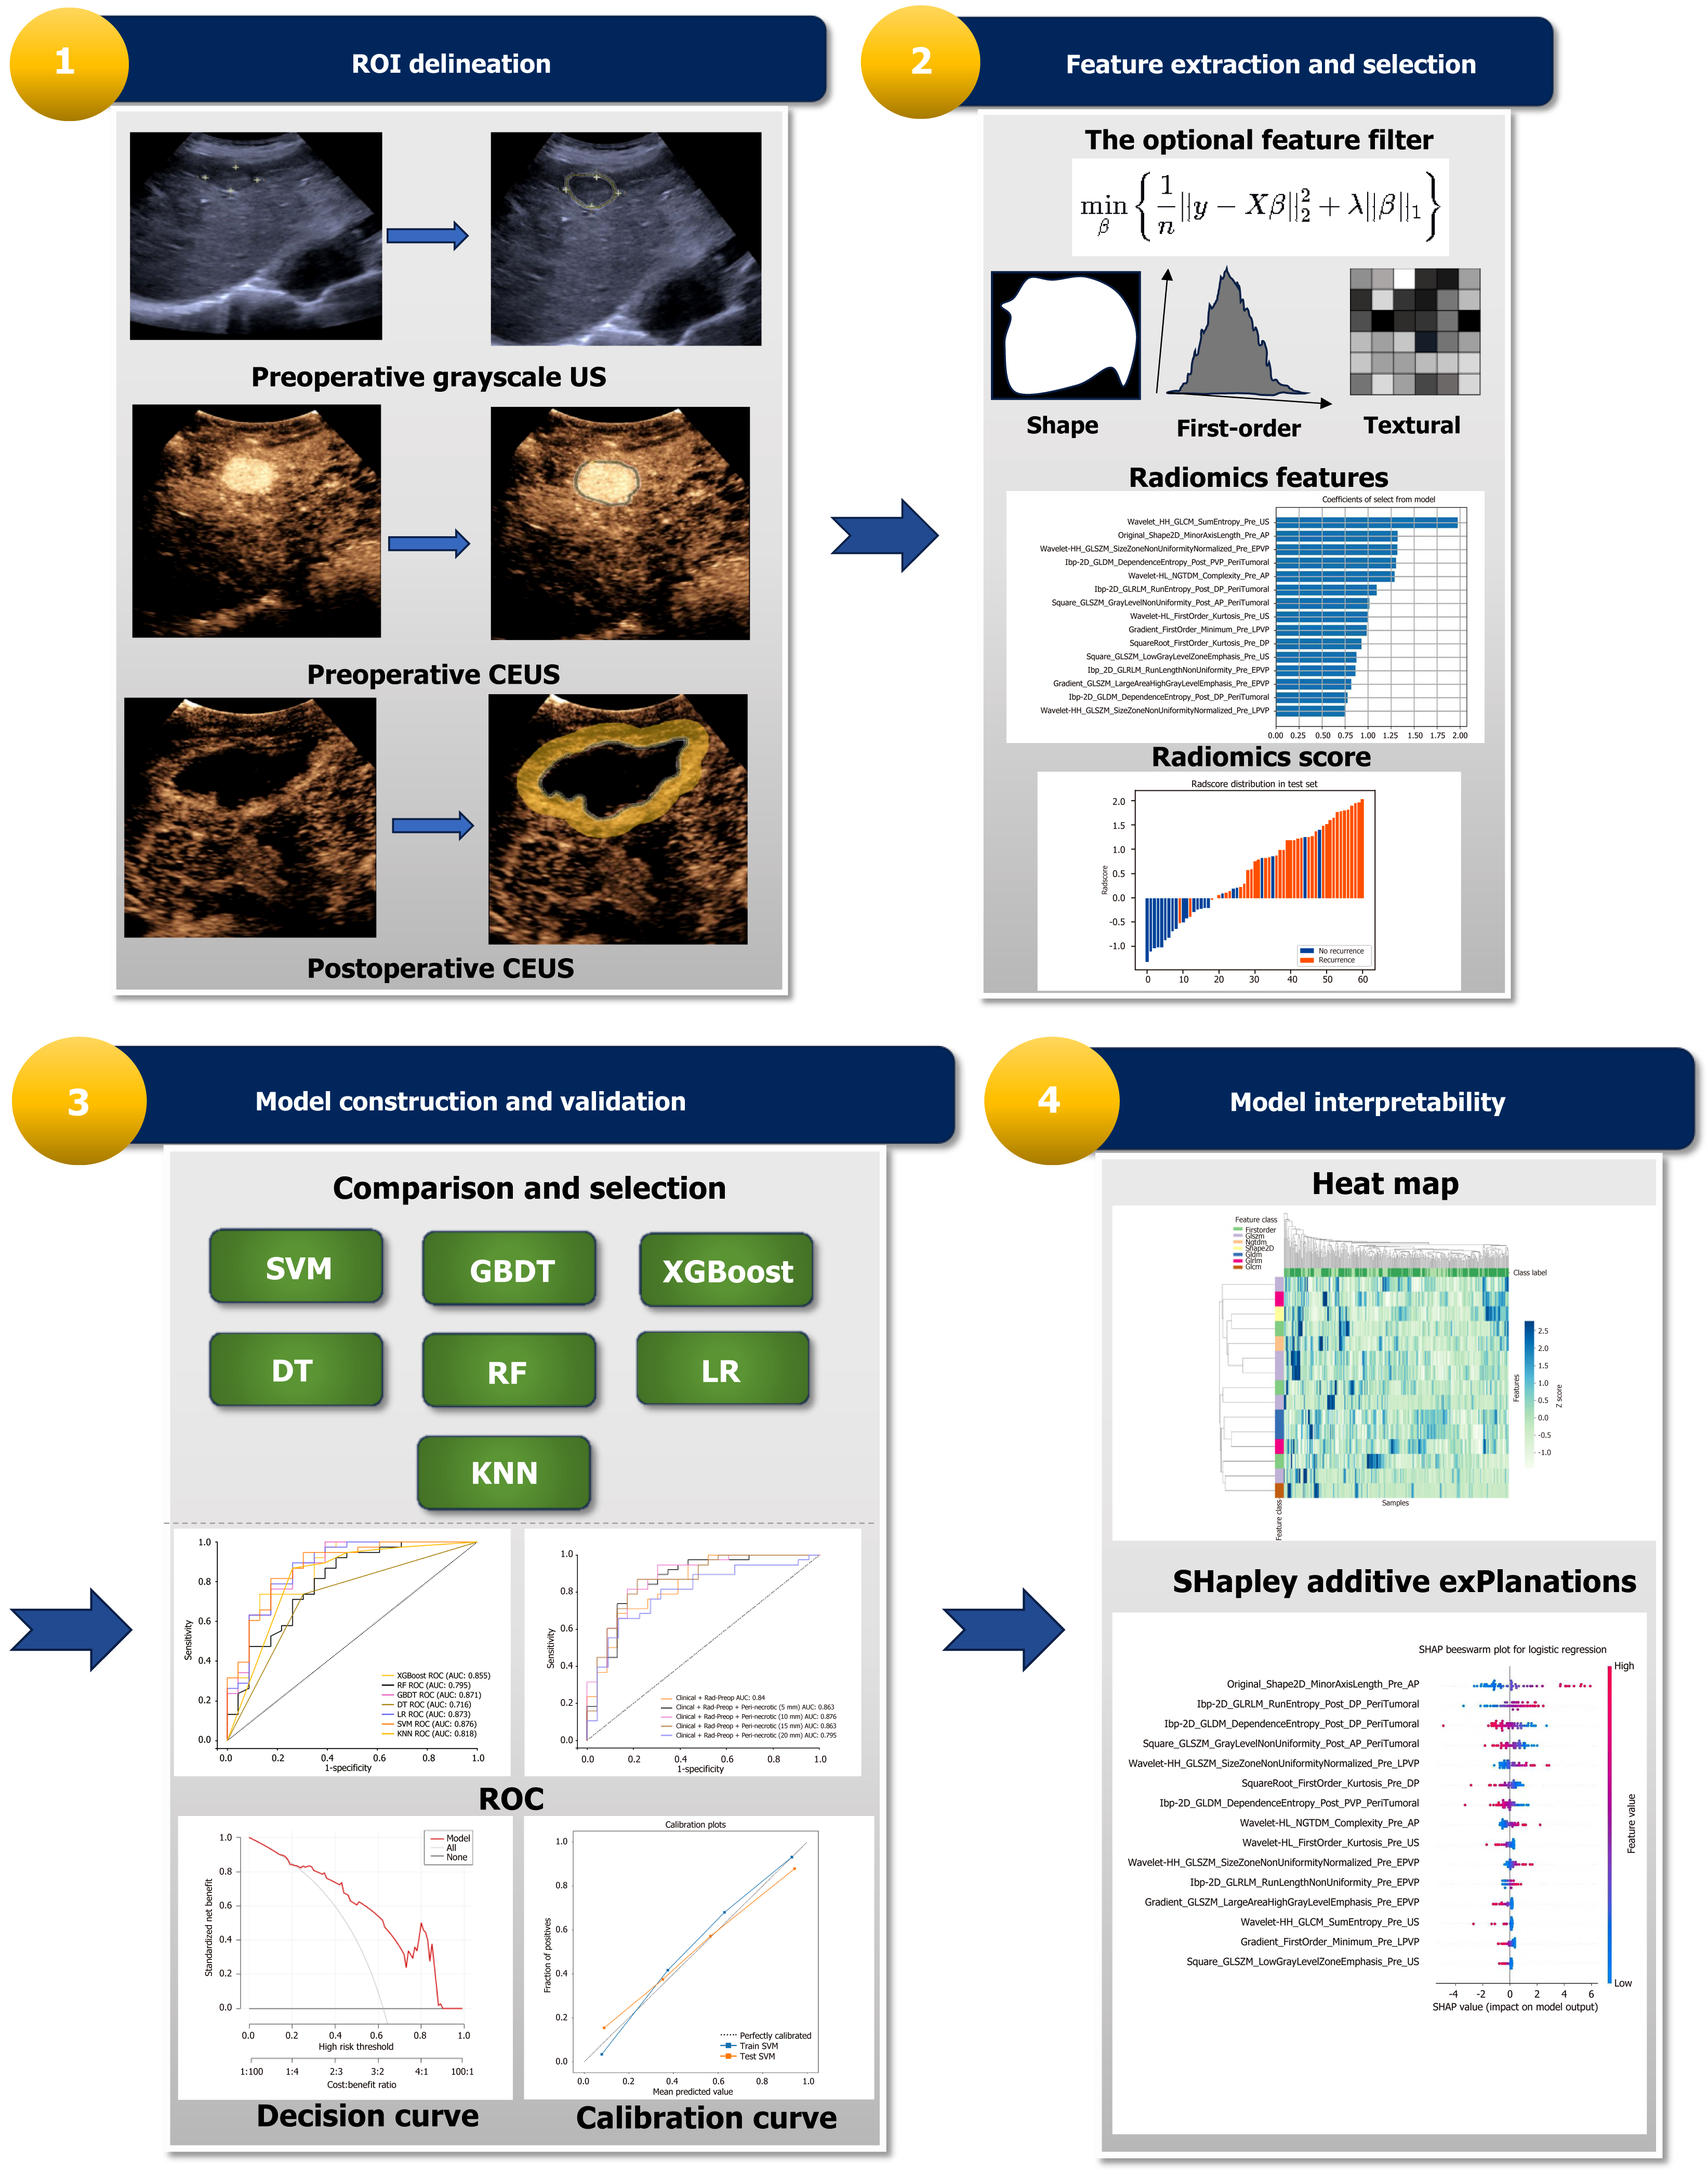
Figure 2 Flowchart of the process from region of interest delineation on original ultrasound images to final prediction model cons
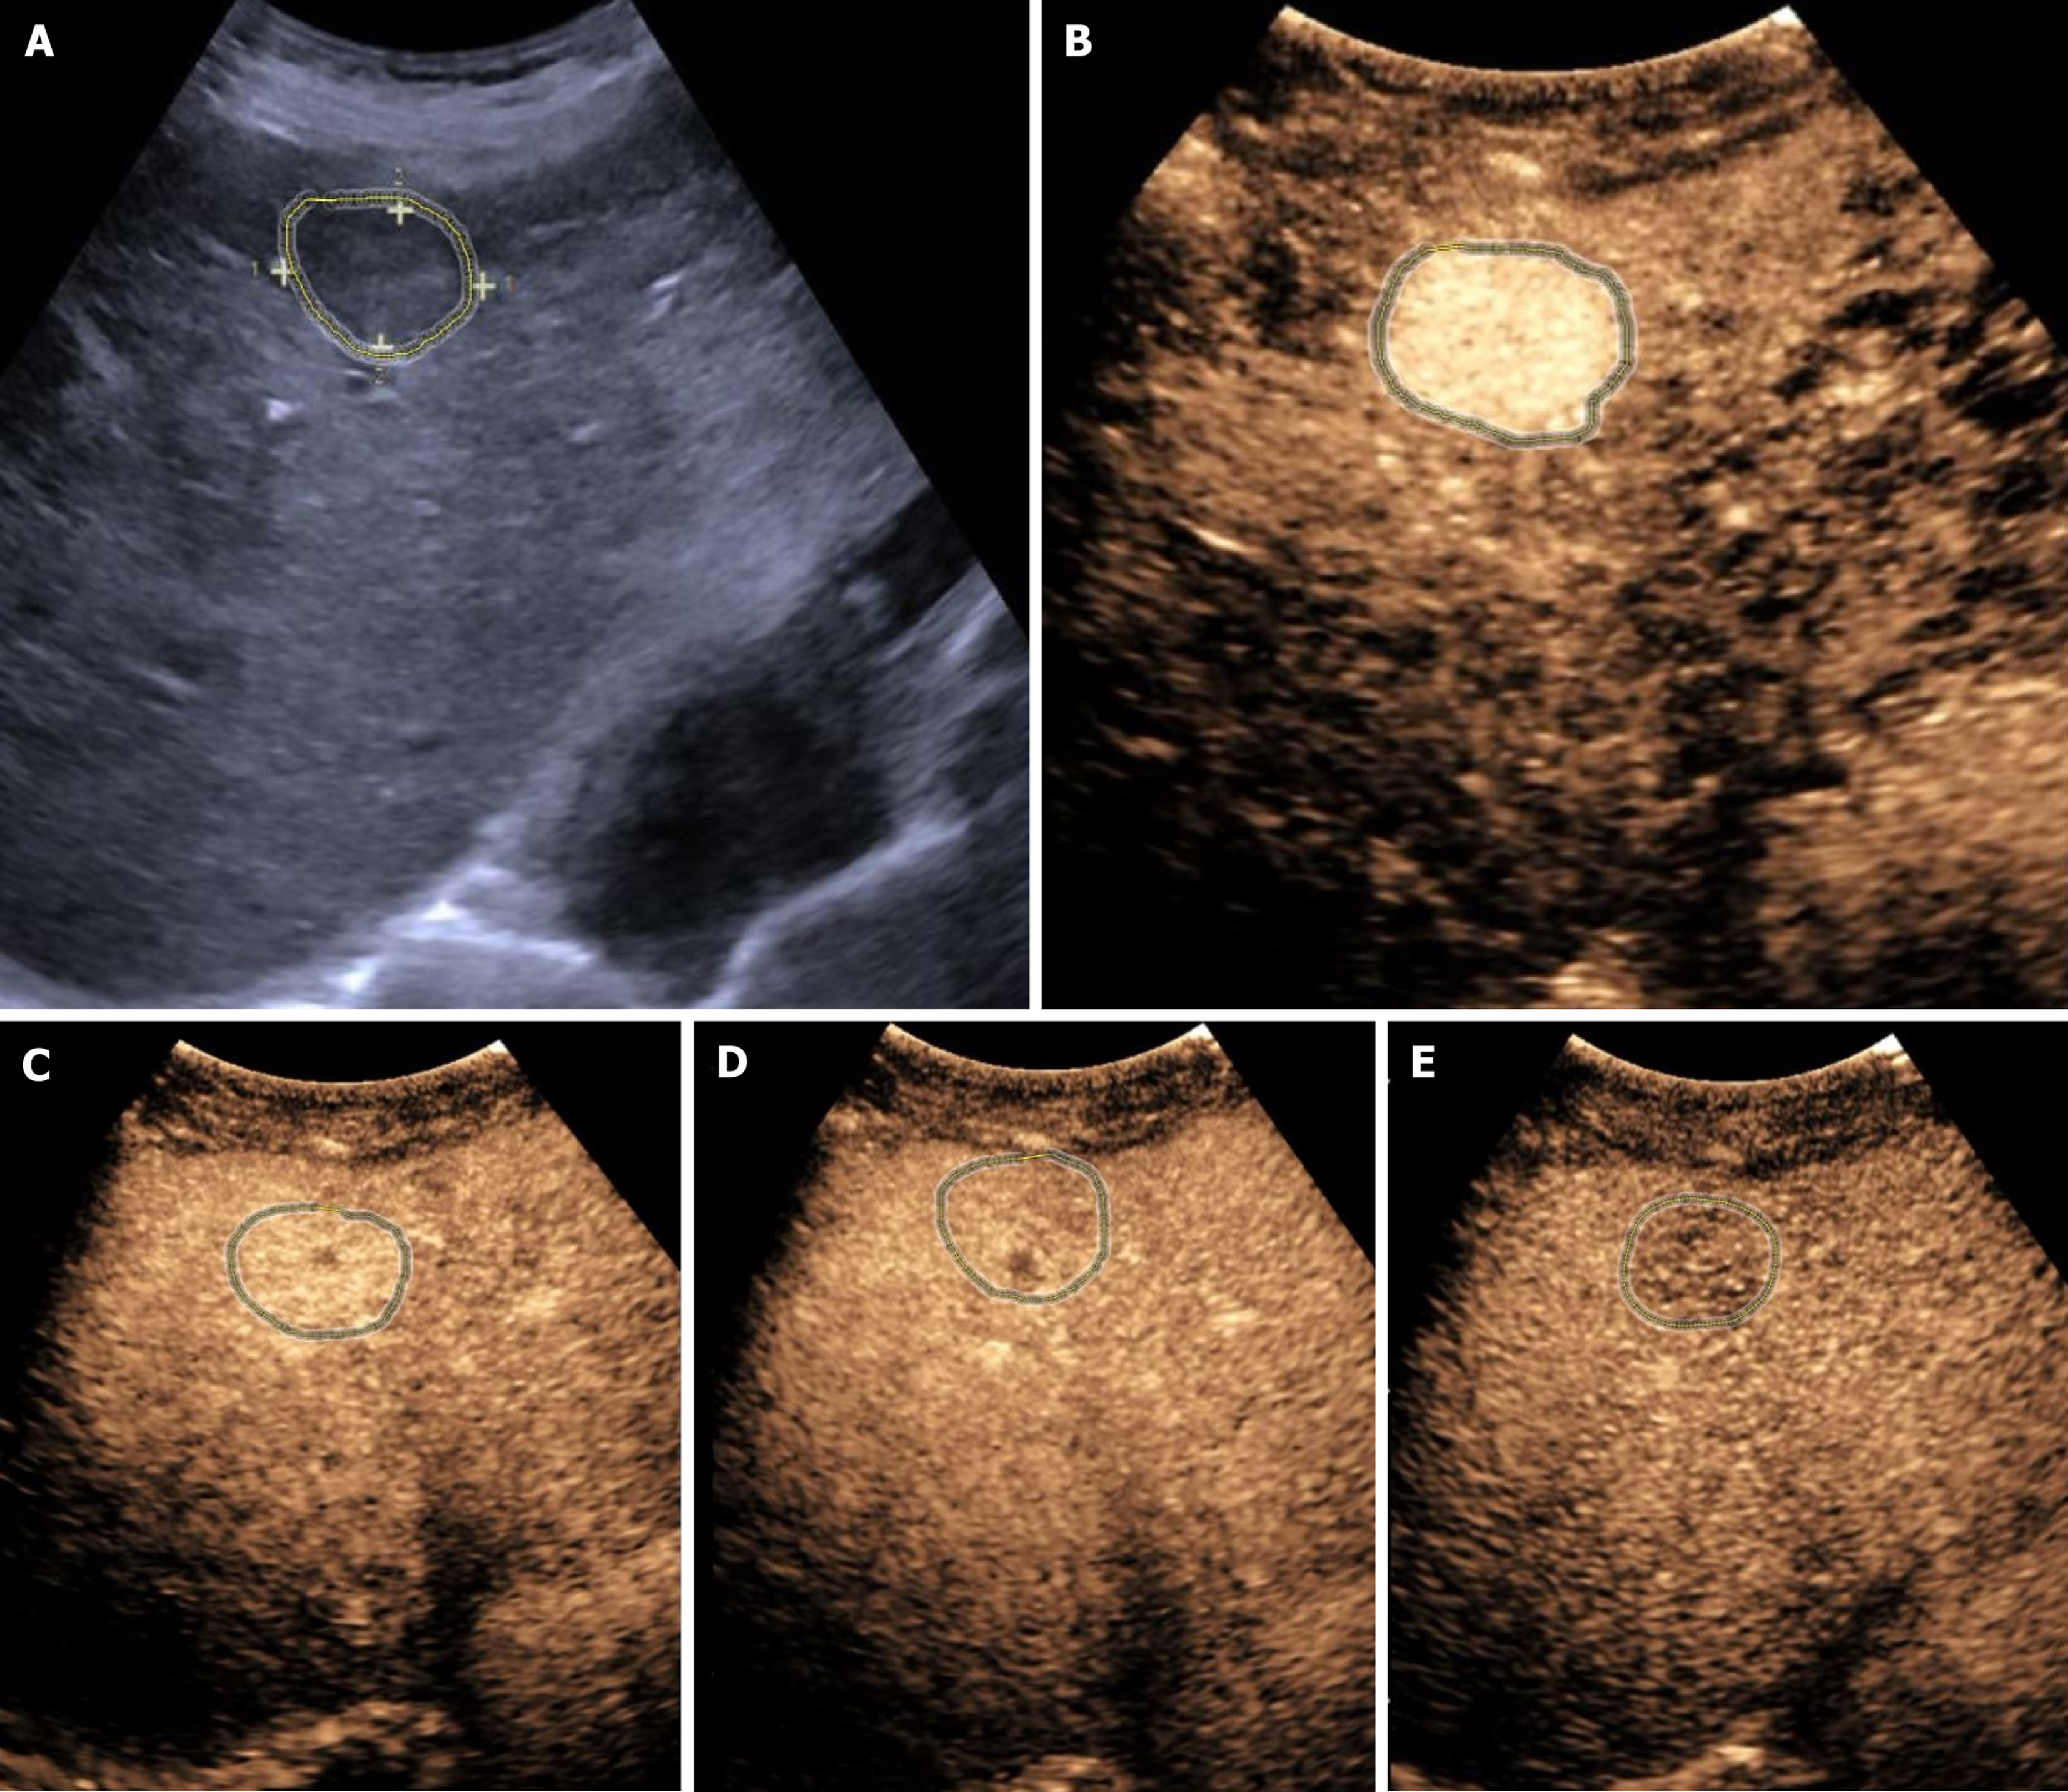
Figure 3 Pre-operative target lesion regions of interest were delineated and analyzed.
A: Gray-scale ultrasound; B: The arterial phase of contrast-enhanced ultrasound; C: The early portal venous phase; D: The late portal venous phase; E: The delayed phase.
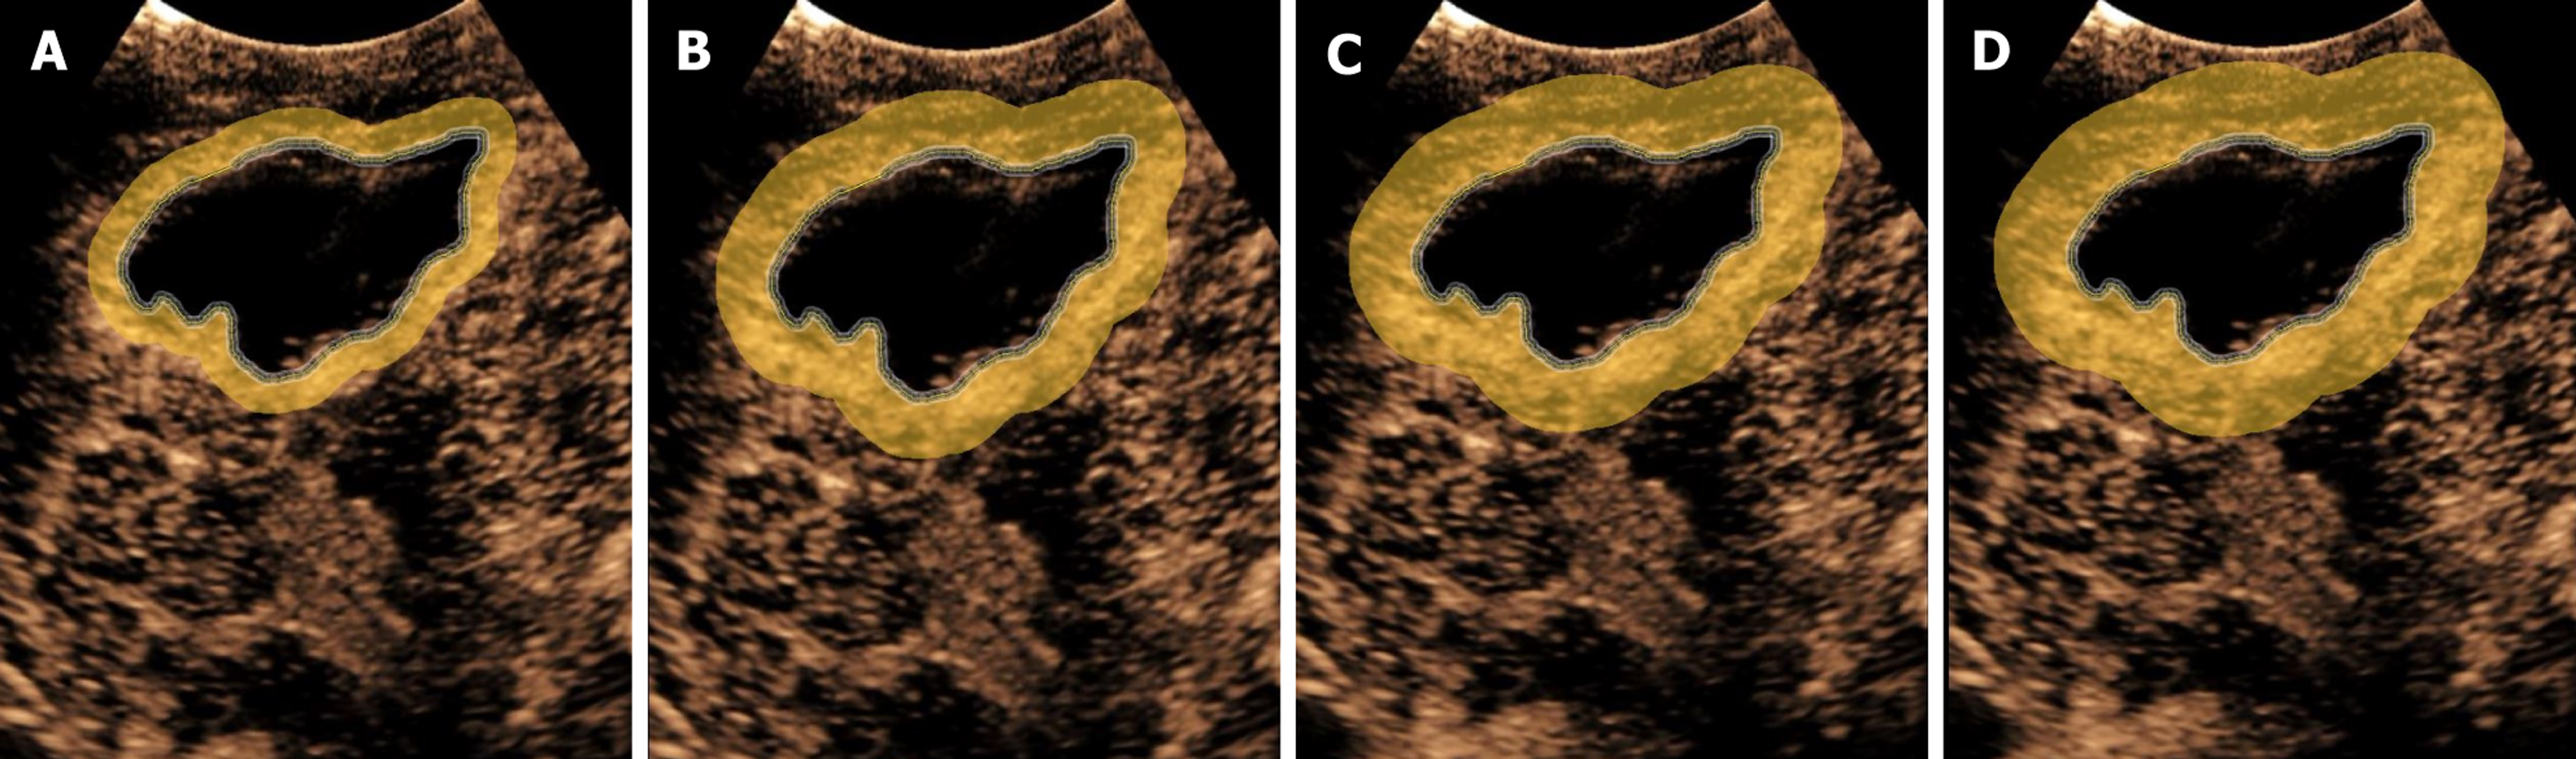
Figure 4 Delineation of the ablation zone margin and feature extraction from the peri-ablation region.
Automated delineation of peri-ablation rims for feature extraction as yellow annuli. A: 5 mm peri-ablation rim; B: 10 mm peri-ablation rim; C: 15 mm peri-ablation rim; D: 20 mm peri-ablation rim.
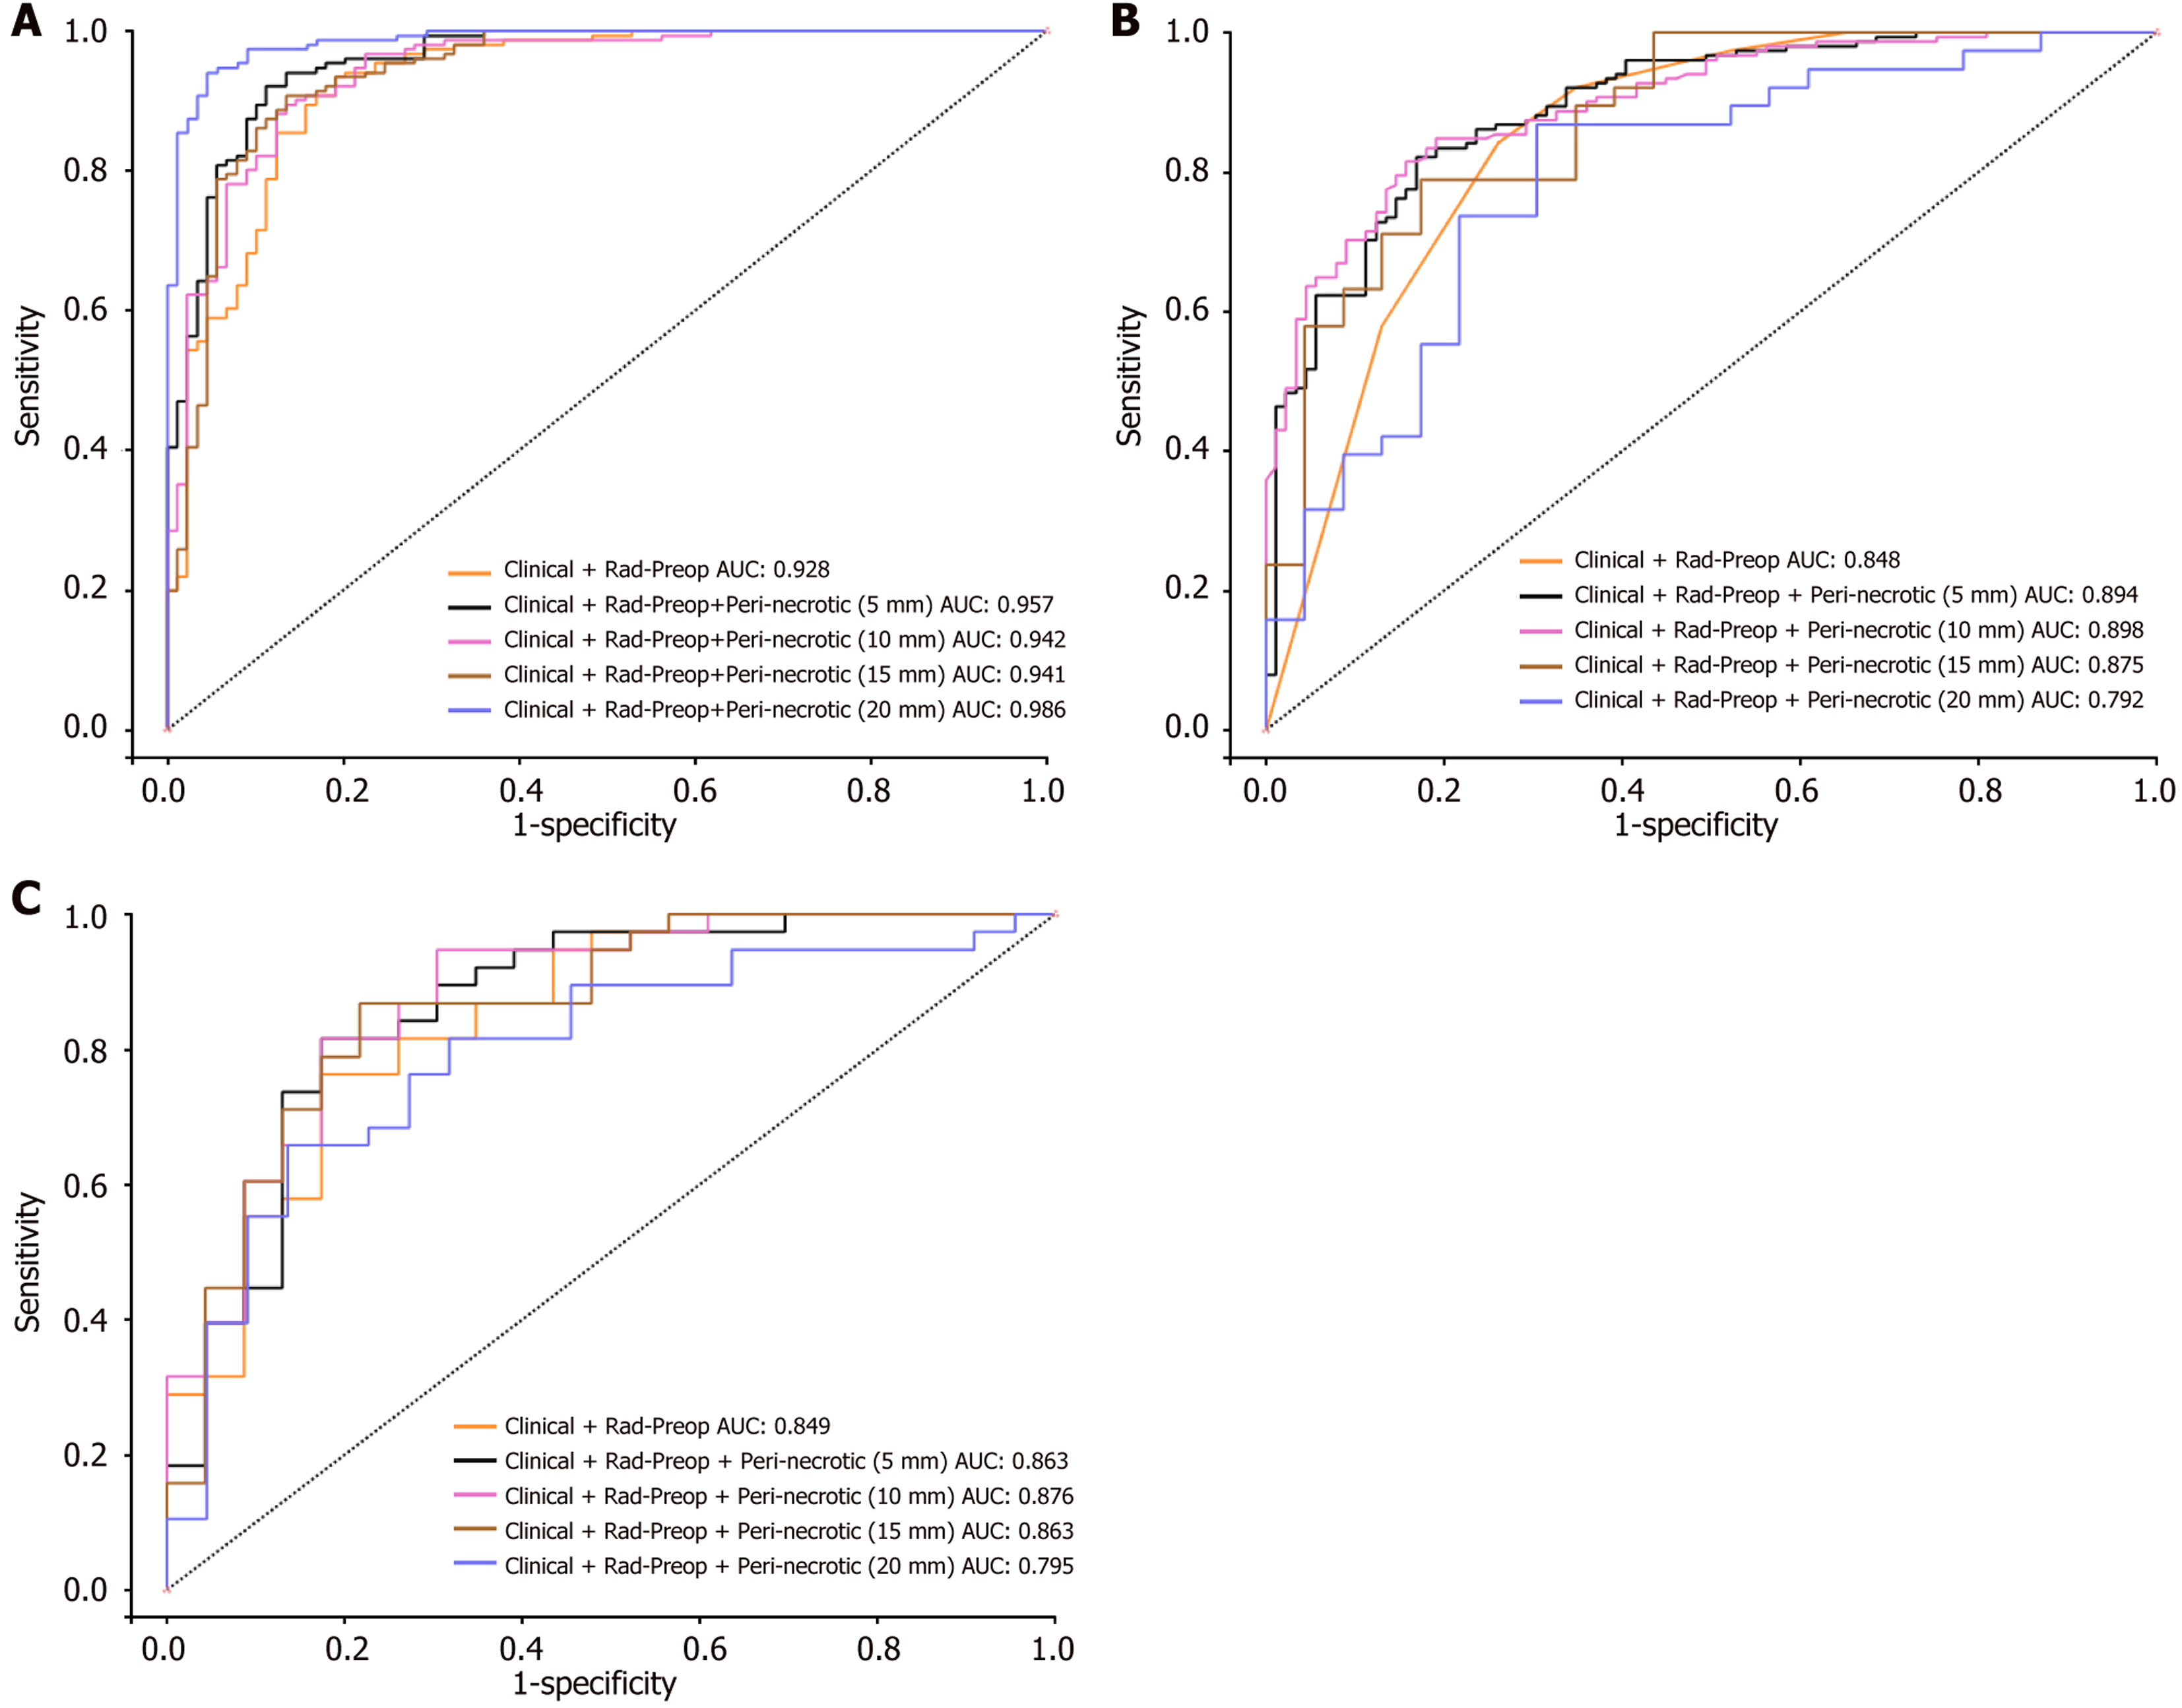
Figure 5 Comparison of receiver operating characteristic curves for different models.
A: Training set; B: Internal validation set; C: External validation set. AUC: Area under the curve.
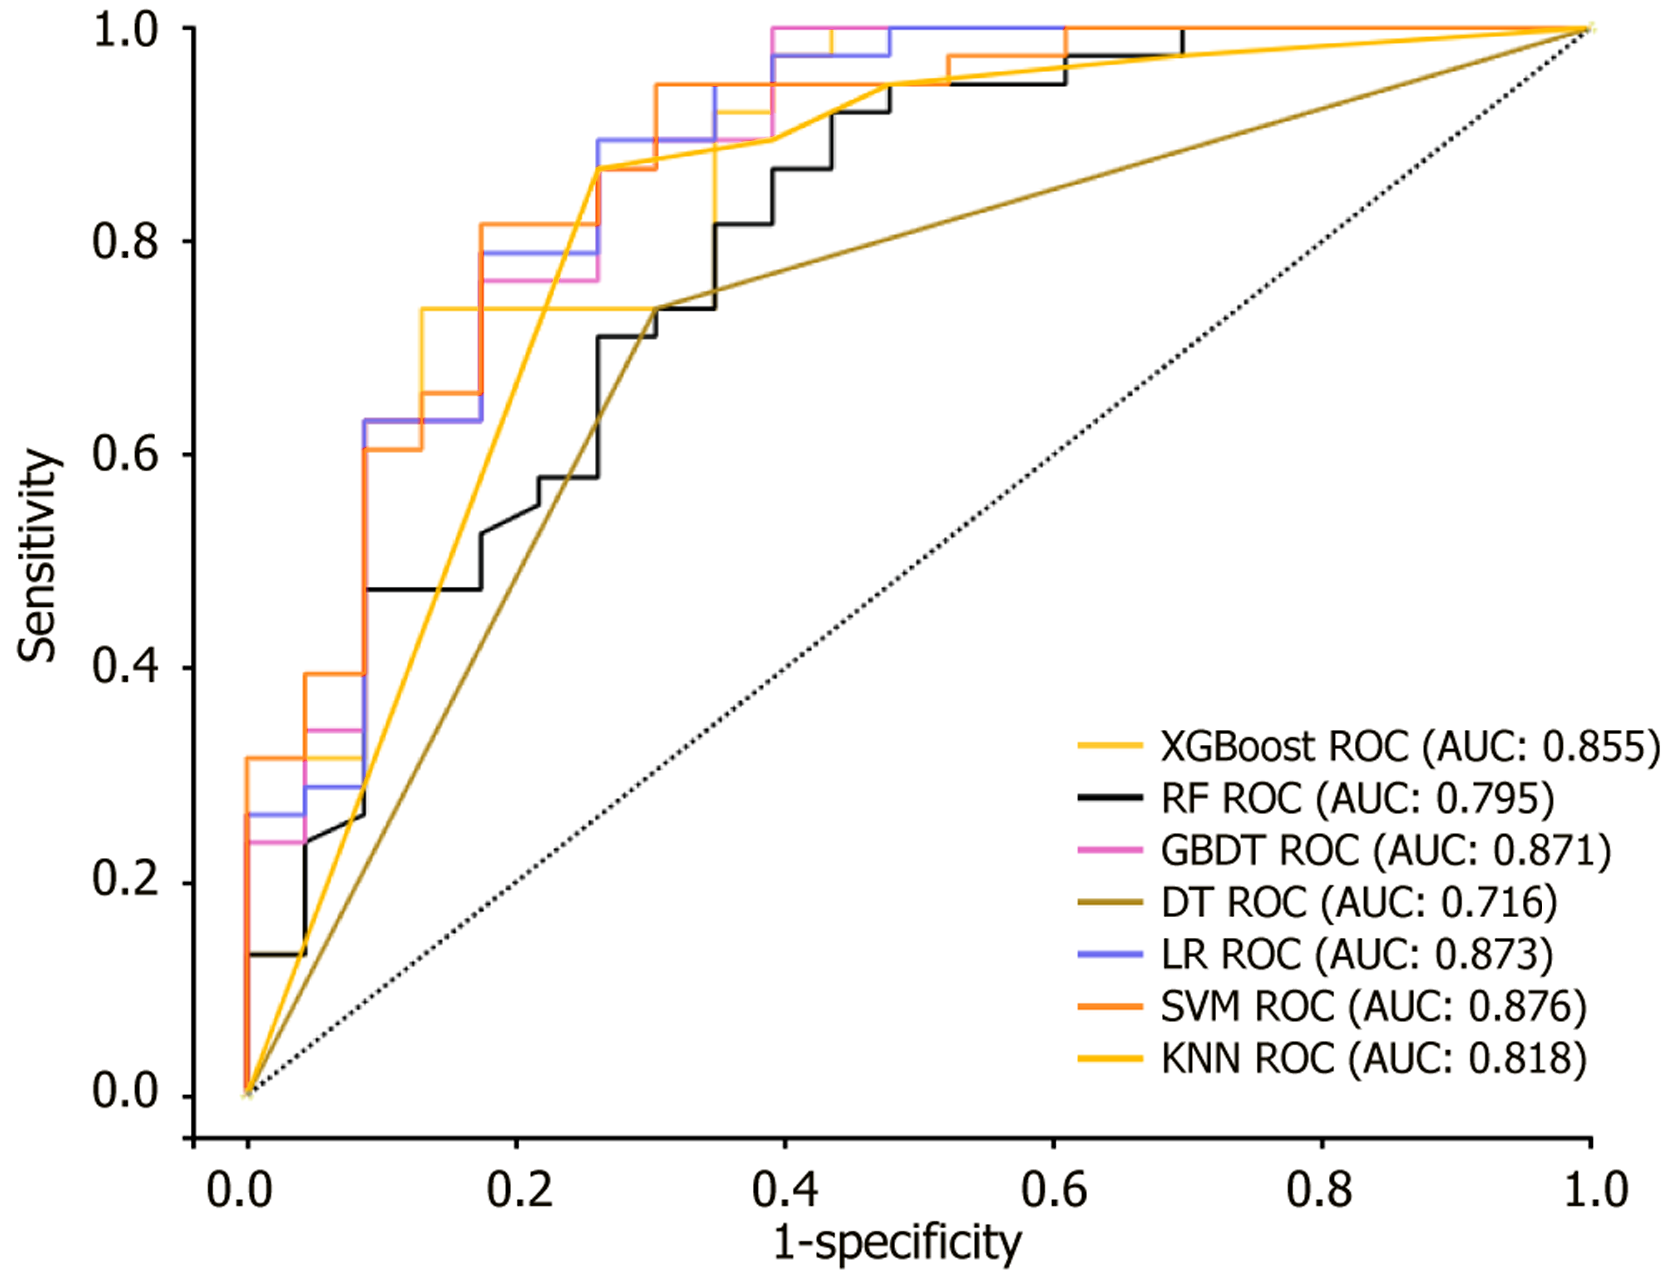
Figure 6 Performance comparison on the external validation set of the seven machine learning models based on the “pre-operative + peri-necrotic 10-mm” feature set, using receiver operating characteristic curves.
ROC: Receiver operating characteristic; XGBoost: Extreme gradient boosting; RF: Random forest; GBDT: Gradient boosting decision tree; SVM: Support vector machine; DT: Decision tree; LR: Logistic regression; KNN: K-nearest neighbors; AUC: Area under the curve.
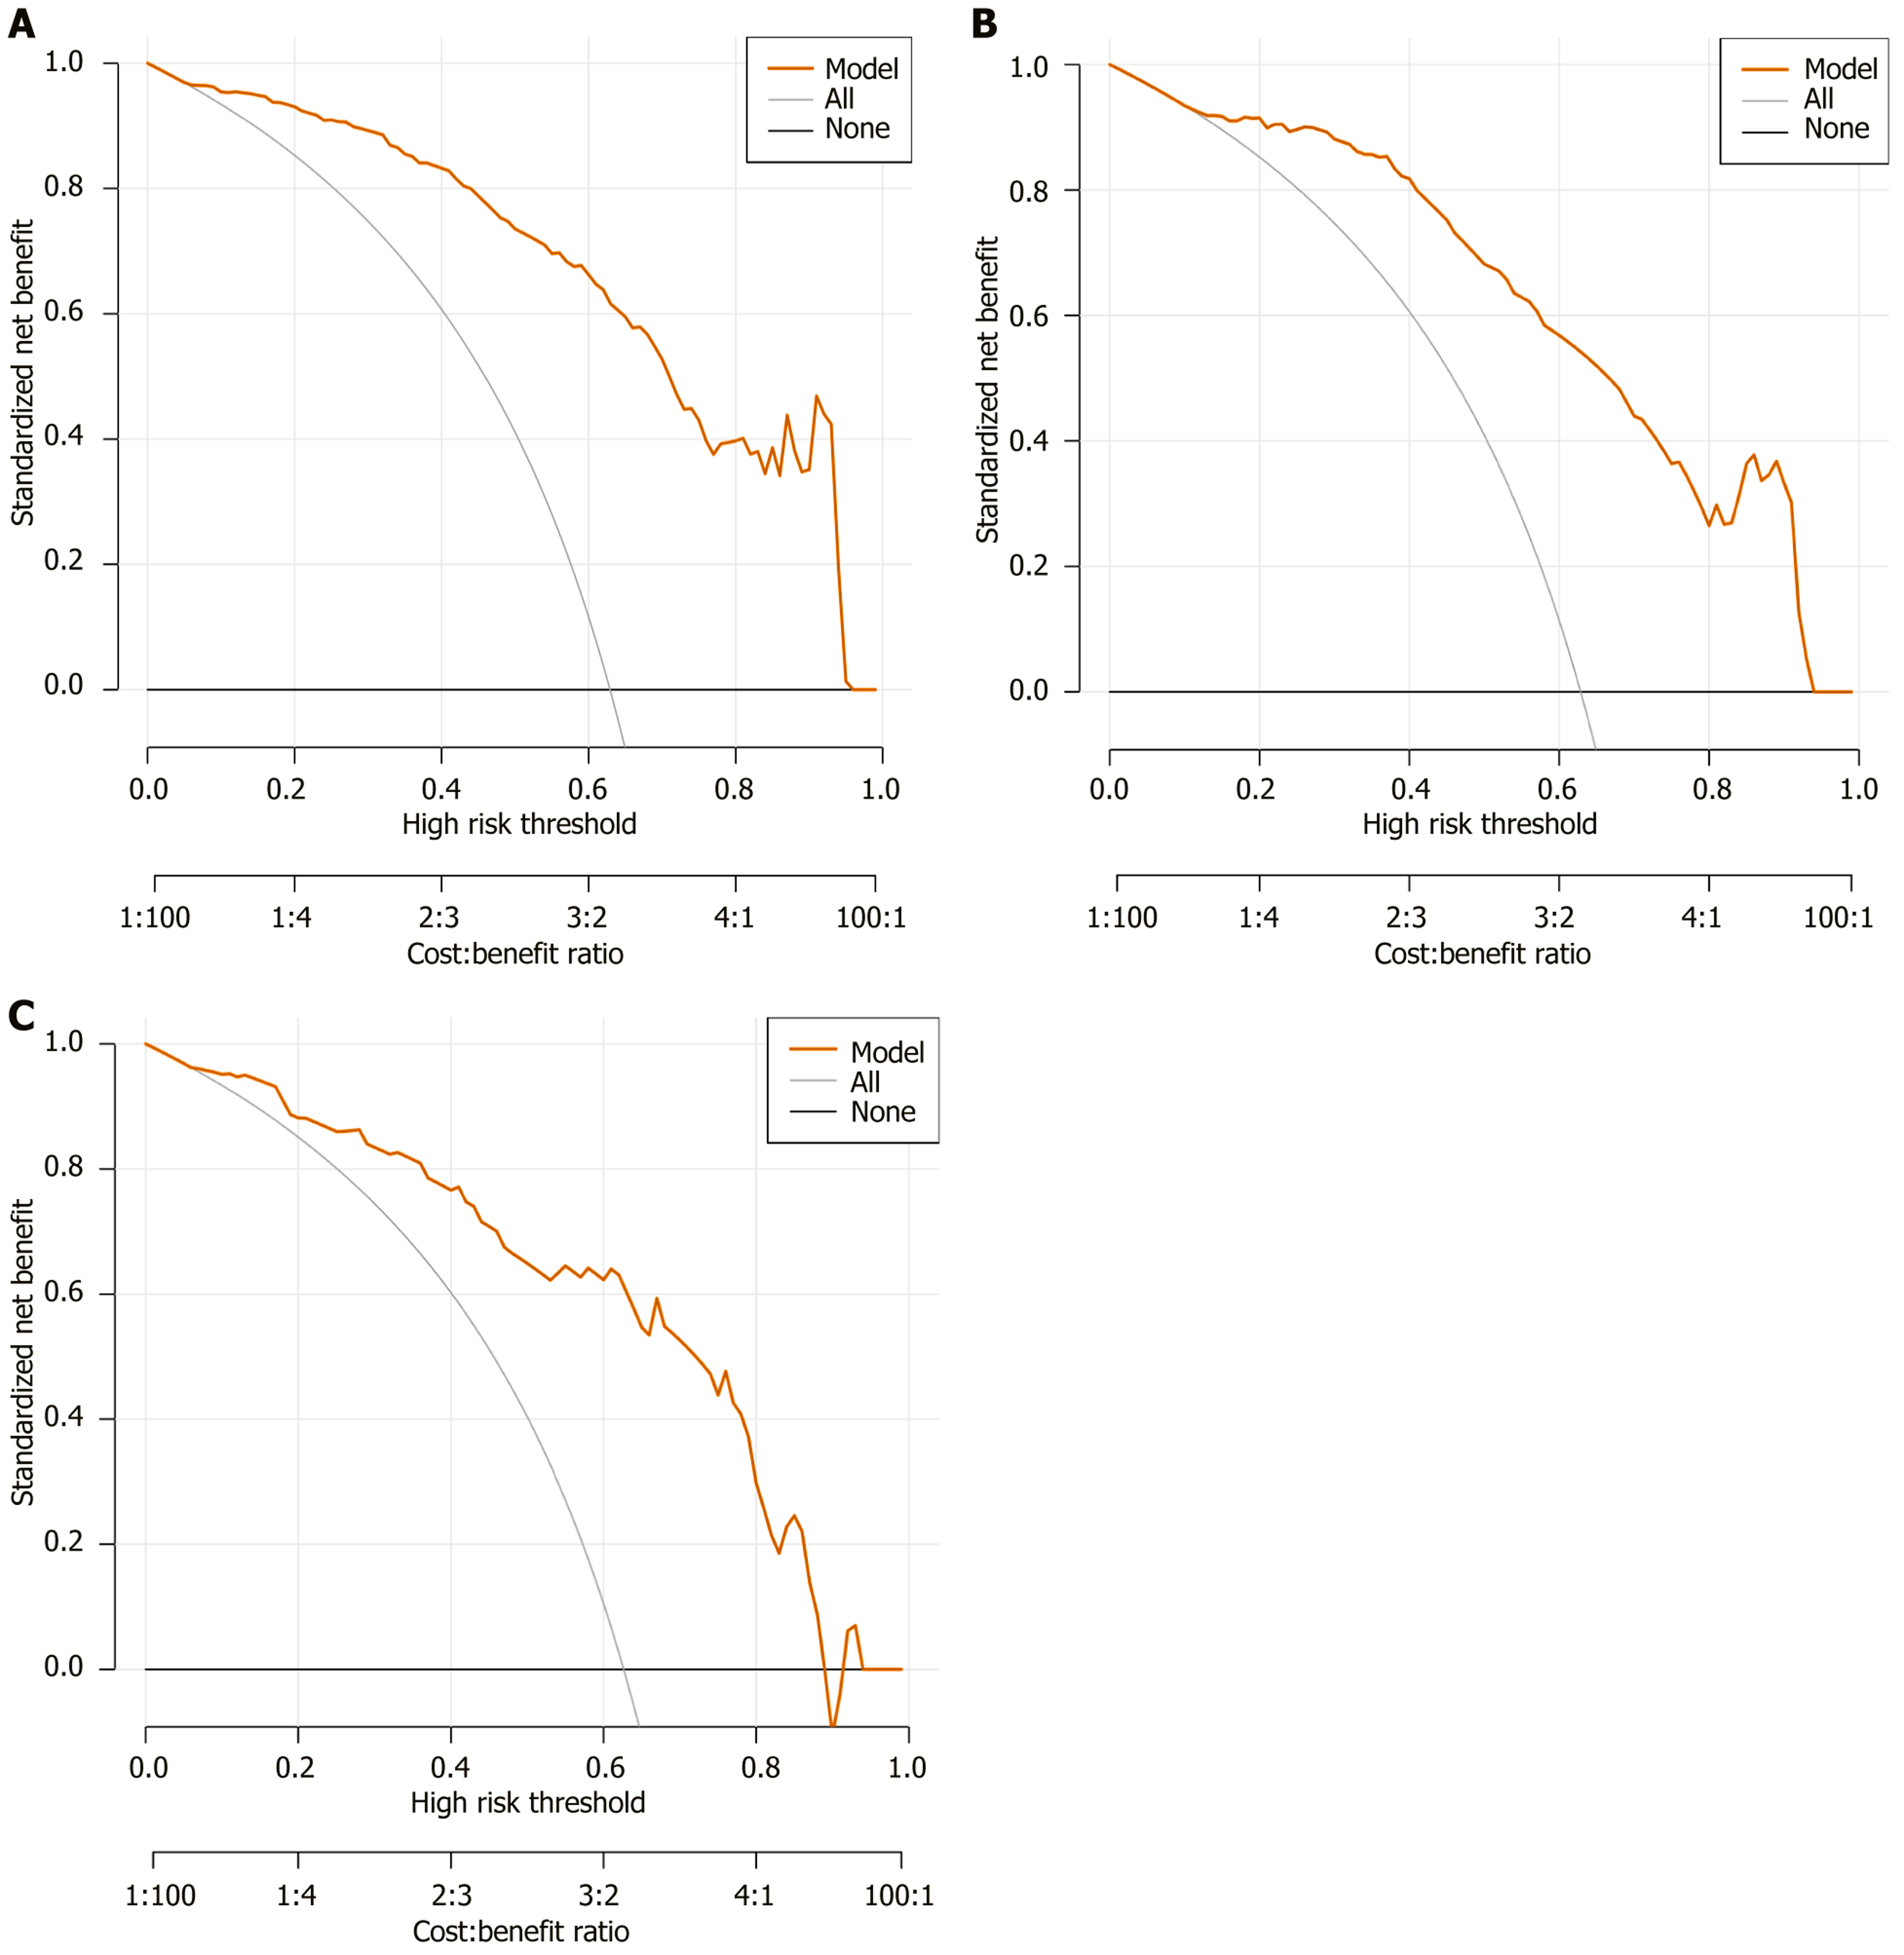
Figure 7 Decision curve analysis of the support vector machine model developed using the “pre-operative + peri-necrotic 10-mm” feature set.
A: Decision curves on the training set; B: Decision curves on the internal validation set; C: Decision curves on the external validation set.
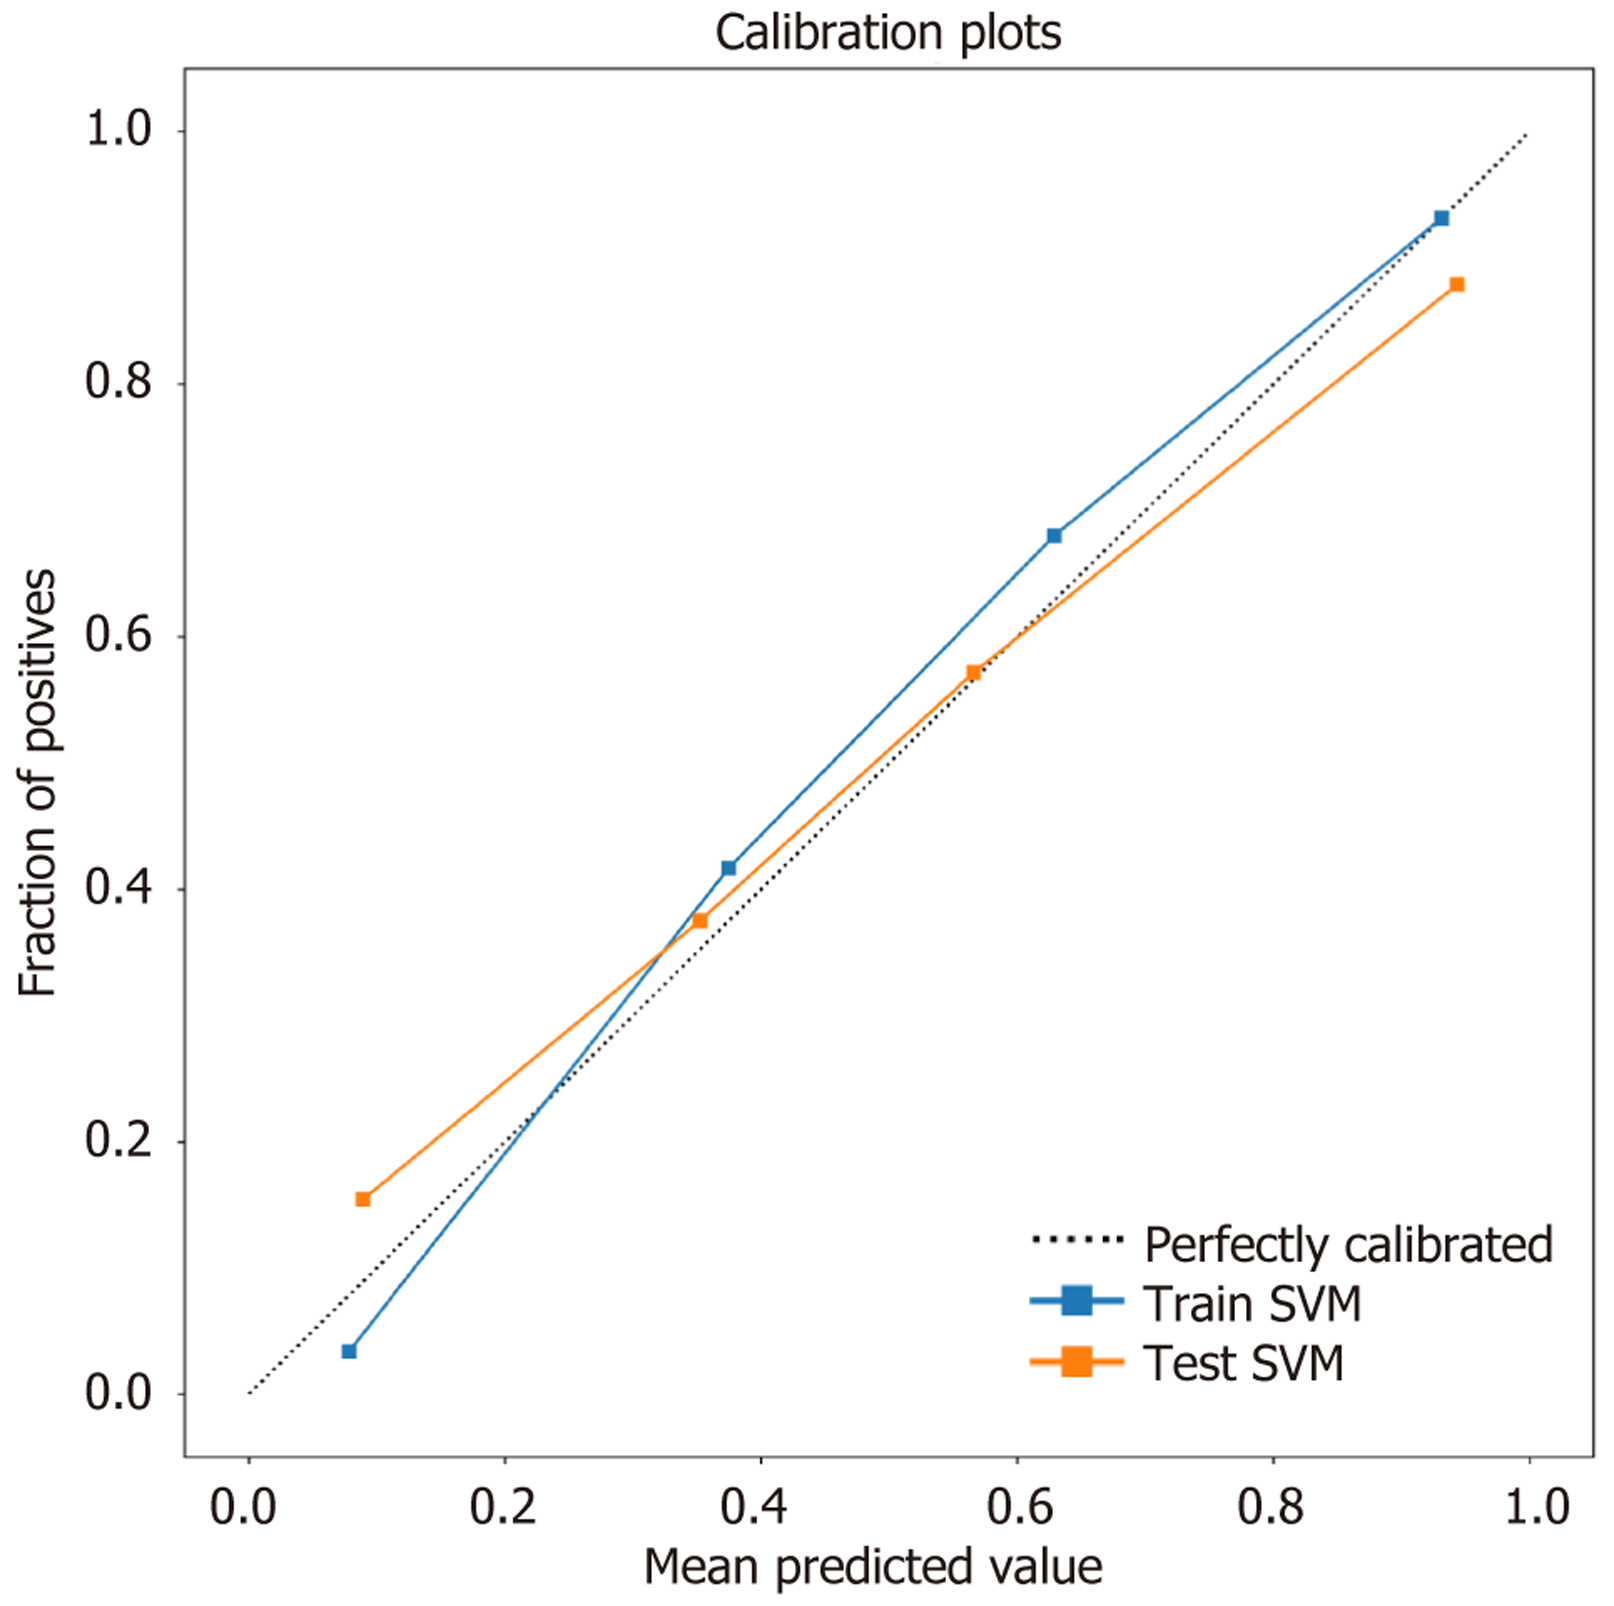
Figure 8 Model calibration was evaluated in the training and external validation set.
SVM: Support vector machine.
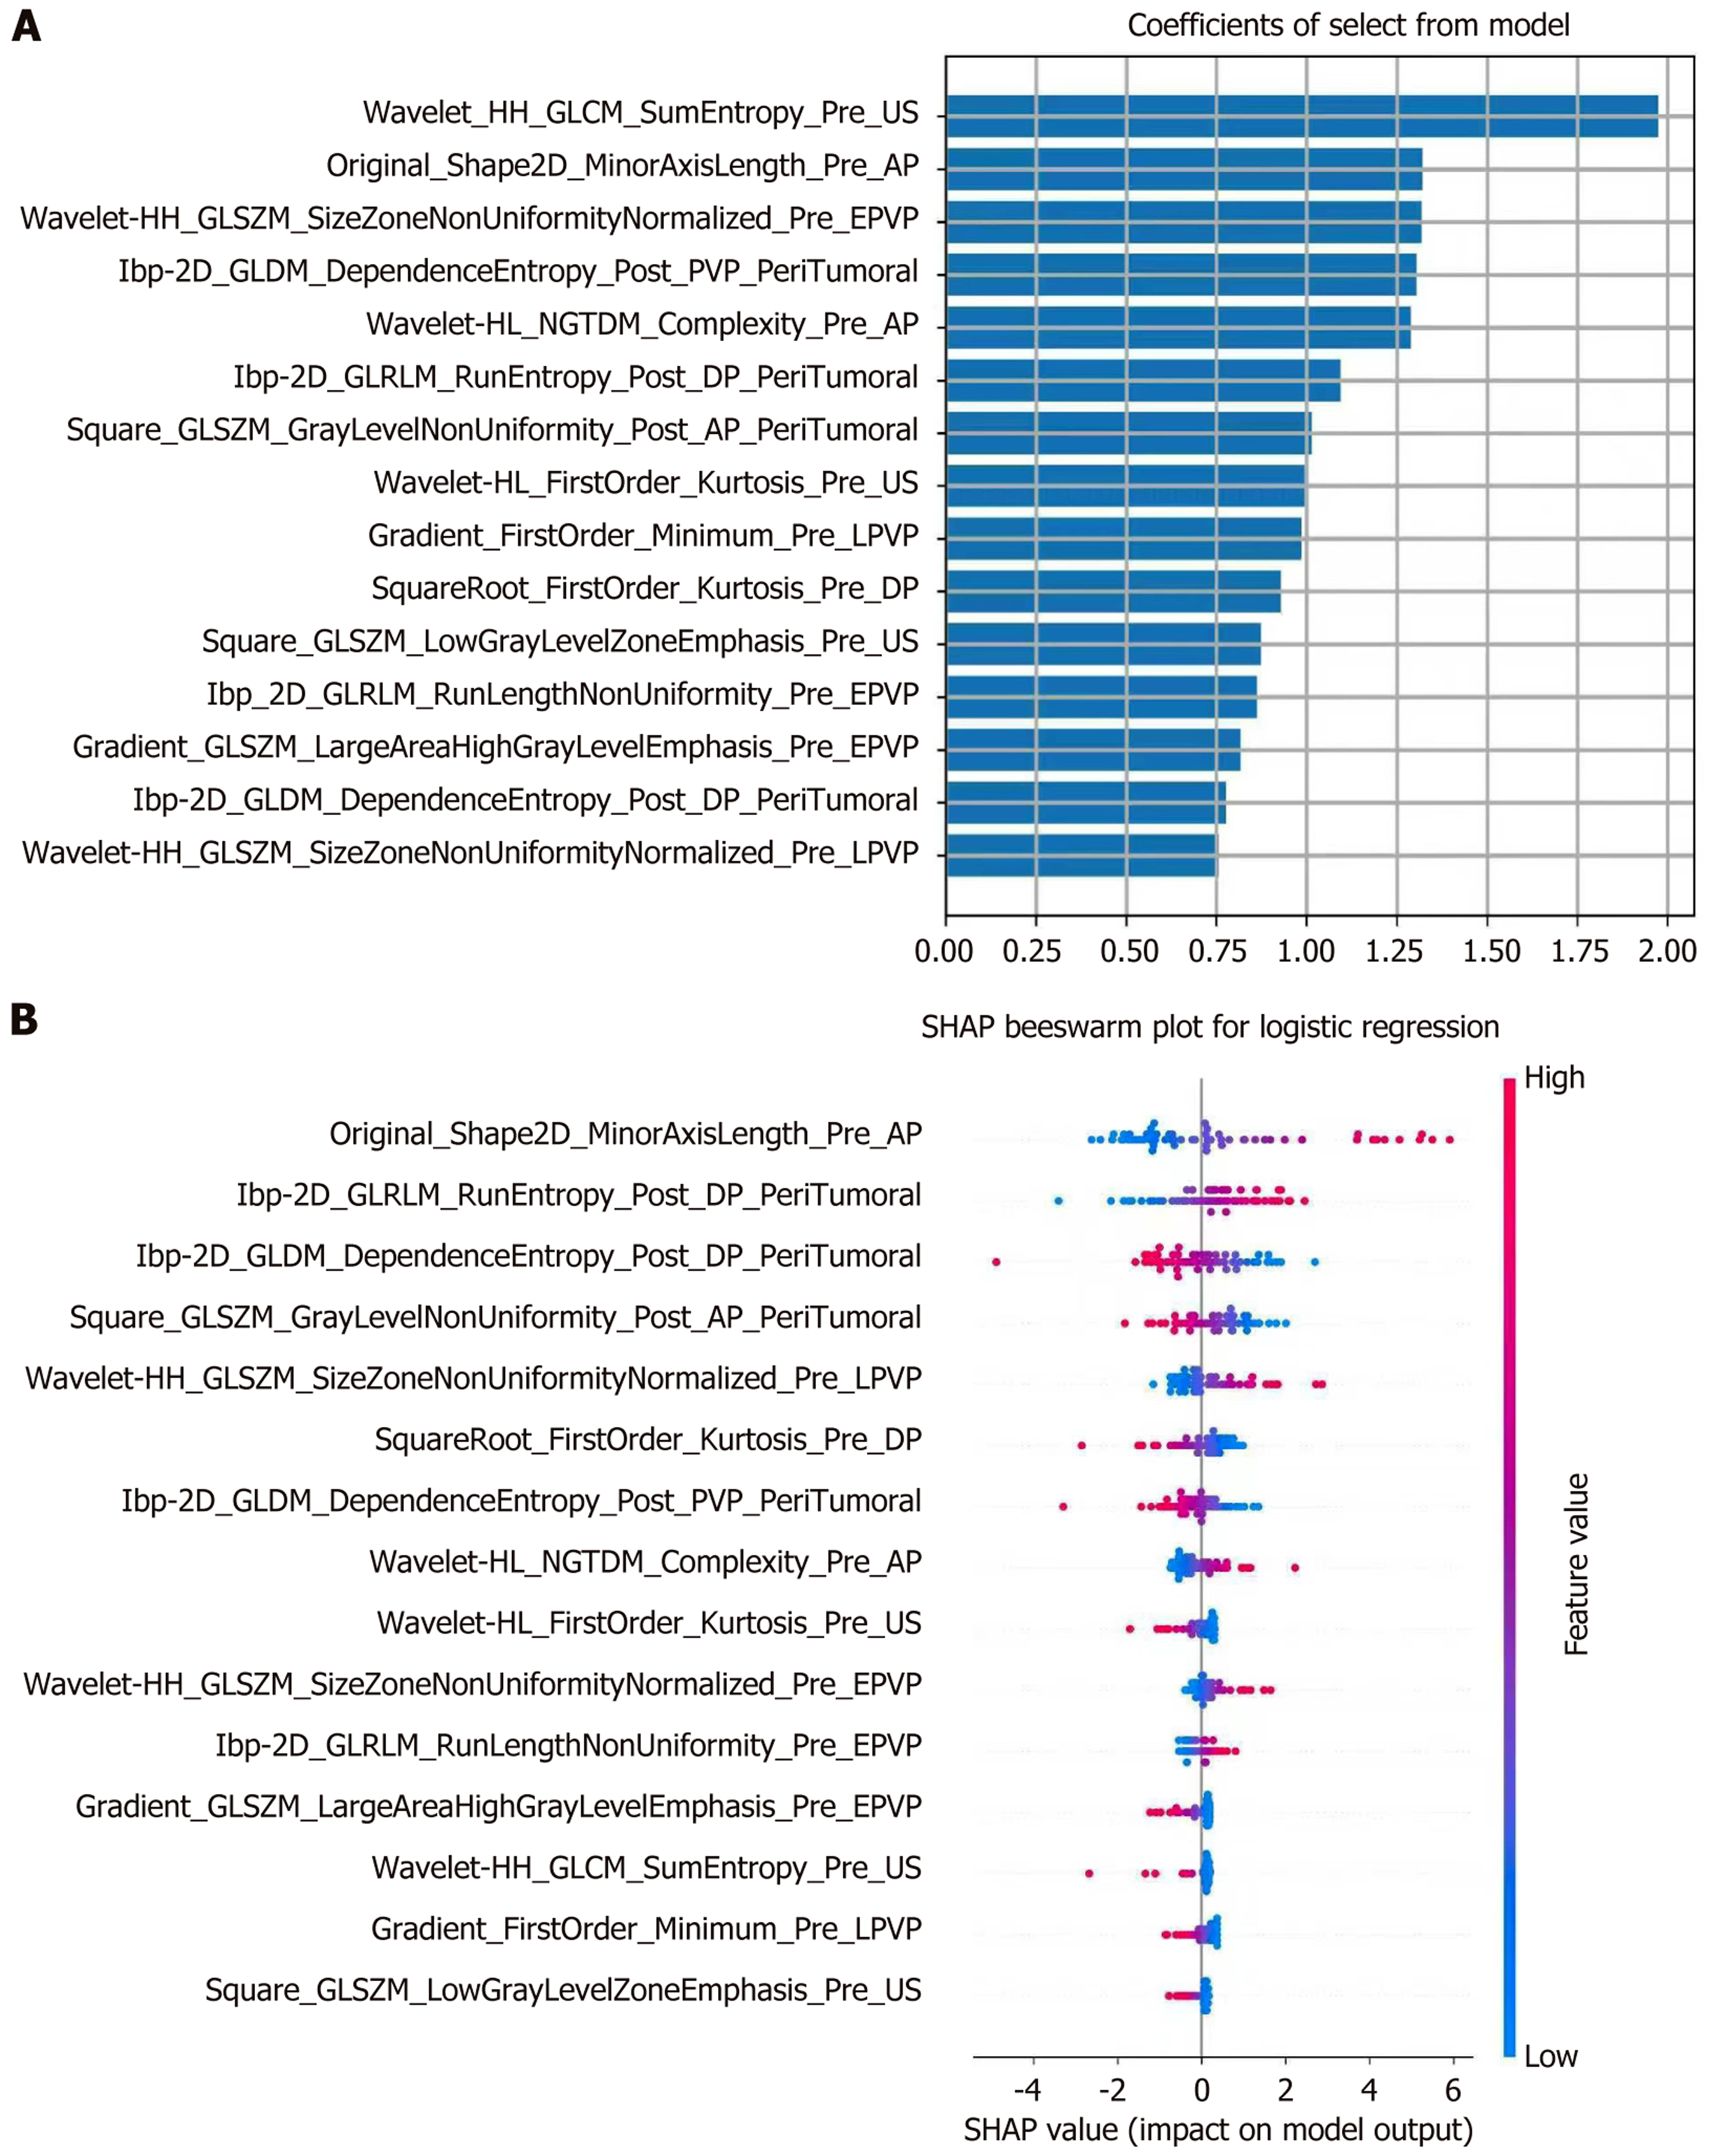
Figure 9 Feature selection and visualization of radiomics showed the “pre-operative + peri-necrotic 10-mm” model’s interpretation.
A: The importance ranking of the 15 factors based on the support vector machine classifier; B: SHapley Additive exPlanations values showed the model interpretation, the red part represented the higher values. SHAP: SHapley Additive exPlanations.
- Citation: Liu T, Wu C, Dong TT, Jia YY, Zhu YY, Wei CM, Duan Y, Li YX, Nie F. Optimal 10-mm window: Integrating peri-ablation radiomics with preoperative features to predict early hepatocellular carcinoma recurrence after thermal ablation. World J Gastroenterol 2026; 32(43): 120562
- URL: https://www.wjgnet.com/1007-9327/full/v32/i43/120562.htm
- DOI: https://dx.doi.org/10.3748/wjg.120562