
















Copyright: ©Author(s) 2026.
World J Gastroenterol. Nov 7, 2026; 32(41): 121890
Published online Nov 7, 2026. doi: 10.3748/wjg.121890
Published online Nov 7, 2026. doi: 10.3748/wjg.121890
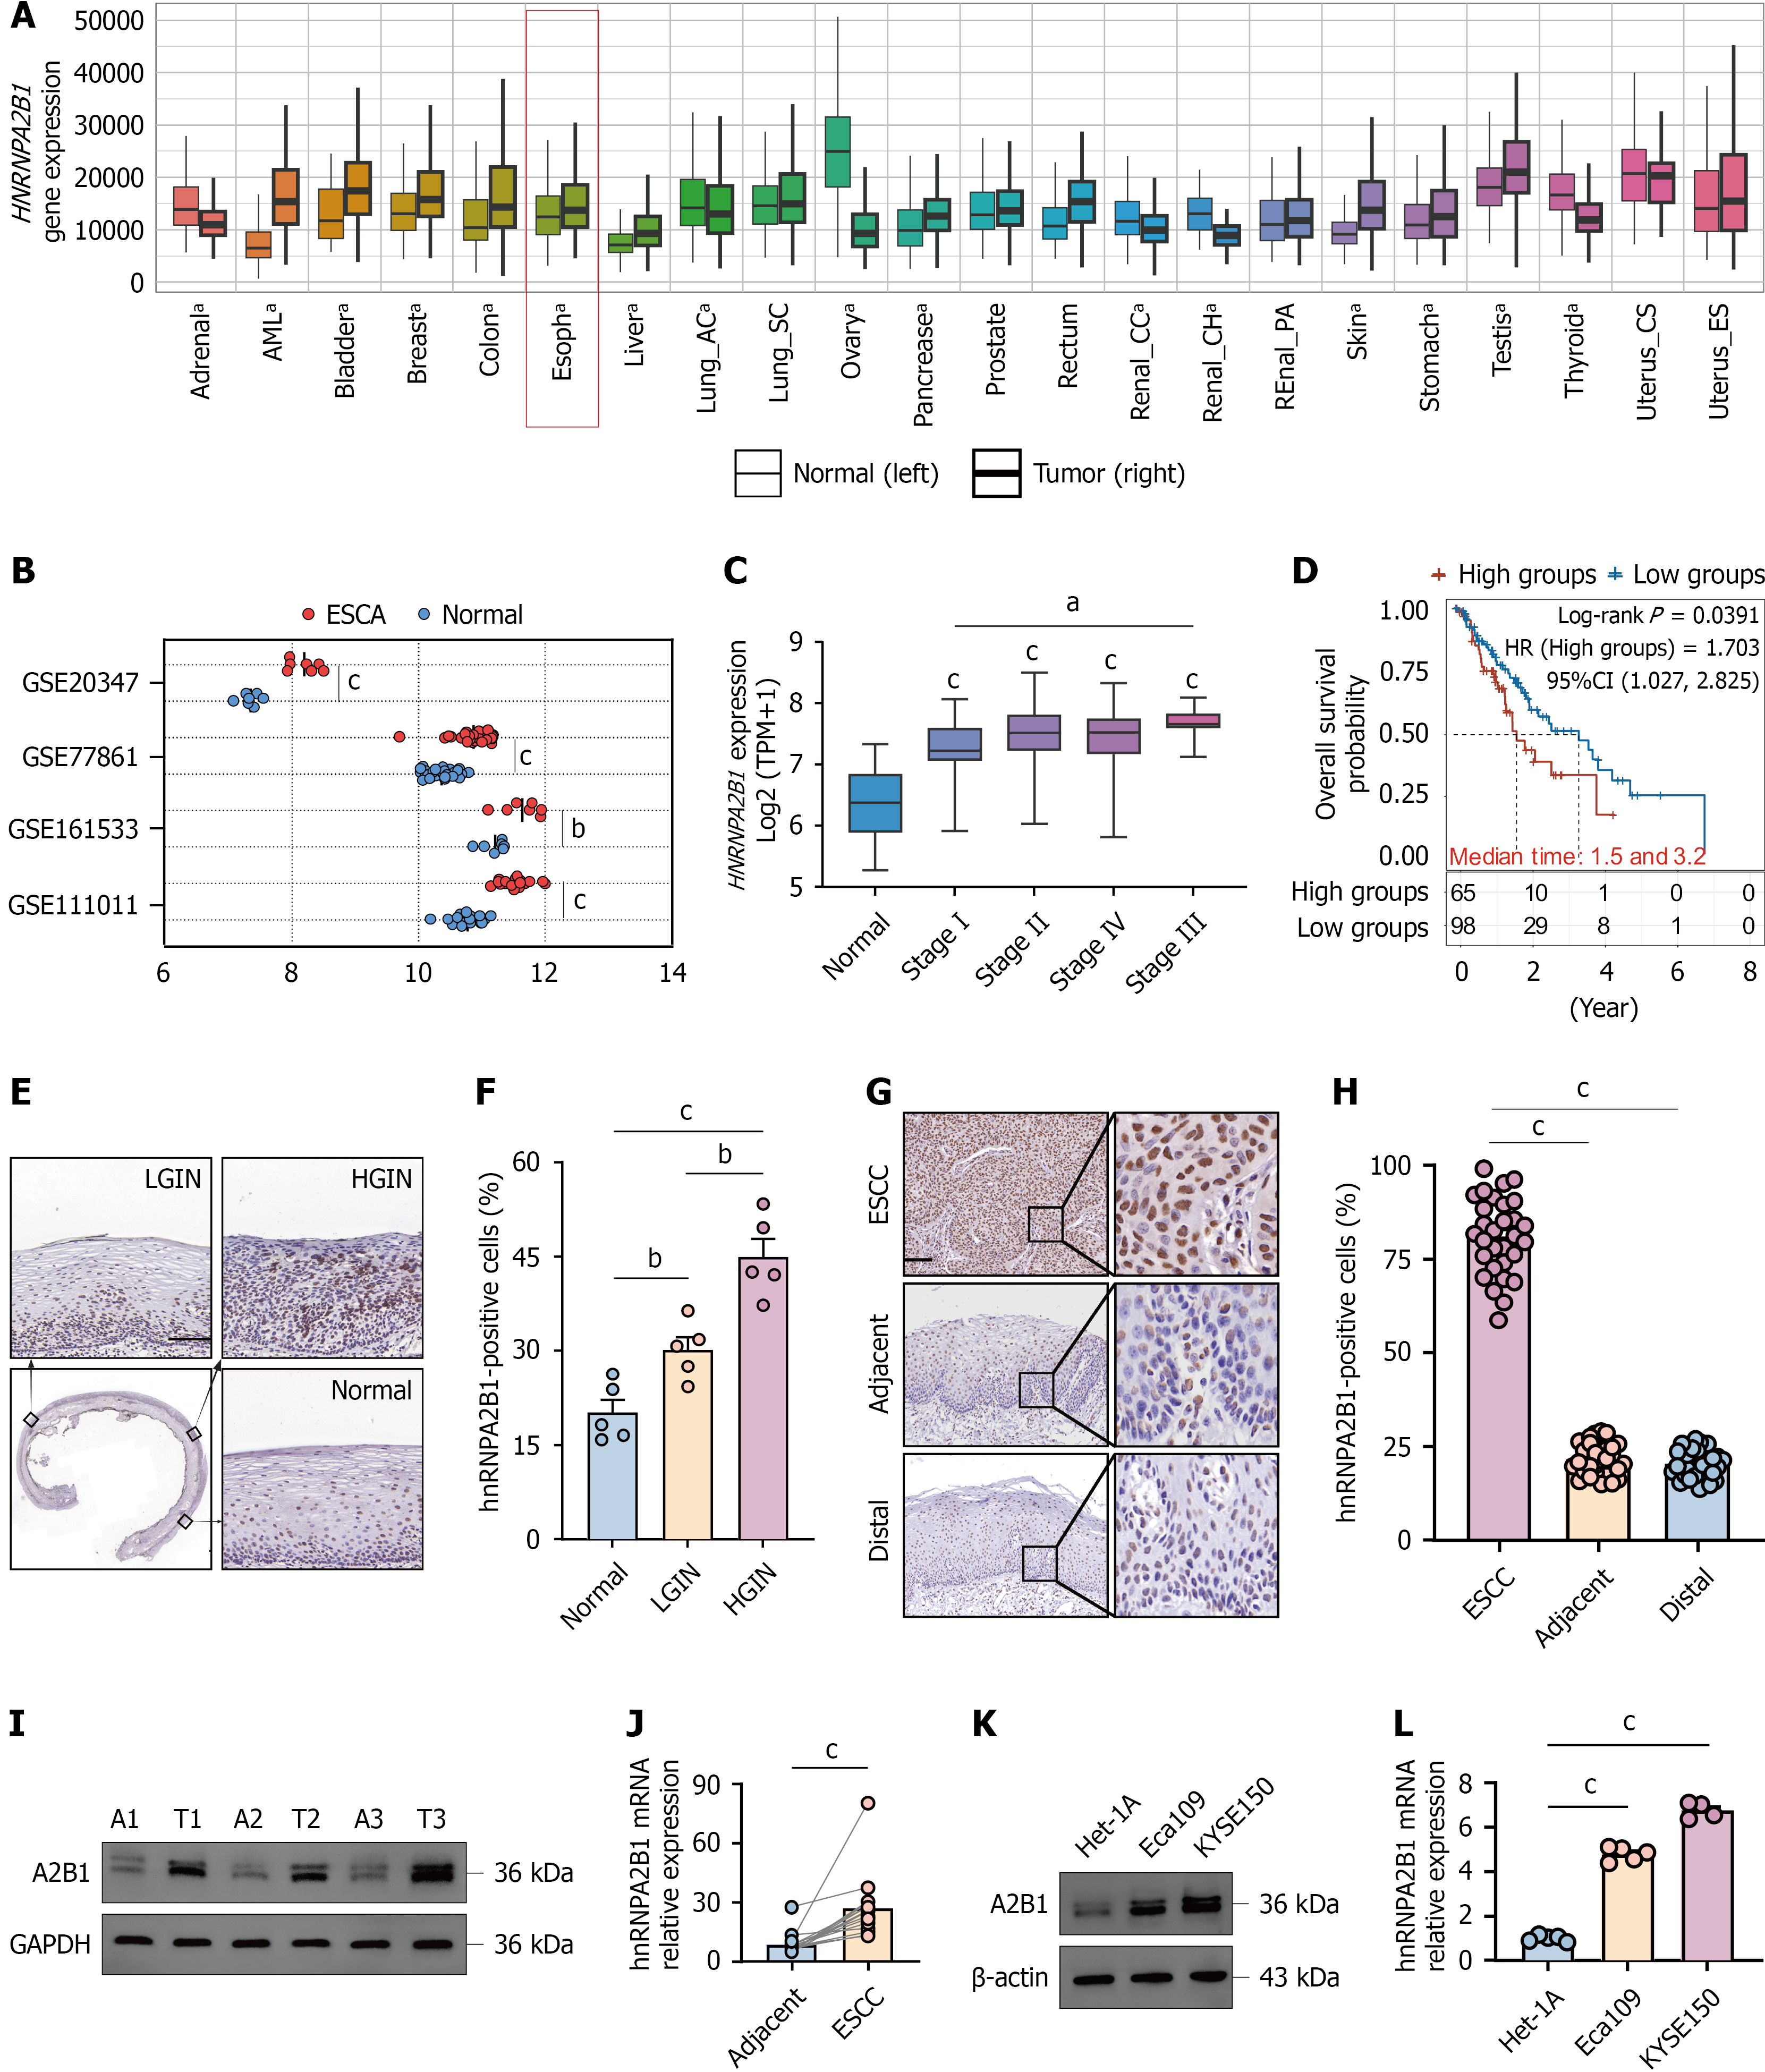
Figure 1 HnRNPA2B1 upregulation is an early event in esophageal squamous cell carcinoma progression and is associated with poor prognosis.
A: Pan-cancer analysis of hnRNPA2B1 expression in normal (left) and tumor (right) tissues from The Cancer Genome Atlas, with the esophageal cohort highlighted; B: HnRNPA2B1 expression in esophageal carcinoma (ESCA) and normal esophageal tissues in four Gene Expression Omnibus datasets (GSE20347, GSE77861, GSE161533, and GSE111011); C: HnRNPA2B1 expression in normal tissues and ESCA at different pathological stages in The Cancer Genome Atlas; D: Kaplan-Meier overall survival analysis of ESCA patients with high or low HnRNPA2B1 expression; E: Representative immunohistochemistry staining of hnRNPA2B1 in normal esophageal epithelium, LGIN, and HGIN from ESD specimens; F: Quantification of hnRNPA2B1-positive cells in normal, LGIN, and HGIN tissues; G: Representative immunohistochemistry staining of hnRNPA2B1 in esophageal squamous cell carcinoma (ESCC) and matched adjacent and distal tissues; H: Quantification of hnRNPA2B1-positive cells in ESCC, adjacent, and distal tissues; I: Western blotting analysis of hnRNPA2B1 in paired adjacent (A) and tumor (T) ESCC tissues from three representative cases, with GAPDH as the loading control; J: Relative hnRNPA2B1 mRNA expression in paired adjacent and ESCC tissues determined by reverse transcription-quantitative polymerase chain reaction; K: Western blotting analysis of hnRNPA2B1 in Het-1A, Eca109, and KYSE150 cells, with β-actin as the loading control; L: Relative hnRNPA2B1 mRNA expression in Het-1A, Eca109, and KYSE150 cells determined by reverse transcription-quantitative polymerase chain reaction. Data are presented as mean ± SD. Statistical significance was determined by Student’s t-test for two-group comparisons or one-way ANOVA for multiple-group comparisons, as appropriate. Scale bars = 100 μm. aP < 0.05, bP < 0.01, and cP < 0.001. ESCA: Esophageal carcinoma; HGIN: High-grade intraepithelial neoplasia; LGIN: Low-grade intraepithelial neoplasia; ESCC: Esophageal squamous cell carcinoma.
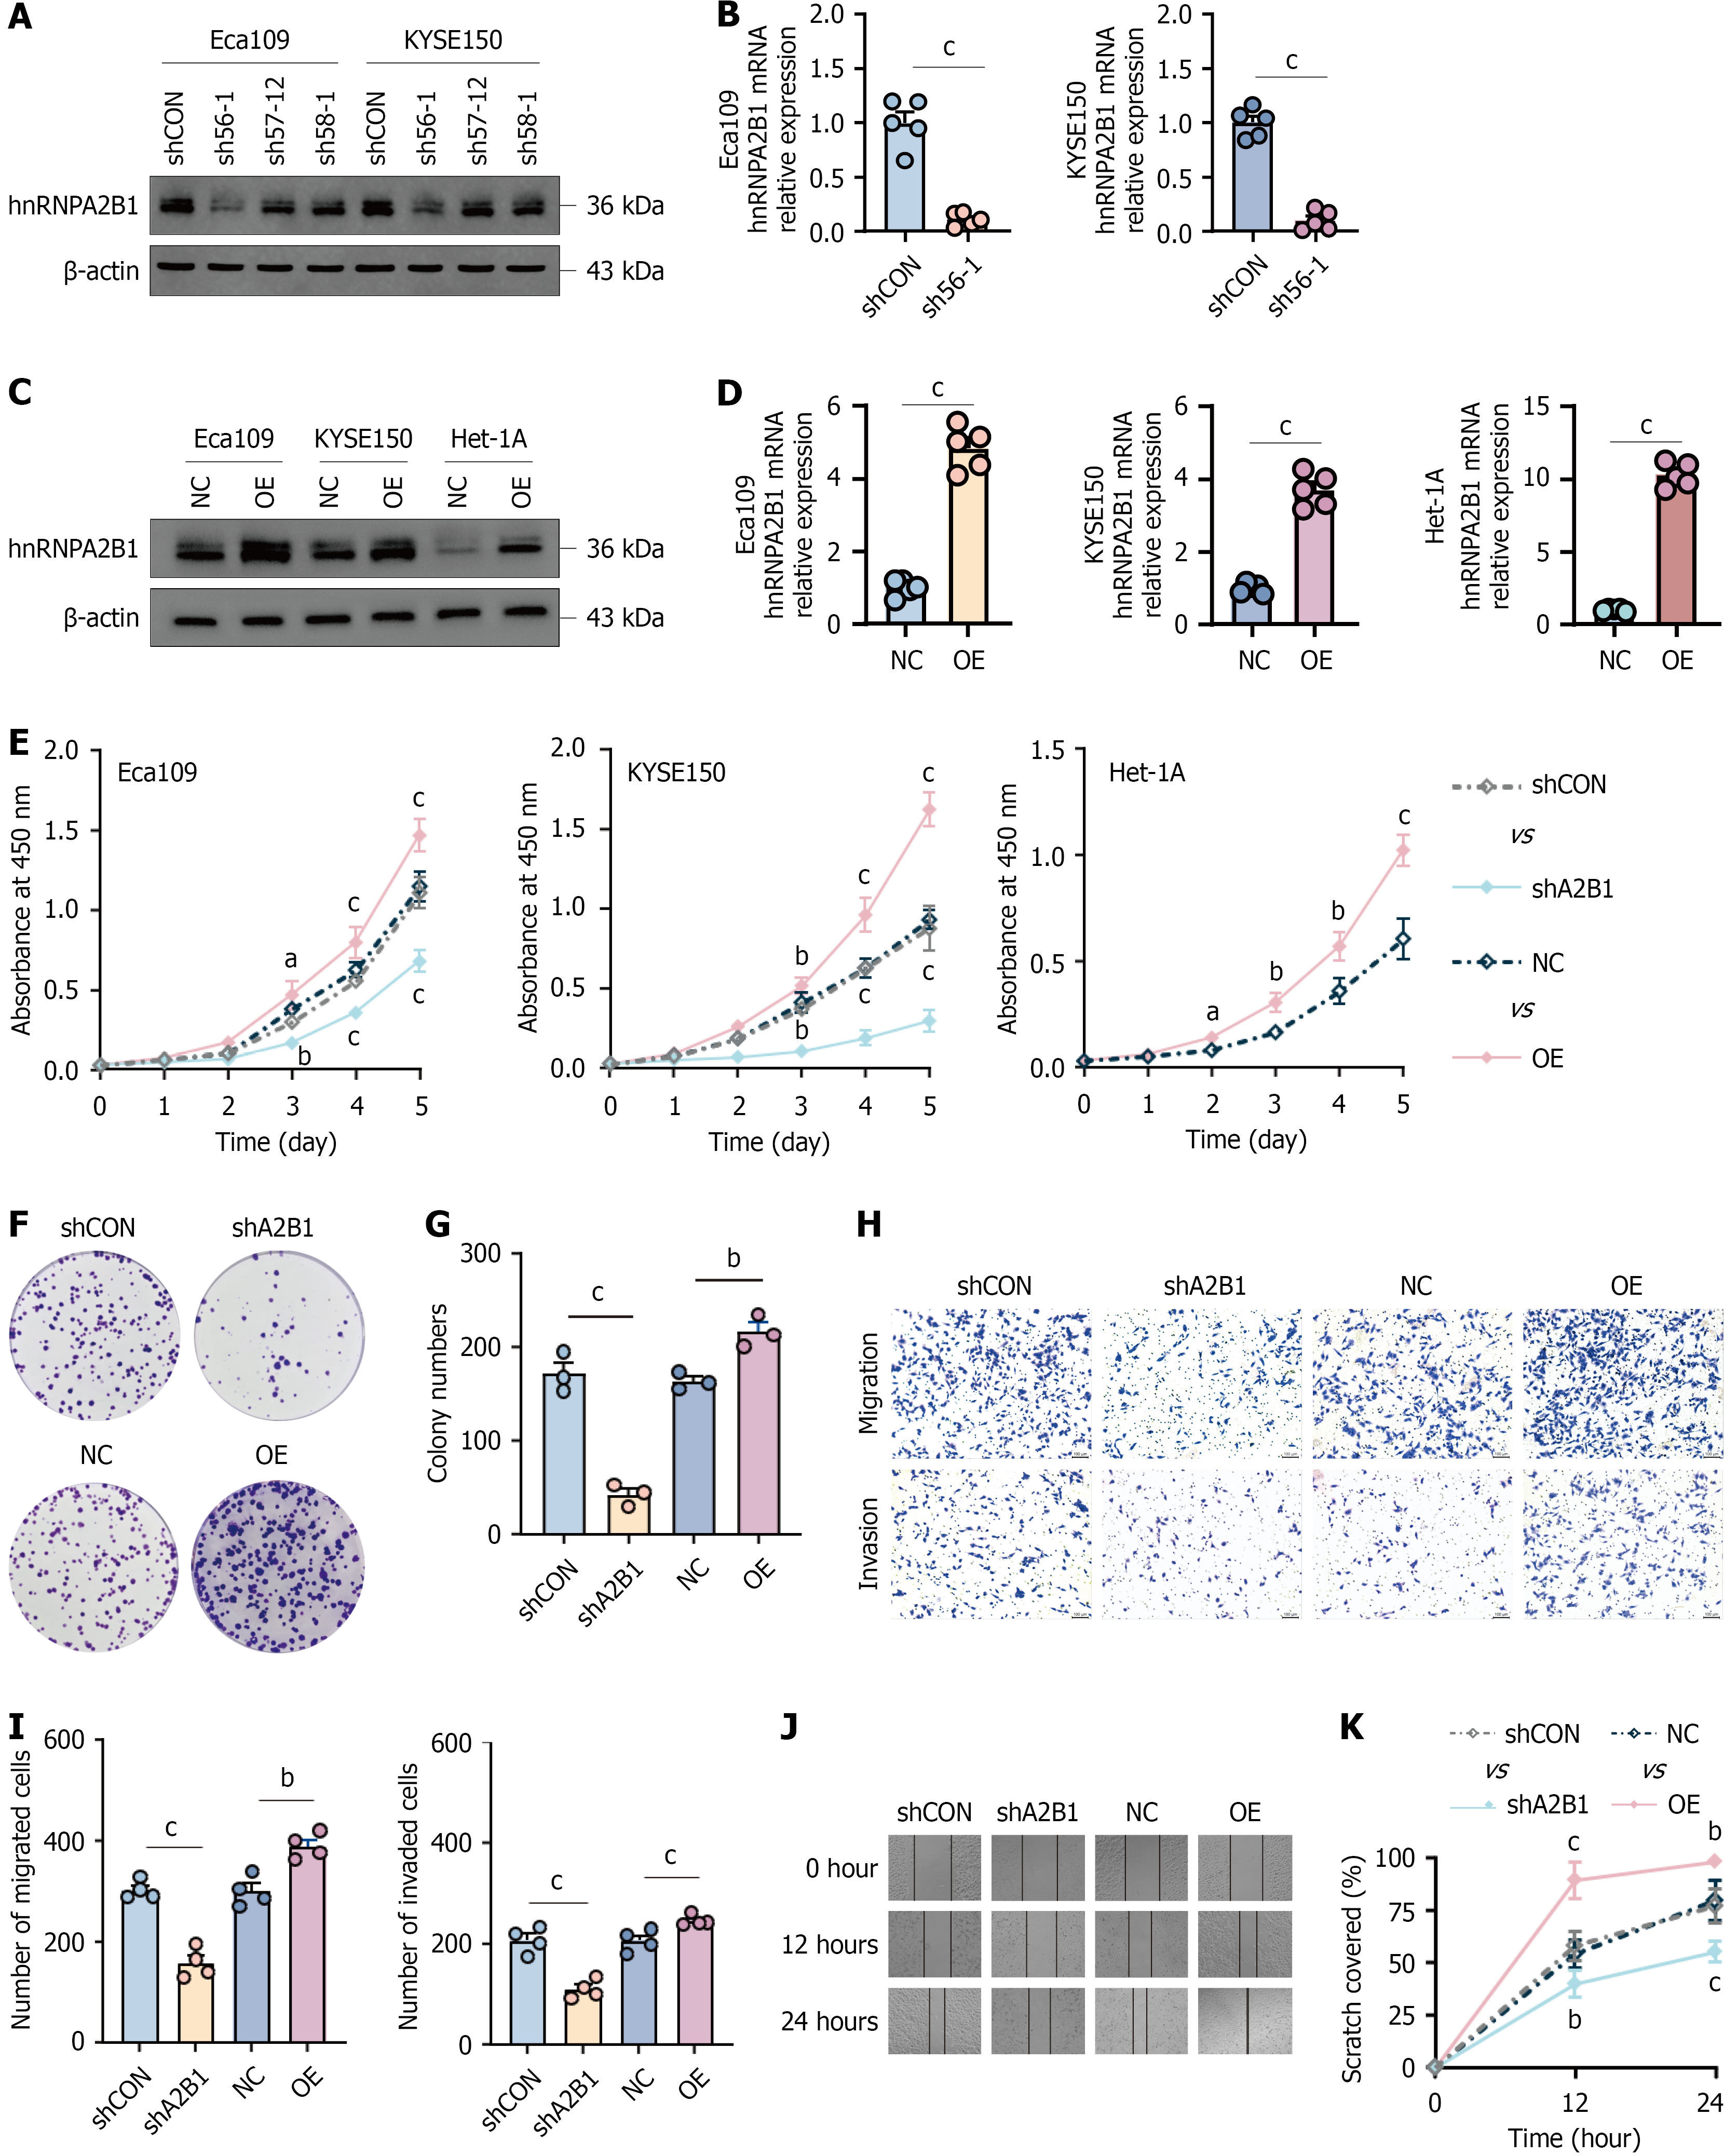
Figure 2 HnRNPA2B1 promotes esophageal squamous cell carcinoma cell proliferation, migration, and invasion in vitro.
A: Western blotting analysis of hnRNPA2B1 knockdown efficiency in Eca109 and KYSE150 cells transduced with control short hairpin RNA or three independent hnRNPA2B1-targeting short hairpin RNAs (sh56-1, sh57-12, and sh58-1), with β-actin as the loading control; B: Relative hnRNPA2B1 mRNA expression in Eca109 and KYSE150 cells after hnRNPA2B1 knockdown with sh56-1, as determined by reverse transcription-quantitative polymerase chain reaction; C: Western blotting analysis of hnRNPA2B1 overexpression in Eca109, KYSE150, and Het-1A cells transduced with negative control or hnRNPA2B1 vector (overexpression), with β-actin as the loading control; D: Relative hnRNPA2B1 mRNA expression in Eca109, KYSE150, and Het-1A cells after hnRNPA2B1 overexpression, as determined by reverse transcription-quantitative polymerase chain reaction; E: Cell counting kit-8 assays showing the effects of hnRNPA2B1 knockdown or overexpression on the proliferation of Eca109, KYSE150, and Het-1A cells; F: Representative images of colony formation assays in Eca109 cells after hnRNPA2B1 knockdown or overexpression; G: Quantification of colony numbers in (F); H: Representative images of Transwell migration and invasion assays in Eca109 cells after hnRNPA2B1 knockdown or overexpression; I: Quantification of migrated and invaded cells in (H); J: Representative images of wound-healing assays in Eca109 cells at 0, 12, and 24 hours after hnRNPA2B1 knockdown or overexpression; K: Quantification of wound closure in (J). Data are presented as mean ± SD. Statistical significance was determined by Student’s t-test for two-group comparisons or one-way ANOVA for multiple-group comparisons, as appropriate. aP < 0.05, bP < 0.01, and cP < 0.001. NC: Negative control; OE: Overexpression; shCON: Control short hairpin RNA; shA2B1: HnRNPA2B1 short hairpin RNA.
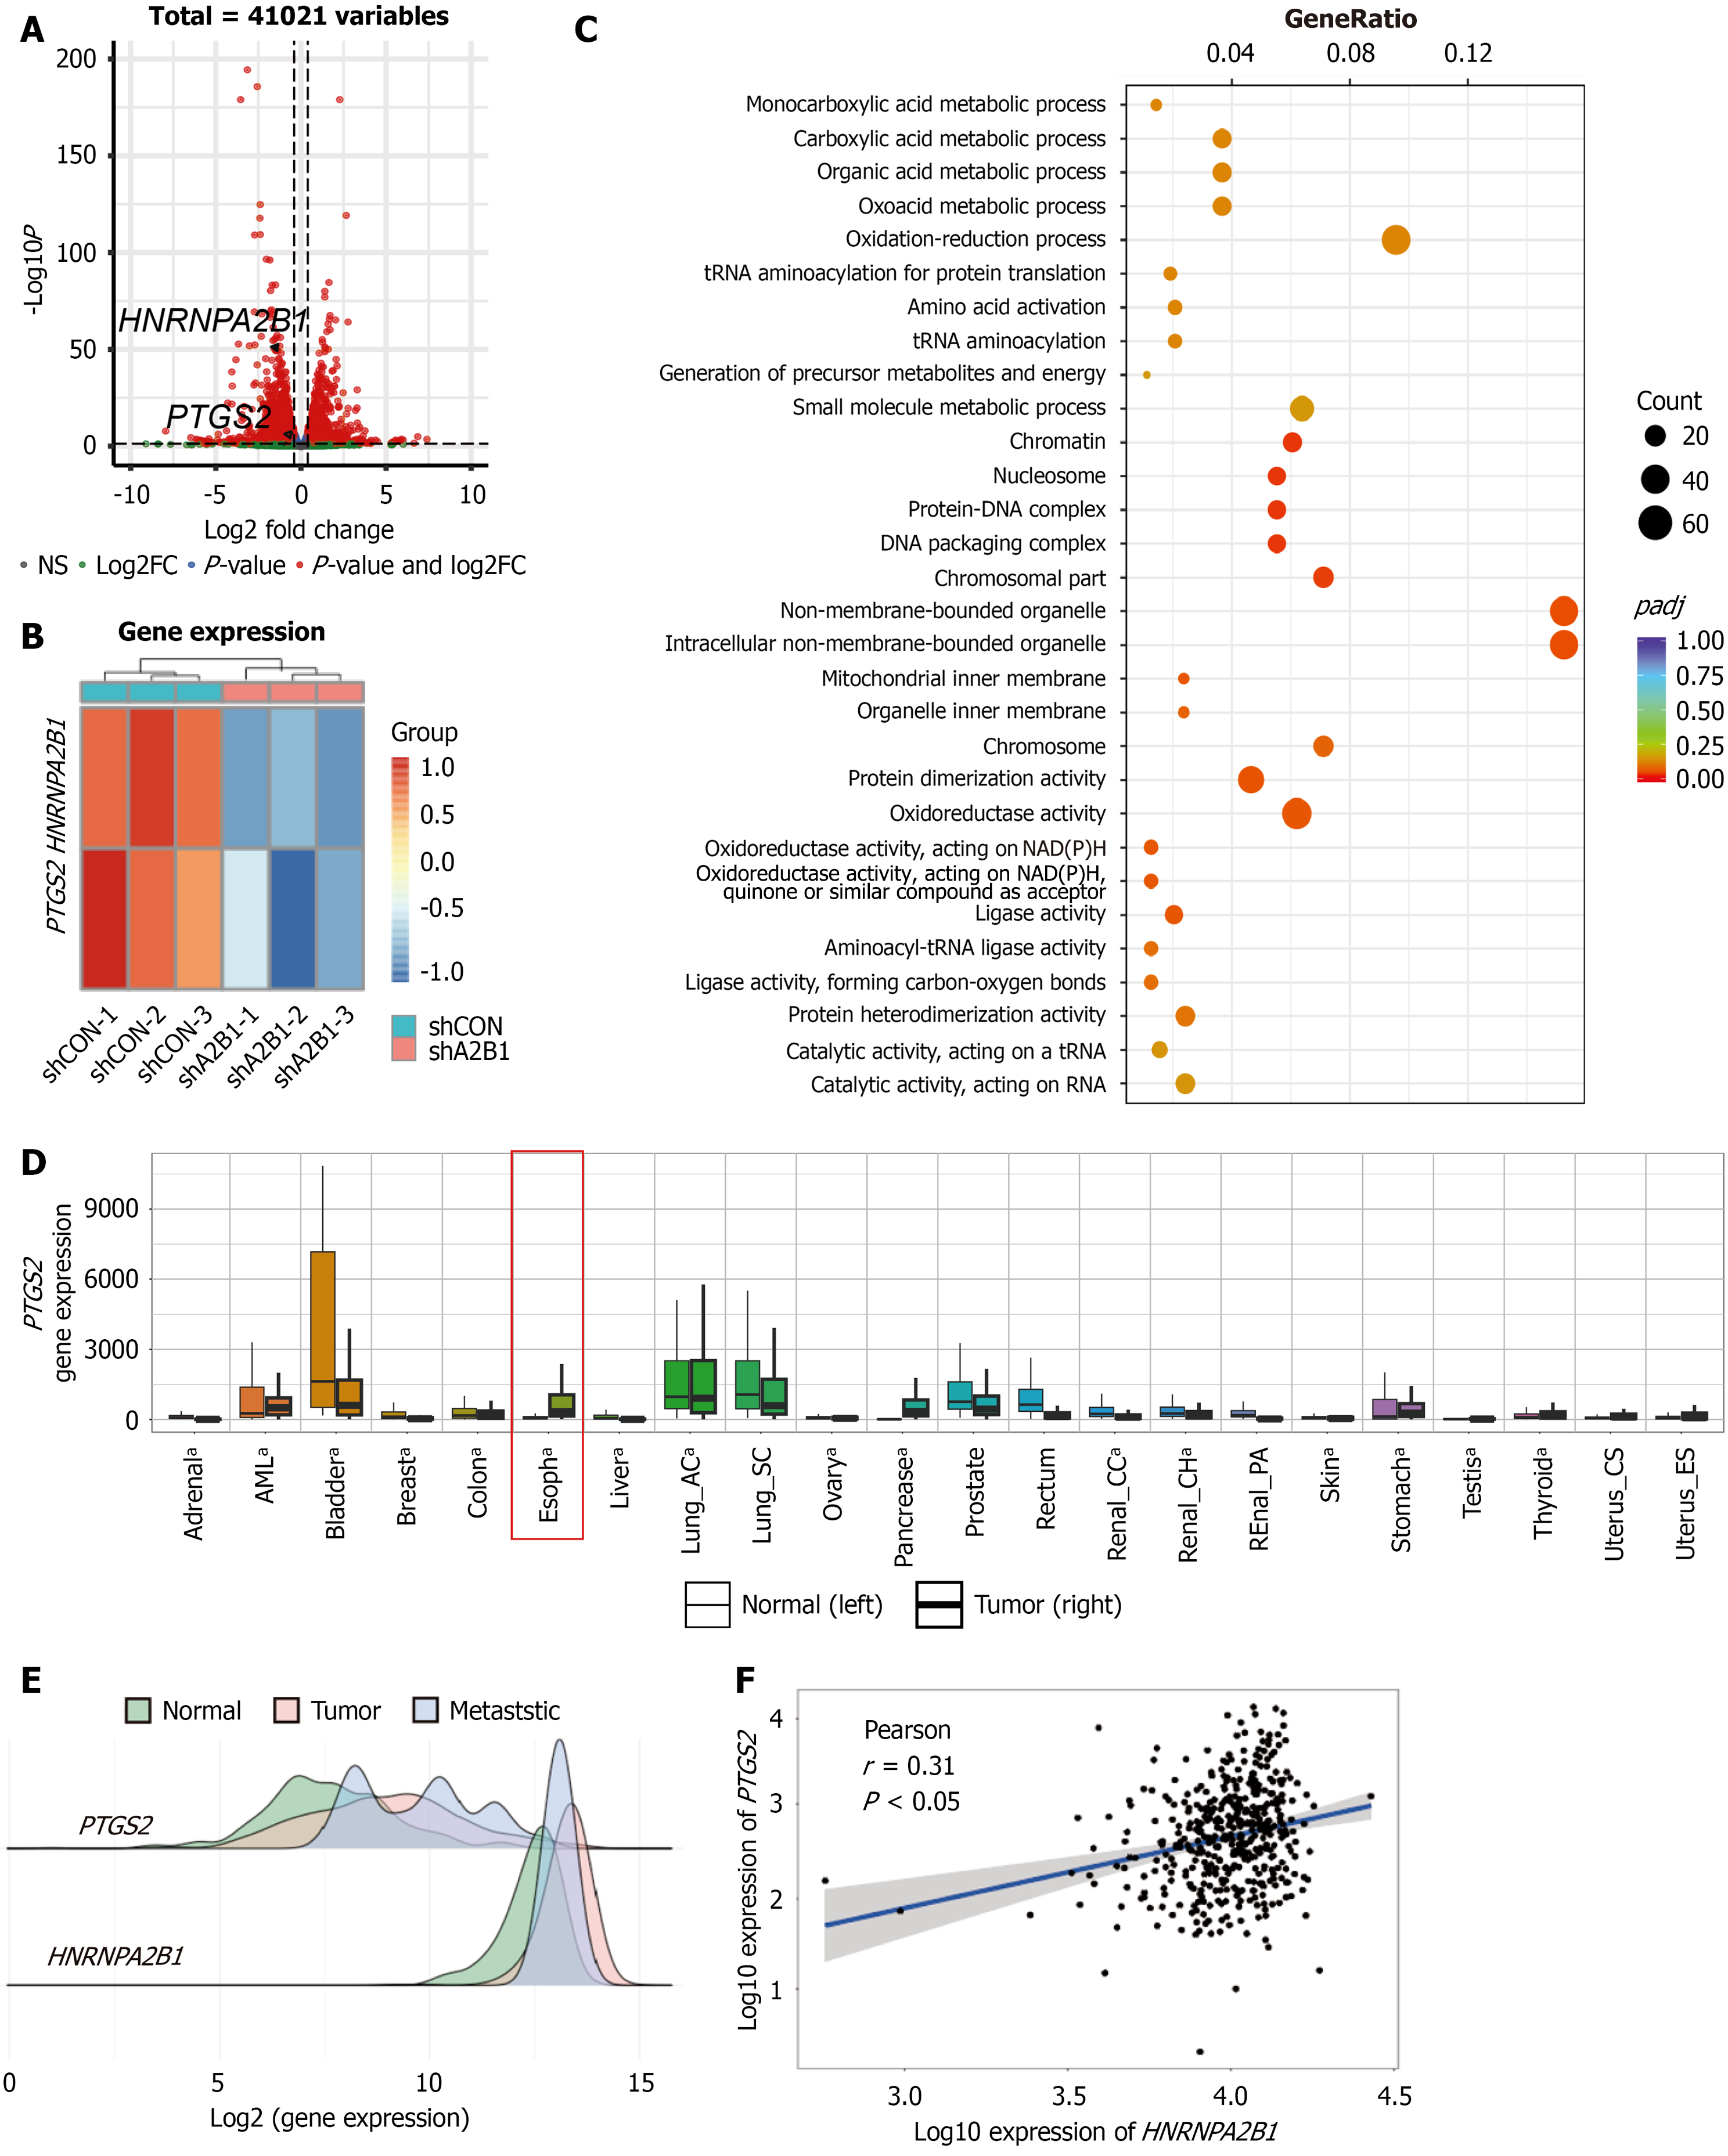
Figure 3 Transcriptomic analyses identify prostaglandin-endoperoxide synthase 2/cyclooxygenase-2 as a downstream target of hnRNPA2B1 in esophageal carcinoma.
A: Volcano plot of differentially expressed genes in Eca109 cells transduced with control short hairpin RNA or hnRNPA2B1 short hairpin RNA, based on bulk RNA-seq; B: Heatmap showing the relative expression of prostaglandin-endoperoxide synthase 2 (PTGS2) and HnRNPA2B1 in control short hairpin RNA and hnRNPA2B1 short hairpin RNA samples; C: Gene Ontology enrichment analysis of HNRNPA2B1-regulated differentially expressed genes, presented as a bubble plot; D: Pan-cancer analysis of PTGS2 expression in normal (left) and tumor (right) tissues from The Cancer Genome Atlas, with the esophageal cohort highlighted; E: Distribution of PTGS2 and HnRNPA2B1 expression in normal, primary tumor, and metastatic tissues based on The Cancer Genome Atlas data; F: Correlation analysis between HnRNPA2B1 and PTGS2 expression in esophageal carcinoma samples. Statistical significance was assessed as indicated in each panel. Pearson’s correlation analysis was used in (F). aP < 0.05. shCON: Control short hairpin RNA; shA2B1: HnRNPA2B1 short hairpin RNA; PTGS2: Prostaglandin-endoperoxide synthase 2.
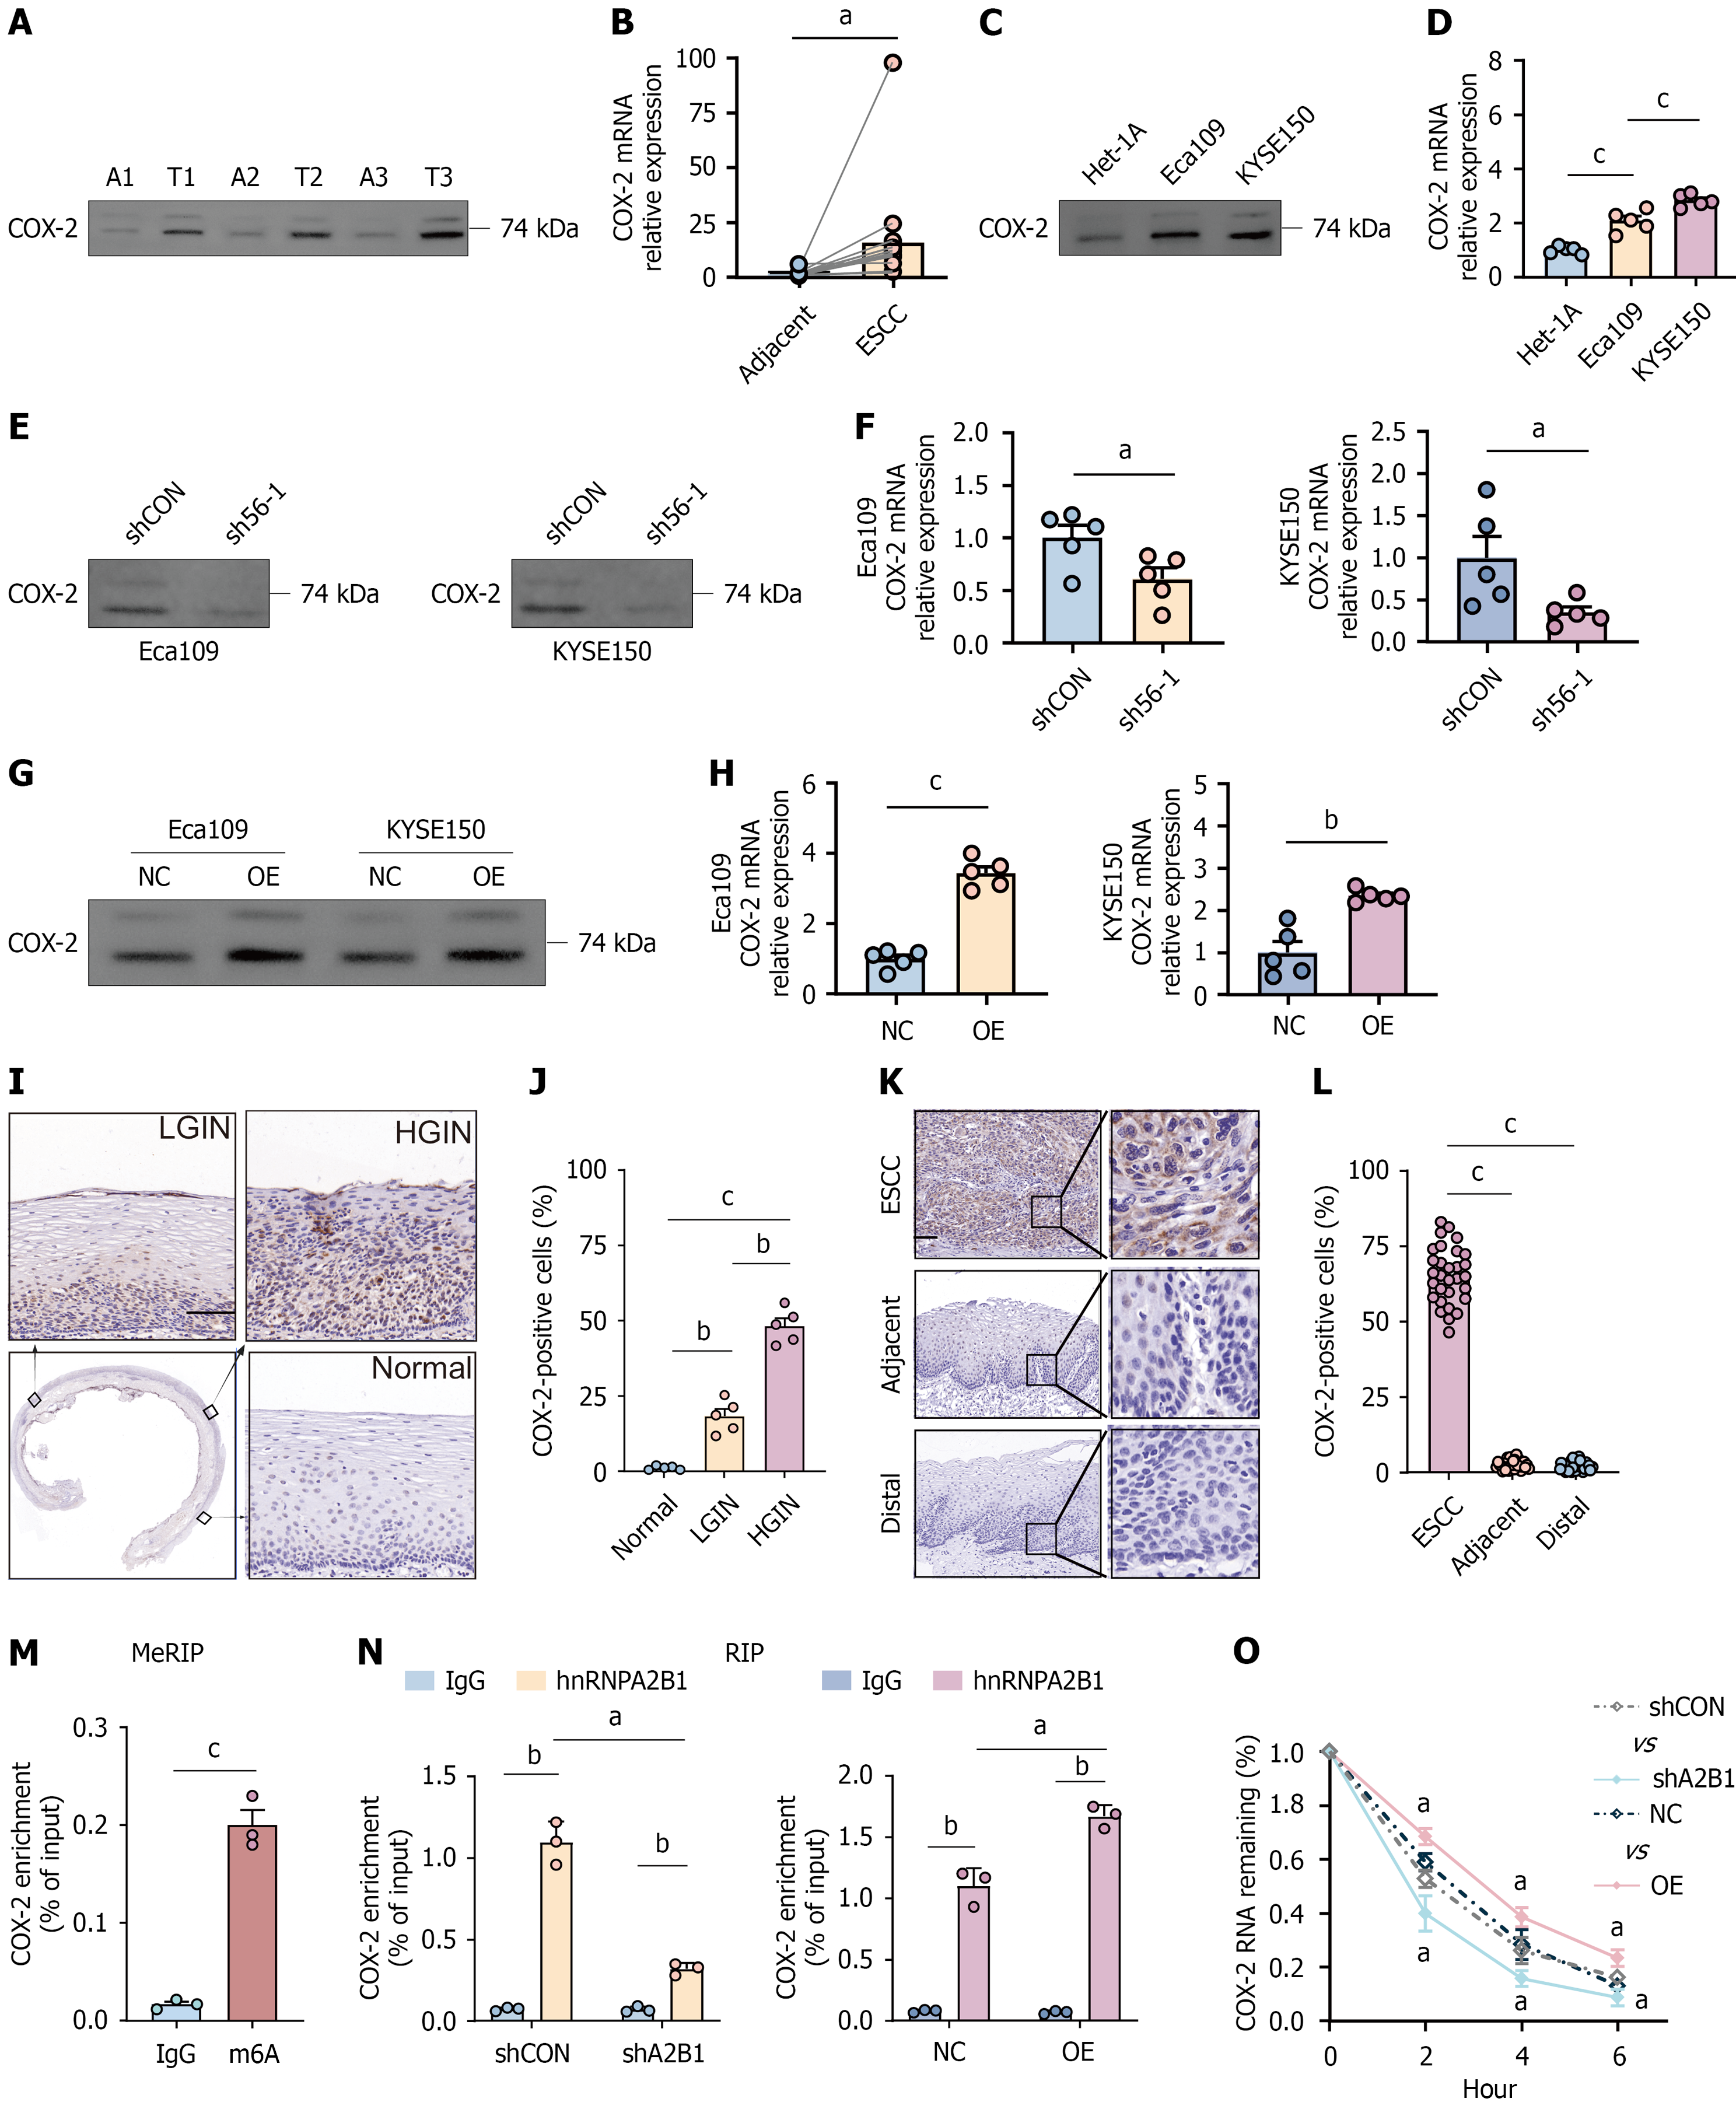
Figure 4 HnRNPA2B1 stabilizes m6A-modified cyclooxygenase-2 mRNA and promotes its expression in esophageal squamous cell carcinoma.
A: Western blotting analysis of cyclooxygenase-2 (COX-2) expression in paired adjacent (A) and tumor (T) esophageal squamous cell carcinoma (ESCC) tissues from three representative patients; B: Relative COX-2 mRNA expression in paired adjacent and ESCC tissues determined by reverse transcription-quantitative polymerase chain reaction (RT-qPCR); C: Western blotting analysis of COX-2 expression in Het-1A cells and ESCC cell lines (Eca109 and KYSE150); D: Relative COX-2 mRNA expression in Het-1A, Eca109, and KYSE150 cells determined by RT-qPCR; E: Western blotting analysis of COX-2 expression in Eca109 and KYSE150 cells transduced with control short hairpin RNA or hnRNPA2B1 short hairpin RNA (sh56-1); F: Relative COX-2 mRNA expression in Eca109 and KYSE150 cells after hnRNPA2B1 knockdown, as determined by RT-qPCR; G: Western blotting analysis of COX-2 expression in Eca109 and KYSE150 cells transduced with negative control or hnRNPA2B1 overexpression vector; H: Relative COX-2 mRNA expression in Eca109 and KYSE150 cells after hnRNPA2B1 overexpression, as determined by RT-qPCR; I: Representative immunohistochemistry staining of COX-2 in normal esophageal epithelium, low-grade intraepithelial neoplasia, and high-grade intraepithelial neoplasia from endoscopic submucosal dissection specimens; J: Quantification of COX-2-positive cells in normal, low-grade intraepithelial neoplasia, and high-grade intraepithelial neoplasia tissues; K: Representative immunohistochemistry staining of COX-2 in ESCC tissues and matched adjacent and distal tissues; L: Quantification of COX-2-positive cells in ESCC, adjacent, and distal tissues; M: Methylated RNA immunoprecipitation-qPCR analysis in Eca109 cells showing enrichment of COX-2 mRNA in the m6A-immunoprecipitated fraction relative to the IgG control; N: RNA immunoprecipitation-qPCR analysis in Eca109 cells showing enrichment of COX-2 mRNA in hnRNPA2B1 immunoprecipitates, with reduced enrichment after hnRNPA2B1 knockdown and increased enrichment after hnRNPA2B1 overexpression; O: Actinomycin D assay in Eca109 cells showing COX-2 mRNA decay after hnRNPA2B1 knockdown or overexpression. (Panels A, C, E, and G were derived from the same membranes as Figure 1I and K, Figure 2A and C, respectively, so that hnRNPA2B1 and COX-2 expression could be assessed in the same samples. The corresponding loading controls are shown in Figure 1I and K, Figure 2A and C, respectively.) Data are presented as mean ± SD. Statistical significance was determined by Student’s t-test for two-group comparisons or one-way ANOVA for multiple-group comparisons, as appropriate. Scale bars = 100 μm. aP < 0.05, bP < 0.01, and cP < 0.001. COX-2: Cyclooxygenase-2; ESCC: Esophageal squamous cell carcinoma; shCON: Control short hairpin RNA; NC: Negative control; OE: Overexpression; shA2B1: HnRNPA2B1 short hairpin RNA; LGIN: Low-grade intraepithelial neoplasia; HGIN: High-grade intraepithelial neoplasia; MeRIP: Methylated RNA immunoprecipitation; RIP: RNA immunoprecipitation.
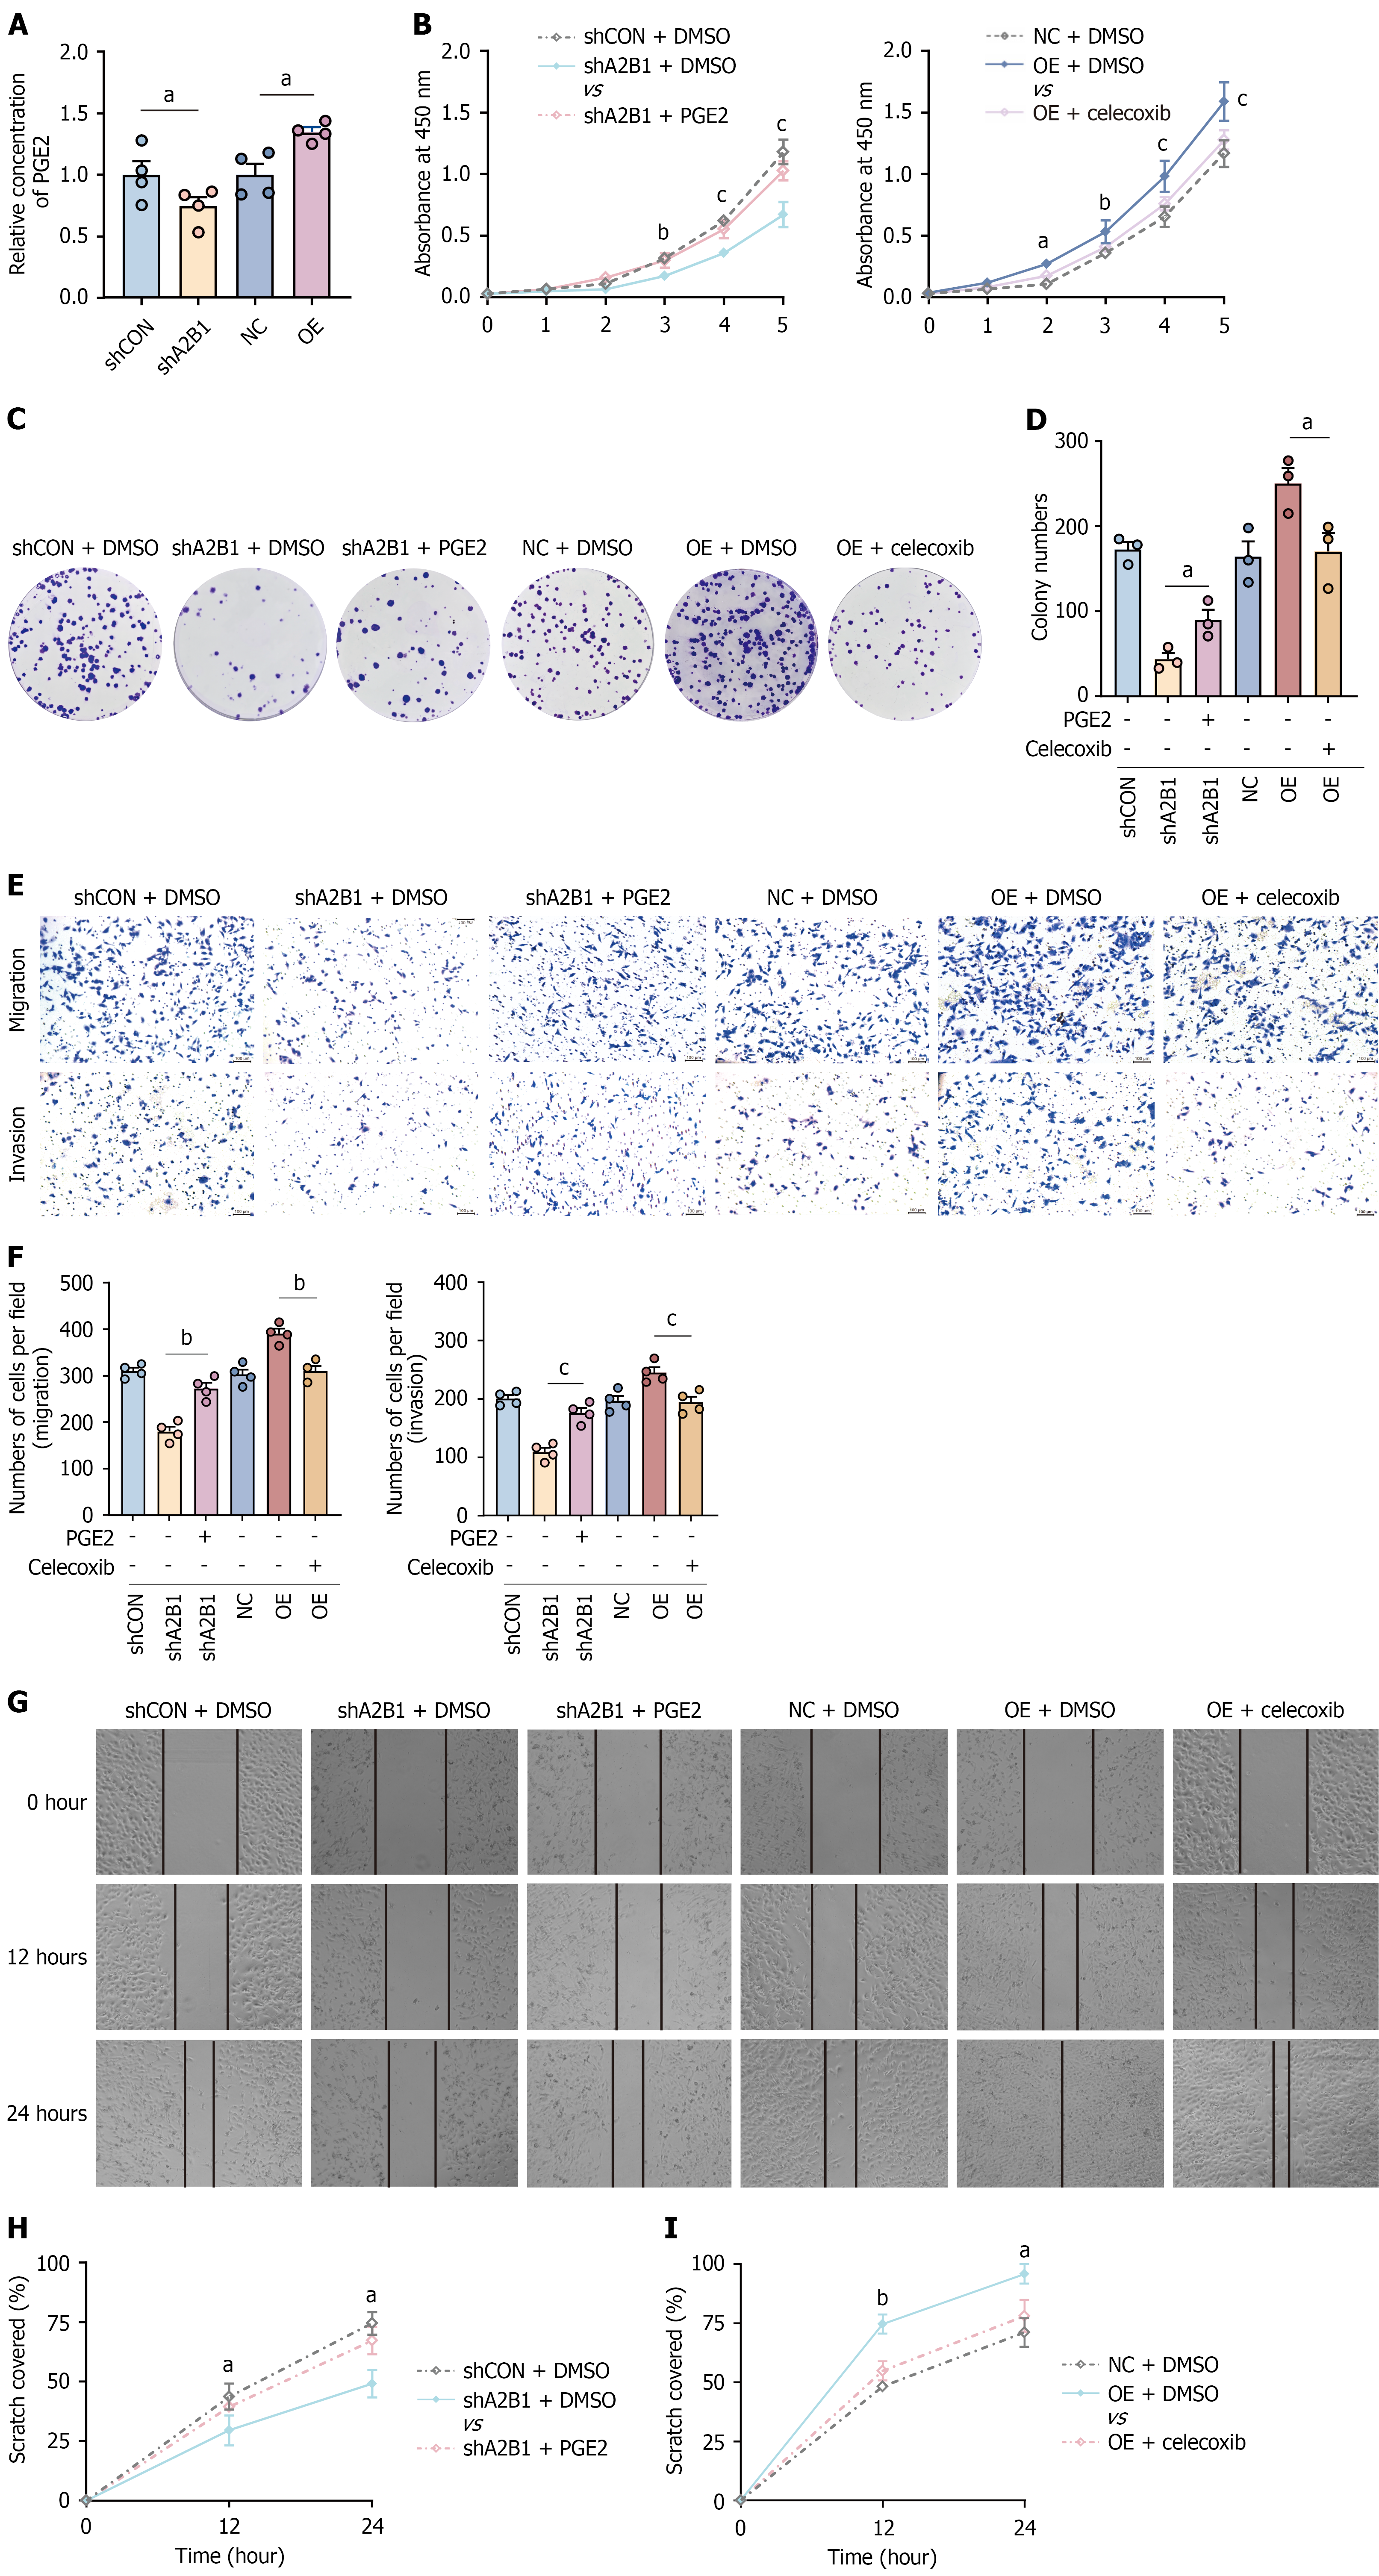
Figure 5 Targeting the hnRNPA2B1-cyclooxygenase-2/prostaglandin E2 axis suppresses esophageal squamous cell carcinoma cell growth and motility in vitro.
A: Relative prostaglandin E2 (PGE2) production measured by ELISA in esophageal squamous cell carcinoma cells after hnRNPA2B1 knockdown or overexpression; B: Cell counting kit-8 assays showing the effects of PGE2 supplementation (1 μM) on hnRNPA2B1-silenced cells and celecoxib treatment (10 μM) on hnRNPA2B1-overexpressing cells, with 0.1% DMSO as the vehicle control; C: Representative images of colony formation assays under the indicated conditions; D: Quantification of colony numbers in (C); E: Representative images of Transwell migration and invasion assays under the indicated conditions; F: Quantification of migrated and invaded cells in (E); G: Representative images of wound-healing assays at 0, 12, and 24 hours under the indicated conditions; H: Quantification of wound closure in the PGE2 rescue experiments; I: Quantification of wound closure in the celecoxib inhibition experiments. Data are presented as mean ± SD. Statistical significance was determined by Student’s t-test for two-group comparisons or one-way ANOVA for multiple-group comparisons, as appropriate. aP < 0.05, bP < 0.01, and cP < 0.001. shCON: Control short hairpin RNA; NC: Negative control; OE: Overexpression; shA2B1: HnRNPA2B1 short hairpin RNA; PGE2: Prostaglandin E2; DMSO: Dimethyl sulfoxide.
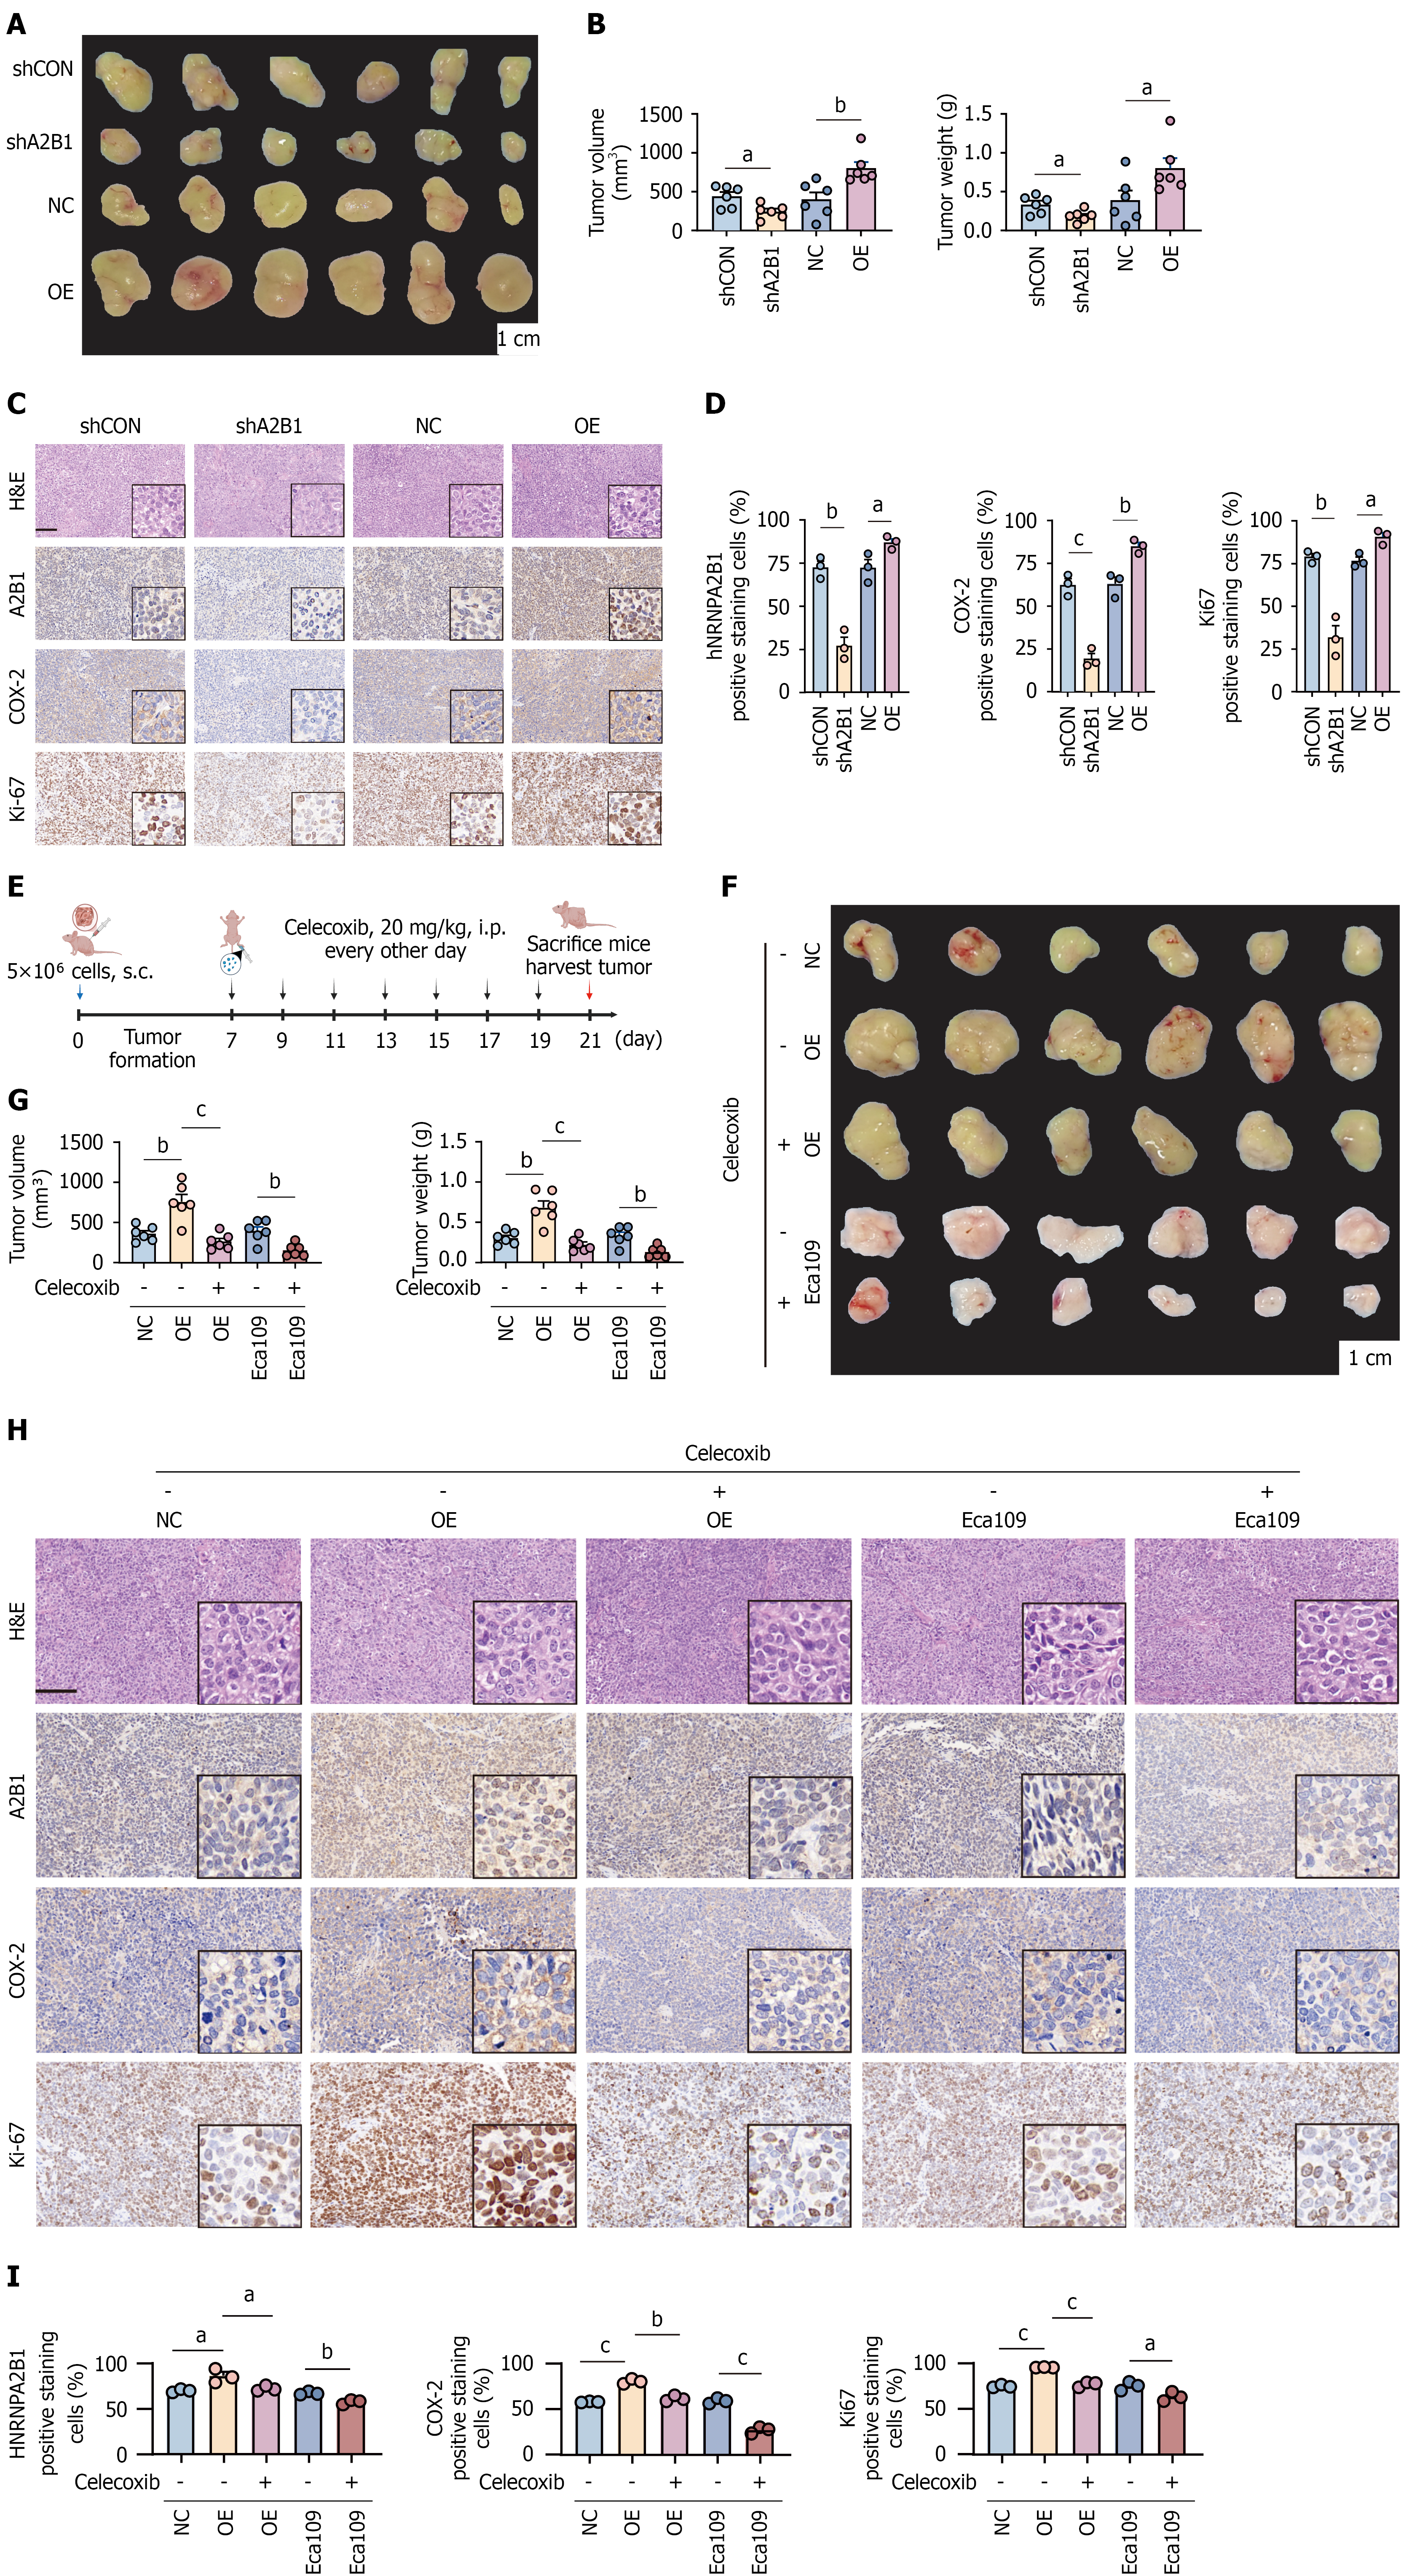
Figure 6 Targeting the hnRNPA2B1-cyclooxygenase-2/prostaglandin E2 axis suppresses esophageal squamous cell carcinoma tumor growth in vivo.
A: Representative images of subcutaneous xenograft tumors derived from Eca109 cells with hnRNPA2B1 knockdown (hnRNPA2B1 short hairpin RNA) or corresponding control (control short hairpin RNA), and hnRNPA2B1 overexpression or corresponding control (negative control); B: Quantification of tumor volume and tumor weight in the indicated groups; C: Representative hematoxylin and eosin and immunohistochemistry staining of hnRNPA2B1, cyclooxygenase-2 (COX-2), and Ki-67 in xenograft tumors from the indicated groups; D: Quantification of hnRNPA2B1-, COX-2-, and Ki-67-positive cells in (C); E: Schematic diagram of the xenograft study design and celecoxib treatment regimen; F: Representative images of xenograft tumors from mice bearing negative control or overexpression Eca109 xenografts with or without celecoxib treatment, and parental Eca109 xenografts with or without celecoxib treatment; G: Quantification of tumor volume and tumor weight in the groups shown in (F); H: Representative hematoxylin and eosin and immunohistochemistry staining of hnRNPA2B1, COX-2, and Ki-67 in xenograft tumors with or without celecoxib treatment, as indicated; I: Quantification of hnRNPA2B1-, COX-2-, and Ki-67-positive cells in (H). Data are presented as mean ± SD. Statistical significance was determined by Student’s t-test for two-group comparisons or one-way ANOVA for multiple-group comparisons, as appropriate. Scale bars = 1 cm in (A) and (F), and 100 μm in (C) and (H). aP < 0.05, bP < 0.01, and cP < 0.001. shCON: Control short hairpin RNA; NC: Negative control; OE: Overexpression; shA2B1: HnRNPA2B1 short hairpin RNA; COX-2: Cyclooxygenase-2; H&E: Hematoxylin and eosin; i.p.: Intraperitoneal; s.c.: Subcutaneous.
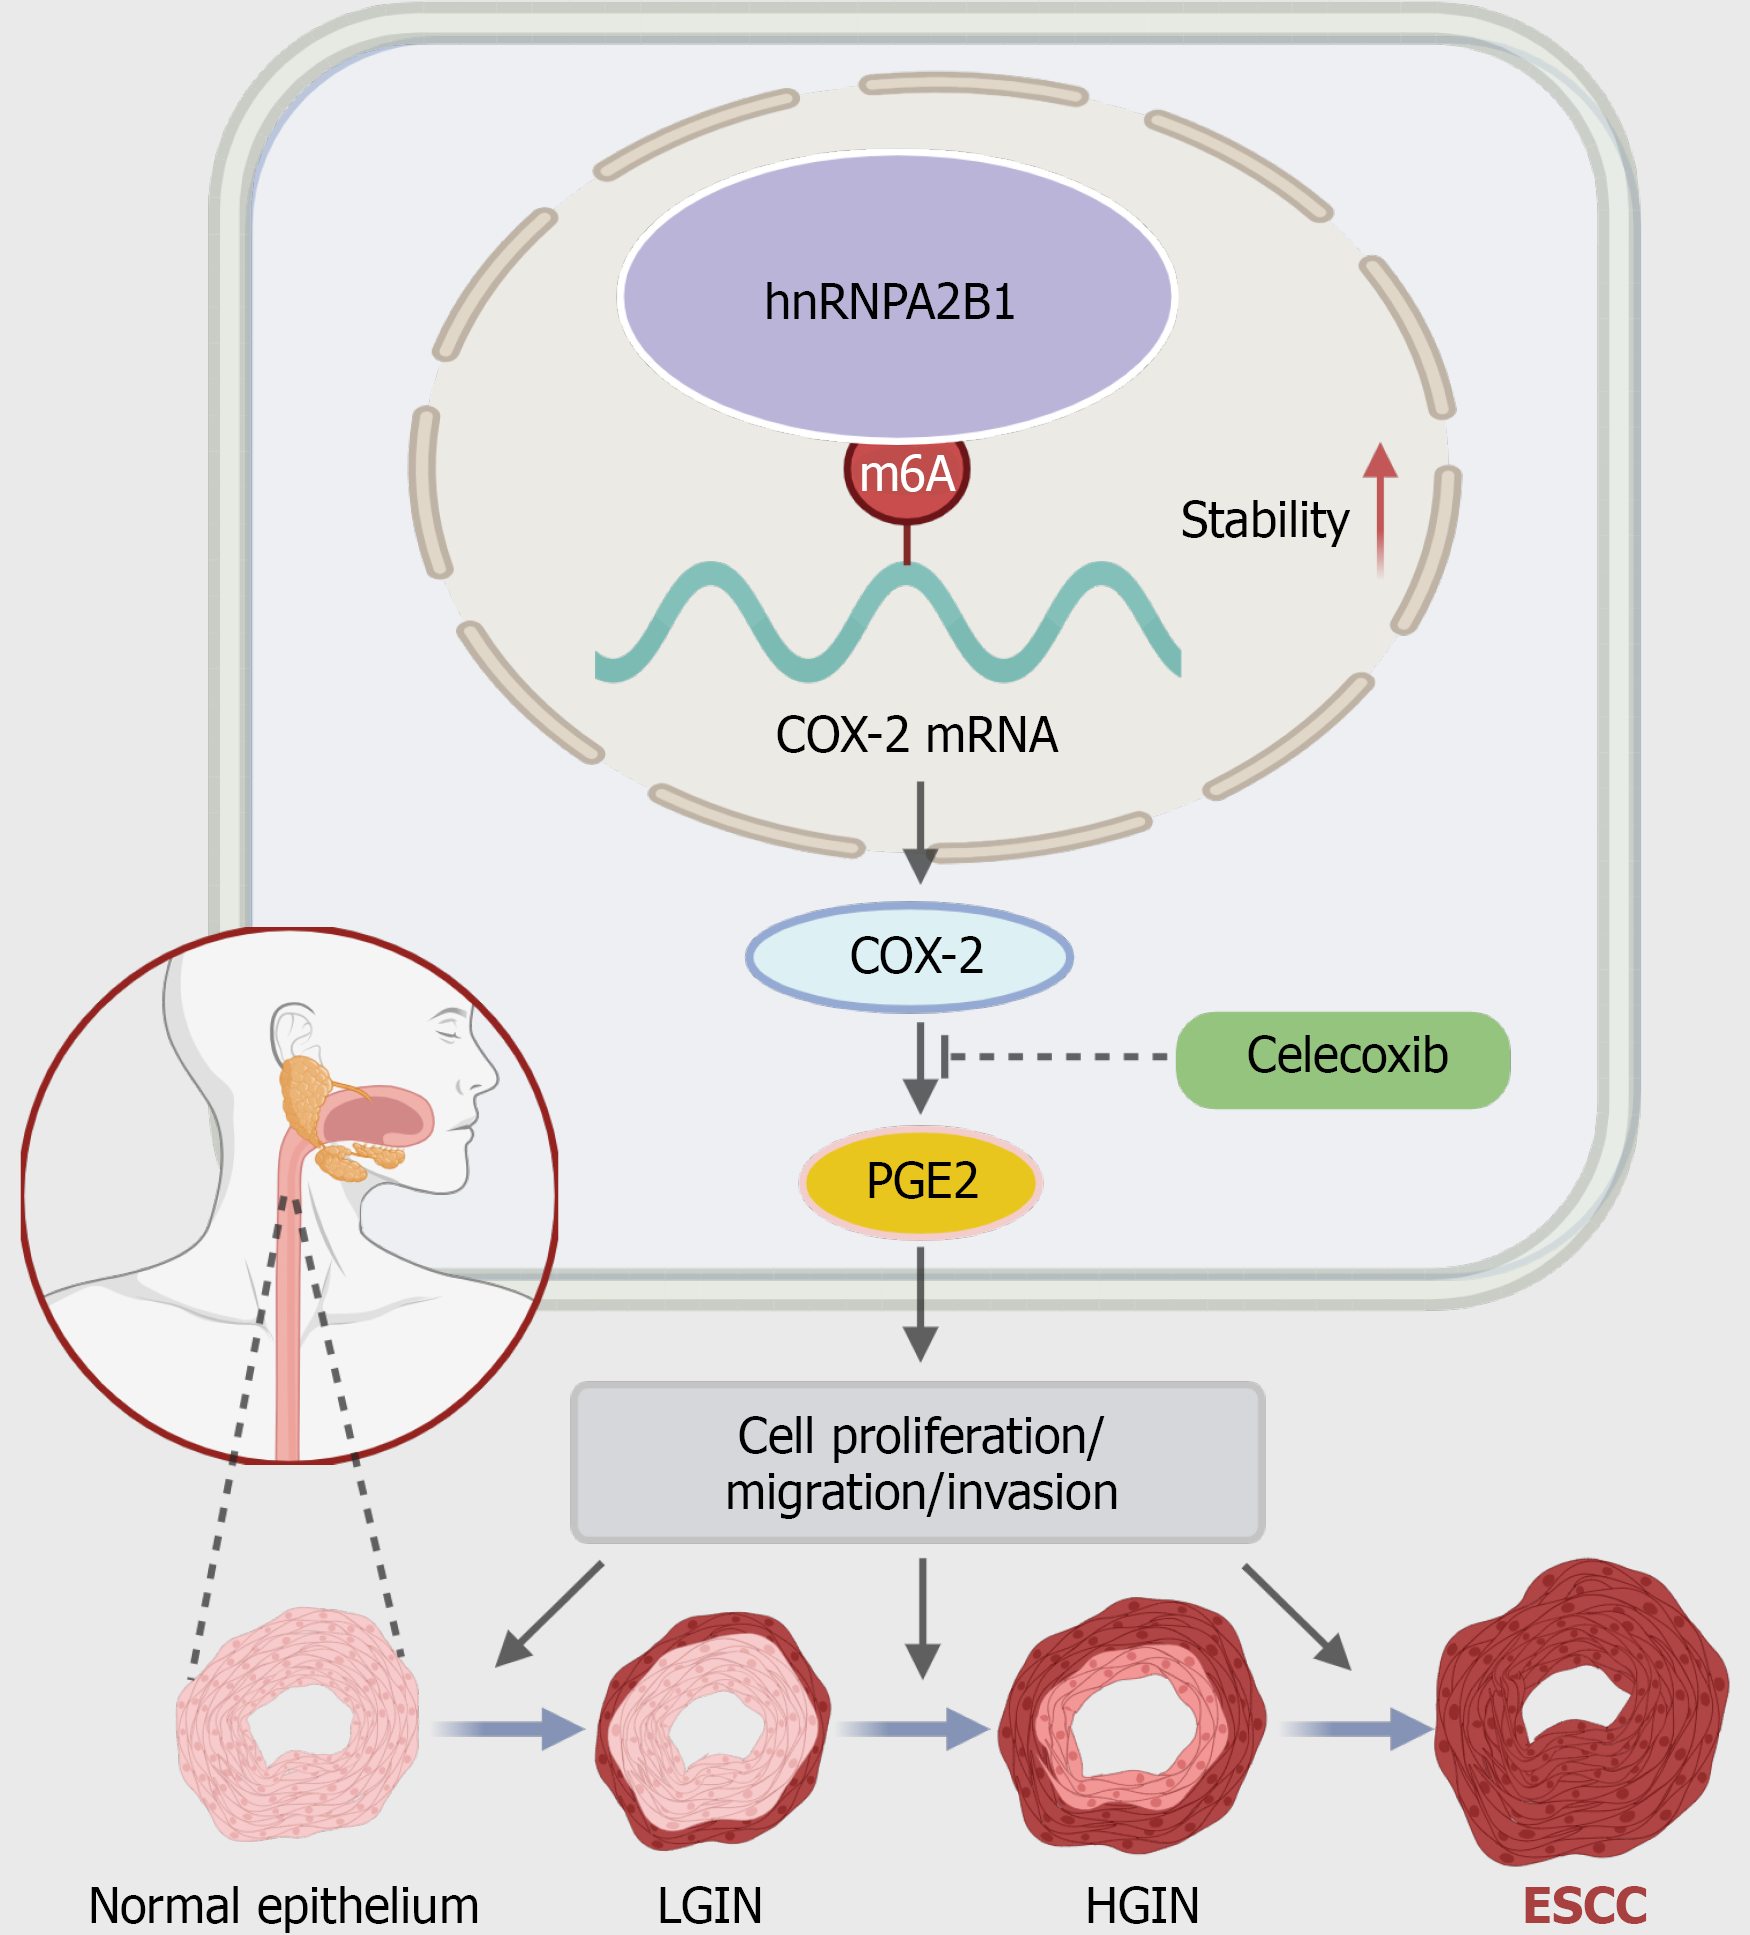
Figure 7 Schematic model illustrating the hnRNPA2B1-cyclooxygenase-2/prostaglandin E2 axis in esophageal squamous cell carcinoma progression.
(Created in BioRender. https://BioRender.com/5wlddw2). LGIN: Low-grade intraepithelial neoplasia; HGIN: High-grade intraepithelial neoplasia; ESCC: Esophageal squamous cell carcinoma; PGE2: Prostaglandin E2; COX-2: Cyclooxygenase-2; m6A: N6-methyladenosine.
- Citation: Lu JQ, Fang XF, Guo XX, Liu M, Lin JH, Zheng HL, Zhong CM, Lin QY, Huang XY, Wang XZ, Tian H, Que JW, Chen FL, Zheng BY. Epitranscriptomic regulation of the COX-2/PGE2 axis by hnRNPA2B1 promotes esophageal squamous cell carcinoma progression. World J Gastroenterol 2026; 32(41): 121890
- URL: https://www.wjgnet.com/1007-9327/full/v32/i41/121890.htm
- DOI: https://dx.doi.org/10.3748/wjg.121890