
















Copyright: ©Author(s) 2026.
World J Gastroenterol. Oct 21, 2026; 32(39): 121007
Published online Oct 21, 2026. doi: 10.3748/wjg.121007
Published online Oct 21, 2026. doi: 10.3748/wjg.121007
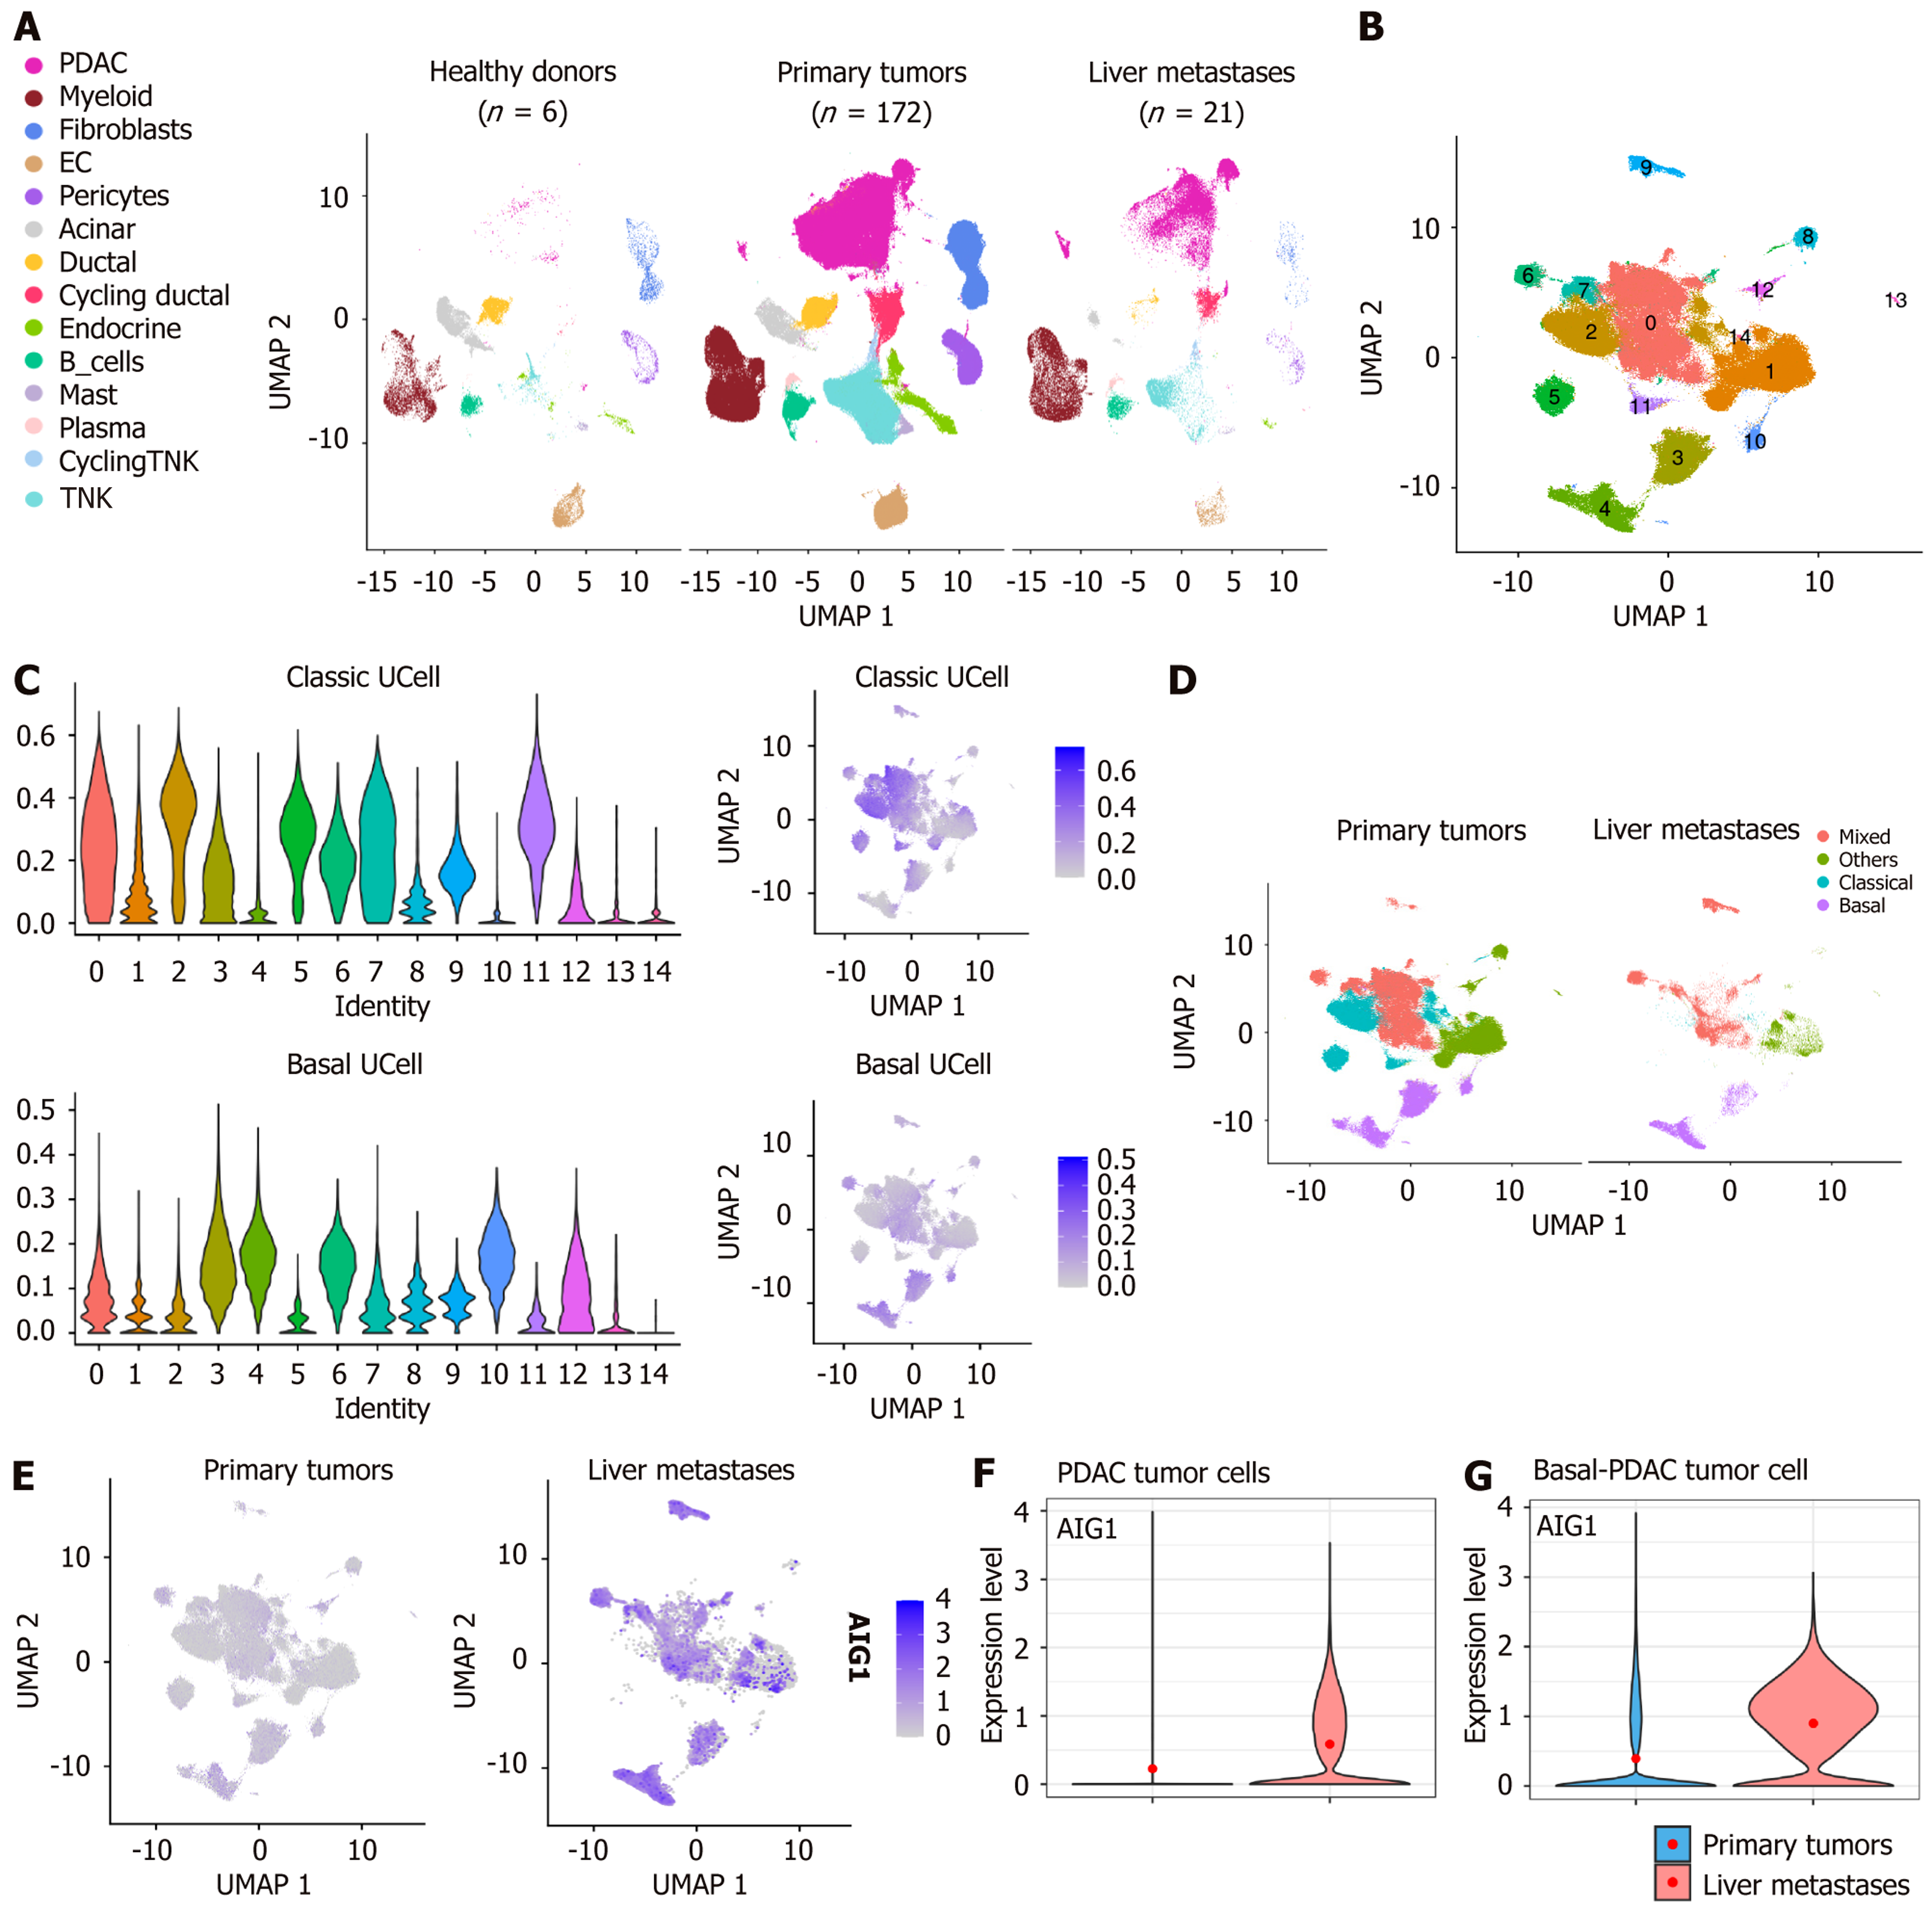
Figure 1 Human single-cell RNA sequencing analysis identifies basal-associated androgen-induced gene 1 upregulation during pancreatic ductal adenocarcinoma liver metastasis.
A: Global cellular landscape of human pancreatic tissues across disease states. Uniform manifold approximation and projection (UMAP) visualization of (n = 6) healthy donor pancreata, (n = 172) primary pancreatic tumors, and (n = 21) metastatic biopsies from the liver. The “pancreatic ductal adenocarcinoma (PDAC)” cluster represents PDAC tumor cells; B: Subclustering of PDAC tumor cells from primary tumor and liver metastatic. UMAP analysis resolved the cells into 15 distinct clusters; C: Single-cell scoring of classical and basal transcriptional programs in PDAC tumor cells. Violin plots (left) show the distribution of classical and basal signature scores across individual tumor cell subpopulations. FeaturePlots (right) visualize the spatial distribution of signature scores across the tumor cell UMAP embedding; D: UMAP visualization of PDAC tumor cells stratified by disease state and renamed by molecular subtypes; E: FeaturePlot showing increased AIG1 expression and broad distribution in tumor cells from liver metastases; F: Violin plot showing elevated AIG1 expression in tumor cells from liver metastases. Compared using Wilcoxon rank-sum test, with adjusted P < 0.0001; G: Enhanced AIG1 expression in basal-like tumor cells during liver metastasis. Compared using Wilcoxon rank-sum test, with adjusted P < 0.0001. PDAC: Pancreatic ductal adenocarcinoma; EC: Endothelial cells; TNK: T and natural killer; NK: Natural killer; AIG1: Androgen-induced gene 1.
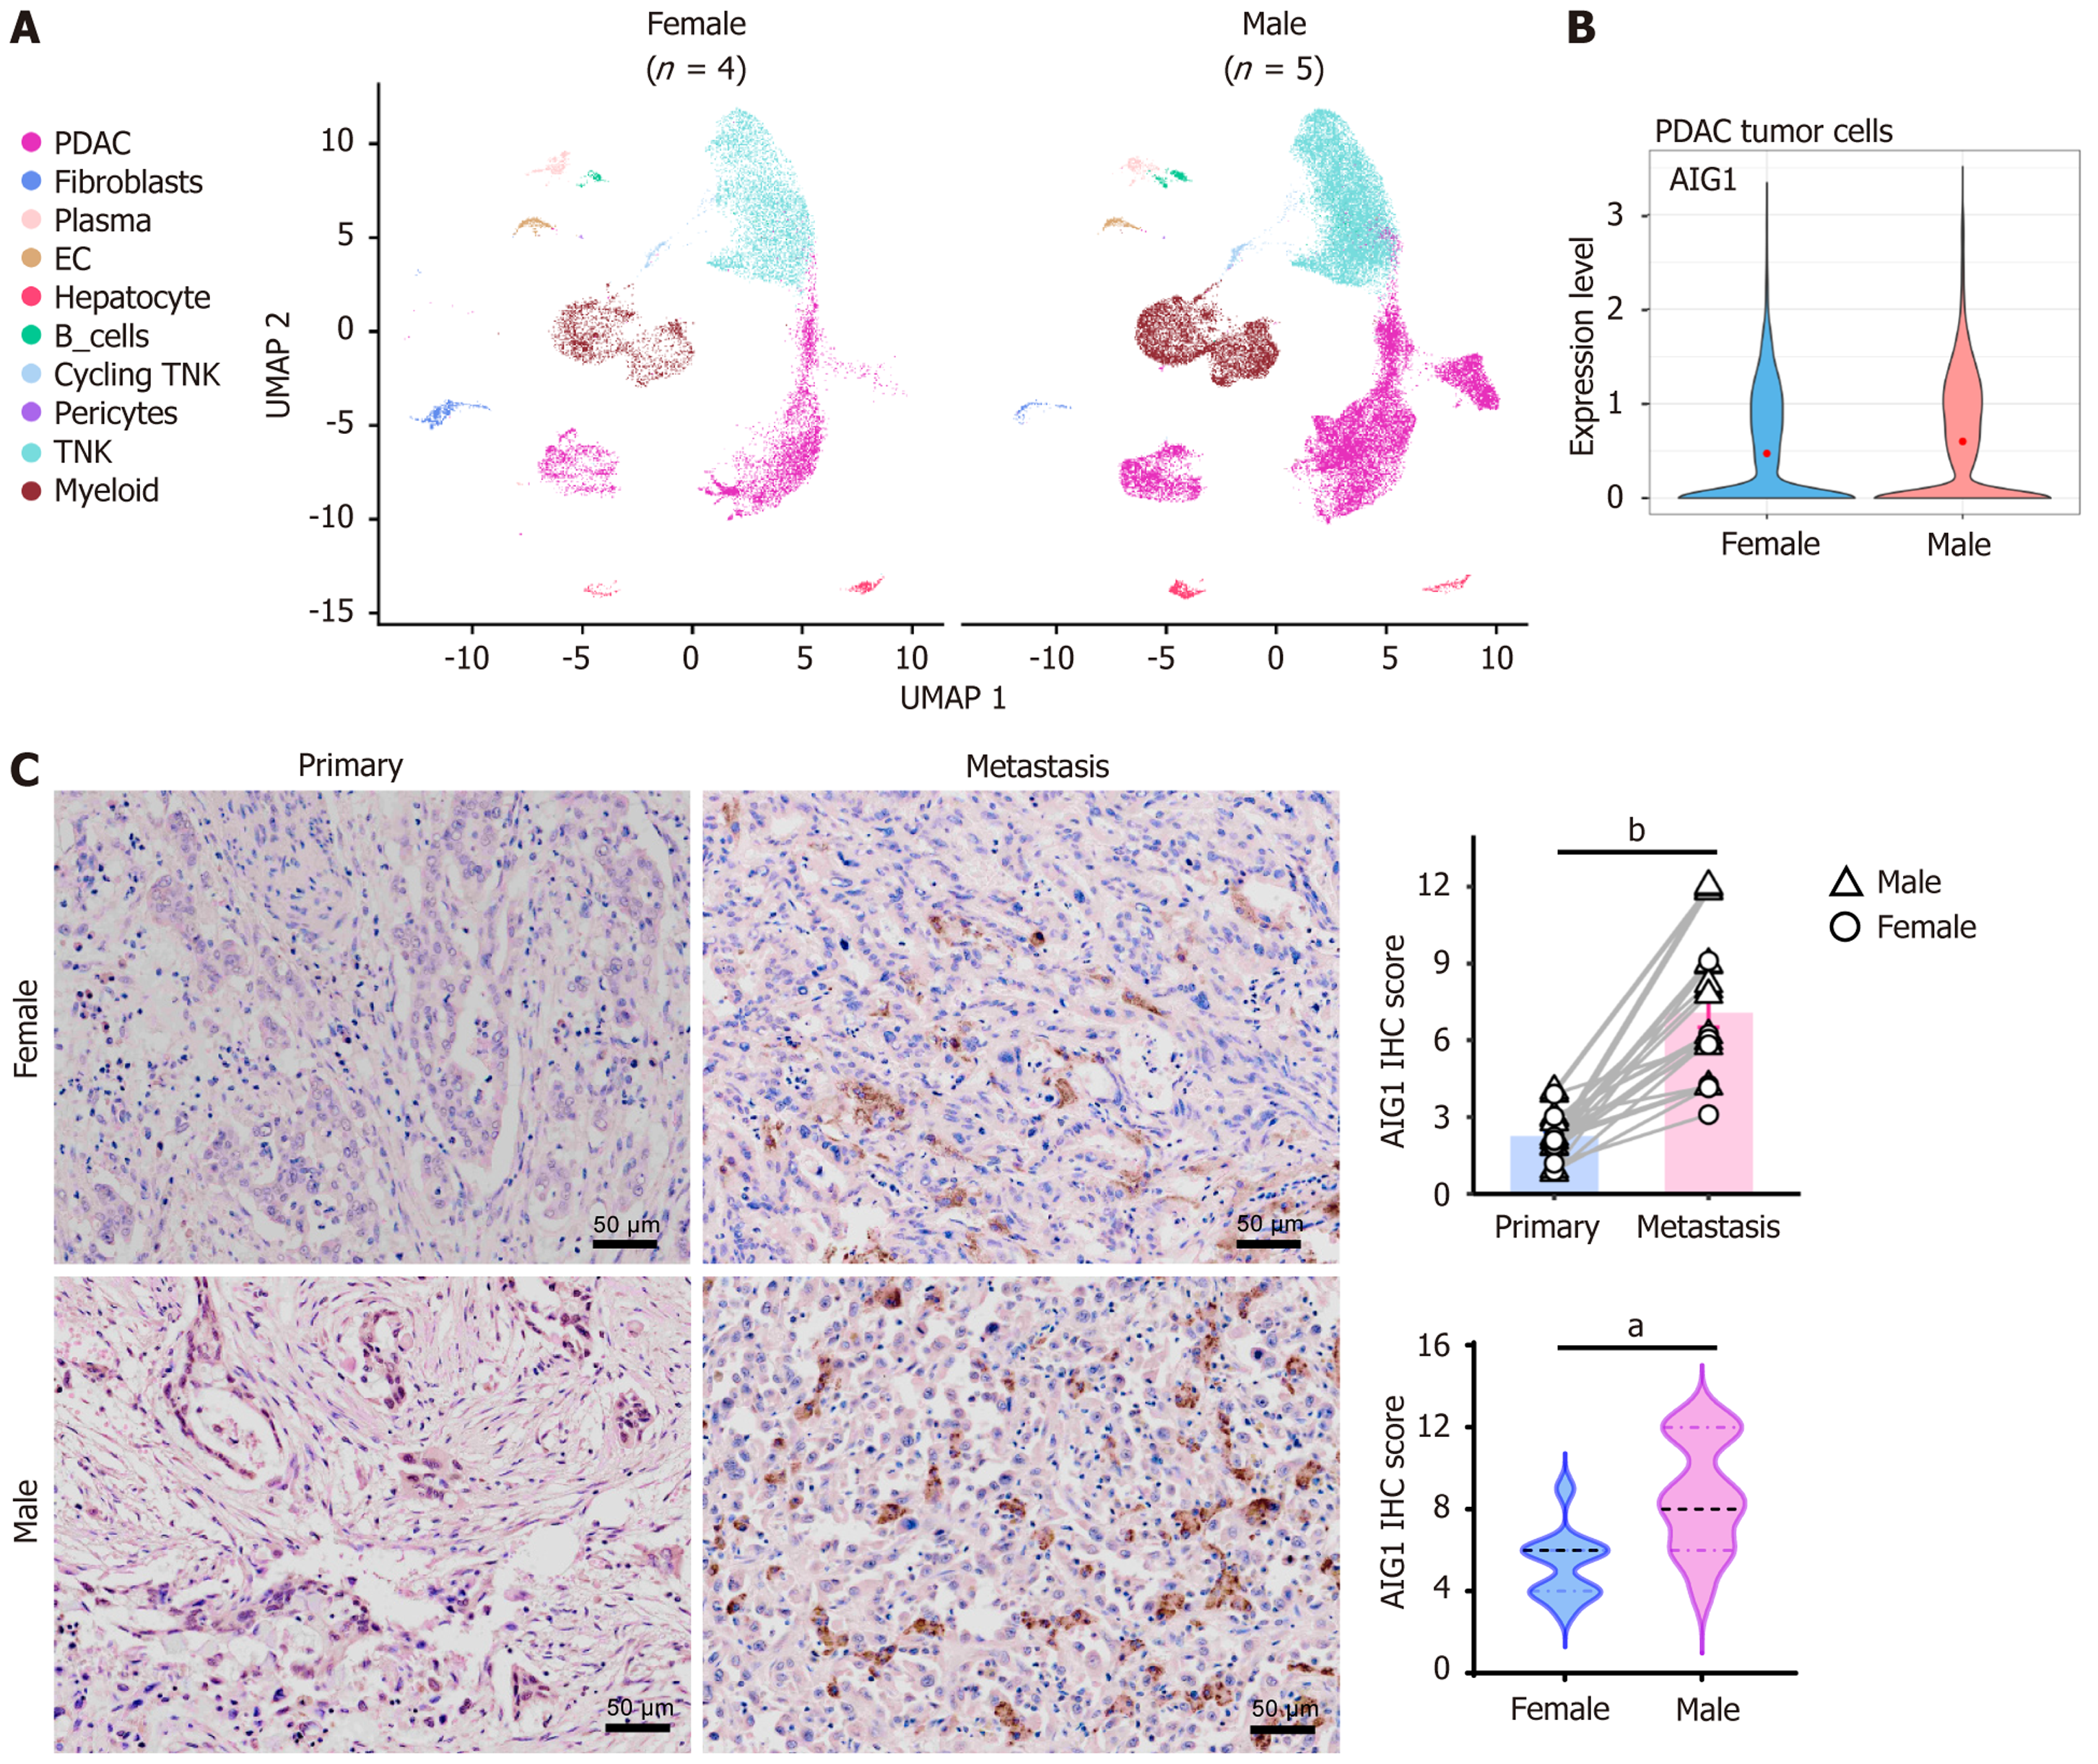
Figure 2 Sex-associated expression pattern of androgen-induced gene 1 in human pancreatic ductal adenocarcinoma liver metastases.
A: Uniform manifold approximation and projection visualization of liver metastatic samples stratified by sex (male, n = 5; female, n = 4) from the public single-cell RNA sequencing dataset; B: Violin plot showing androgen-induced gene 1 (AIG1) expression levels in tumor cells derived from male and female liver metastases. Compared using Wilcoxon rank-sum test, with adjusted P < 0.0001; C: Representative immunohistochemical staining of AIG1 in paired primary pancreatic tumors and matched liver metastatic lesions from patients (n = 24; 13 males and 11 females). Semi-quantification of AIG1 immunohistochemical scores is shown on the right. Comparisons between primary and metastatic tumors were performed using Wilcoxon signed-rank test, and comparisons between male and female metastatic samples were performed using Mann-Whitney U test. aP < 0.01; bP < 0.0001. Scale bar = 50 μm. PDAC: Pancreatic ductal adenocarcinoma; EC: Endothelial cells; TNK: T and natural killer; NK: Natural killer; AIG1: Androgen-induced gene 1; IHC: Immunohistochemical.
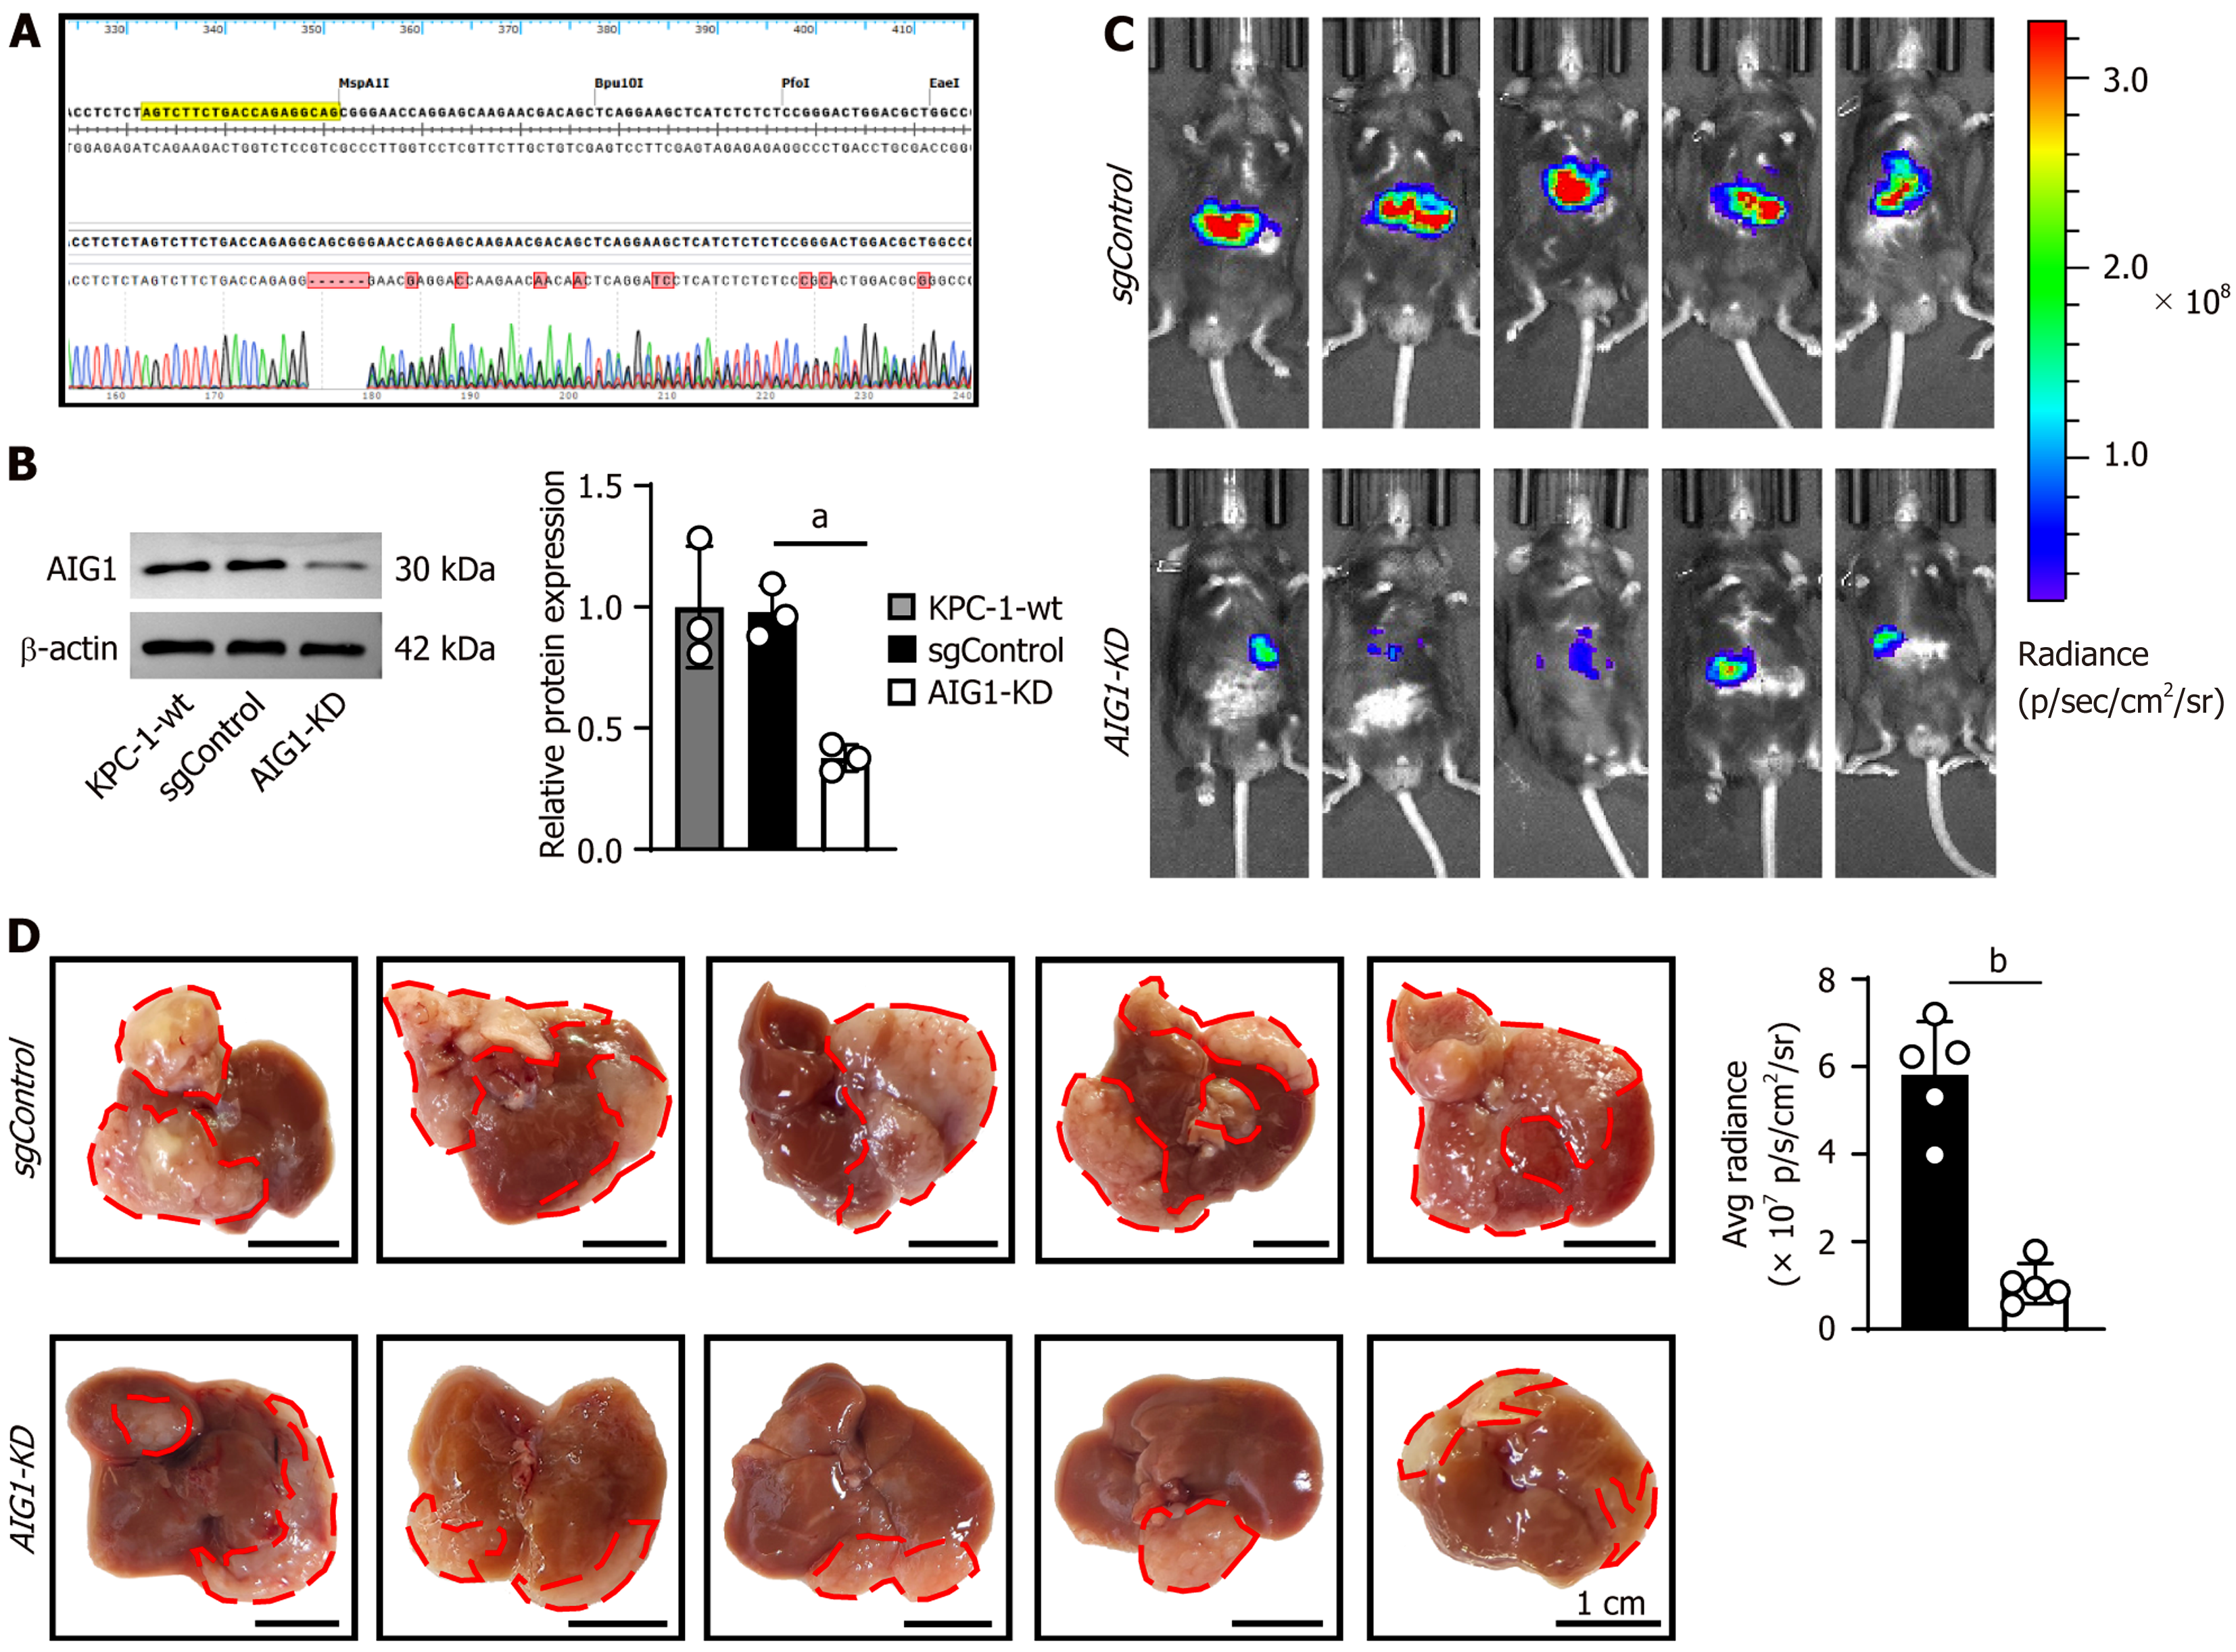
Figure 3 Androgen-induced gene 1 knockdown suppresses pancreatic ductal adenocarcinoma liver metastatic growth in vivo.
A: Sanger sequencing chromatograms of the androgen-induced gene 1 (AIG1) target region. Overlapping peaks downstream of the single-guide RNA target site (highlighted in yellow) indicate successful clustered regularly interspaced short palindromic repeats/Cas9-mediated indel mutations; B: Western blot analysis of AIG1 expression in KPC-1-wild type, non-targeting control single-guide RNA (sgControl) and AIG1 knockdown (AIG1-KD) cells. Quantification of AIG1 protein levels normalized to β-actin from three independent biological replicates is presented on the right. Statistical analysis was performed using one-way ANOVA followed by Tukey’s multiple comparisons test. aP < 0.01; C: In vivo bioluminescence imaging of liver metastases two weeks after portal vein injection of sgControl or AIG1-KD cells into male C57BL/6J mice (n = 5 per group). Images from all individual mice are shown. Quantification of average radiance (× 107 photons/second/cm2/steradian) is shown beneath. Each dot represents an individual mouse. Comparisons between AIG1-KD group and sgControl group were performed using unpaired t-test, bP < 0.0001; D: Gross morphology of livers harvested two weeks after portal vein injection of sgControl or AIG1-KD cells (n = 5 per group). Metastatic lesions are outlined with red dashed lines. Images from all individual mice are shown. Scale bar = 1 cm. AIG1: Androgen-induced gene 1; AIG1-KD: Androgen-induced gene 1 knockdown; wt: Wild type; sgControl: Non-targeting control single-guide RNA.
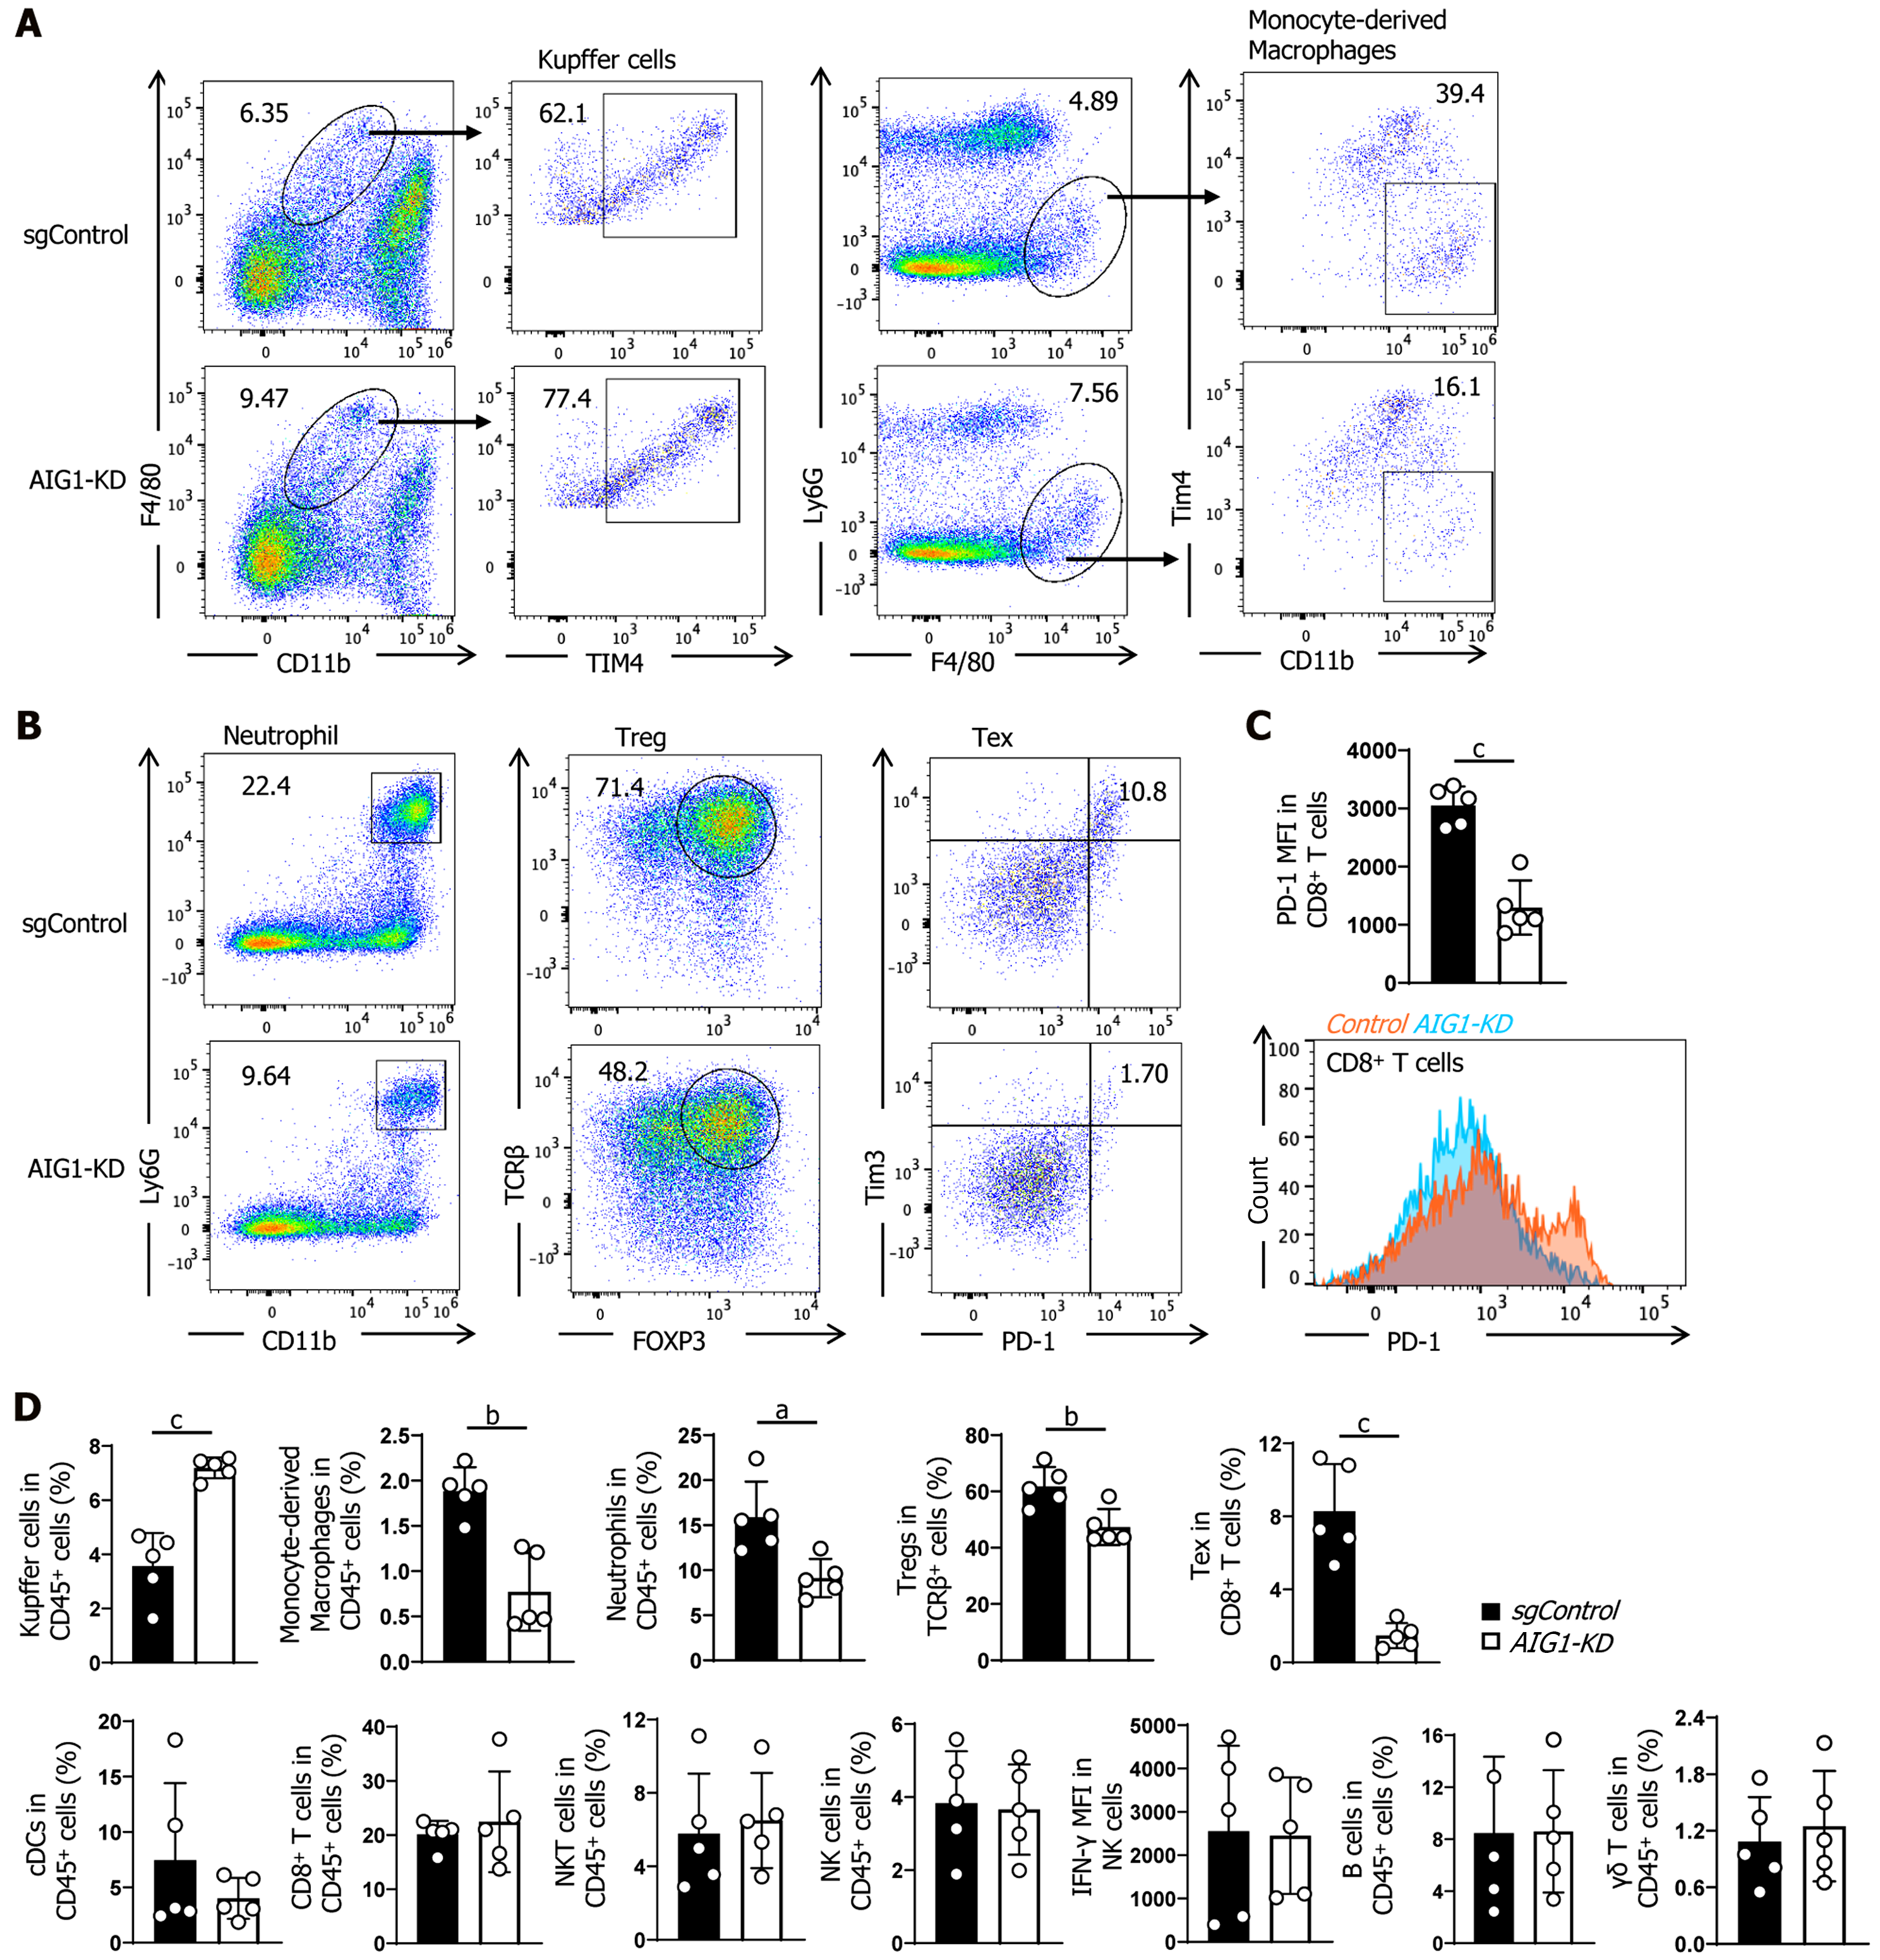
Figure 4 Androgen-induced gene 1 knockdown remodels the immune landscape in metastatic livers.
A: Flow cytometry dot plots showing Kupffer cells and monocyte-derived macrophages from non-targeting control single-guide RNA and androgen-induced gene 1 knockdown group; B: Flow cytometry dot plots showing neutrophils, regulatory T cells, and exhausted CD8+ T cells from on-targeting control single-guide RNA and androgen-induced gene 1 knockdown group; C: Quantification of programmed death-1 mean fluorescence intensity in CD8+ T cells. Representative histograms are shown below; D: Quantification of immune cell proportions, including Kupffer cells (P = 0.0002), monocyte-derived macrophages (P = 0.0012), neutrophils (P = 0.0101), regulatory T cells (percentage of T cell receptor β+ T cells; P = 0.0091), exhausted CD8+ T cells (P = 0.0005), and other indicated immune populations within the CD45+ compartment. Data are presented as mean ± SD. Each dot represents an individual mouse (n = 5 per group). Statistical significance was determined using unpaired t-test. aP < 0.05; bP < 0.01; cP < 0.001. sgControl: Non-targeting control single-guide RNA; AIG1-KD: Androgen-induced gene 1 knockdown; TIM4: T cell immunoglobulin and mucin domain-containing protein 4; FOXP3: Forkhead box P3; PD-1: Programmed death-1; Treg: Regulatory T cells; Tex: Exhausted CD8+ T cells; cDCs: Conventional dendritic cells; NKT: Natural killer T cells; NK: Natural killer cells; IFN: Interferon; MFI: Mean fluorescence intensity.
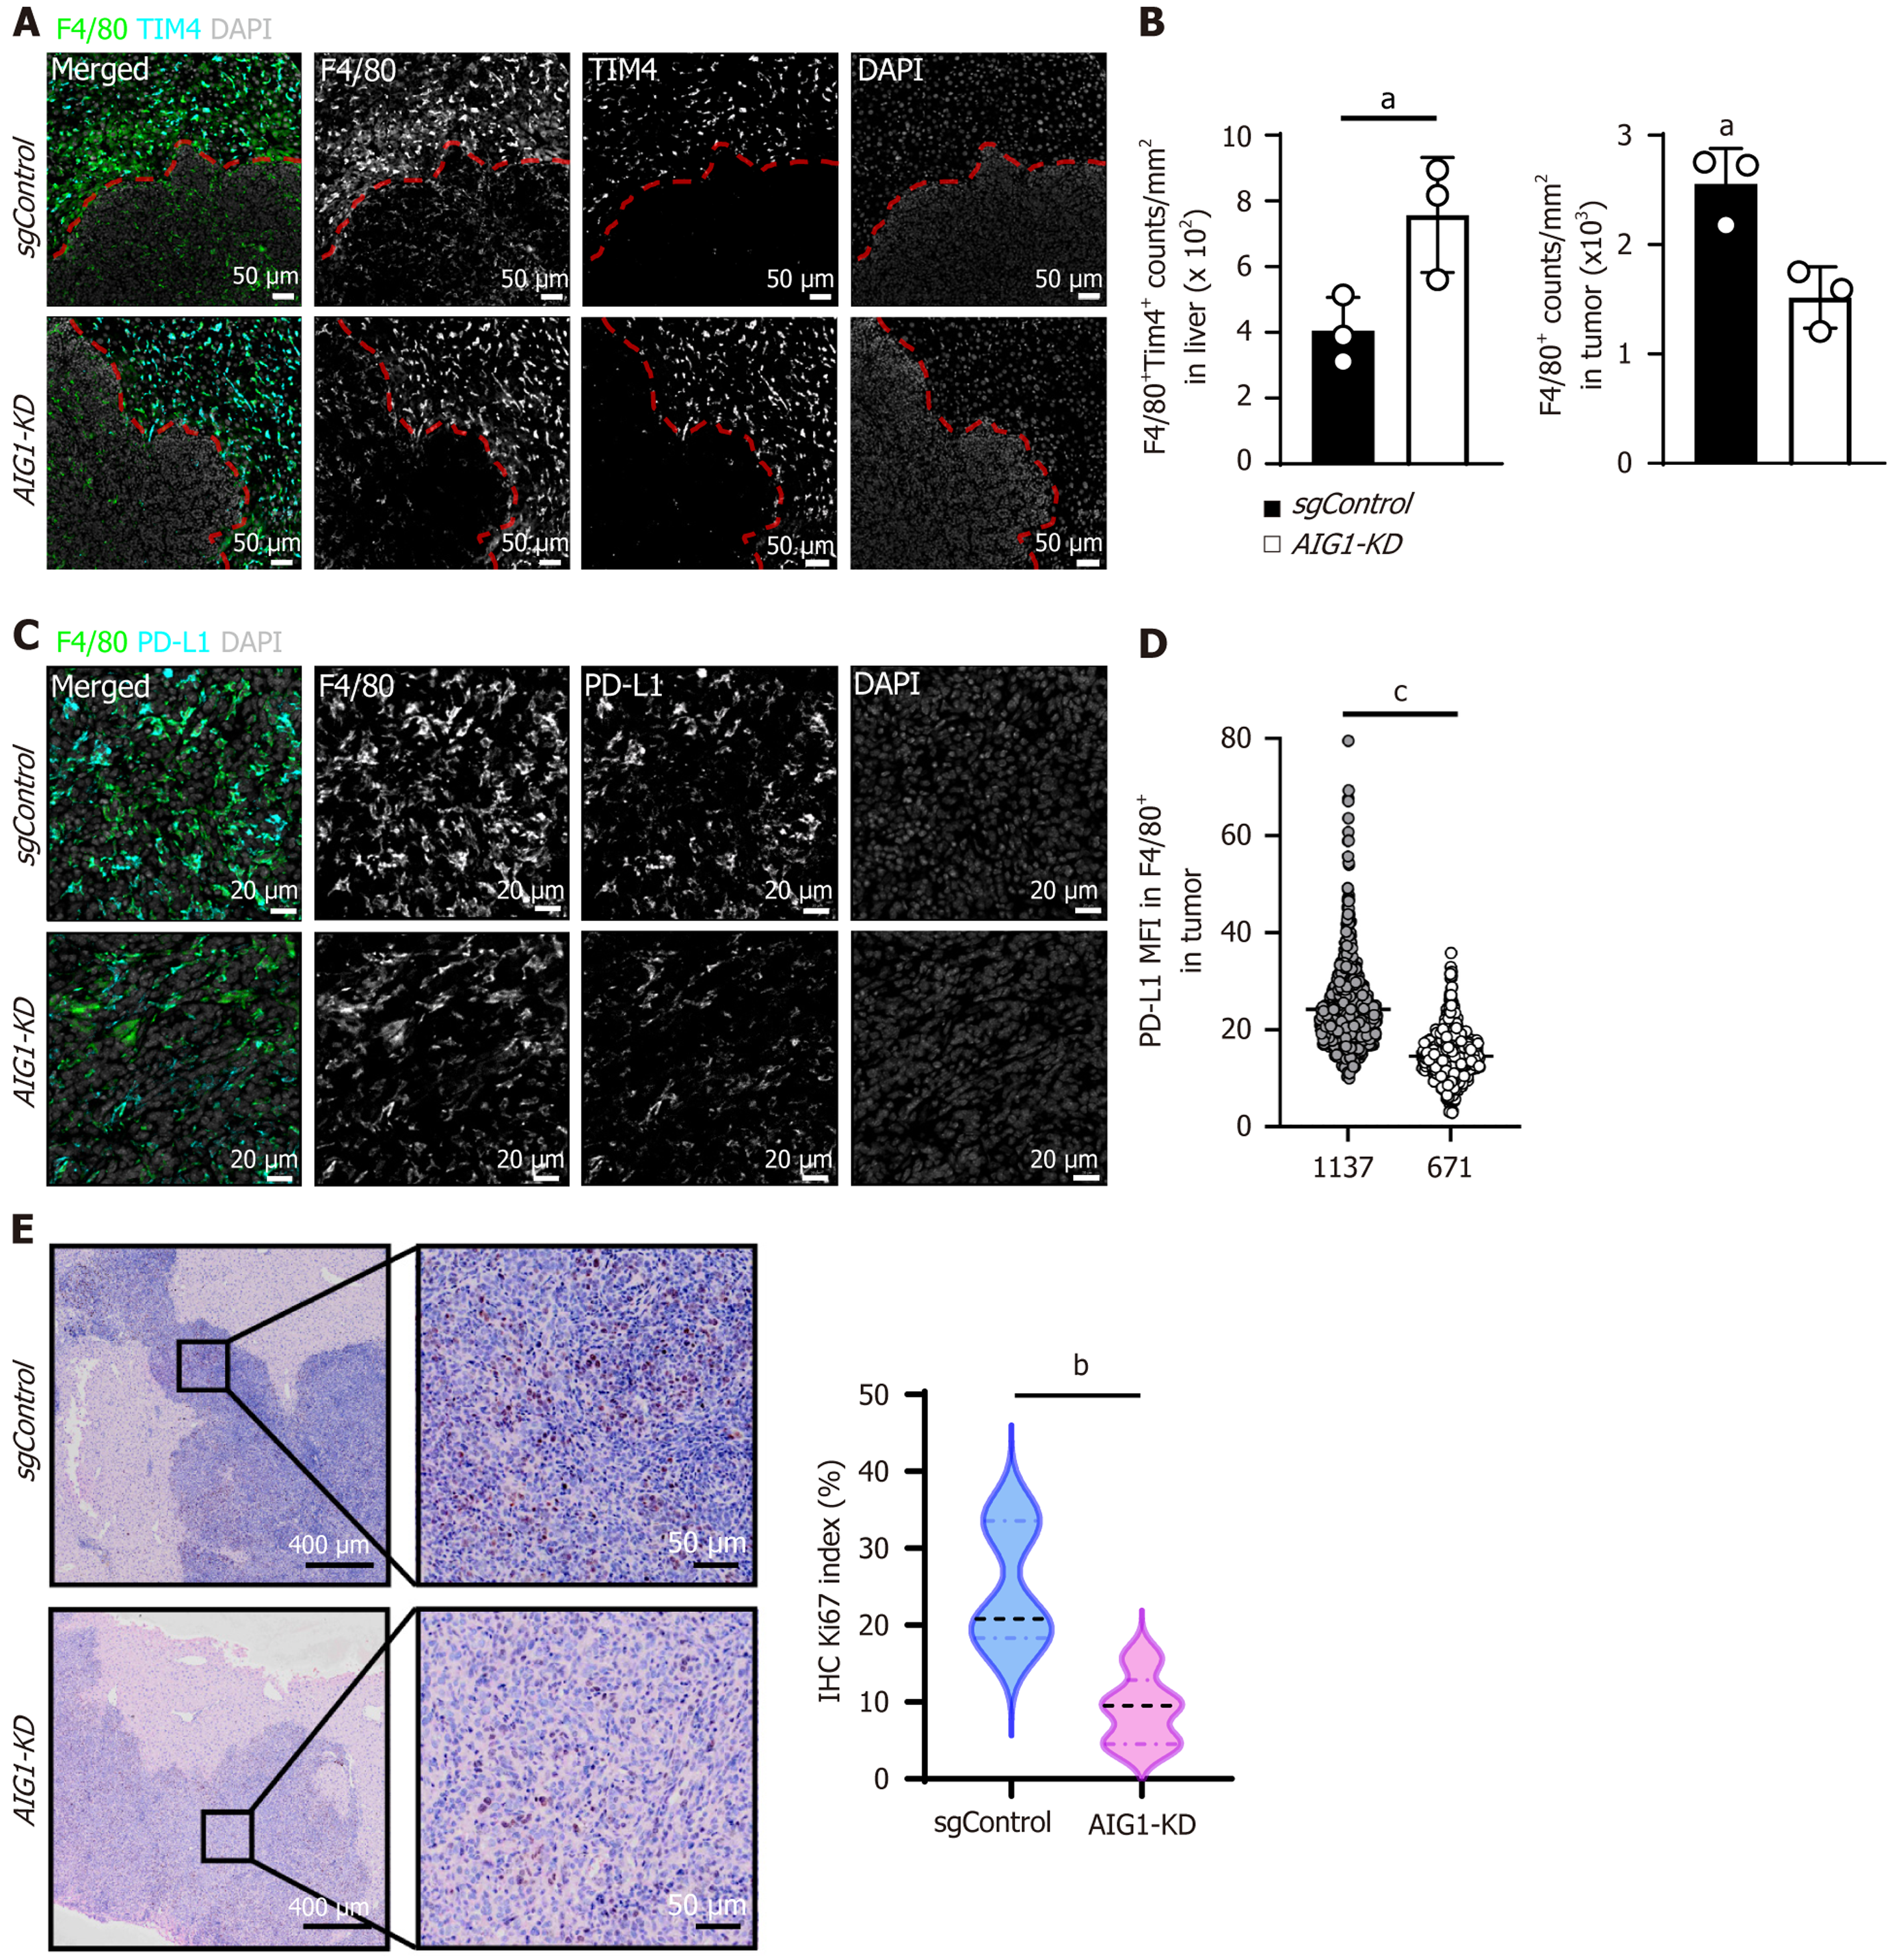
Figure 5 Spatial validation of immune remodeling and tumor proliferation in metastatic livers.
A: Co-staining of F4/80 and T cell immunoglobulin and mucin domain-containing protein 4 in tumor-bearing liver sections. Tumor regions were outlined with red dashed lines according to increased nuclear density (4’,6-diamidino-2-phenylindole); B: Quantification of Kupffer cell density in adjacent liver tissue and monocyte-derived macrophage density within tumor regions (cells/mm2). Data represent n = 3 mice per group; C: Co-staining of F4/80 and programmed death-ligand 1in tumor regions; D: Quantification of programmed death-ligand 1 mean fluorescence intensity in F4/80+ macrophages within tumor areas. Each dot represents an individual F4/80+ cell. The total number of analyzed cells per group is indicated on the X-axis. Data represent n = 3 mice per group; E: Ki67 immunohistochemical staining of metastatic liver sections. Data represent n = 5 mice per group. For panels B, D, and E, quantitative analyses were performed by randomly selecting three non-overlapping fields per section. For panels B and E, mean value was calculated for each mouse. Statistical significance was determined using a two-tailed unpaired t-test or Mann-Whitney U test as appropriate. aP < 0.05; bP < 0.01; cP < 0.0001. TIM4: T cell immunoglobulin and mucin domain-containing protein 4; DAPI: 4’,6-diamidino-2-phenylindole; AIG1-KD: Androgen-induced gene 1 knockdown; sgControl: Non-targeting control single-guide RNA; PD-L1: Programmed death-ligand 1; IHC: Immunohistochemistry.
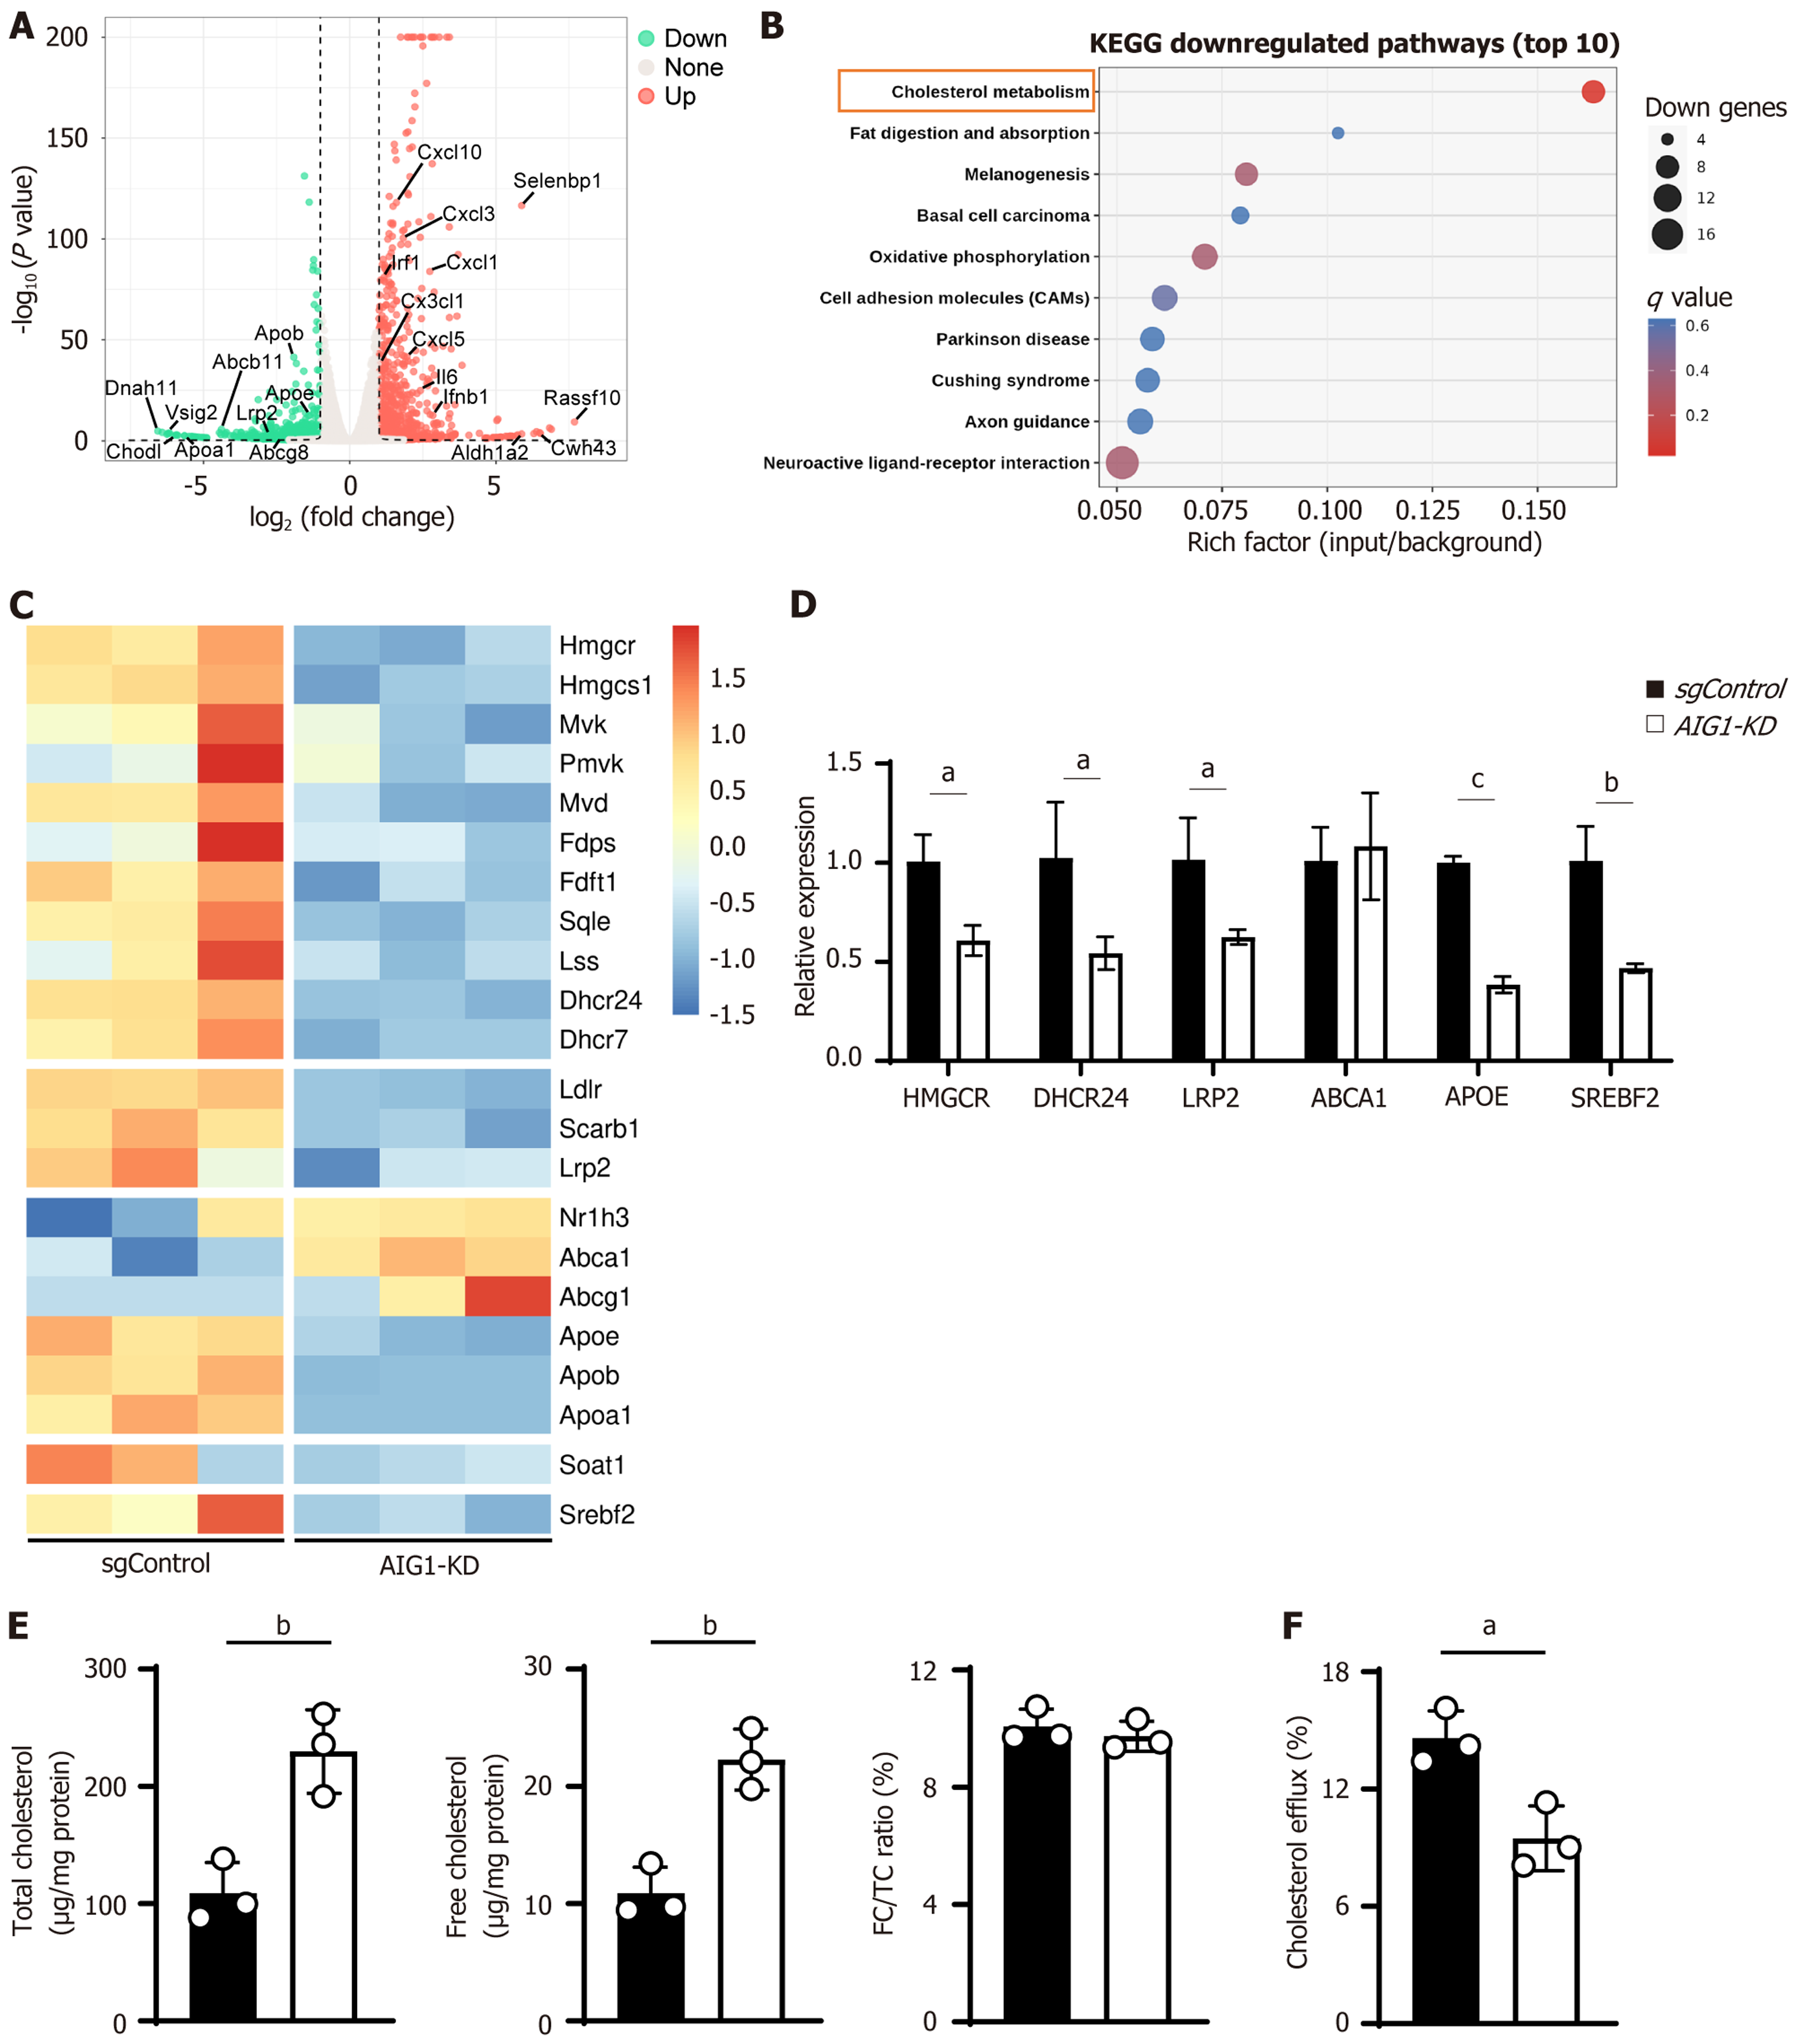
Figure 6 Androgen-induced gene 1 knockdown rewires cholesterol metabolism in tumor cells.
A: Volcano plot of differentially expressed genes identified by bulk RNA sequencing comparing androgen-induced gene 1 knockdown (AIG1-KD) and non-targeting control single-guide RNA (sgControl) cells. Genes not meeting both criteria are labeled as “none”. Selected upregulated and downregulated genes relevant to inflammatory signaling, cholesterol metabolism, tumor-suppression and tumor-promotion are highlighted; B: Kyoto Encyclopedia of Genes and Genomes enrichment analysis of downregulated genes. The Q-value shown in the plot represents the false discovery rate-adjusted P-value. Cholesterol metabolism was the only significantly enriched pathway among downregulated genes (false discovery rate-adjusted P < 0.05); C: Heatmap showing the relative expression of cholesterol metabolism-related genes between groups based on bulk RNA-sequencing analysis; D: Quantitative real-time polymerase chain reaction validation of cholesterol metabolism-related genes in sgControl and AIG1-KD cells; E: Total cholesterol, free cholesterol, and free cholesterol/total cholesterol ratio measured in sgControl and AIG1-KD cells; F: Comparison of cholesterol efflux between the two groups. Data are presented as mean ± SD of three independent experiments. Statistical analysis was performed using unpaired t-tests. aP < 0.05; bP < 0.01; cP < 0.001. KEGG: Kyoto Encyclopedia of Genes and Genomes; CAM: Cell adhesion molecule; sgControl: Non-targeting control single-guide RNA; AIG1-KD: Androgen-induced gene 1 knockdown; HMGCR: 3-hydroxy-3-methylglutaryl-coenzyme A reductase; DHCR24: 24-dehydrocholesterol reductase; LRP2: Low-density lipoprotein receptor-related protein 2; ABCA1: ATP-binding cassette subfamily A member 1; APOE: Apolipoprotein E; SREBF2: Sterol regulatory element binding transcription factor 2; FC: Free cholesterol; TC: Total cholesterol.
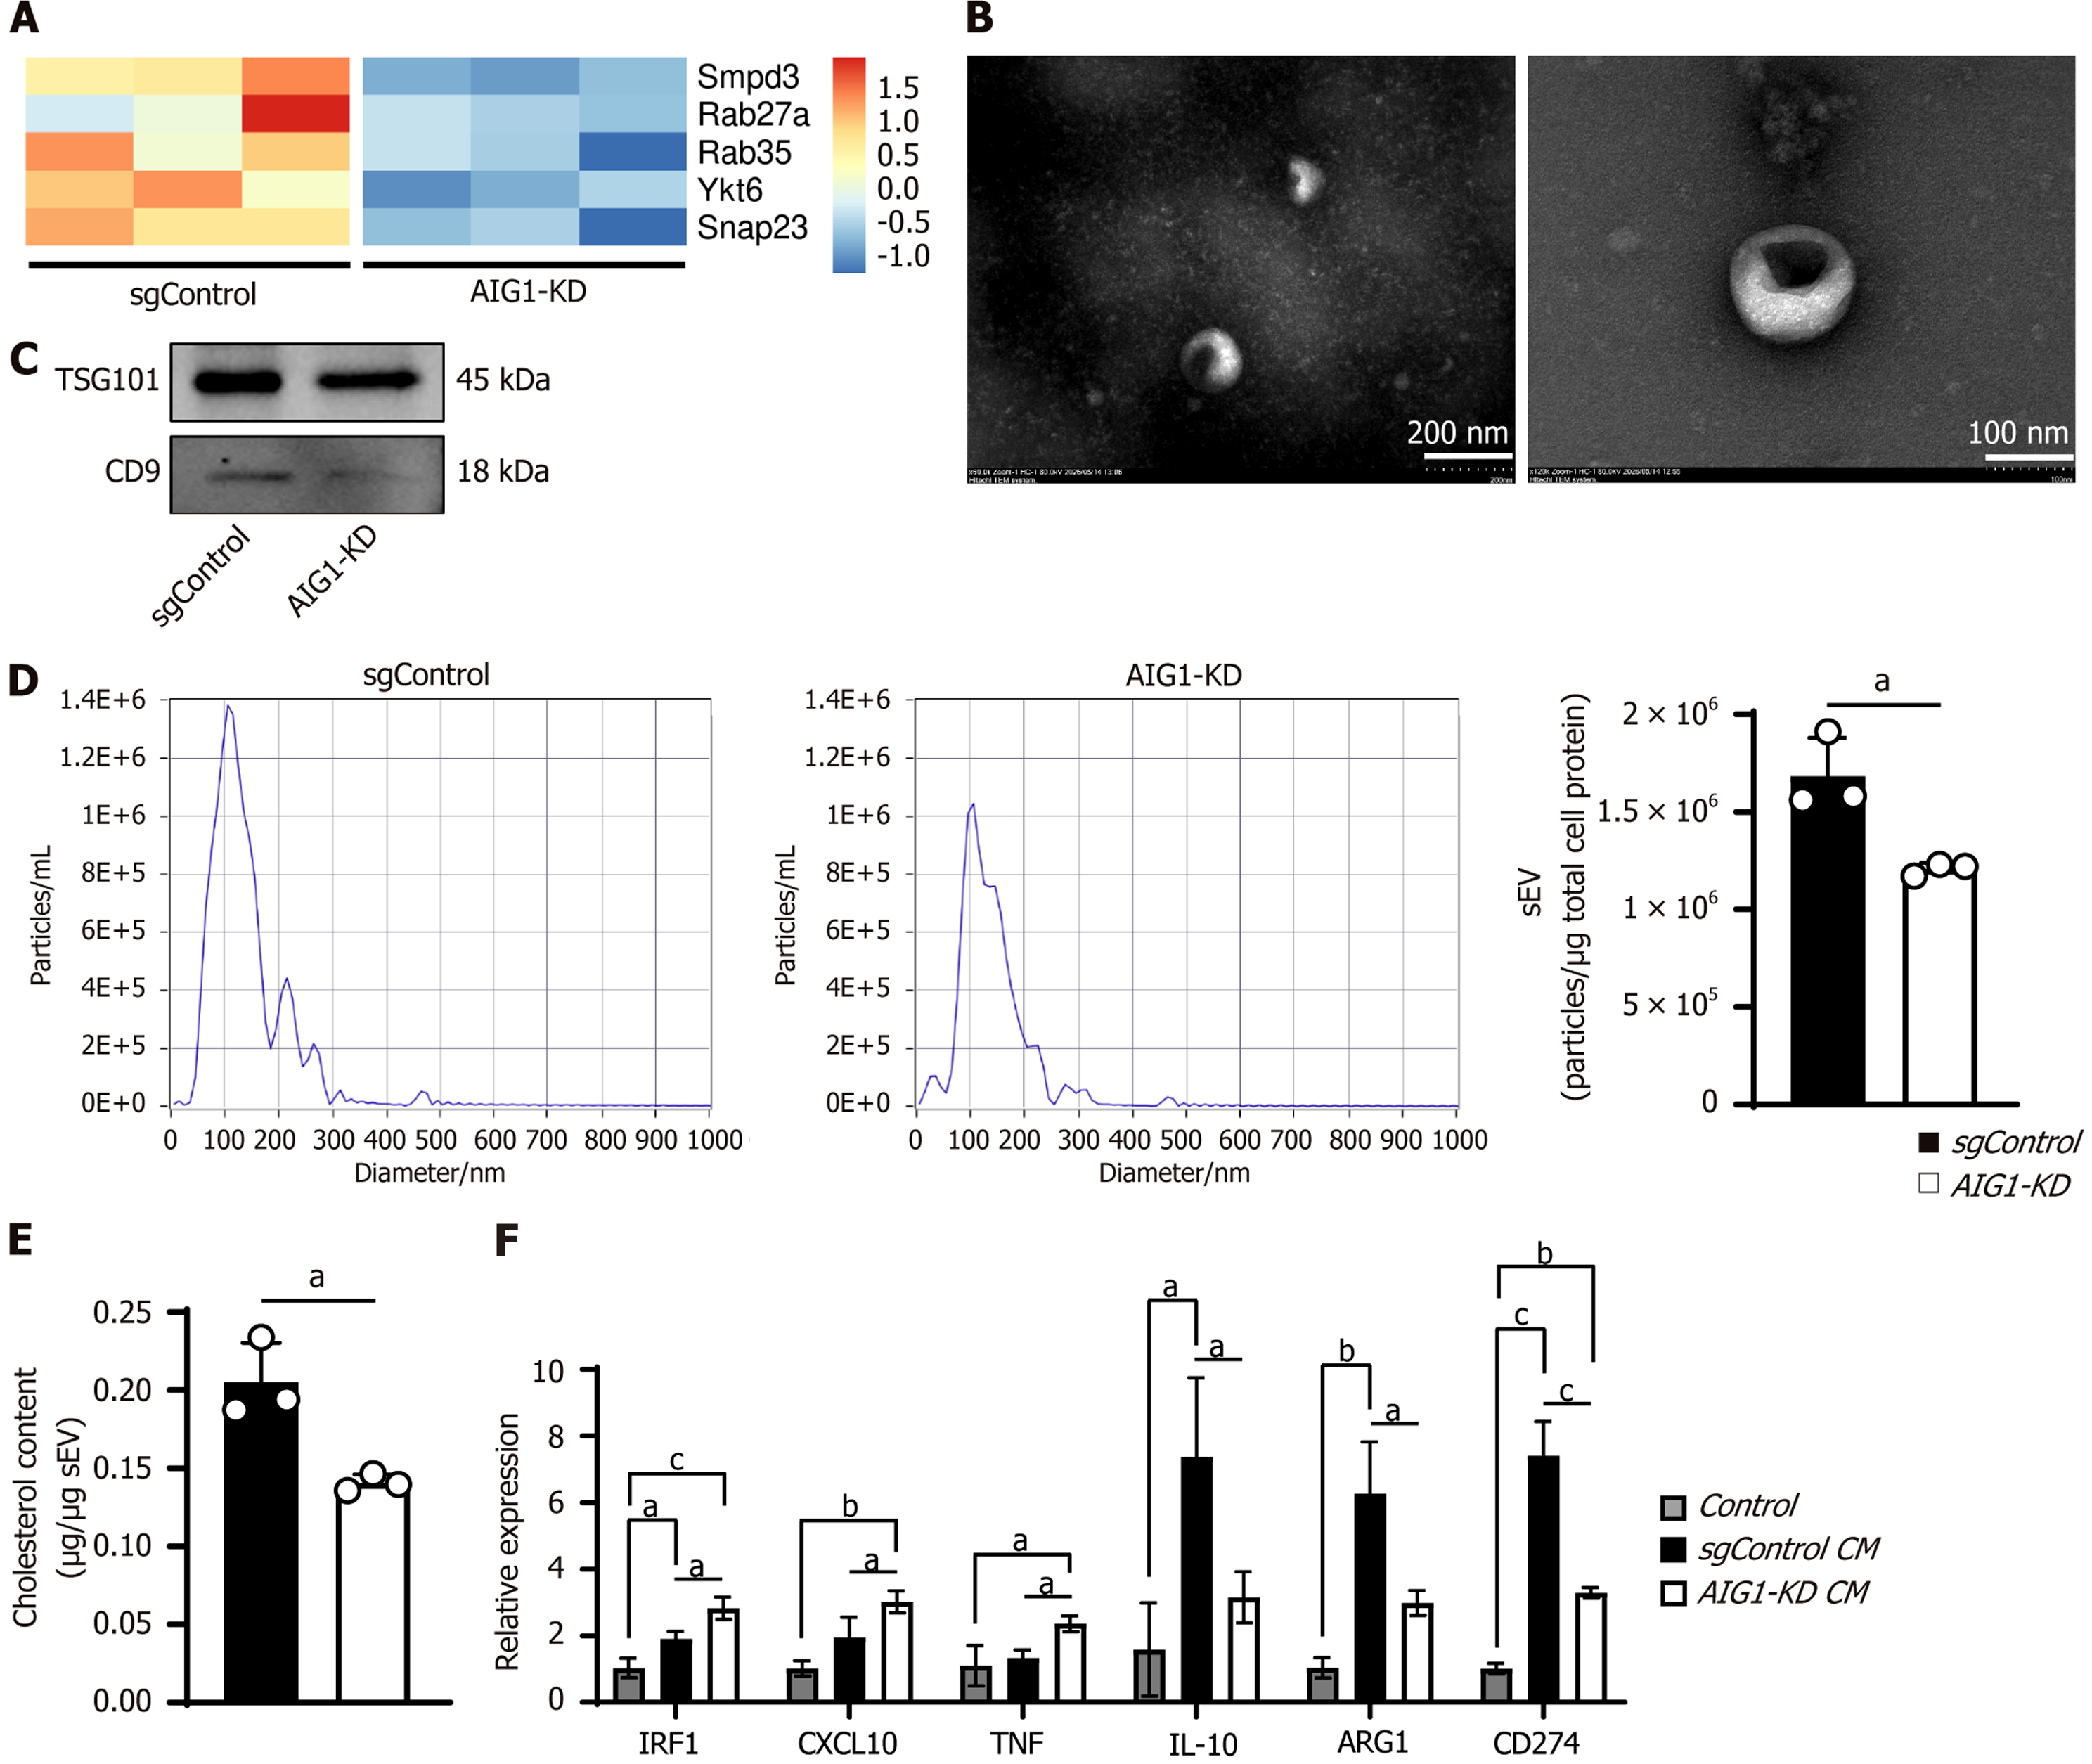
Figure 7 Androgen-induced gene 1 loss reduces small extracellular vesicle-mediated cholesterol release and alters macrophage pola
- Citation: Luo YZ, Zhao Q, Wang FF, Li JH, Lyu SC, Liu Z, Lang R, He Q. Androgen-induced gene 1 correlates with extracellular vesicle-associated cholesterol metabolism and hepatic metastasis of pancreatic cancer. World J Gastroenterol 2026; 32(39): 121007
- URL: https://www.wjgnet.com/1007-9327/full/v32/i39/121007.htm
- DOI: https://dx.doi.org/10.3748/wjg.121007