
















Copyright: ©Author(s) 2026.
World J Gastroenterol. Oct 21, 2026; 32(39): 120320
Published online Oct 21, 2026. doi: 10.3748/wjg.120320
Published online Oct 21, 2026. doi: 10.3748/wjg.120320
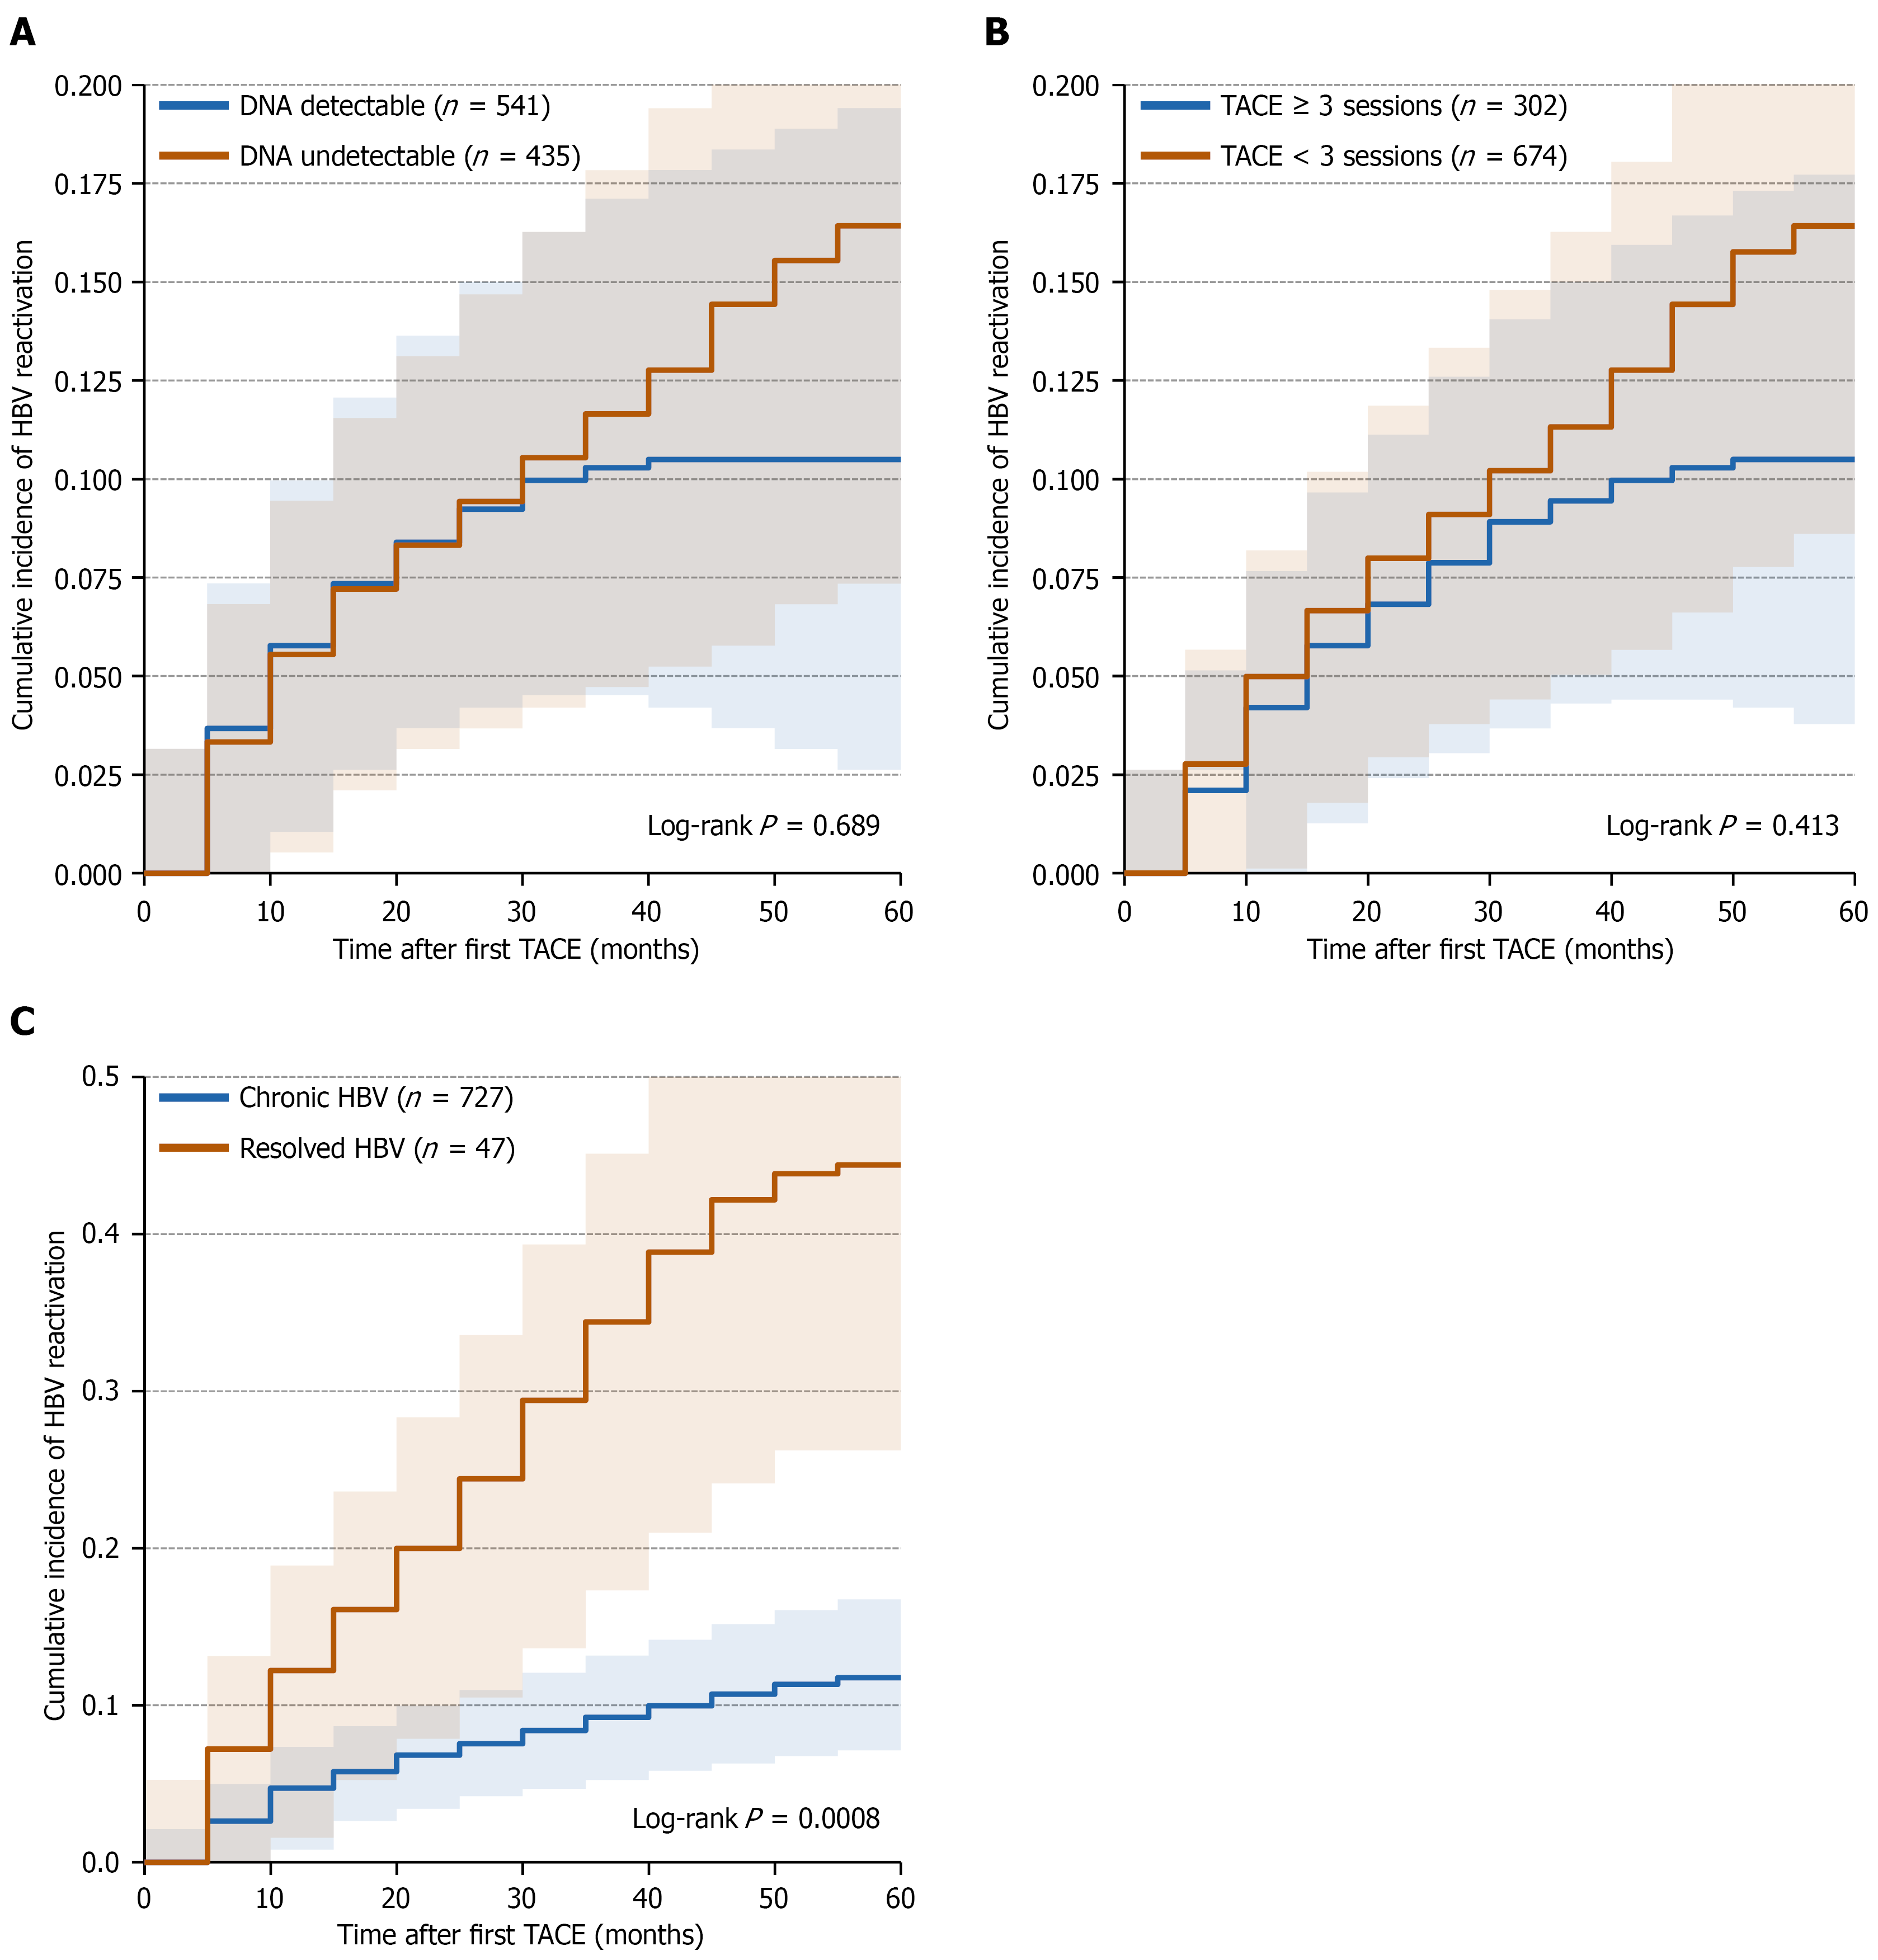
Figure 1 Cumulative incidence of hepatitis B virus reactivation after transarterial chemoembolization.
A: Cumulative incidence stratified according to presence/absence of baseline hepatitis B virus (HBV) DNA (detectable, n = 541; undetectable, n = 435); B: Cumulative incidence stratified according to number of transarterial chemoembolization sessions (at least three sessions, n = 302; fewer than three sessions, n = 674); C: Cumulative incidence stratified according to baseline HBV status: Chronic HBV infection (hepatitis B surface antigen-positive, n = 727) and resolved HBV infection (hepatitis B surface antigen-negative/antibody to hepatitis B core antigen-positive, n = 47). Patients for whom serological data were incomplete (n = 202) were excluded. Shaded areas represent 95% confidence intervals. HBV: Hepatitis B virus; TACE: Transarterial chemoembolization.
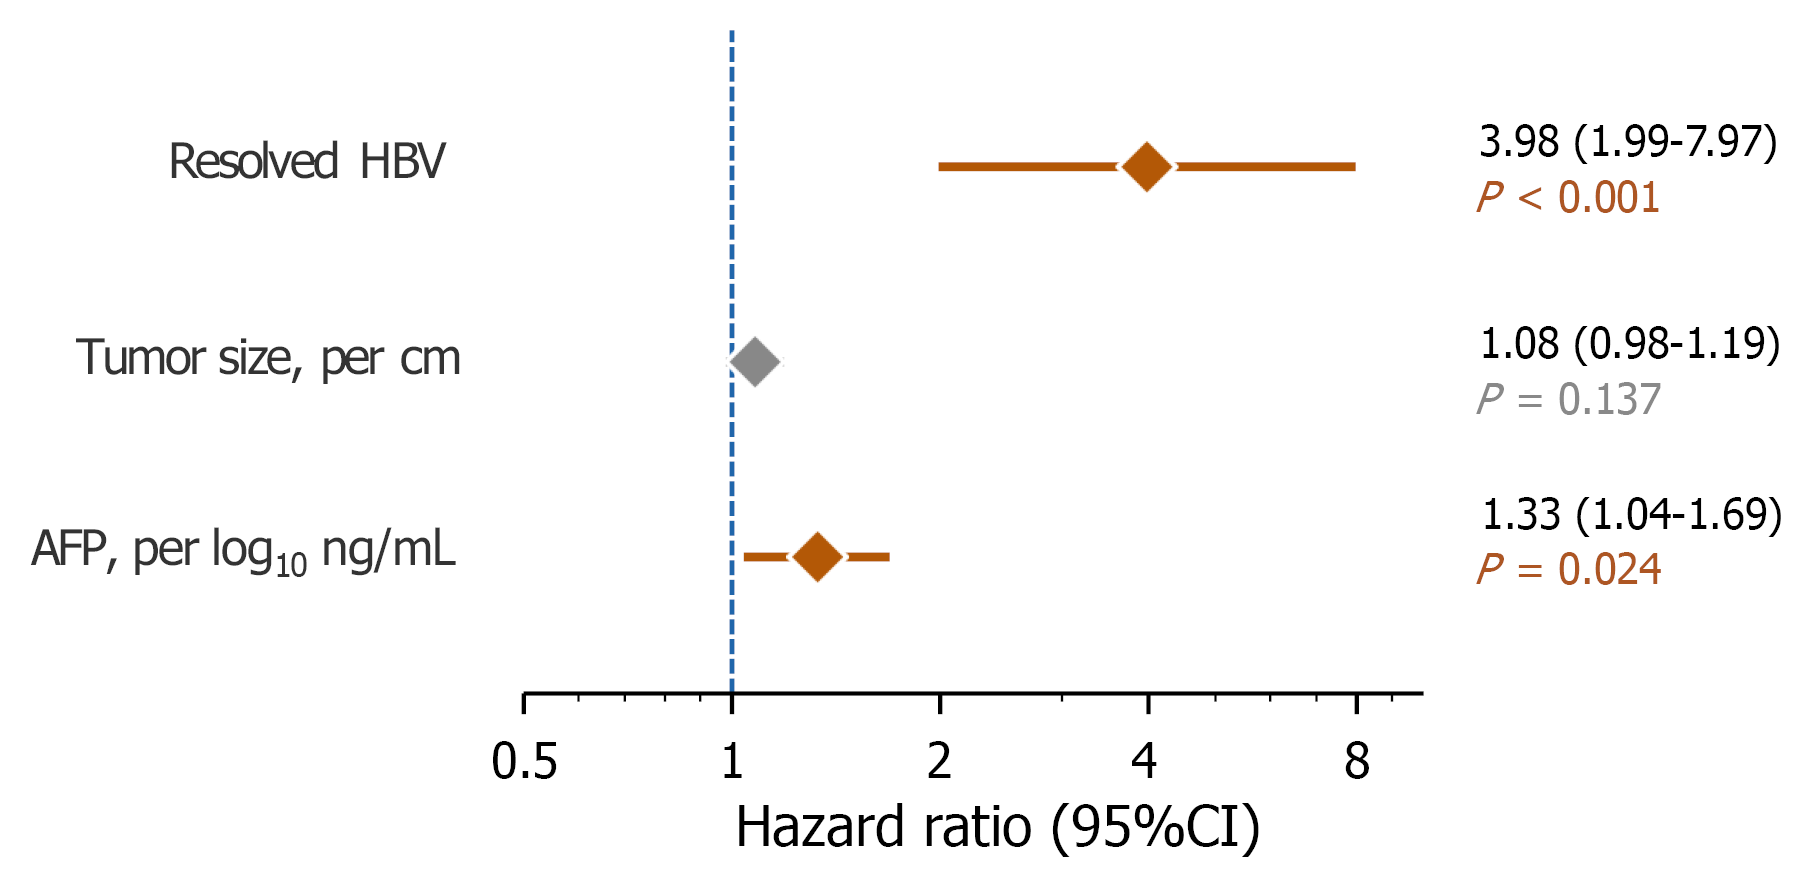
Figure 2 Forest plot of multivariable Cox regression analysis for hepatitis B virus reactivation.
Hazard ratios and 95% confidence intervals are shown for variables included in the final multivariable model. Variables with P < 0.05 in the univariable analysis were entered into the multivariable model. The vertical dashed line indicates hazard ratio = 1 (no effect). Orange denotes statistical significance (P < 0.05). HBV: Hepatitis B virus; AFP: Alpha-fetoprotein; CI: Confidence interval.
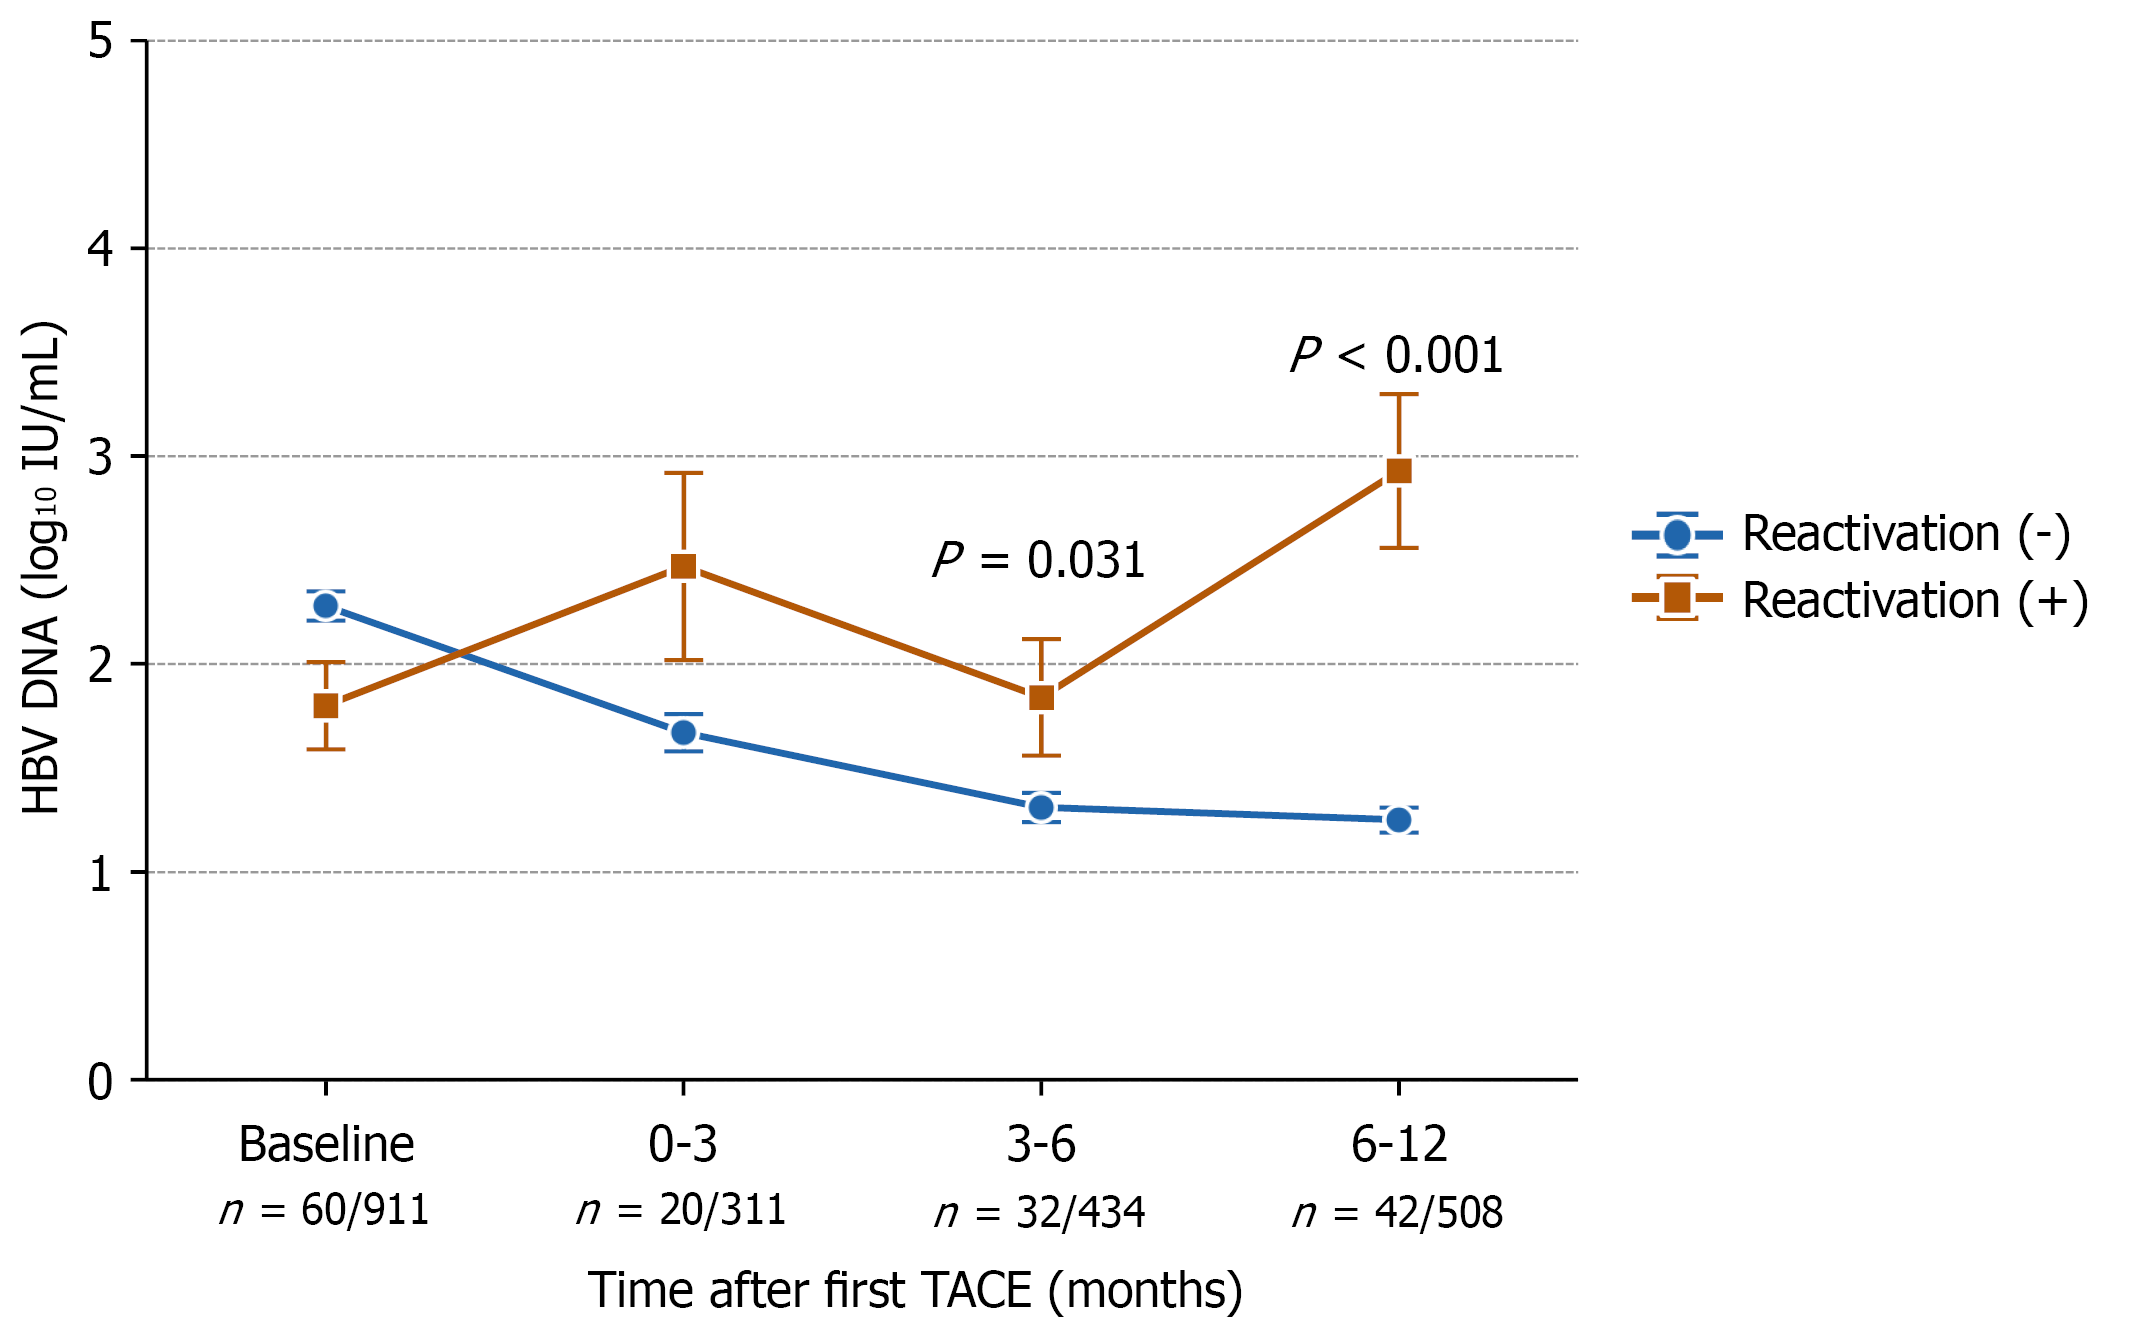
Figure 3 Hepatitis B virus DNA kinetics after transarterial chemoembolization, according to reactivation status.
Mean hepatitis B virus (HBV) DNA levels (log10 IU/mL) with standard errors of the mean are shown at baseline and during follow-up intervals (0-3, 3-6, and 6-12 months after first transarterial chemoembolization) for patients with reactivation (orange) and those without reactivation (blue). Baseline values were obtained from the first available HBV DNA measurement. For each follow-up interval, the maximum HBV DNA value within that period was used when multiple measurements were available. The number of patients with data for each time point is shown below the X-axis (reactivation positive/reactivation negative). P values were calculated using the Mann-Whitney U test. HBV: Hepatitis B virus; TACE: Transarterial chemoembolization.
- Citation: Kim DY, Jeong J, Hong JP, Lee JS, Kim MN, Kim BK, Kim SU, Park JY, Ahn SH, Kim DY, Lee HW. Resolved hepatitis B is associated with higher reactivation risk than chronic infection after chemoembolization for hepatocellular carcinoma. World J Gastroenterol 2026; 32(39): 120320
- URL: https://www.wjgnet.com/1007-9327/full/v32/i39/120320.htm
- DOI: https://dx.doi.org/10.3748/wjg.120320