
















Copyright: ©Author(s) 2026.
World J Gastroenterol. Oct 14, 2026; 32(38): 121425
Published online Oct 14, 2026. doi: 10.3748/wjg.121425
Published online Oct 14, 2026. doi: 10.3748/wjg.121425
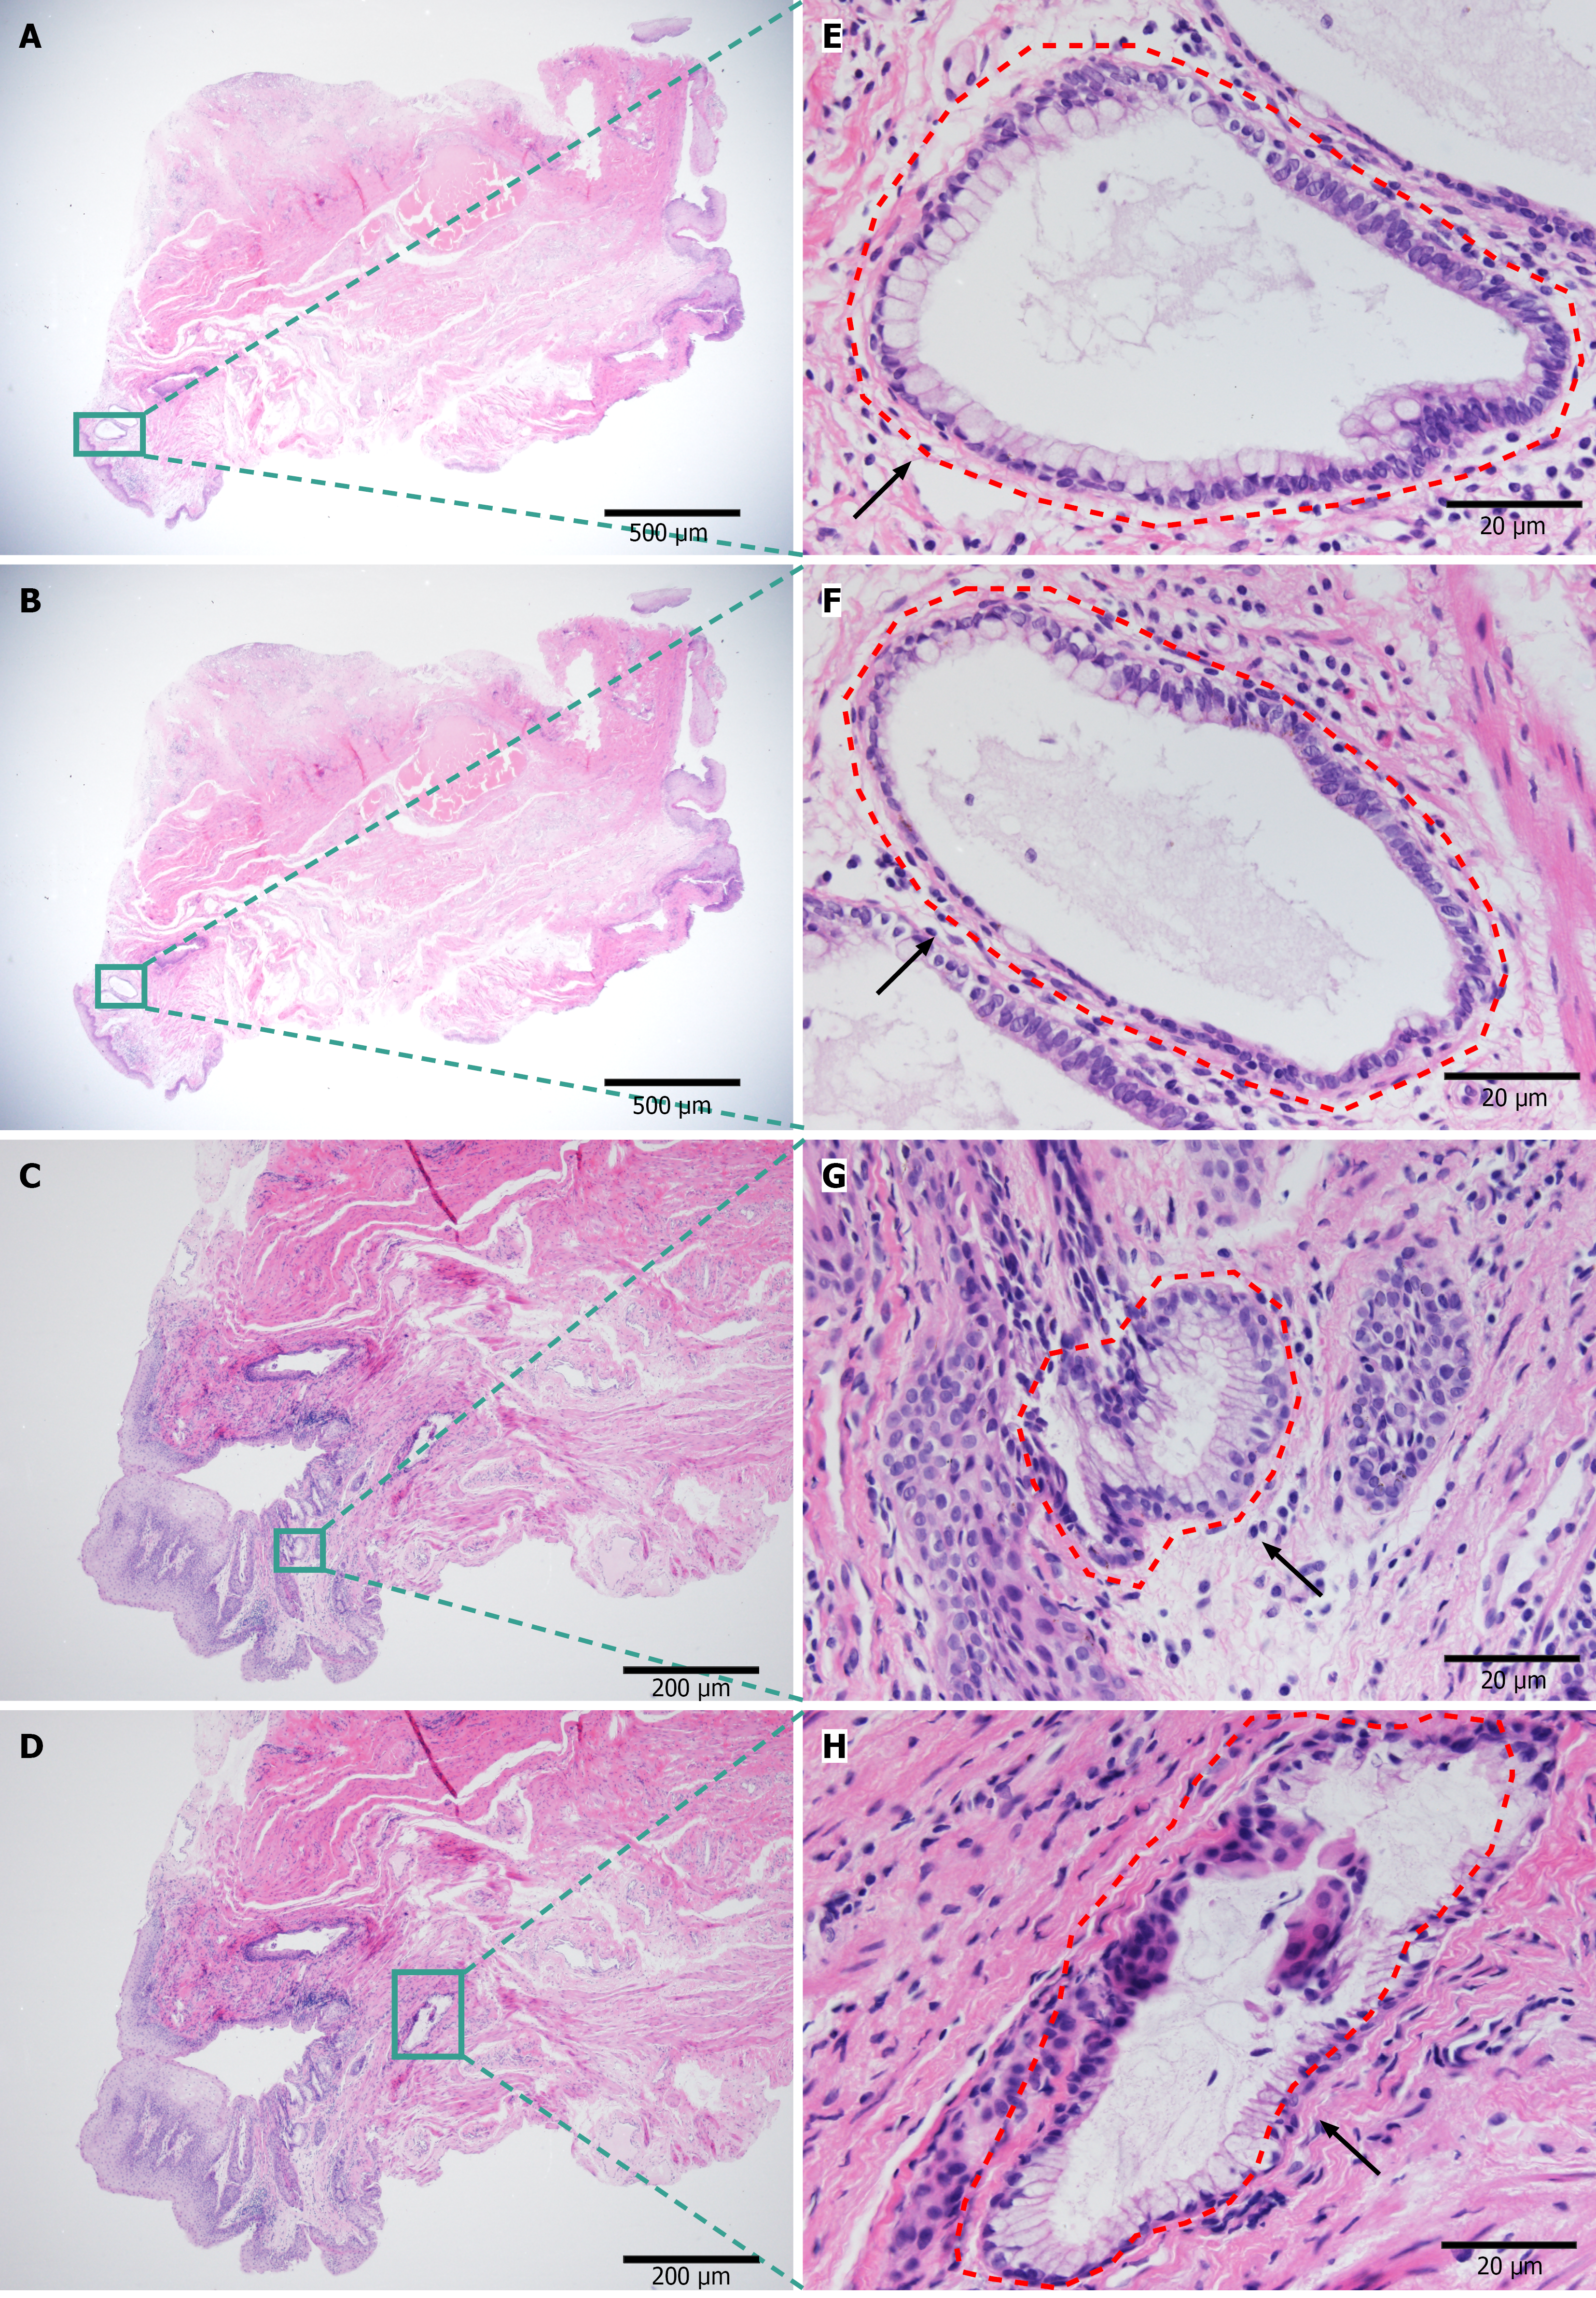
Figure 1 Histopathology of the internal-opening in cryptoglandular anal fistula (hematoxylin and eosin).
A-D: Low-power views of internal-opening tissue; E-H: Higher-power images of the boxed regions. Red dashed contours delineate gland-like structures. A 1-2 cell thick layer of spindle-shaped myoepithelial cells with goblet cells surrounding an anal gland, surrounded by florid chronic inflammatory infiltrates with fibroblast proliferation and collagen deposition. These features are consistent with a glandular origin of the fistula and were reviewed by a senior pathologist.
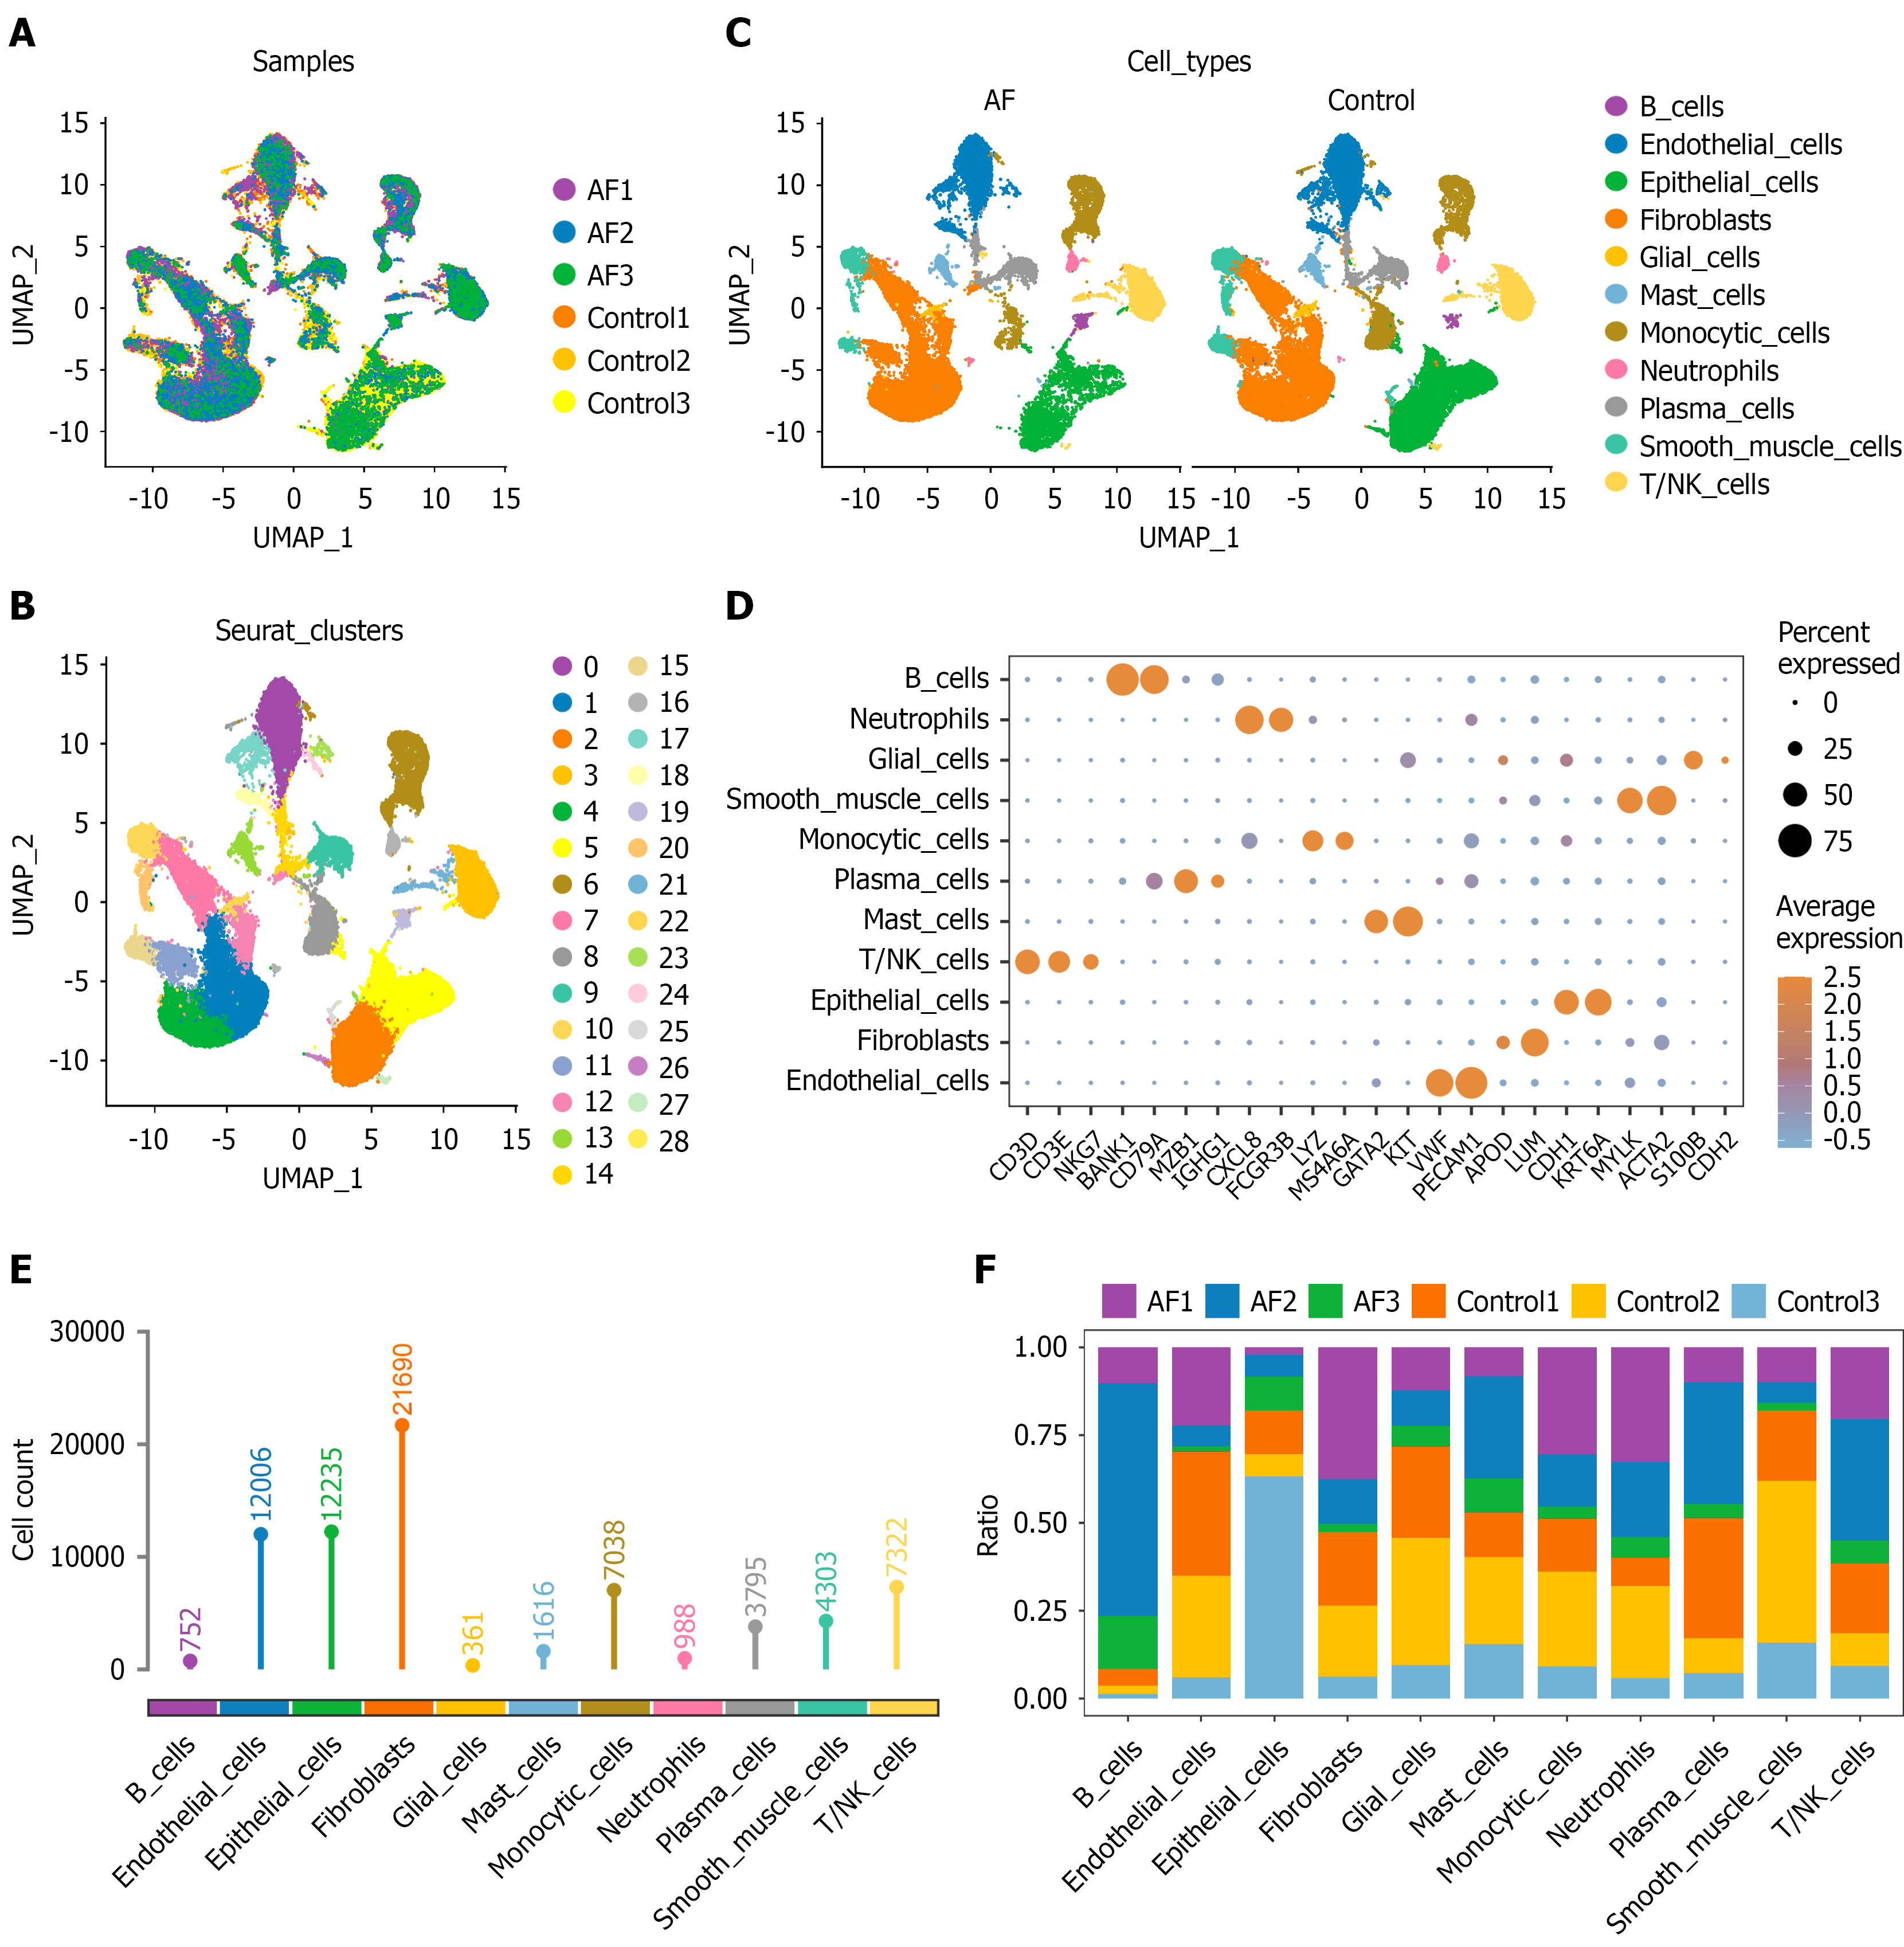
Figure 2 Single-cell transcriptomic landscape of anal fistula and control samples.
A: Uniform manifold approximation and projection (UMAP) plot showing the clustering of all single cells into 29 distinct Seurat clusters; B: UMAP visualization colored by samples, including anal fistula (AF) and control samples; C: UMAP plot of annotated major cell types across AF and control groups; D: Dot plot displaying the expression of canonical marker genes used to define 11 major cell types. The size of the dots represents the percentage of cells expressing each gene, and the color indicates the average expression level; E: Bar plot showing the absolute number of cells for each of the 11 major cell types; F: Proportional distribution of the 11 major cell types across all six samples. UMAP: Uniform manifold approximation and projection; AF: Anal fistula.
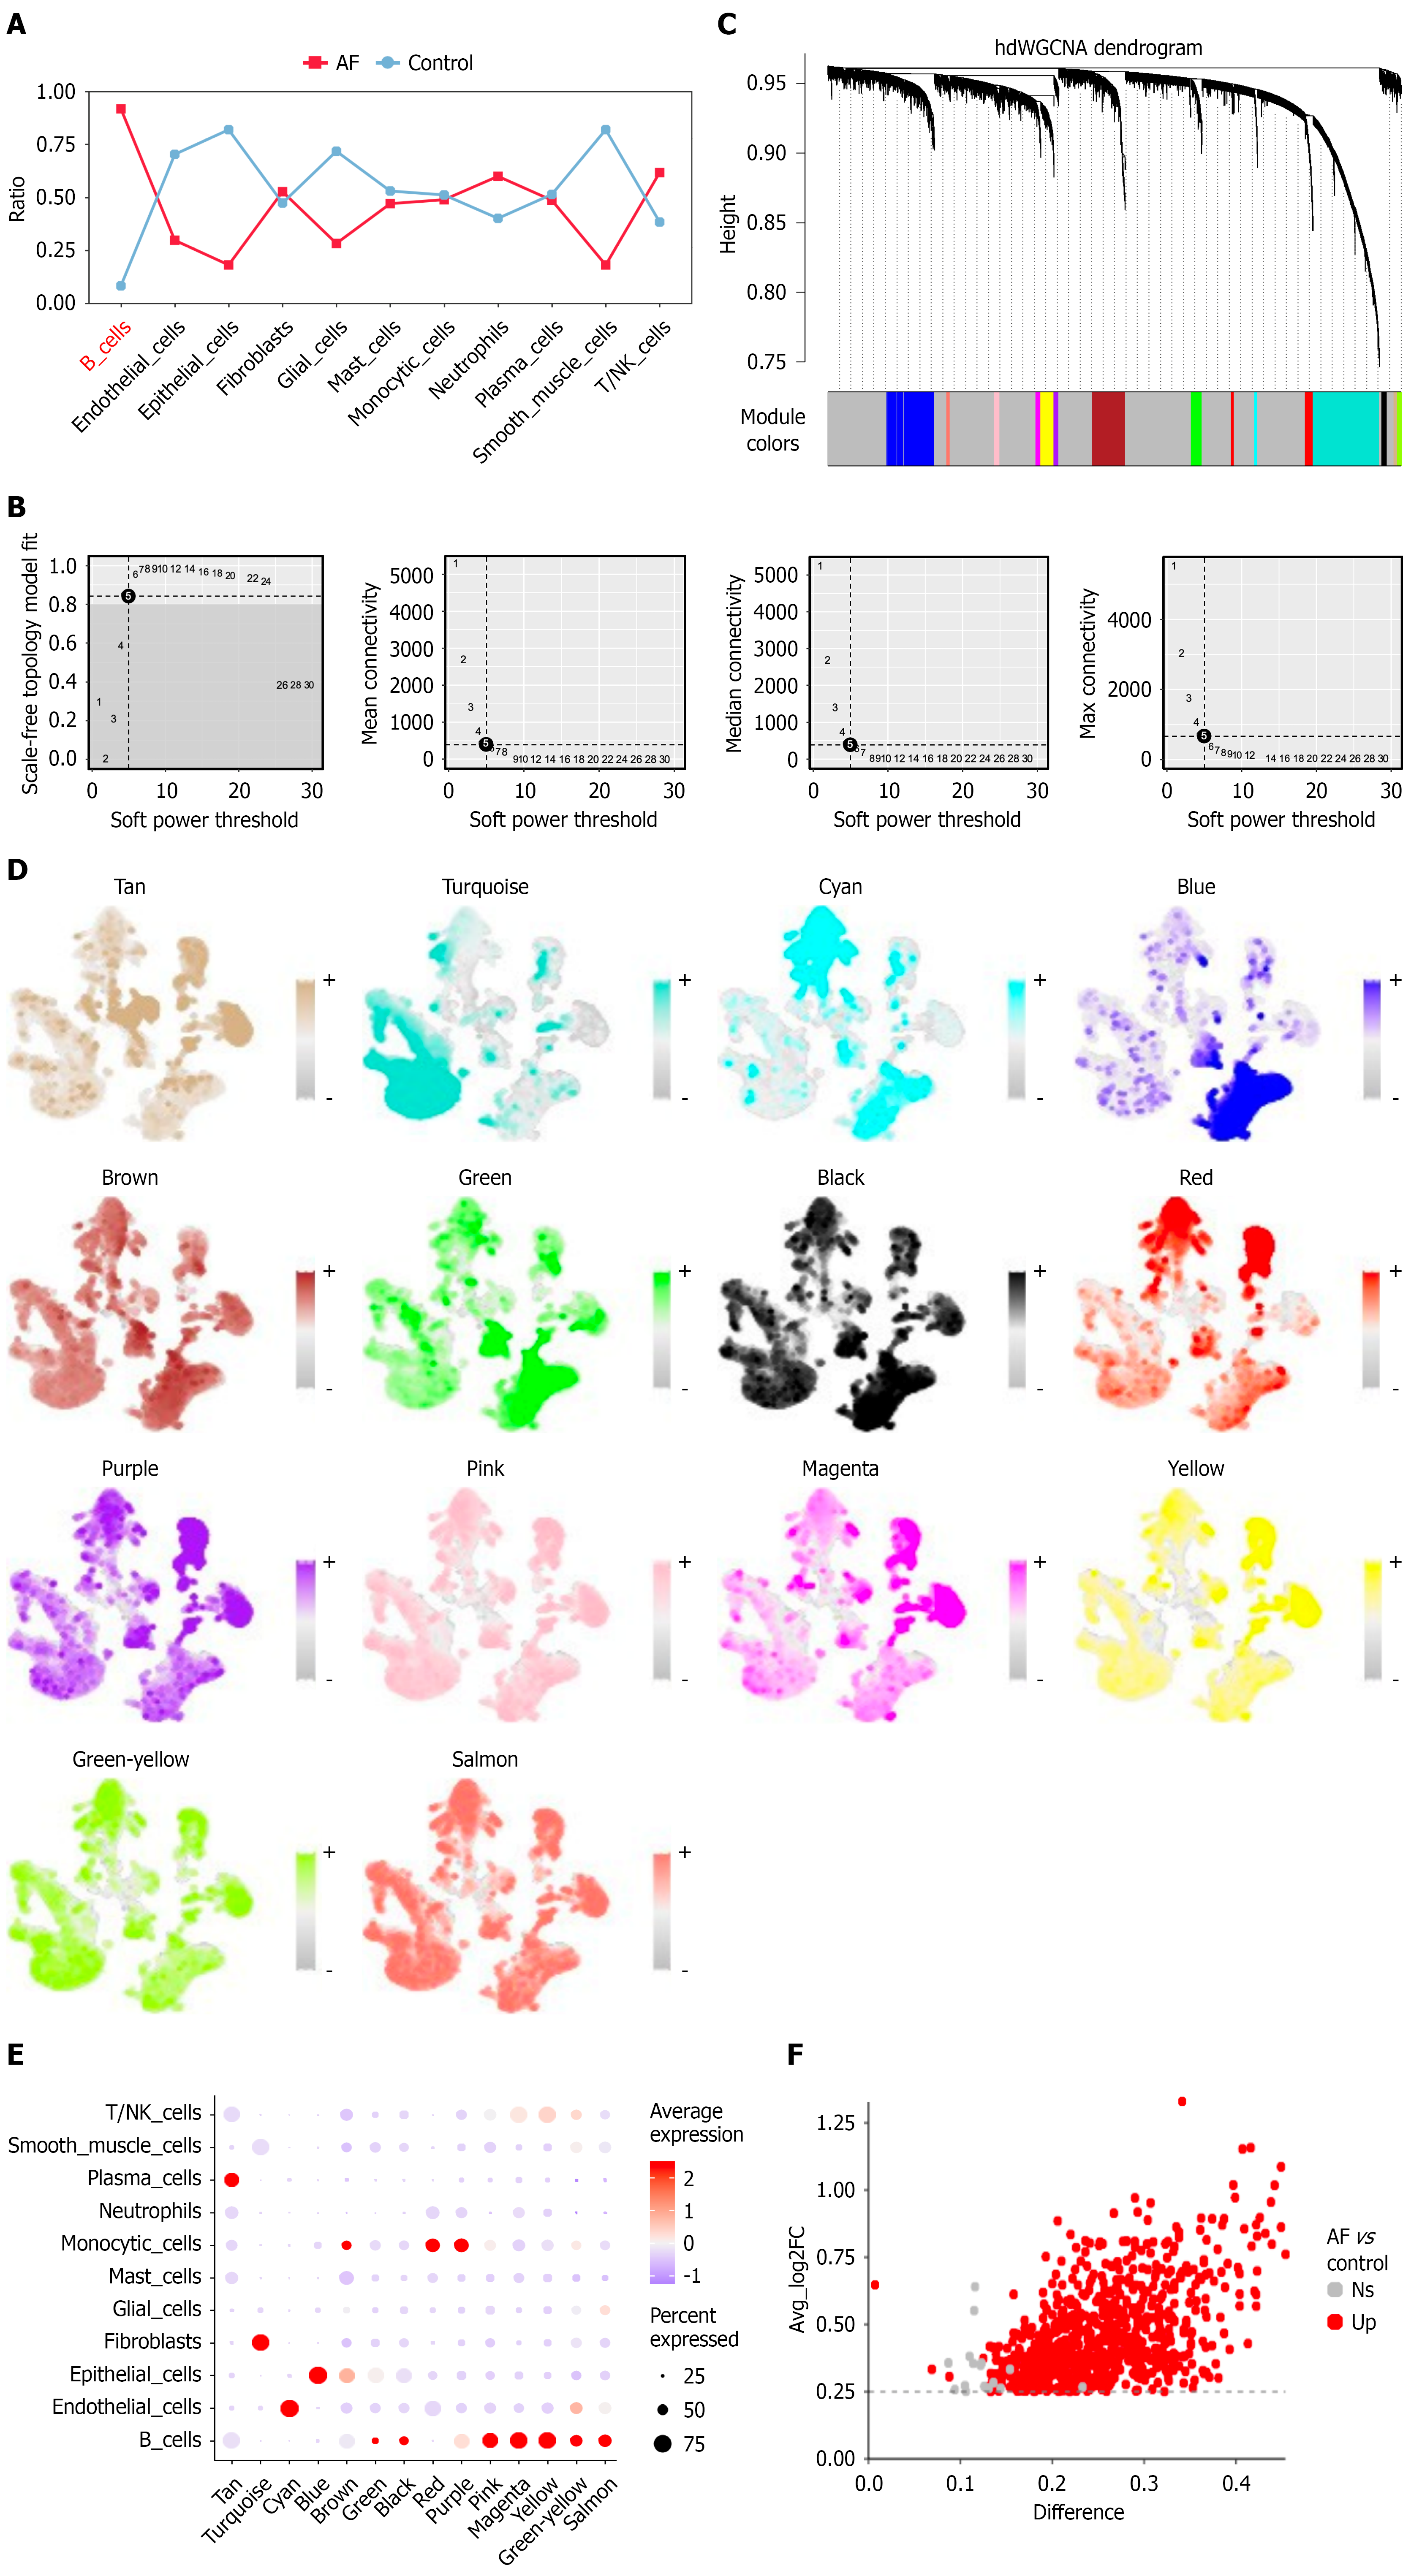
Figure 3 B cell-specific differences and co-expression modules in anal fistula vs control.
A: Line plot showing the distribution of 11 major cell types across anal fistula (AF) and control samples. B cells exhibited the largest difference and were markedly elevated in the AF group; B: Determination of soft-thresholding power in high-dimensional weighted gene co-expression network analysis (hdWGCNA); C: Dendrogram of gene modules identified by hdWGCNA, revealing 14 co-expression modules in B cells; D: Uniform manifold approximation and projection visualization of module gene expression patterns across cells, colored by different module identities; E: Dot plot showing the expression levels of genes from each module across different cell types. Green, black, pink, magenta, yellow, green-yellow, and salmon modules were enriched in B cells; F: Volcano plot showing differentially expressed genes in B cells between AF and control groups. A total of 764 genes were significantly upregulated in the AF group. AF: Anal fistula; hdWGCNA: High-dimensional weighted gene co-expression network analysis.
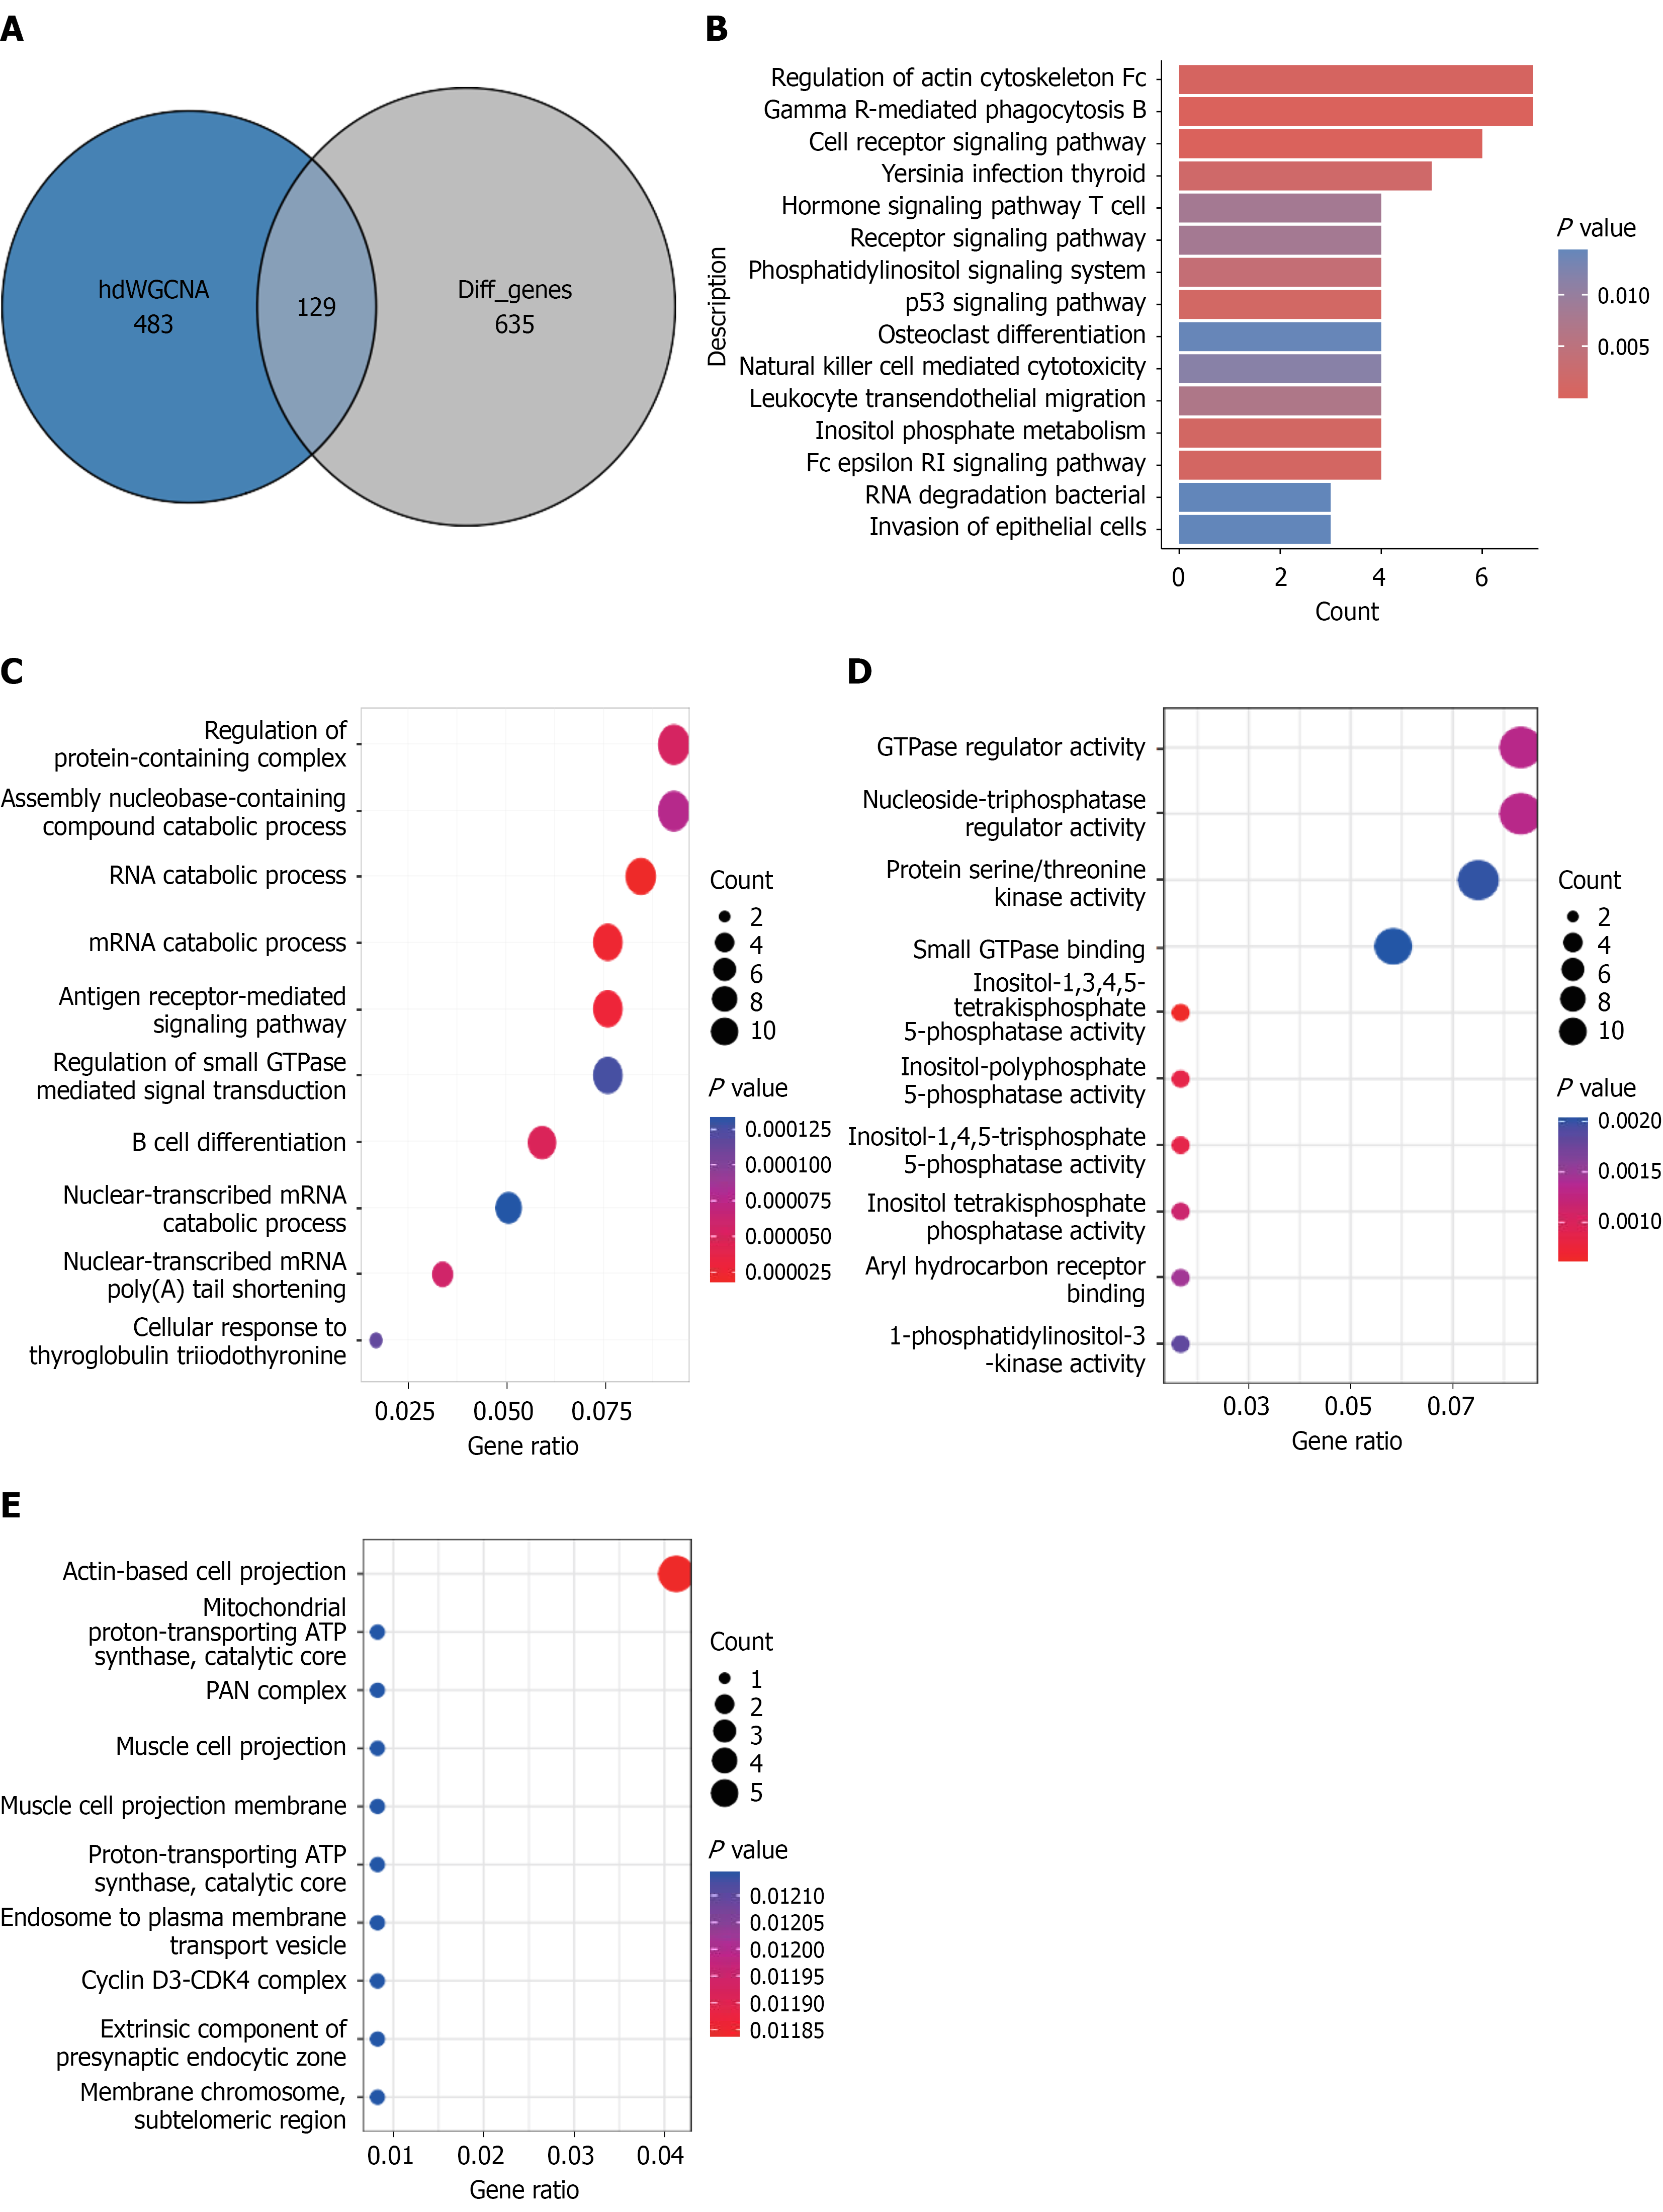
Figure 4 Functional enrichment analysis of candidate genes in anal fistula-related B cells.
A: Venn diagram showing the intersection of genes identified from hdWGCNA and differentially expressed genes in B cells, resulting in 129 overlapping genes; B: Kyoto Encyclopedia of Genes and Genomes pathway enrichment analysis of the 129 overlapping genes; C: Gene Ontology (GO)-biological process enrichment analysis; D: GO-molecular function enrichment analyses; E: GO-cellular component enrichment analysis. hdWGCNA: High-dimensional weighted gene co-expression network analysis.
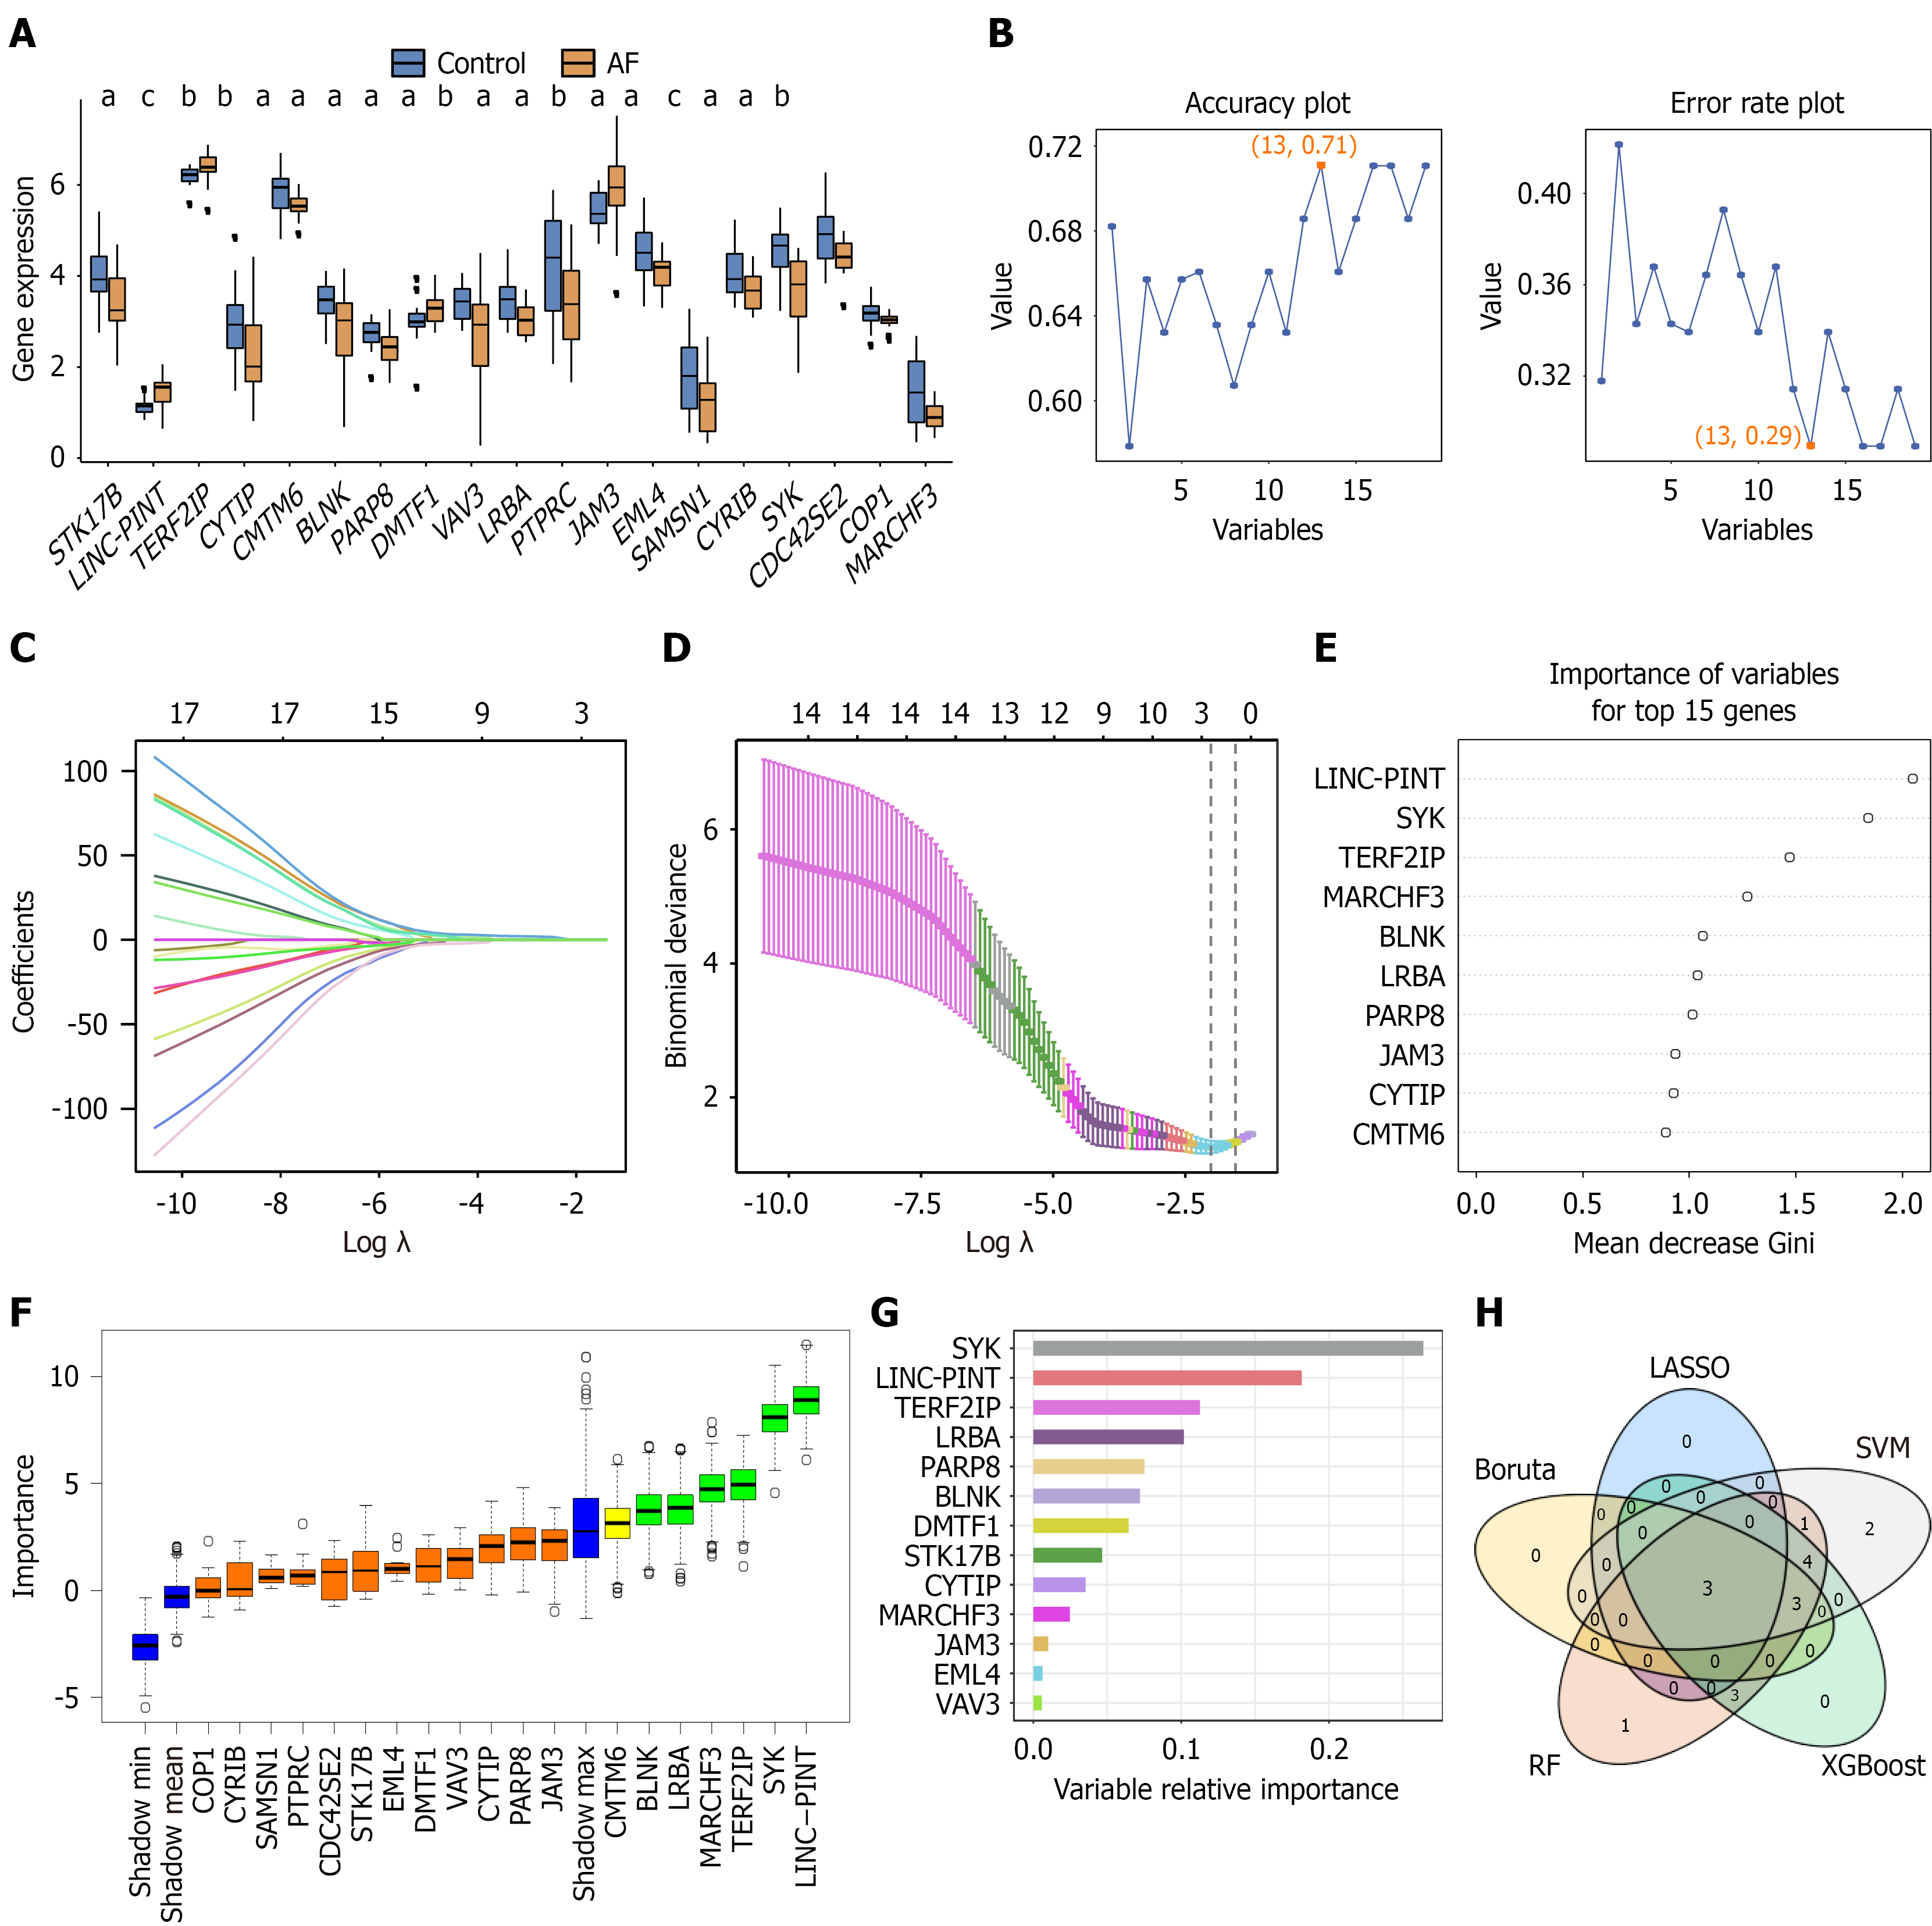
Figure 5 Machine learning-based identification of key genes related to anal fistula-associated B cells.
A: Box plot showing the expression levels of 19 candidate genes in B cells from anal fistula (AF) and control samples. Four genes were significantly upregulated in the AF group; B: Support vector machine model performance: Accuracy peaked (0.71) and error rate reached a minimum (0.29) when 13 variables were used; C: Coefficient profiles from least absolute shrinkage and selection operator (LASSO) regression analysis of the 19 genes across a range of penalty values (logλ); D: LASSO cross-validation plot identifying three key genes; E: Variable importance ranking of the top 15 genes derived from random forest analysis; F: Boruta algorithm identified 6 important genes; G: Extreme gradient boosting model ranking of variable importance across all input genes; H: Venn diagram showing the intersection of genes identified by five machine learning algorithms, with three common genes emerging as core candidates. aP < 0.05; bP < 0.01; cP < 0.001. AF: Anal fistula; LASSO: Least absolute shrinkage and selection operator; RF: Random forest; XGBoost: Extreme gradient boosting; SVM: Support vector machine.
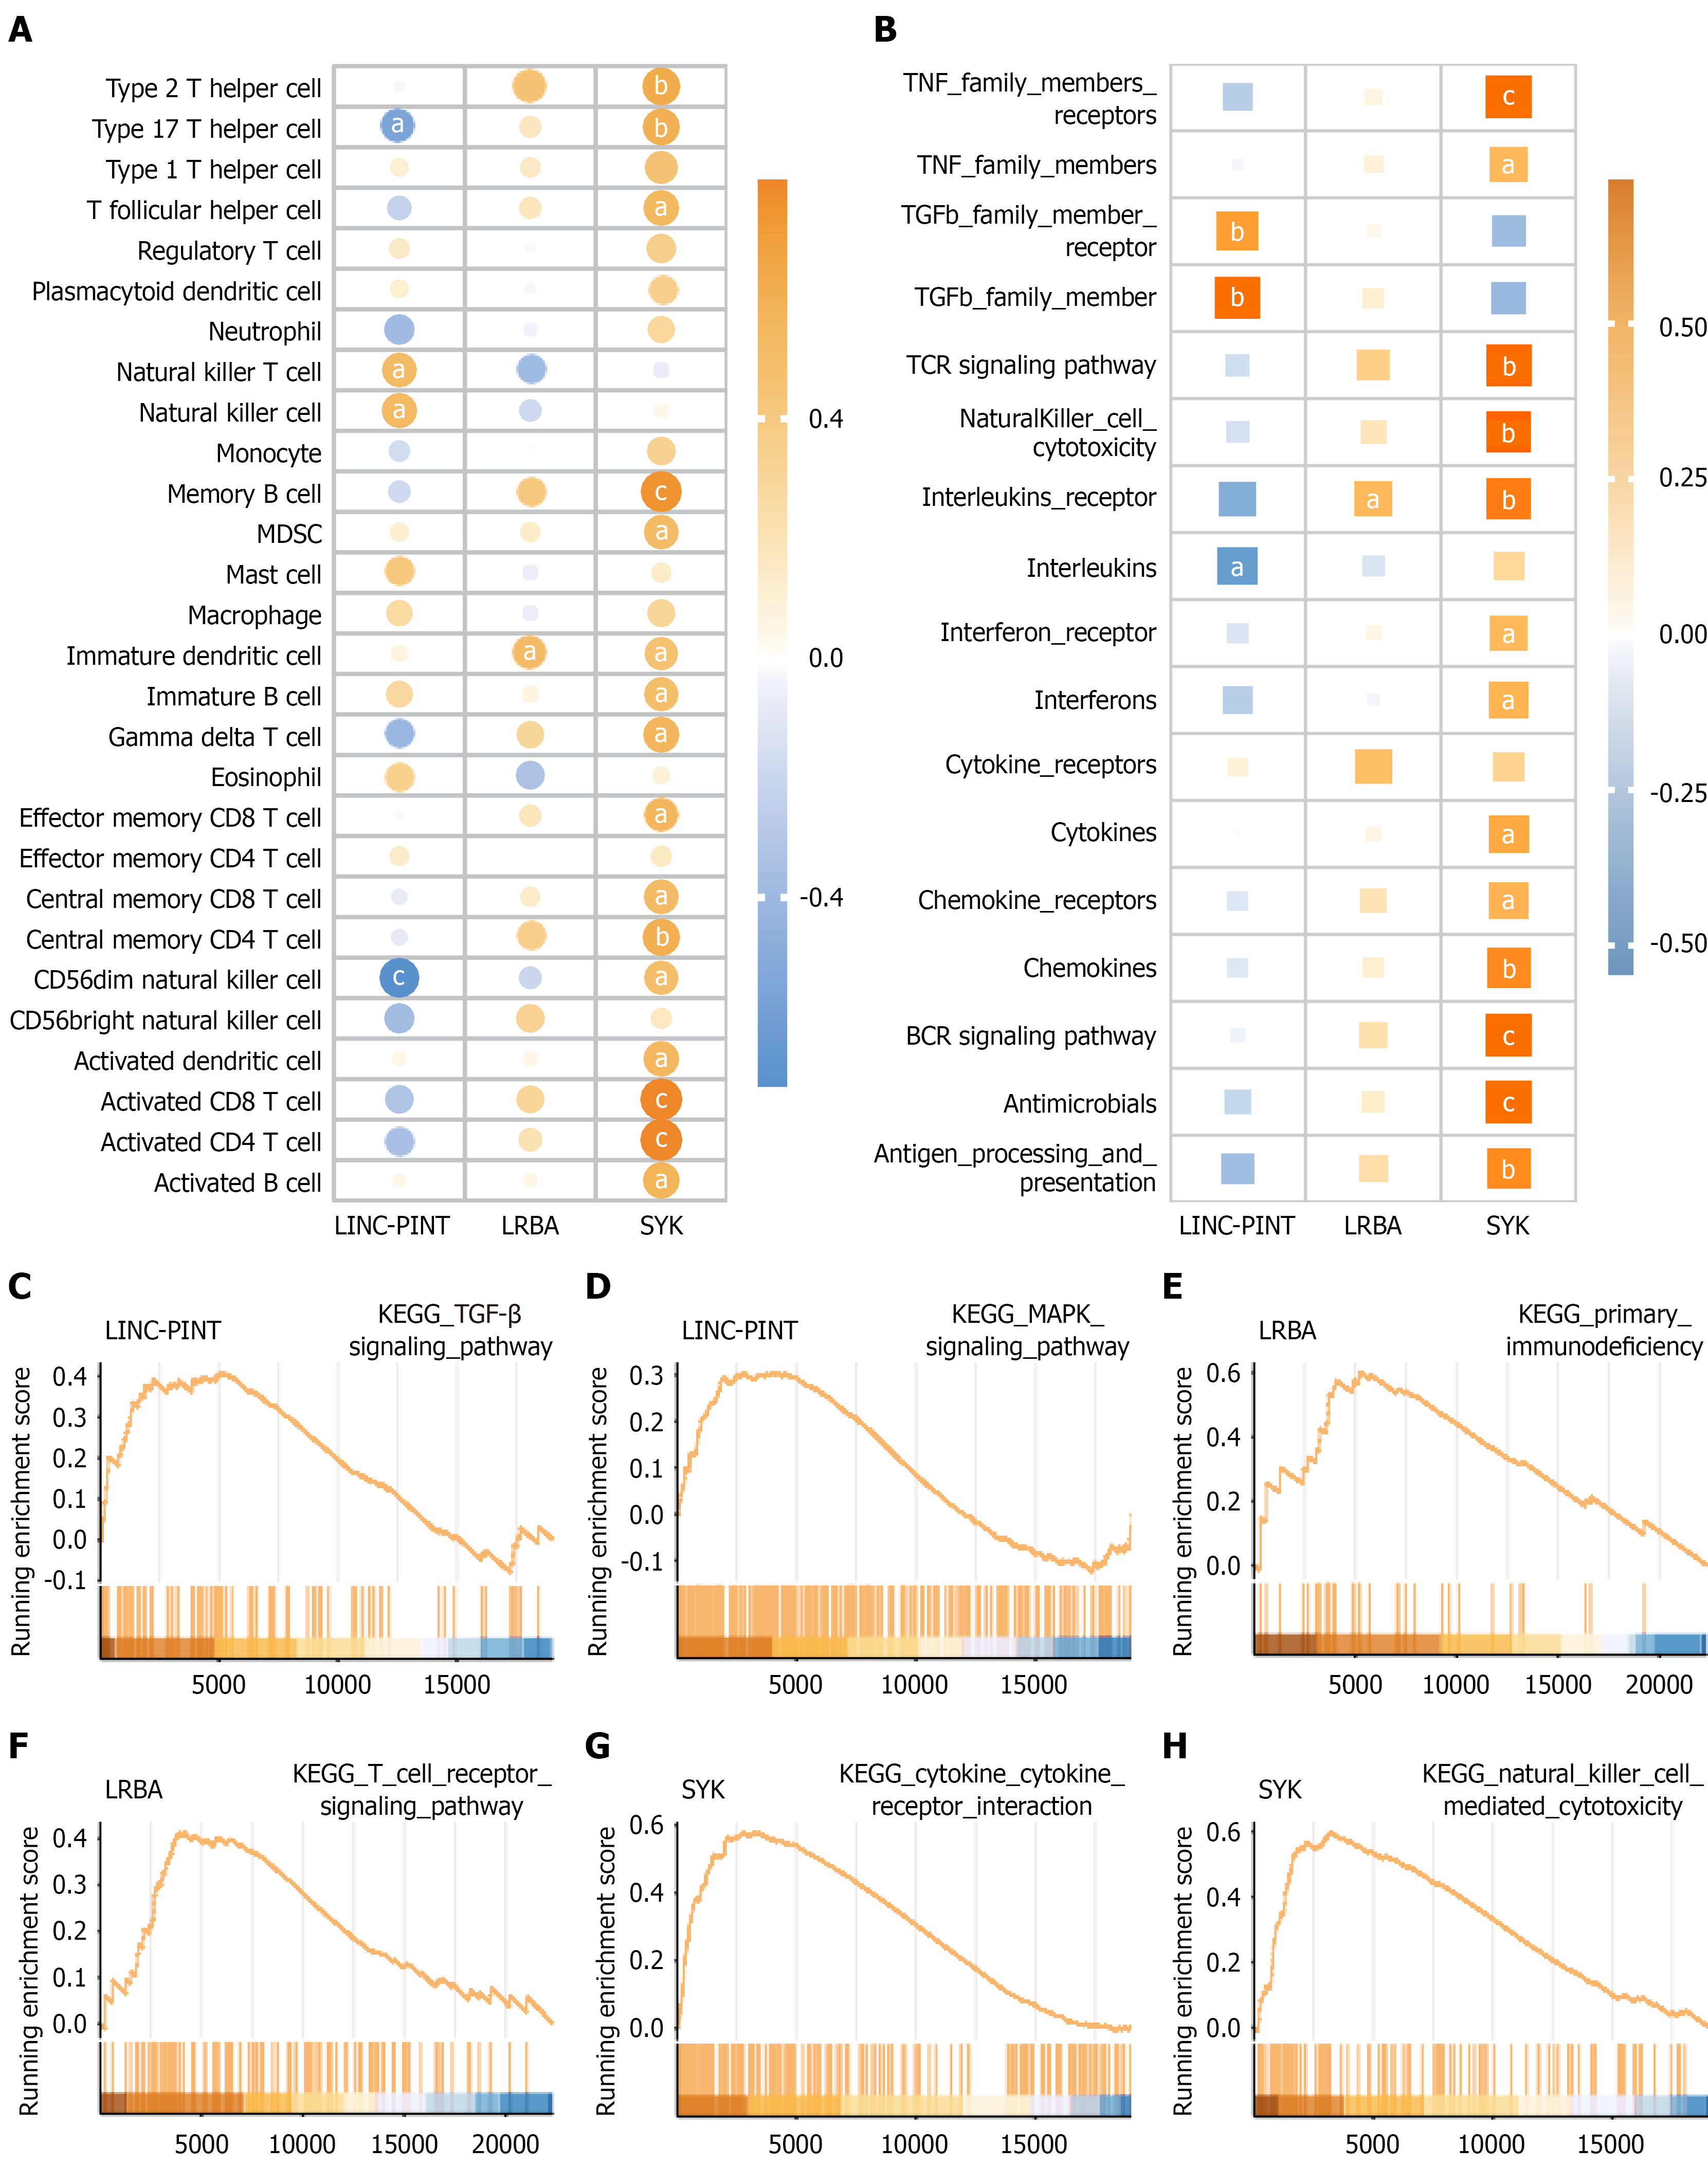
Figure 6 Immune correlation and functional enrichment analysis of LINC-PINT, LRBA, and SYK.
A: Correlation between the expression of LINC-PINT, LRBA, SYK and the abundance of various immune cells, based on single-sample gene set enrichment analysis (GSEA) scores in anal fistula samples; B: Correlation heatmap of LINC-PINT, LRBA, SYK with immune-related functions, including cytokine receptors, antigen processing, and co-stimulatory molecules; C and D: Single-gene GSEA enrichment analysis for LINC-PINT showing significant enrichment in TGF-β signaling pathway and MAPK signaling pathway; E and F: GSEA results for LRBA indicating enrichment in Primary immunodeficiency and T cell receptor signaling pathway; G and H: GSEA results for SYK showing significant enrichment in cytokine-cytokine receptor interaction and Natural killer cell mediated cytotoxicity. aP < 0.05; bP < 0.01; cP < 0.001. KEGG: Kyoto Encyclopedia of Genes and Genomes.
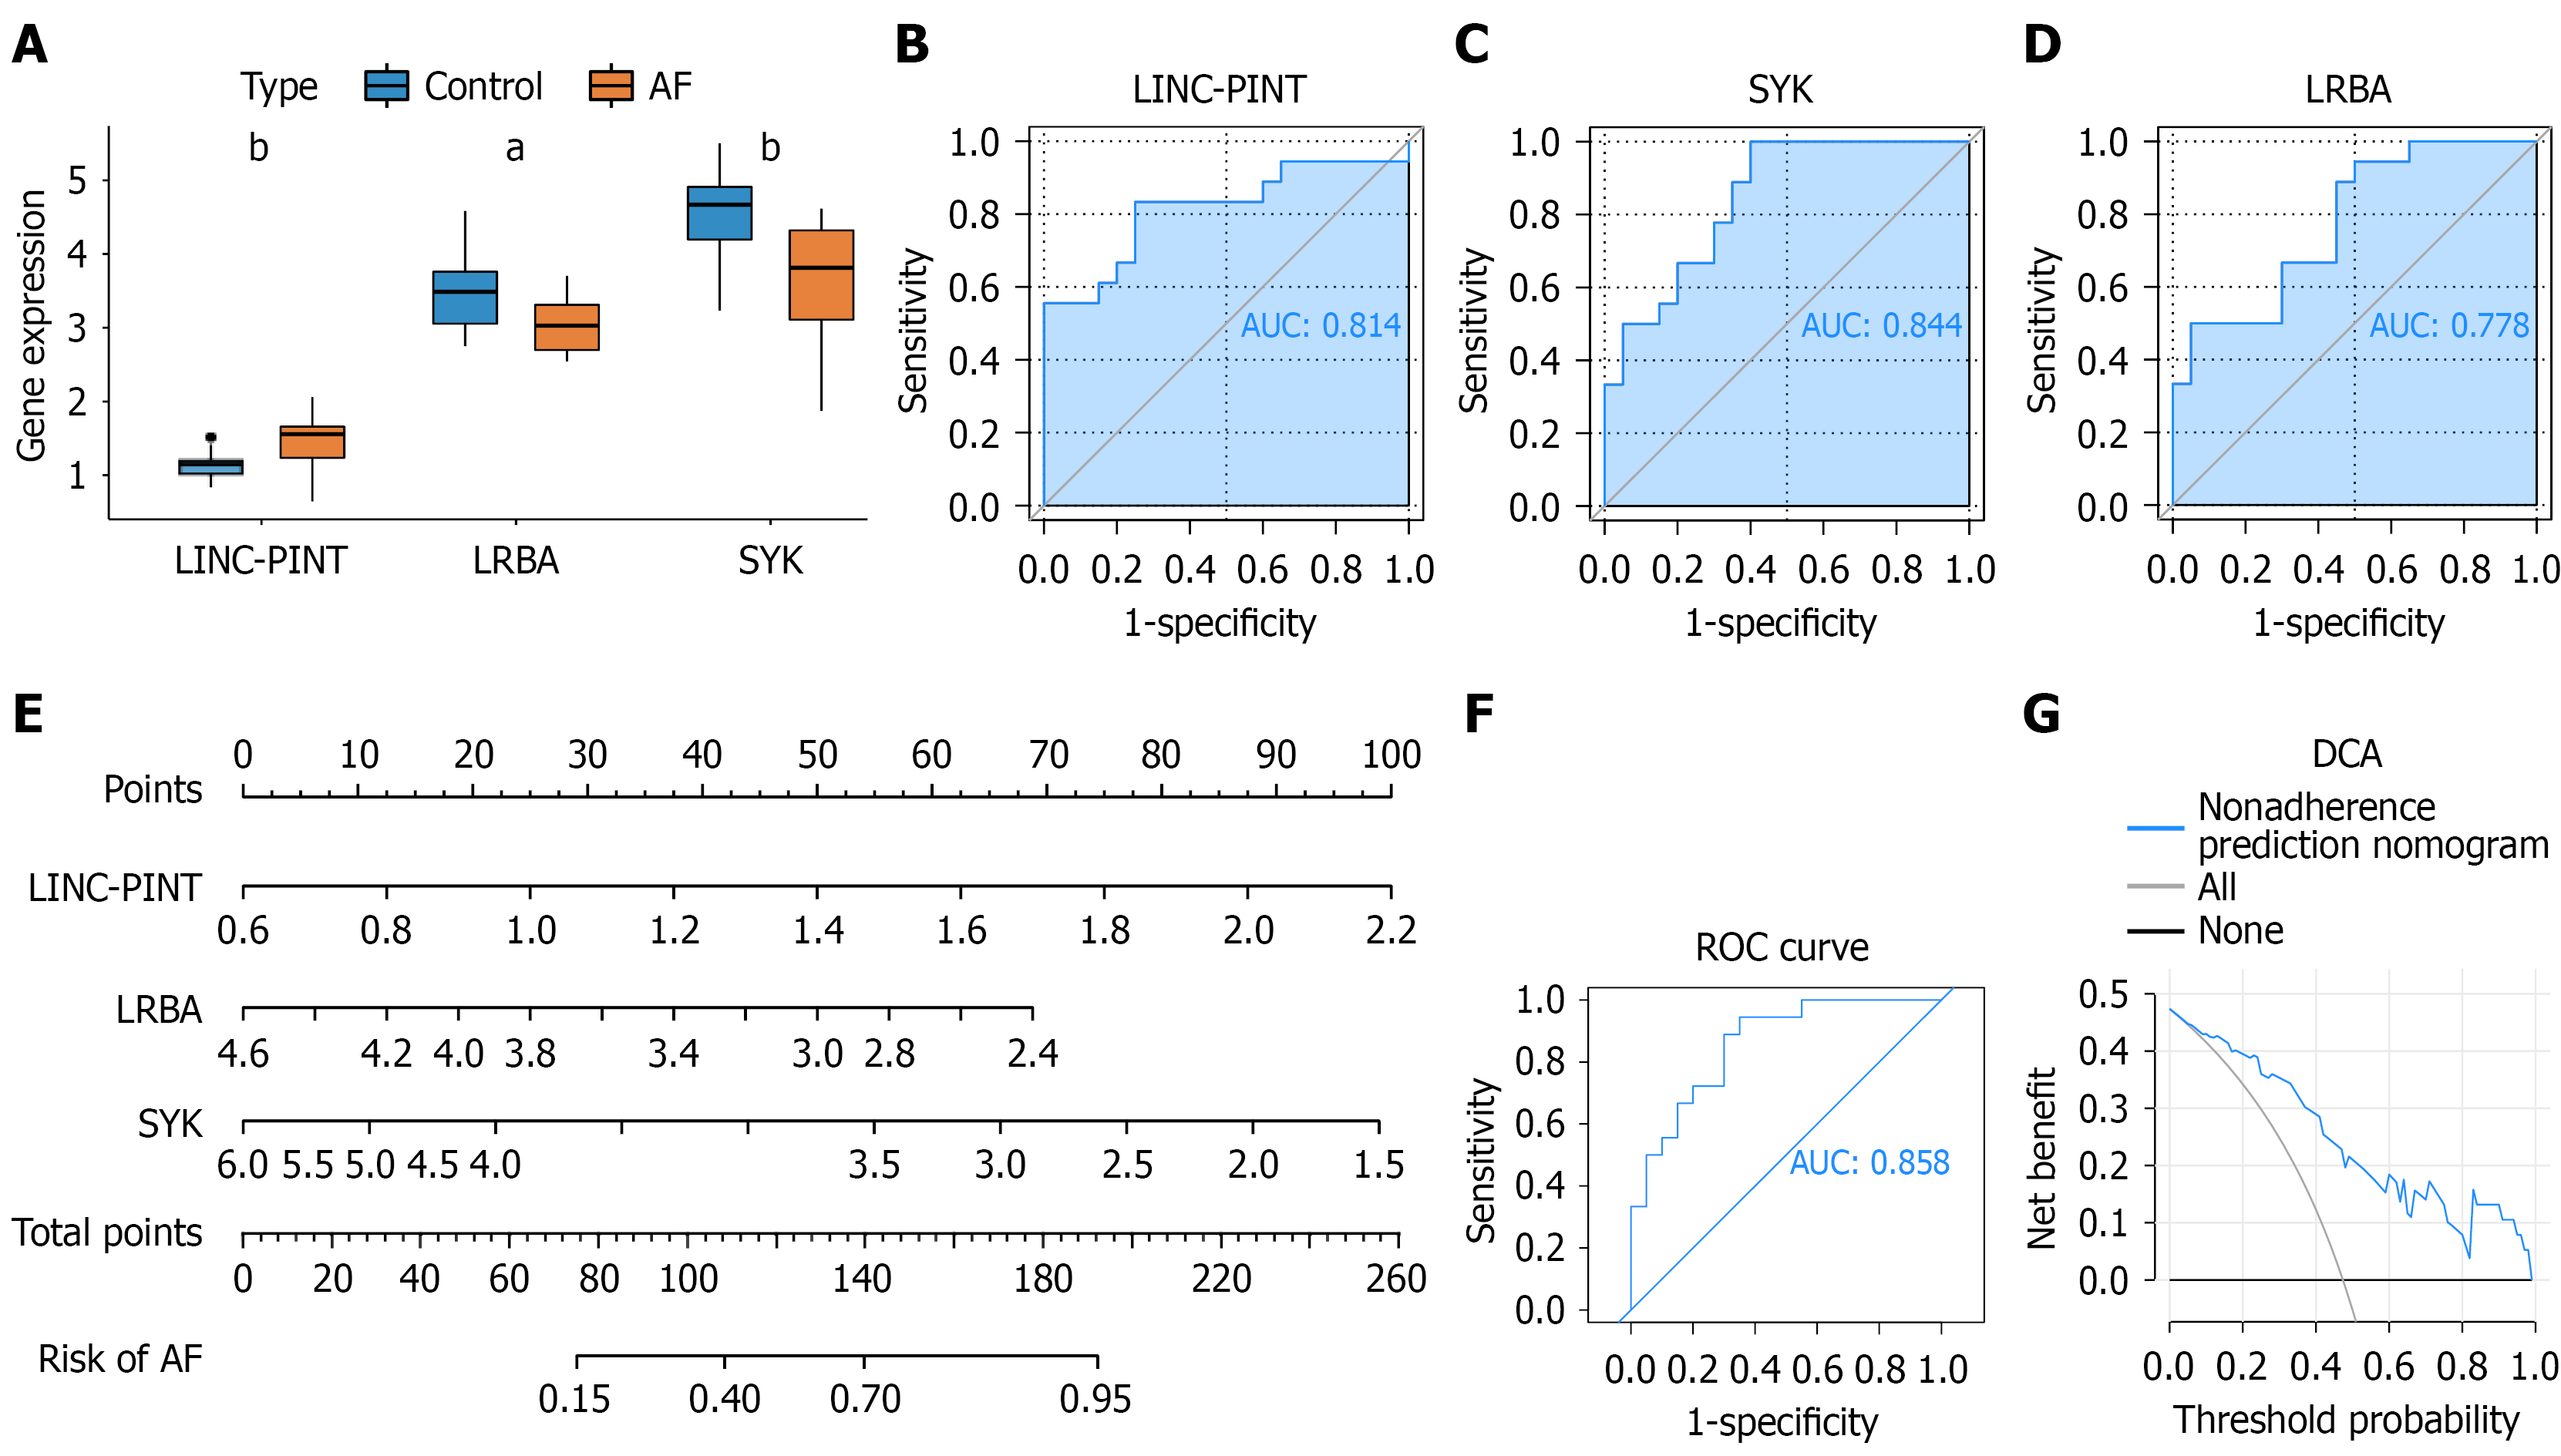
Figure 7 Diagnostic performance and predictive model construction based on LINC-PINT, LRBA, and SYK.
A: Box plot showing the expression levels of LINC-PINT, LRBA, and SYK in anal fistula (AF) vs control group. LINC-PINT showed significantly higher expression in the AF group; B-D: Receiver operating characteristic (ROC) curves evaluating the diagnostic performance of individual genes: LINC-PINT [area under the ROC curves (AUC)= 0.814], SYK (AUC = 0.844), and LRBA (AUC = 0.778); E: Nomogram constructed using LINC-PINT, LRBA, and SYK to predict AF risk; F: ROC curve evaluating the combined predictive model, showing strong discrimination ability; G: Decision curve analysis indicating favorable clinical utility of the nomogram-based prediction model. aP < 0.01; bP < 0.001. AF: Anal fistula; ROC: Receiver operating characteristic; AUC: Area under the receiver operating characteristic curve; DCA: Decision curve analysis.
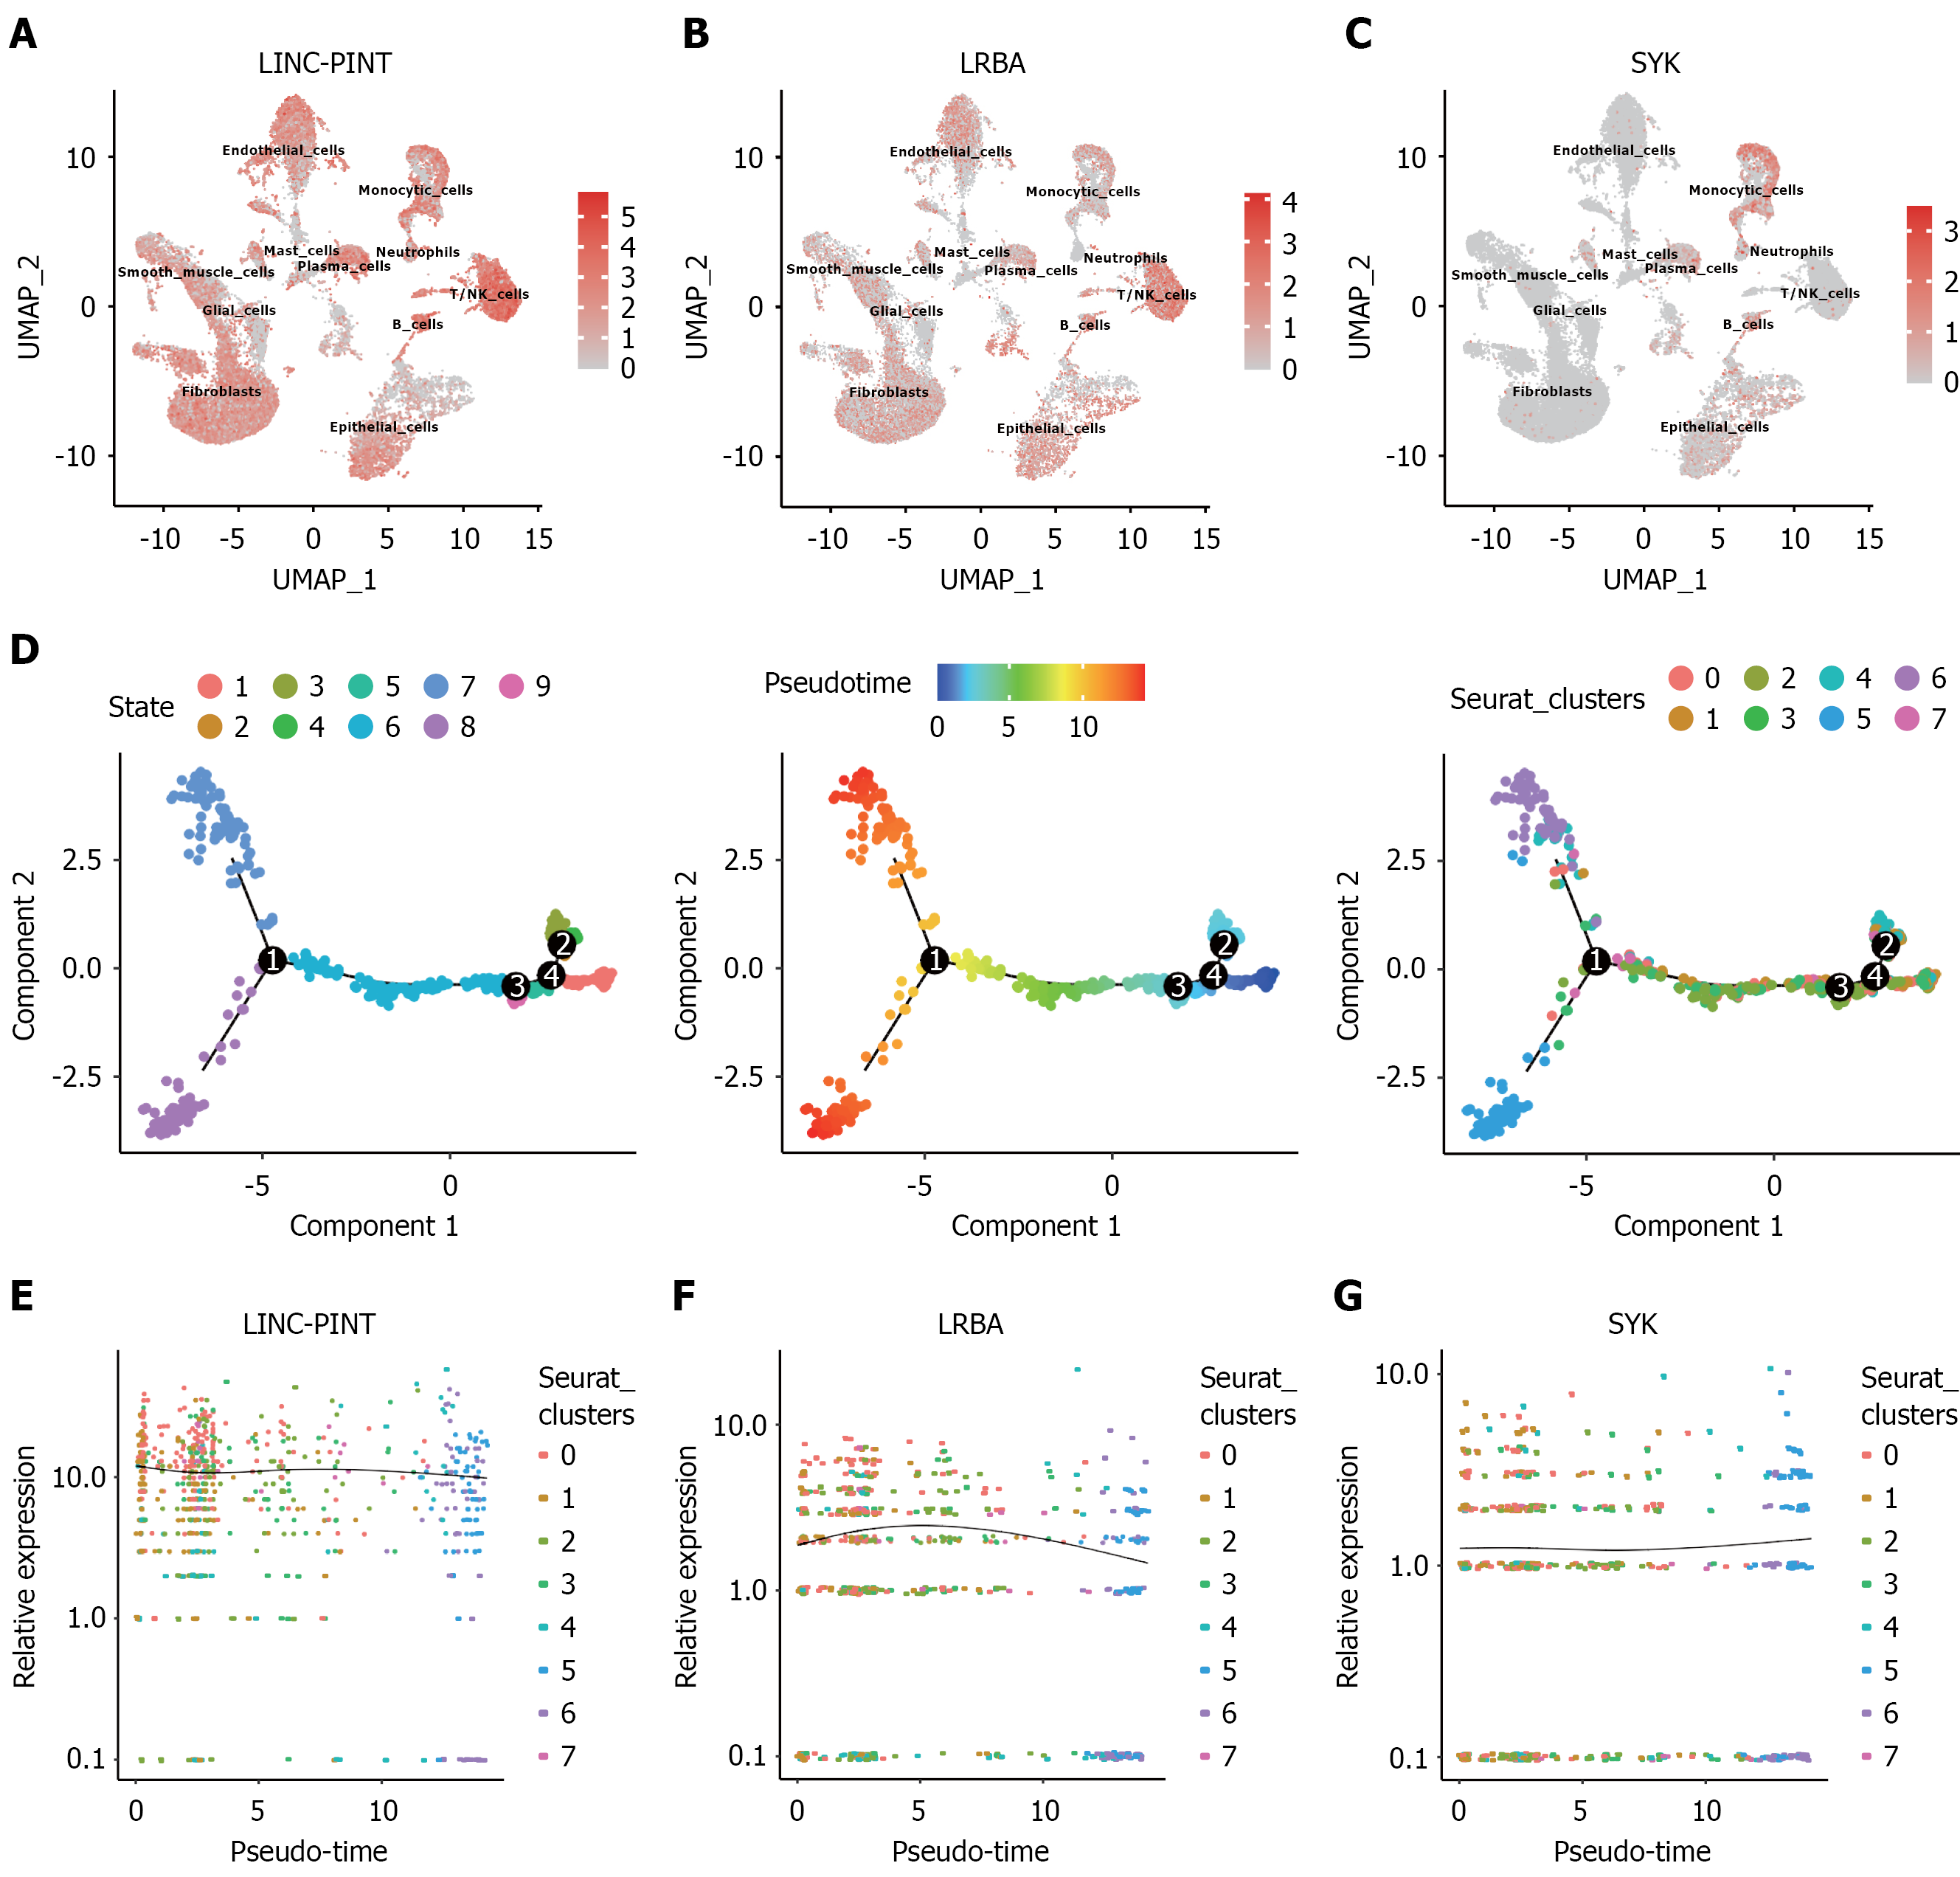
Figure 8 Cellular localization and pseudotime dynamics of key genes in B cells.
A-C: Uniform manifold approximation and projection plots showing the expression patterns of LINC-PINT, LRBA, and SYK across all cell types in anal fistula samples; D: Monocle-based pseudotime trajectory analysis of B cells, identifying a continuous developmental path divided into nine states, with color gradients representing inferred pseudotime progression; E-G: Expression trends of LINC-PINT, LRBA, and SYK along the pseudotime axis. LINC-PINT shows high expression in early pseudotime, declining thereafter, suggesting a role in early B cell activation. LRBA shows a gradual decrease in expression, indicating a role in early-to-mid B cell stages. SYK expression increases at later pseudotime stages, implying involvement in terminal differentiation or immunoregulatory functions of B cells. UMAP: Uniform manifold approximation and projection.
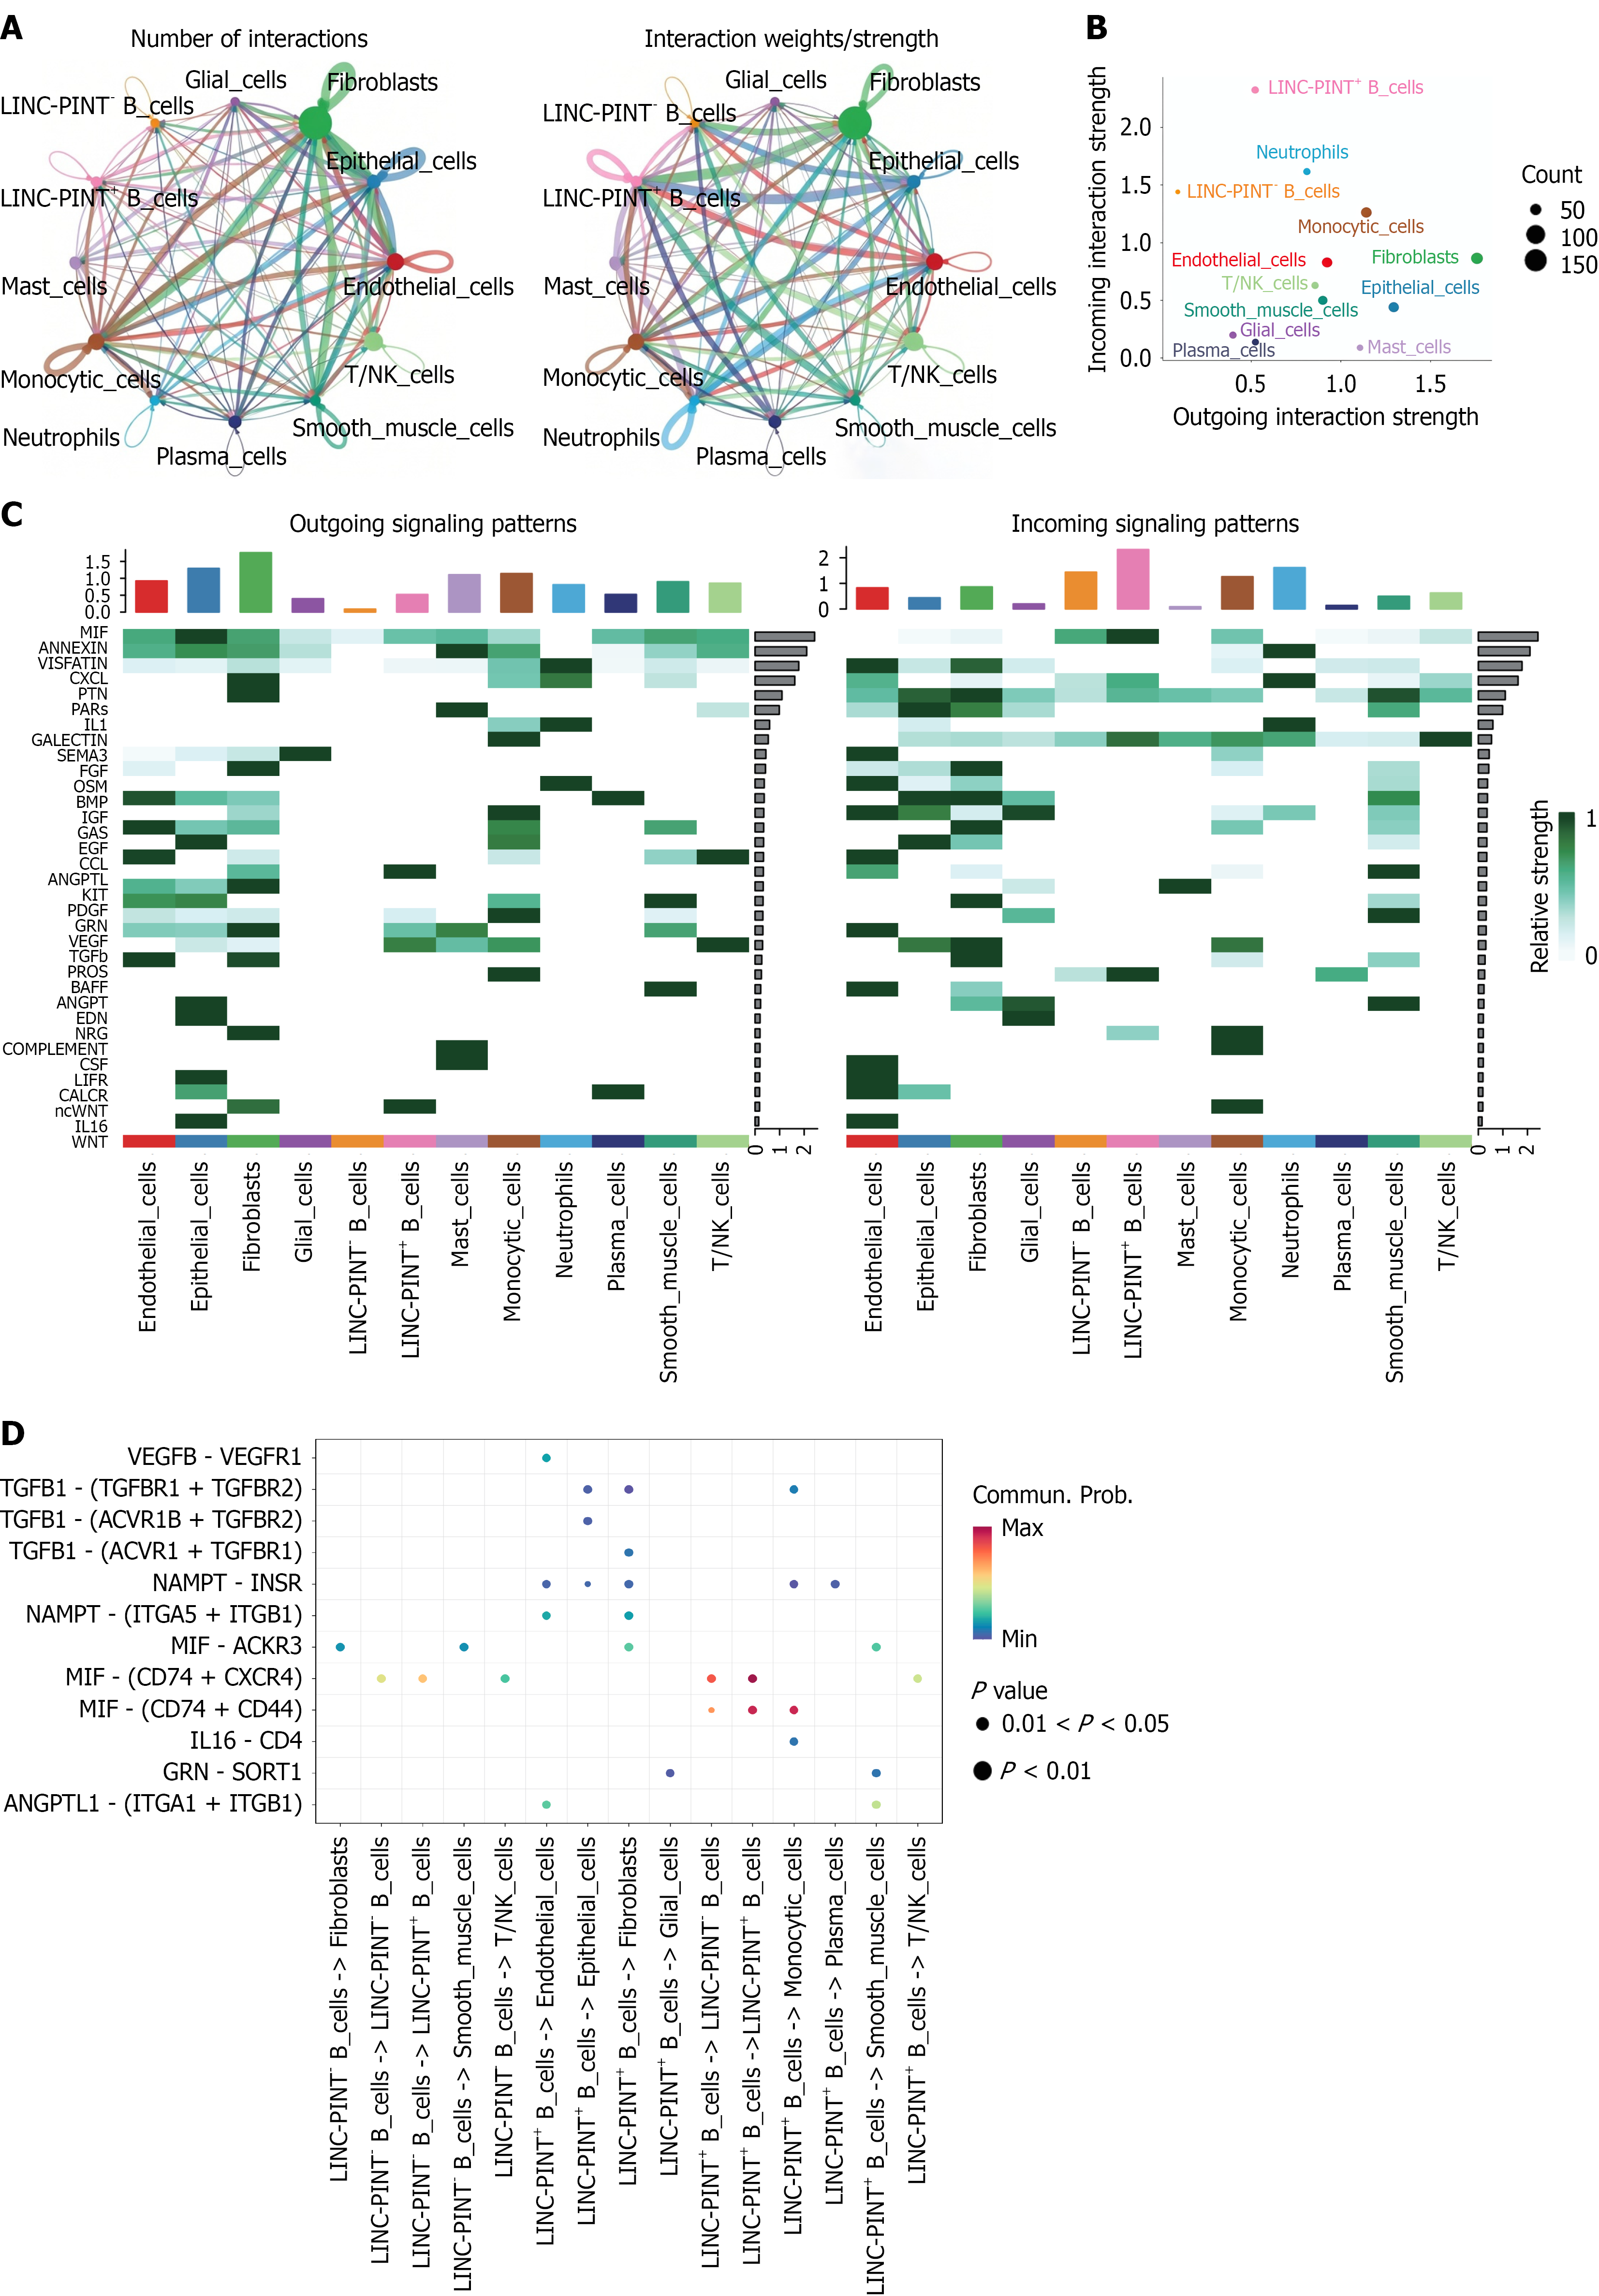
Figure 9 CellChat analysis of LINC-PINT+ B cells in anal fistula.
A: CellChat network plots illustrating the number and strength of intercellular communications among different cell types. LINC-PINT+ B cells exhibited more extensive and stronger interactions than LINC-PINT-B cells; B: Scatter plot of outgoing vs incoming signaling strength across all cell types. LINC-PINT+ B cells show higher overall communication strength; C: Heatmaps of outgoing and incoming signaling patterns across cell types. LINC-PINT+ B cells are highly active in classical immune-related pathways; D: The ligand-receptor interactions between different cell types and LRBA+/- B cells.
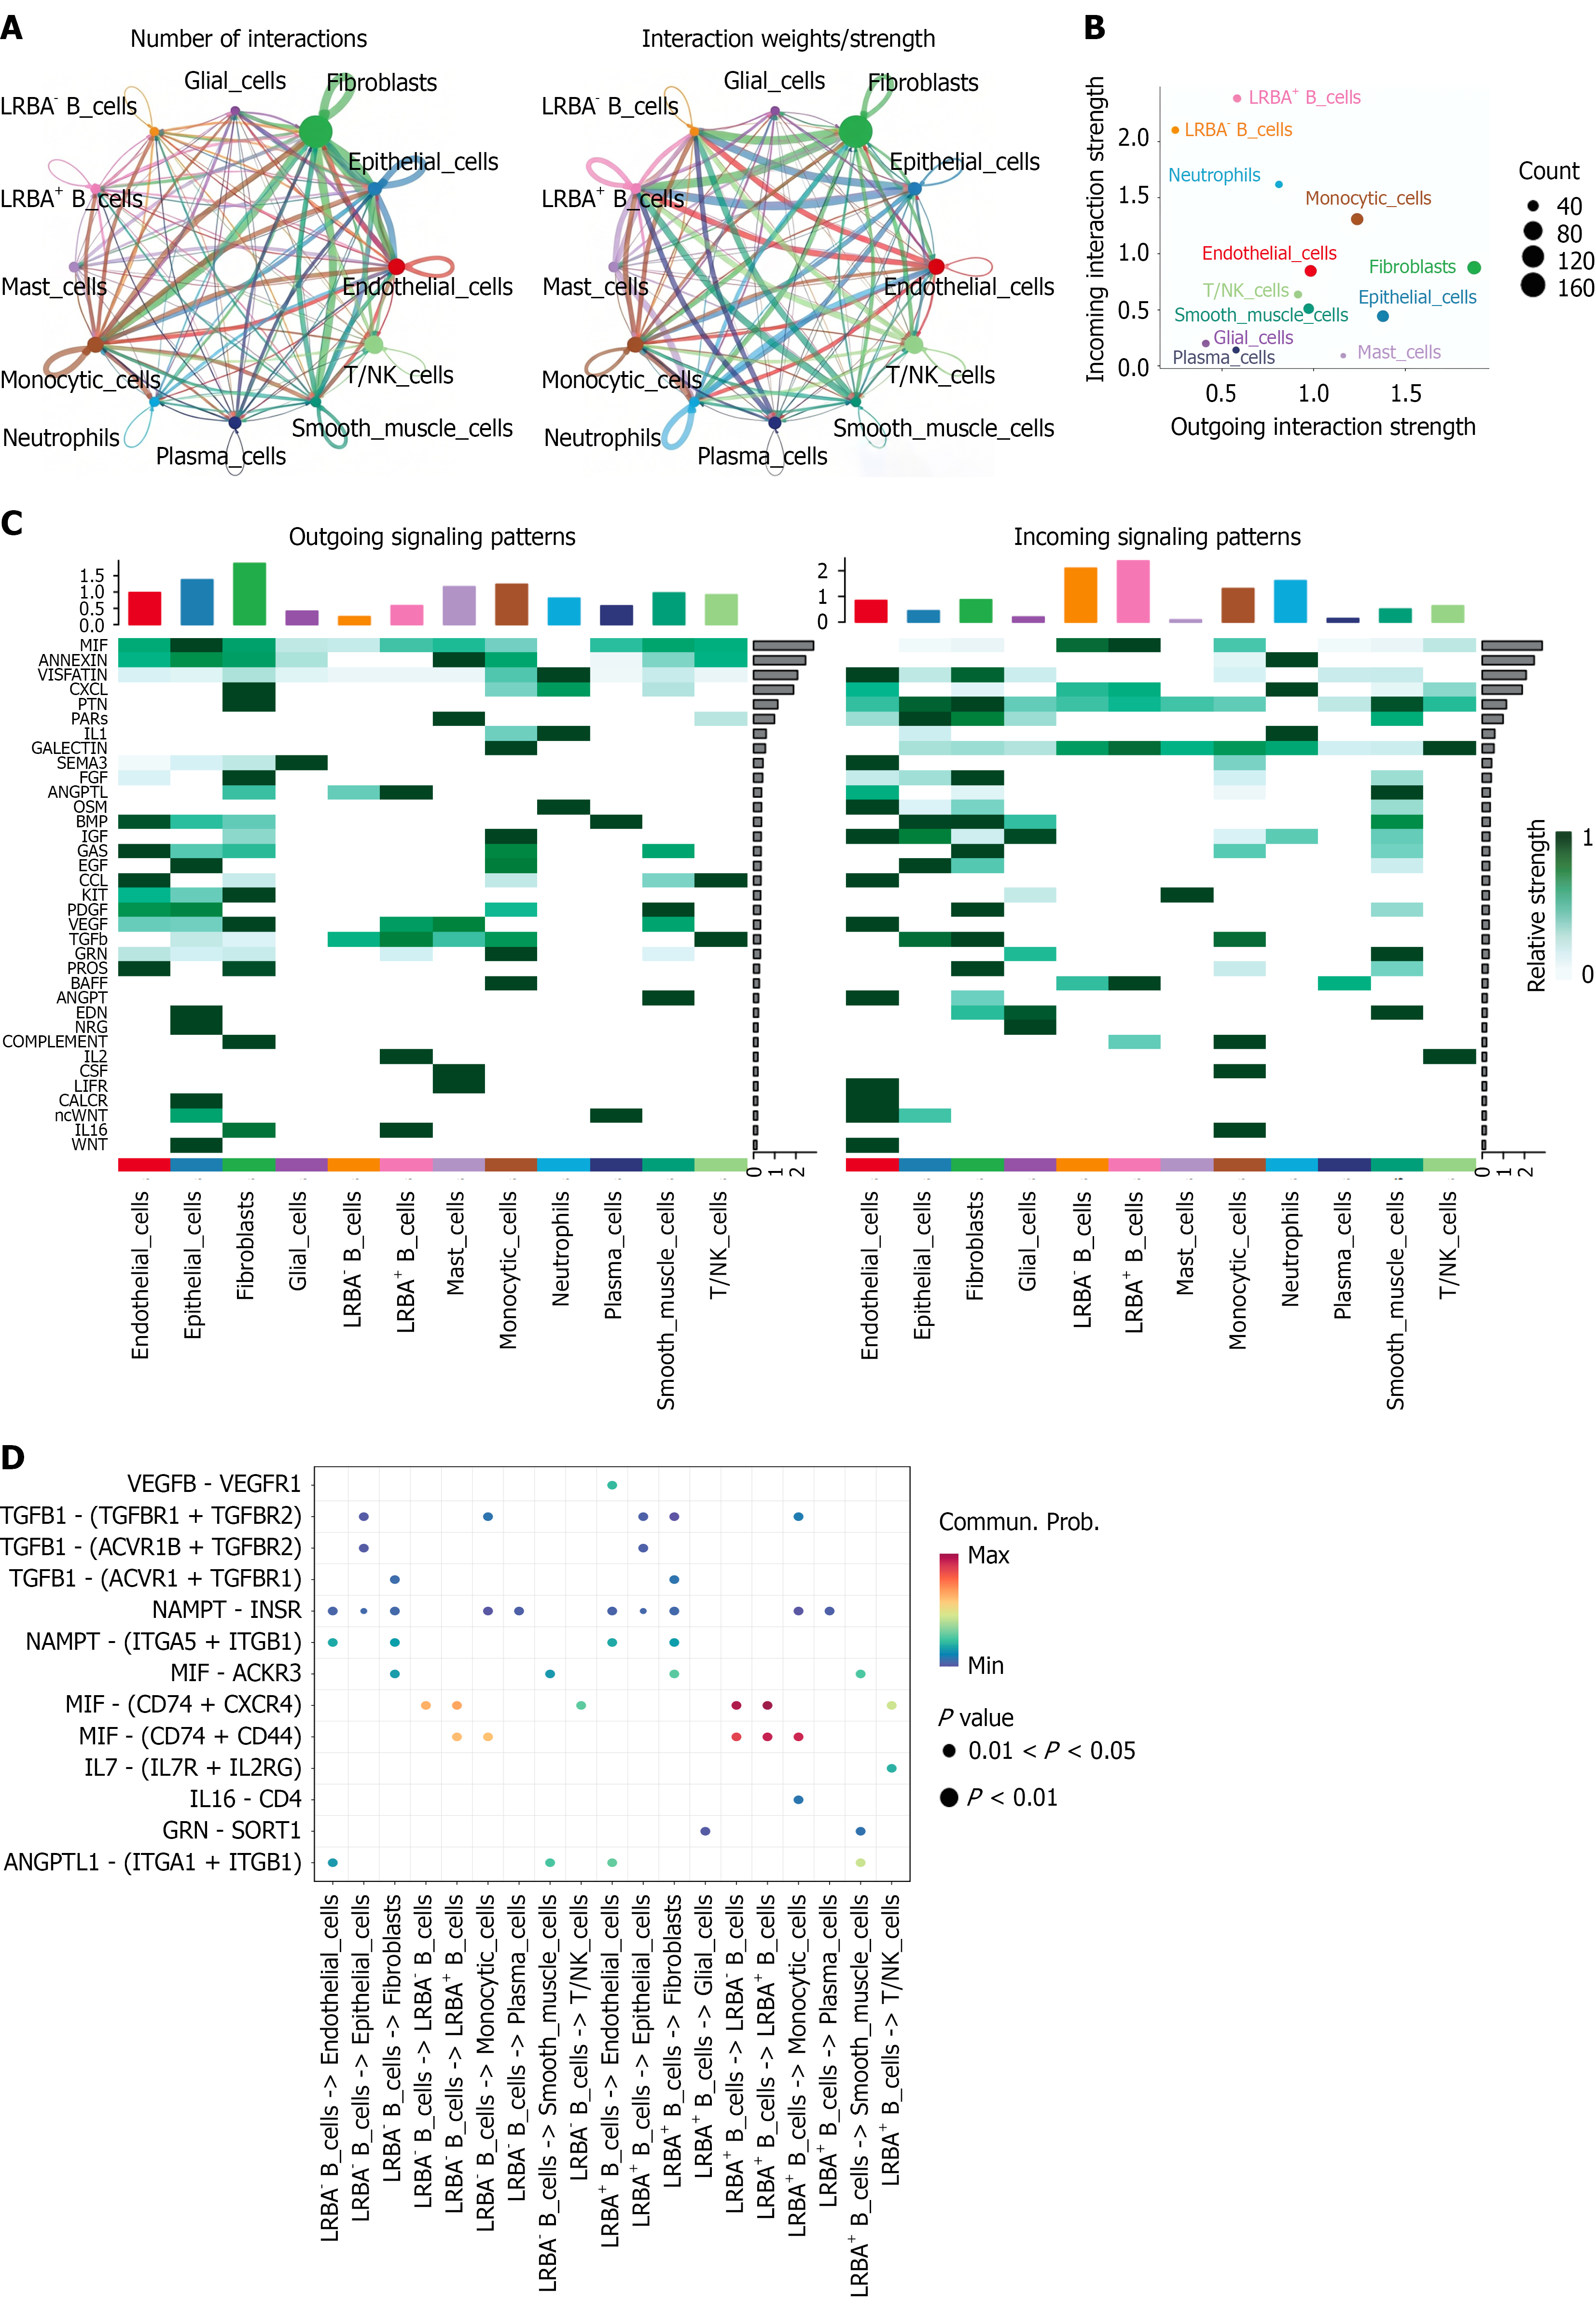
Figure 10 CellChat analysis of LRBA+ B cells in anal fistula.
A: CellChat interaction network showing the number of intercellular interactions among all cell types. LRBA+ B cells exhibited a greater number of interactions compared to LRBA- B cells; B: Communication strength analysis revealing that LRBA+ B cells possess higher overall interaction strength with other cell types; C: Heatmaps of outgoing and incoming signaling patterns across all cell types. LRBA+ B cells demonstrated enhanced outgoing signaling activity, particularly in classic immune and inflammatory pathways; D: The ligand-receptor interactions between different cell types and LRBA+/- B cells.
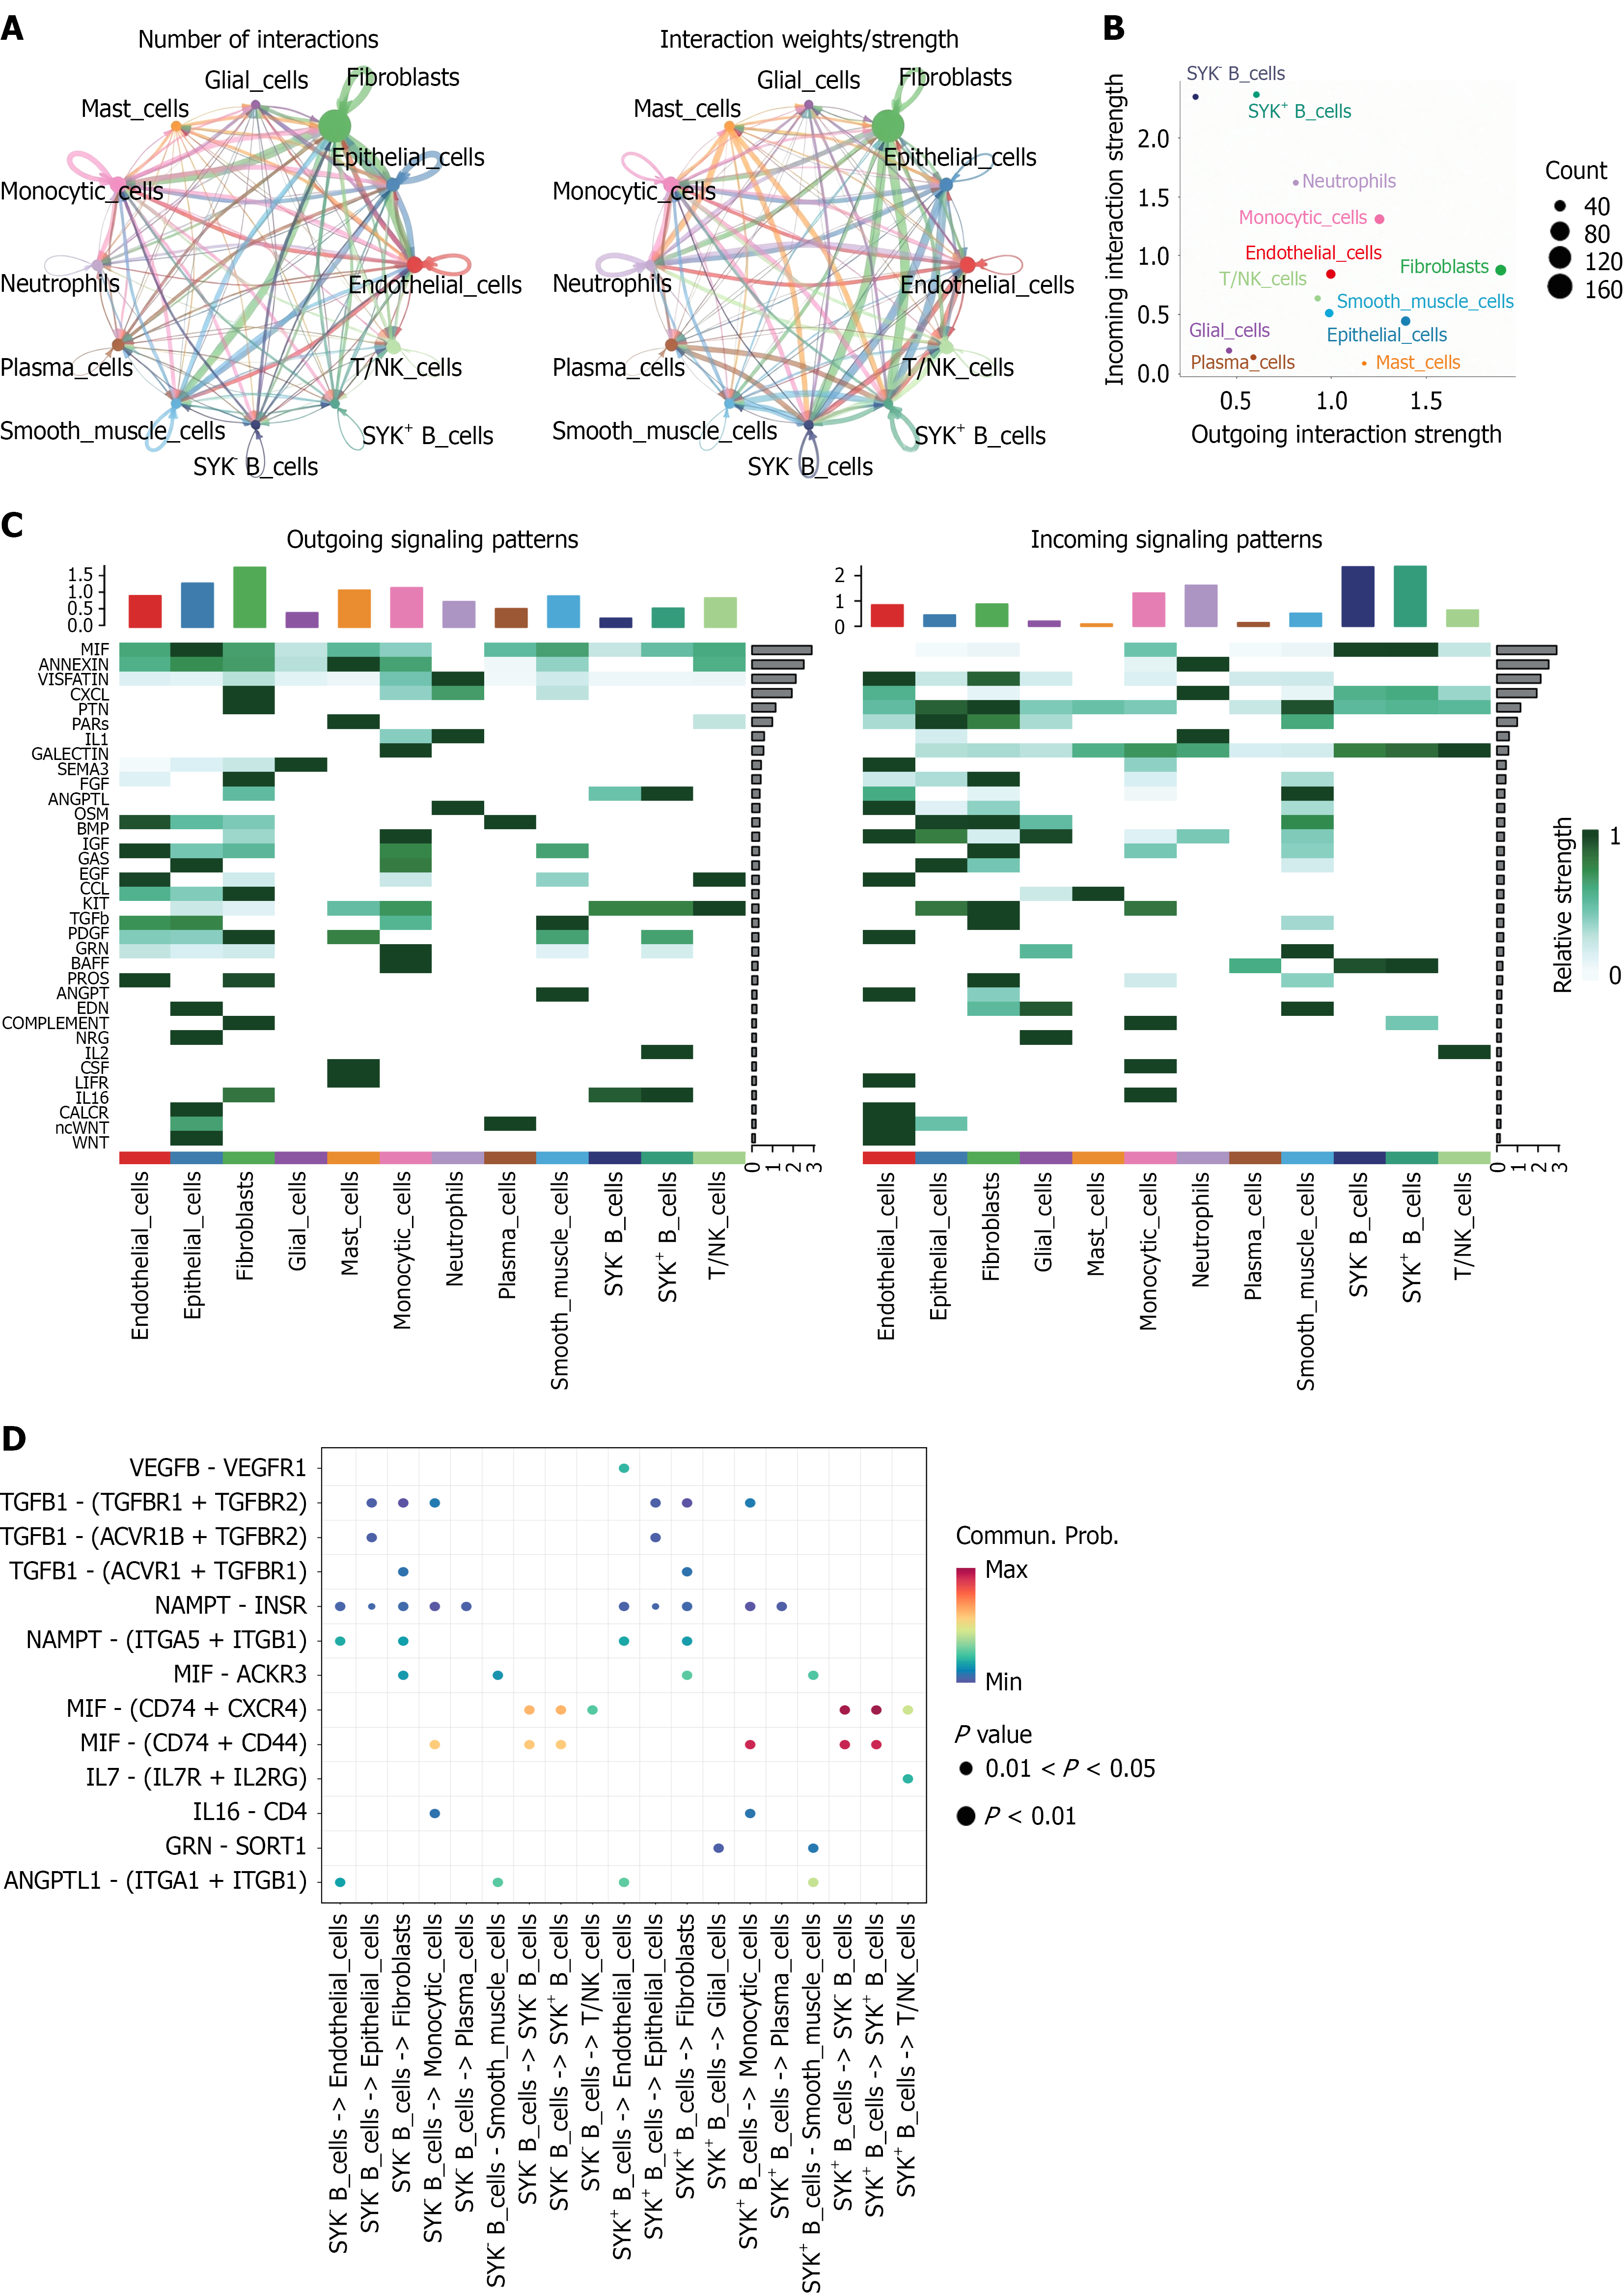
Figure 11 CellChat analysis of SYK+ B cells in anal fistula.
A: CellChat interaction network showing the number of interactions among different cell types. SYK+ B cells exhibit a markedly higher number of interactions compared to SYK- B cells; B: Communication strength analysis reveals that SYK+ B cells possess significantly stronger interactions with surrounding immune and stromal cell populations; C: Outgoing and incoming signaling heatmaps demonstrate that SYK+ B cells show enhanced outgoing activity in key inflammatory and immune pathways; D: The ligand-receptor interactions between different cell types and SYK+/- B cells.
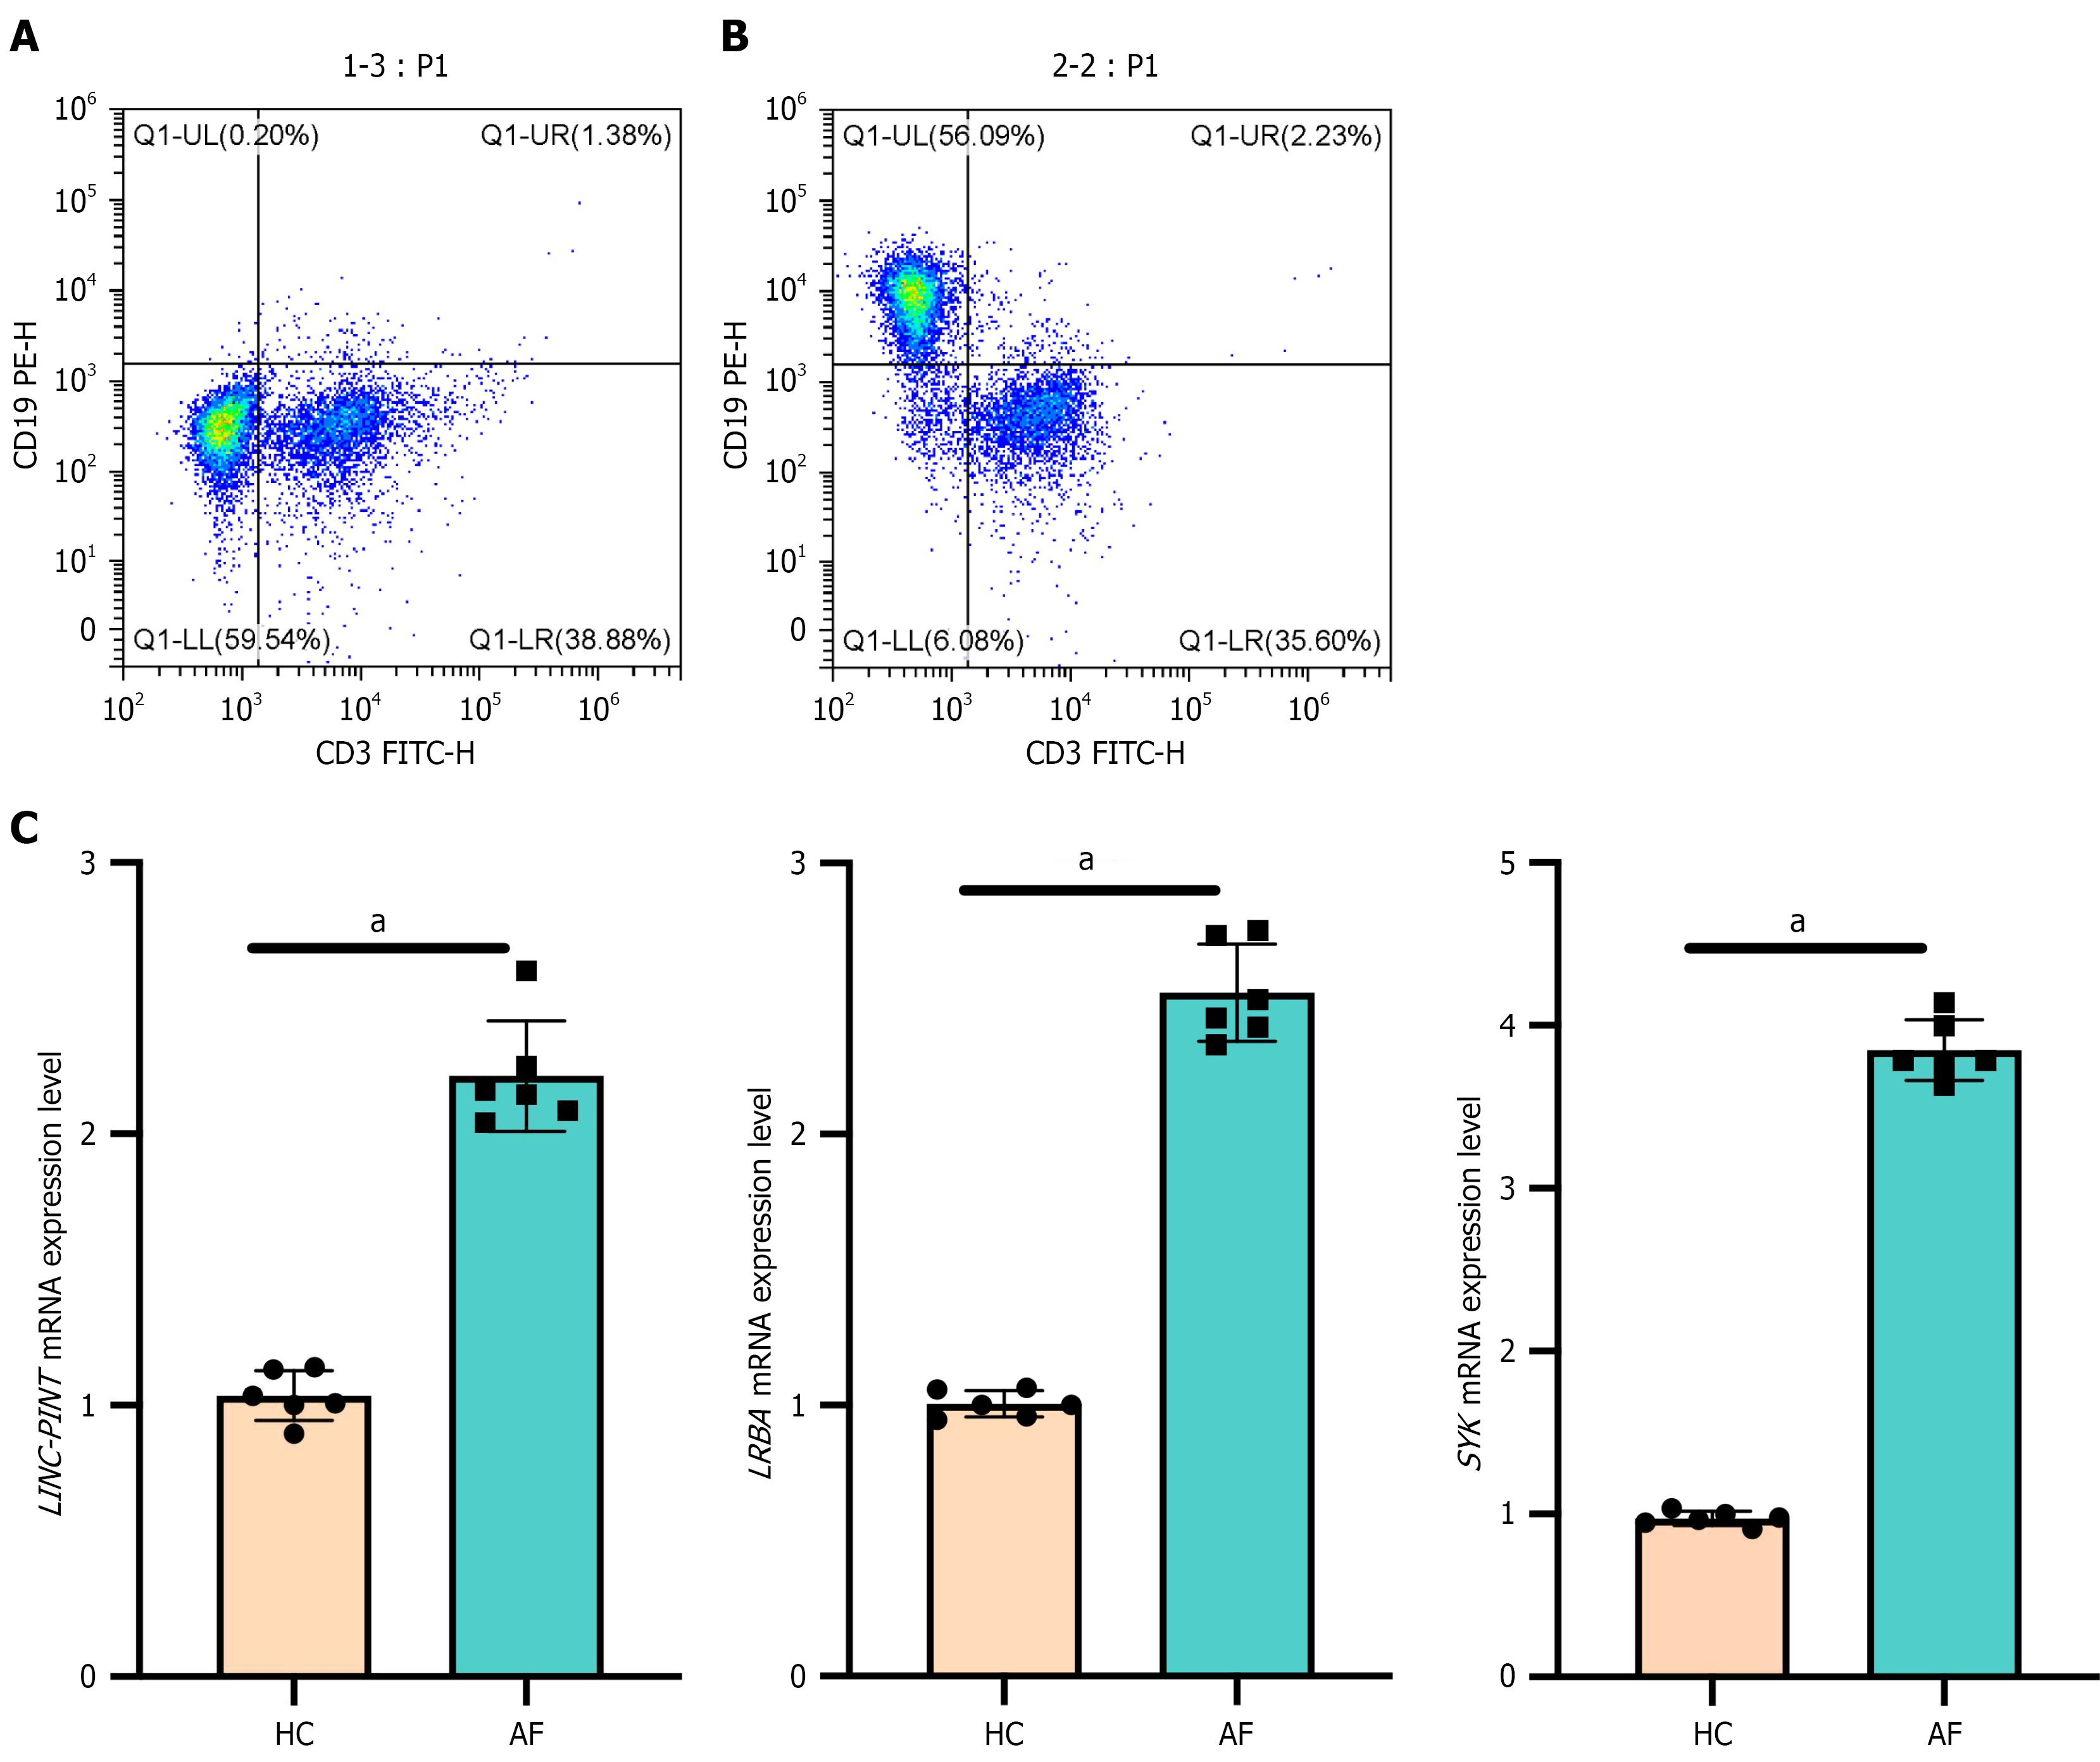
Figure 12 Flow cytometric identification and gene expression analysis of B cells.
A: Gating strategy for B cell isolation in healthy controls; B: Gating strategy for B cell isolation in samples of anal fistula. Cells were identified as CD19+ CD3- to exclude T cells and ensure high purity of the B cell population; C: Reverse transcription-quantitative PCR analysis of LINC-PINT, LRBA, and SYK expression levels in the sorted CD19+ CD3- B cells. aP < 0.01. AF: Anal fistula; HC: Healthy control.
- Citation: Li TT, Li JN, Yang HW, Dou XY, Jiang L, Lai LX, Yu Q, Chen XY, Wang Y, Zhang XC, Ma HF, Song XB. Single-cell and bulk transcriptomics with machine learning decode B cell hub genes and diagnostic biomarkers in anal fistula. World J Gastroenterol 2026; 32(38): 121425
- URL: https://www.wjgnet.com/1007-9327/full/v32/i38/121425.htm
- DOI: https://dx.doi.org/10.3748/wjg.121425