
















Copyright: ©Author(s) 2026.
World J Gastroenterol. Oct 14, 2026; 32(38): 121333
Published online Oct 14, 2026. doi: 10.3748/wjg.121333
Published online Oct 14, 2026. doi: 10.3748/wjg.121333
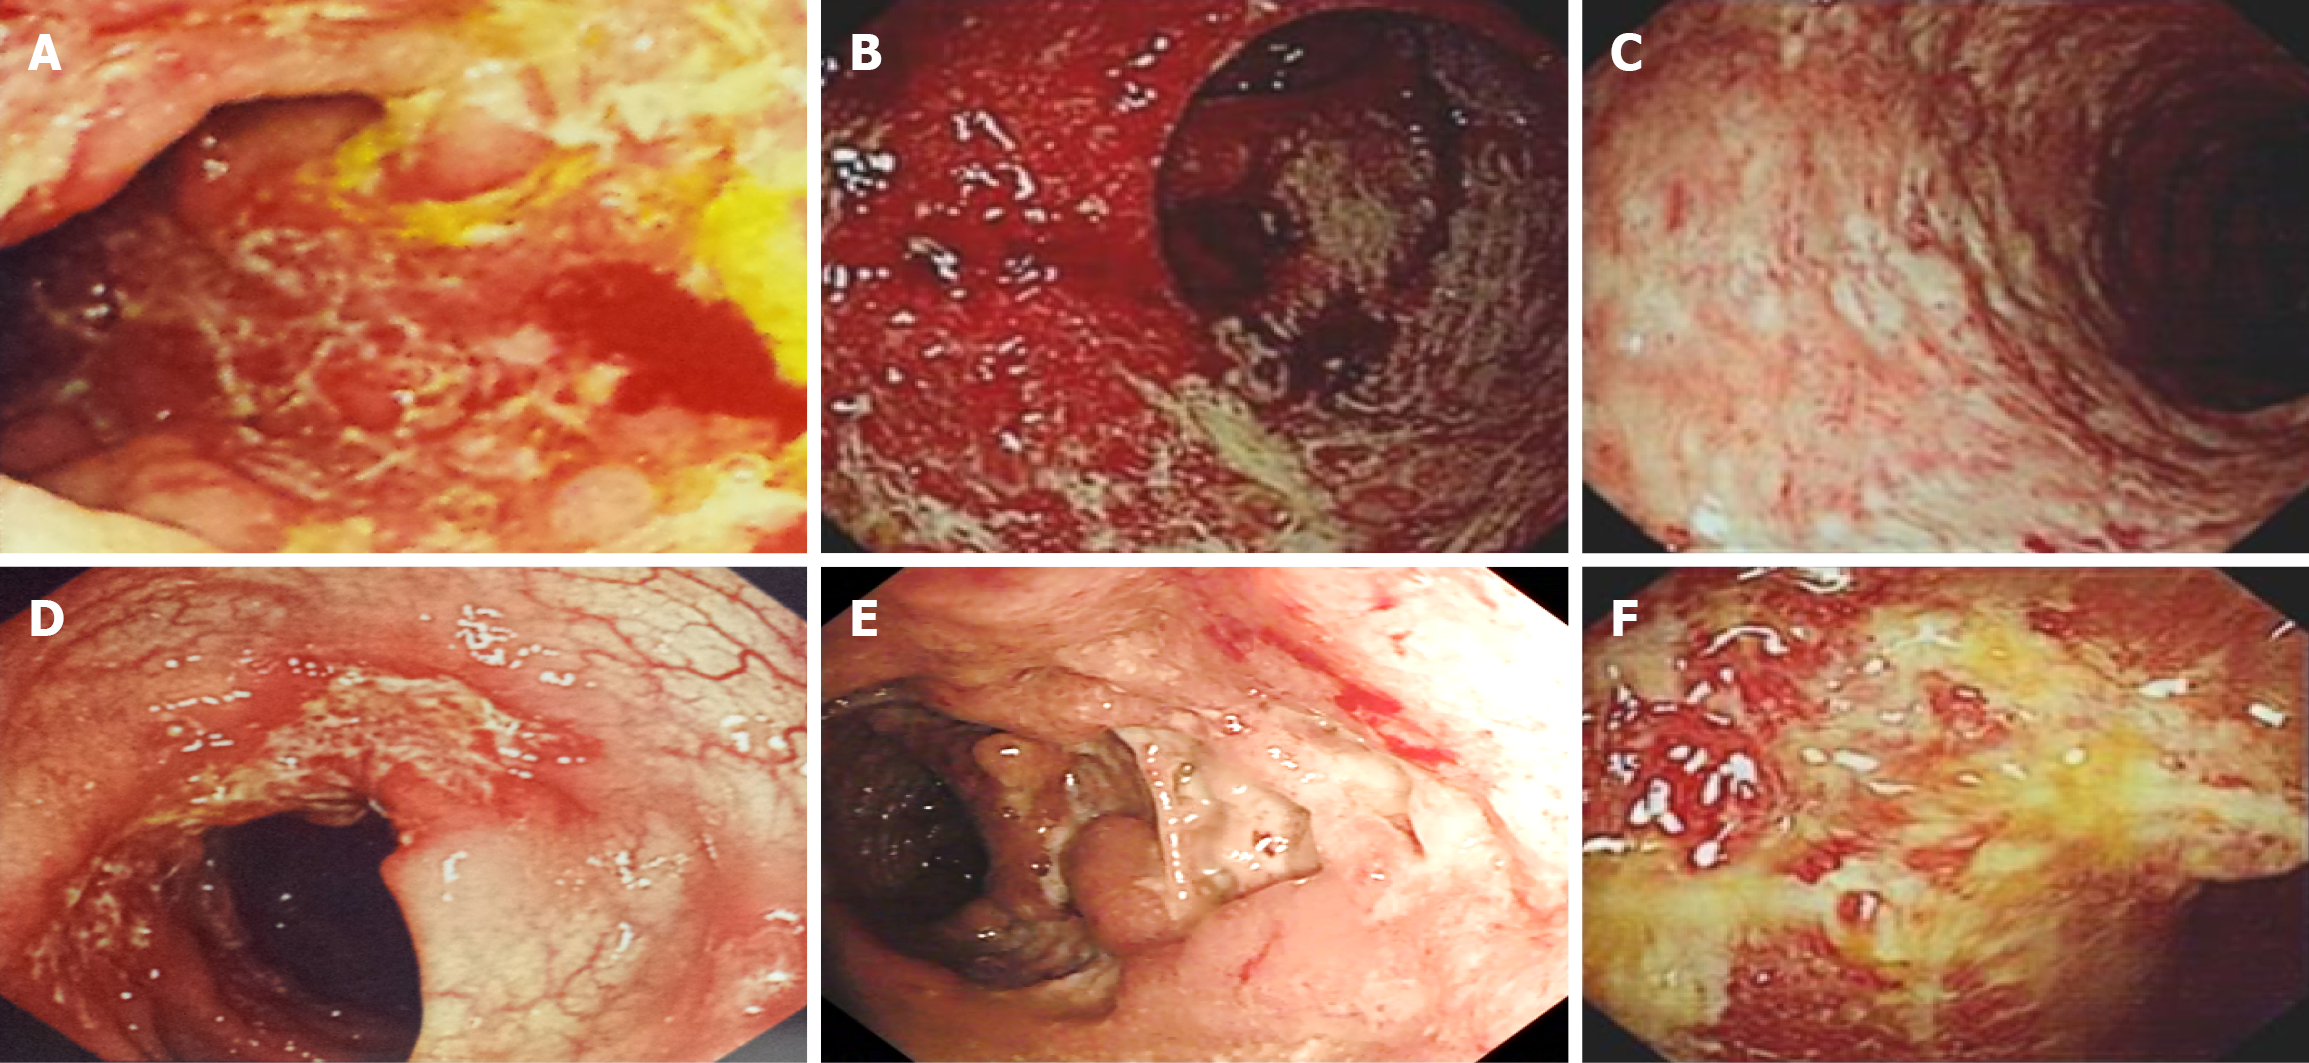
Figure 1 Endoscopic images of severe ulcerative colitis.
A-C: They show severe diffuse inflammation, friable mucosa, spontaneous bleeding and ulcerations, loss of the normal vascular pattern with granular mucosal pattern, pseudopolyps; D-F: Deep ulceration with mucosal bridge and necrosis.
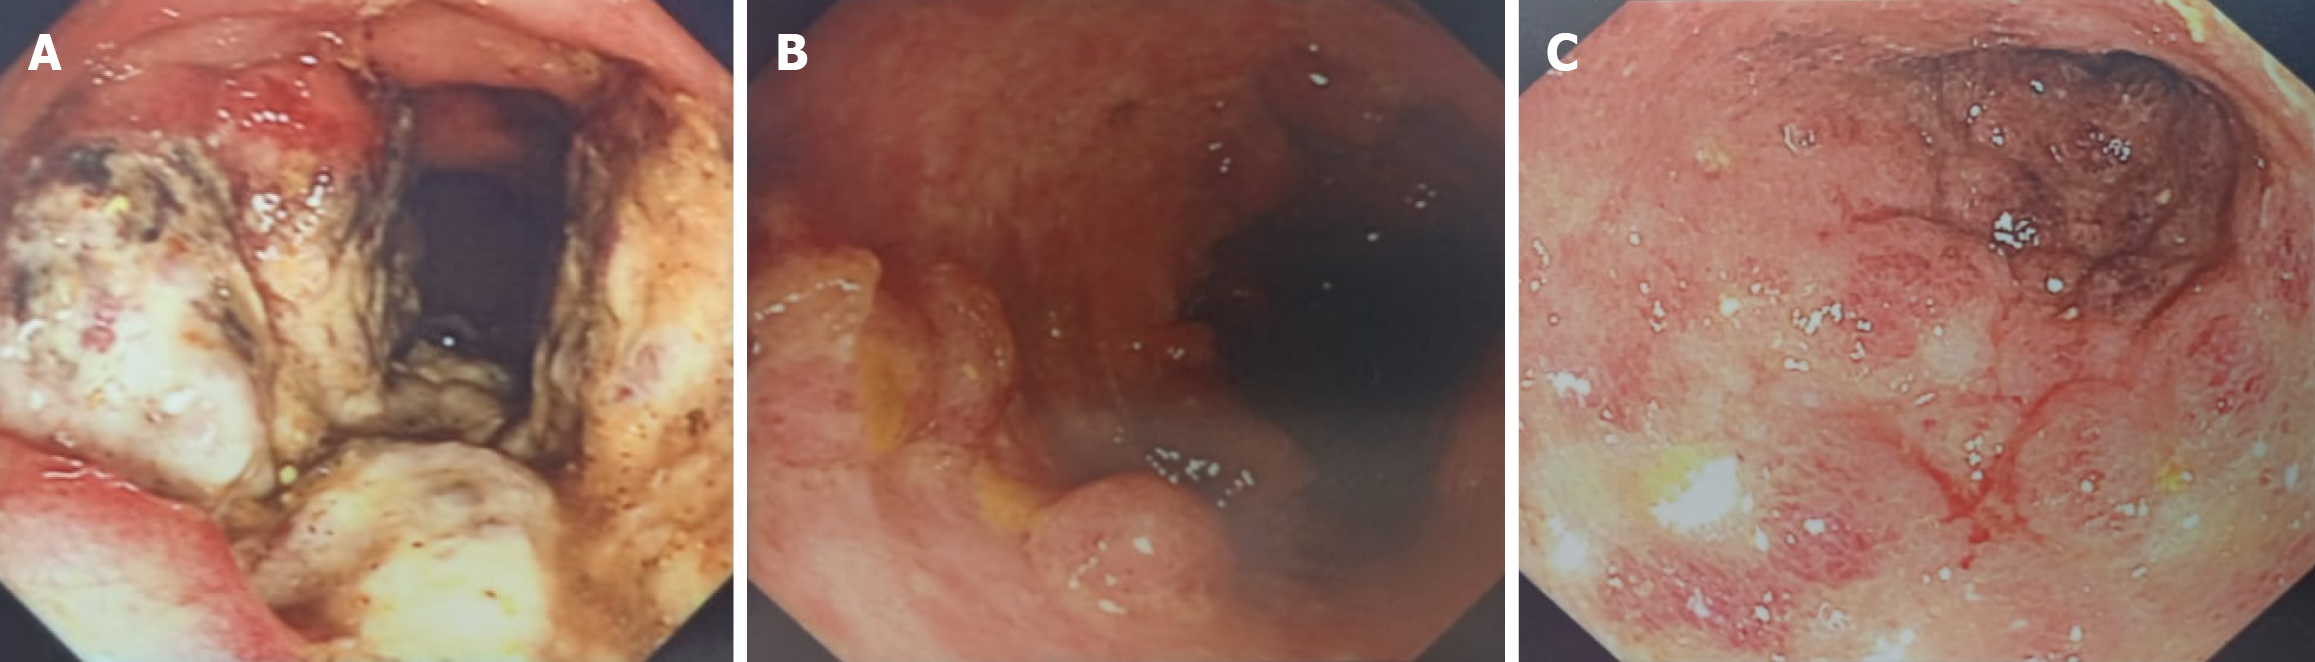
Figure 2 Endoscopic images of complicated ulcerative colitis.
A: Colorectal adenocarcinoma; B and C: High-grade dysplasia.
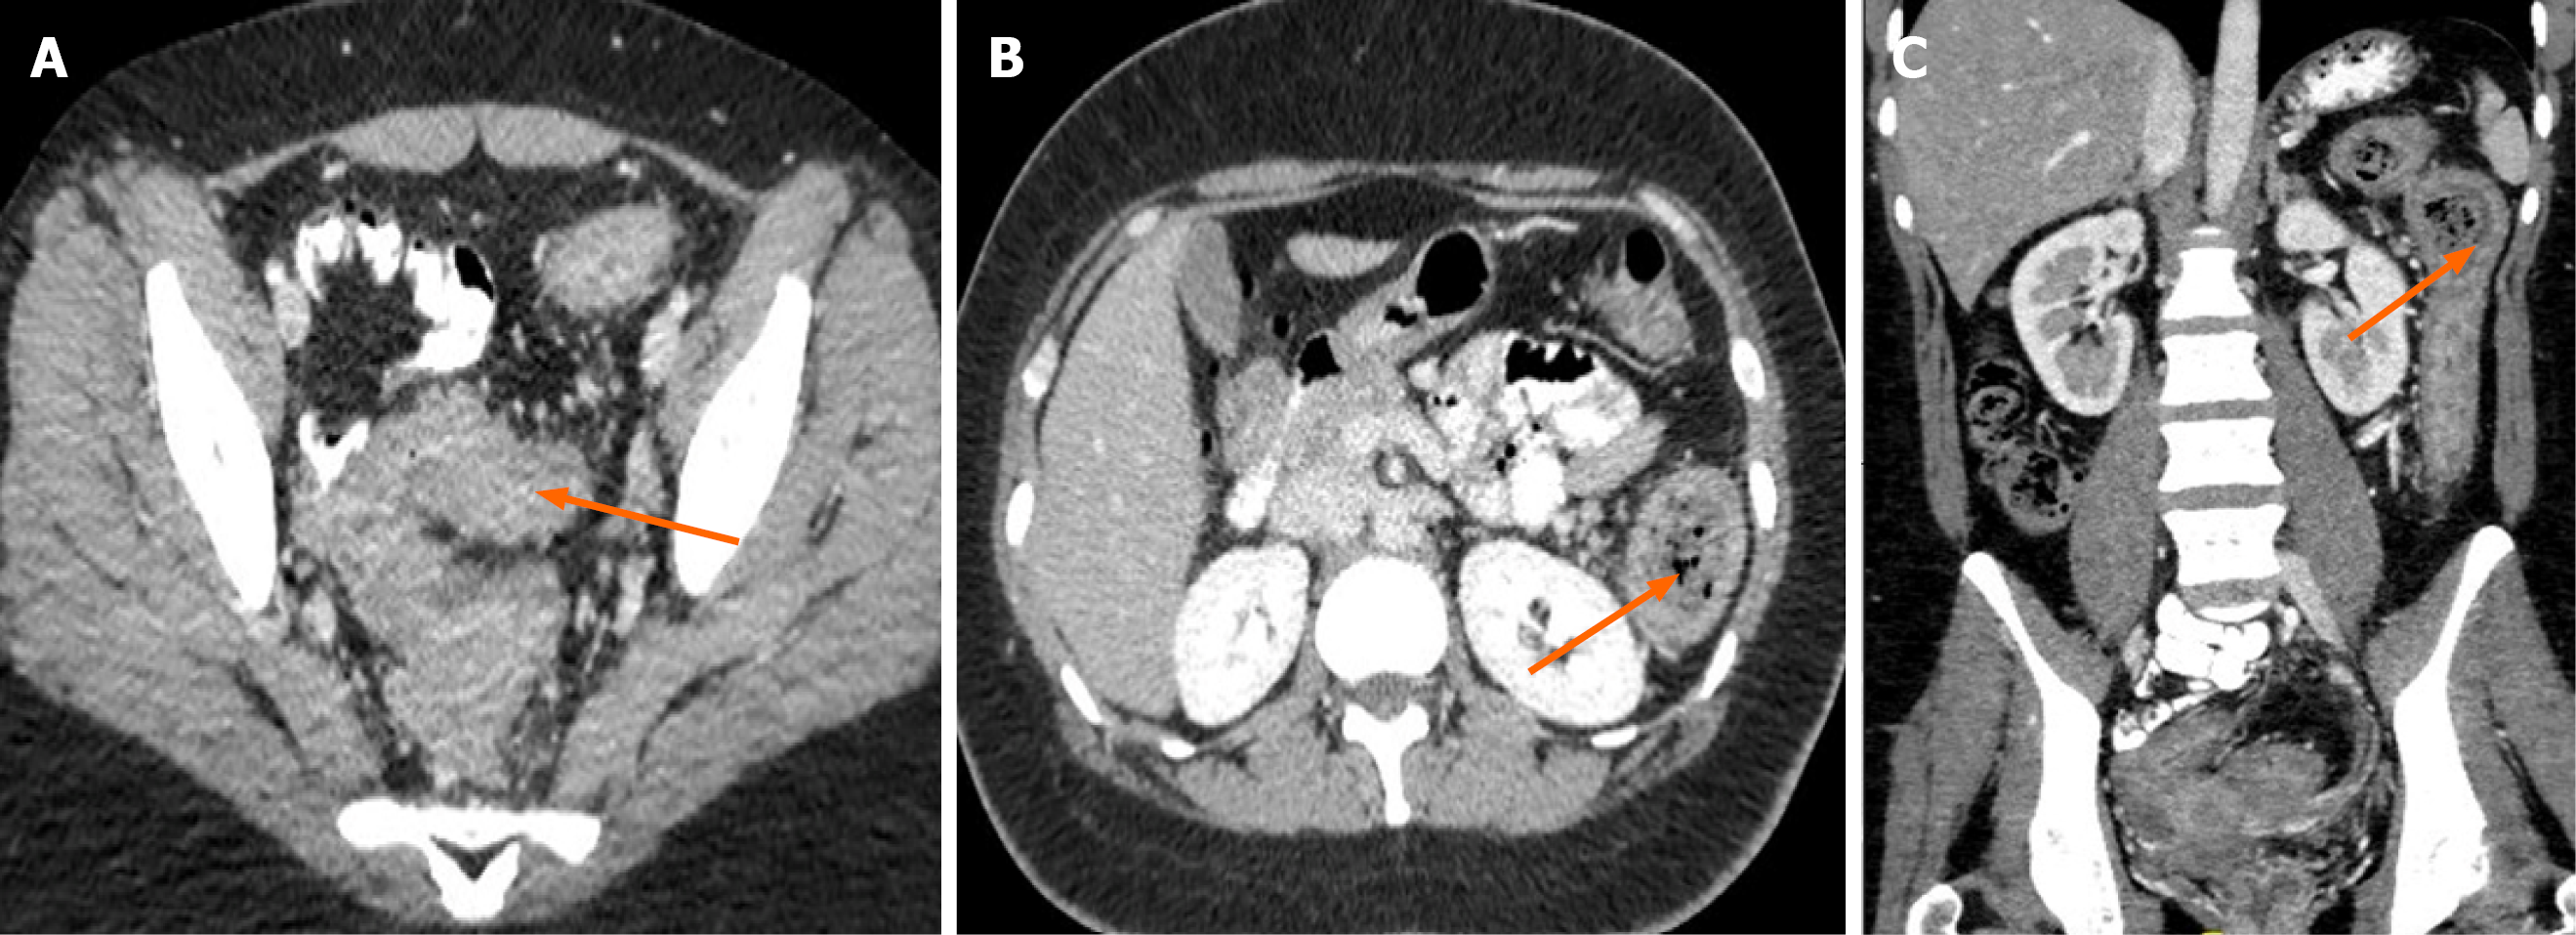
Figure 3 Contrast-enhanced computed tomography abdomen and pelvis in case of active ulcerative colitis.
A: Axial computed tomography (CT) image showed sigmoid colonic segmental wall thickening with mucosal enhancement and submucosal edema; B: Axial CT image showed descending colonic segmental wall thickening with mucosal enhancement and submucosal edema; C: Coronal CT image showed descending colonic segmental wall thickening with hyperemia, prominence of the pericolonic mesenteric vessels (arrow) and pericolic fat stranding is present.
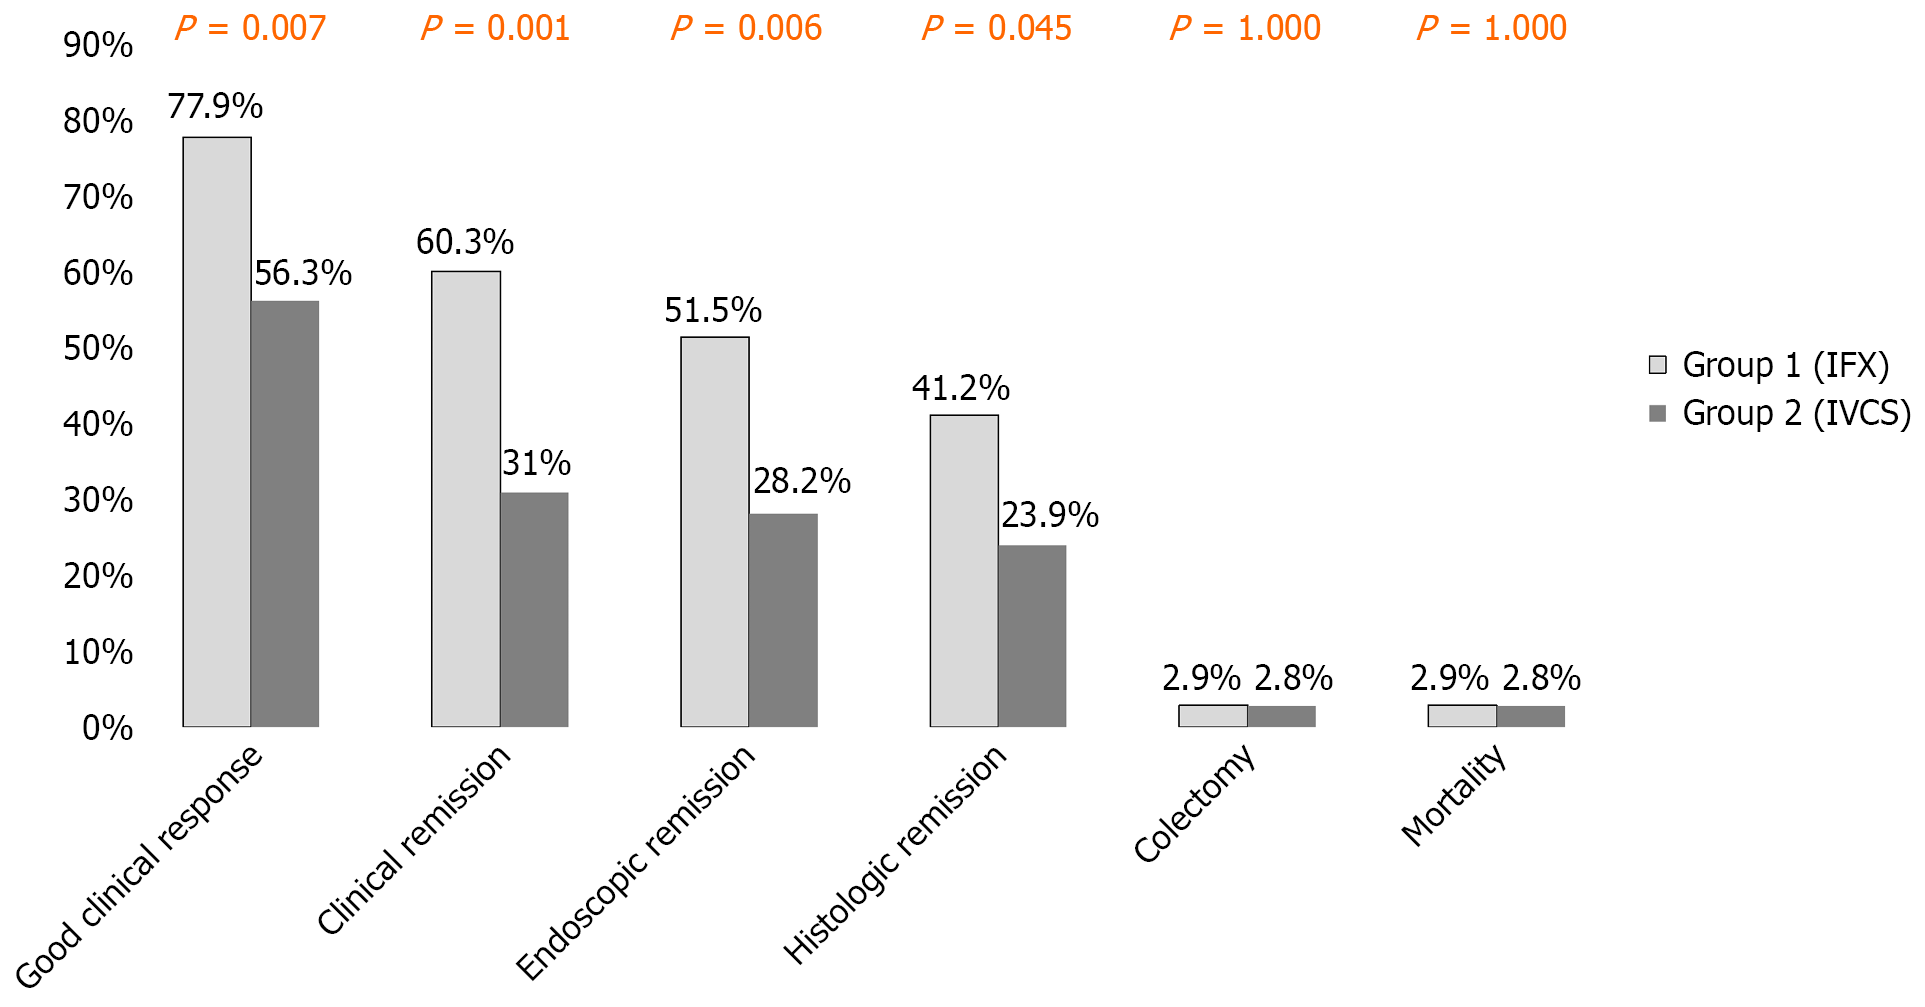
Figure 4 Short-term outcomes in weeks 12 among both groups.
IFX: Infliximab; IVCS: Intravenous corticosteroids.
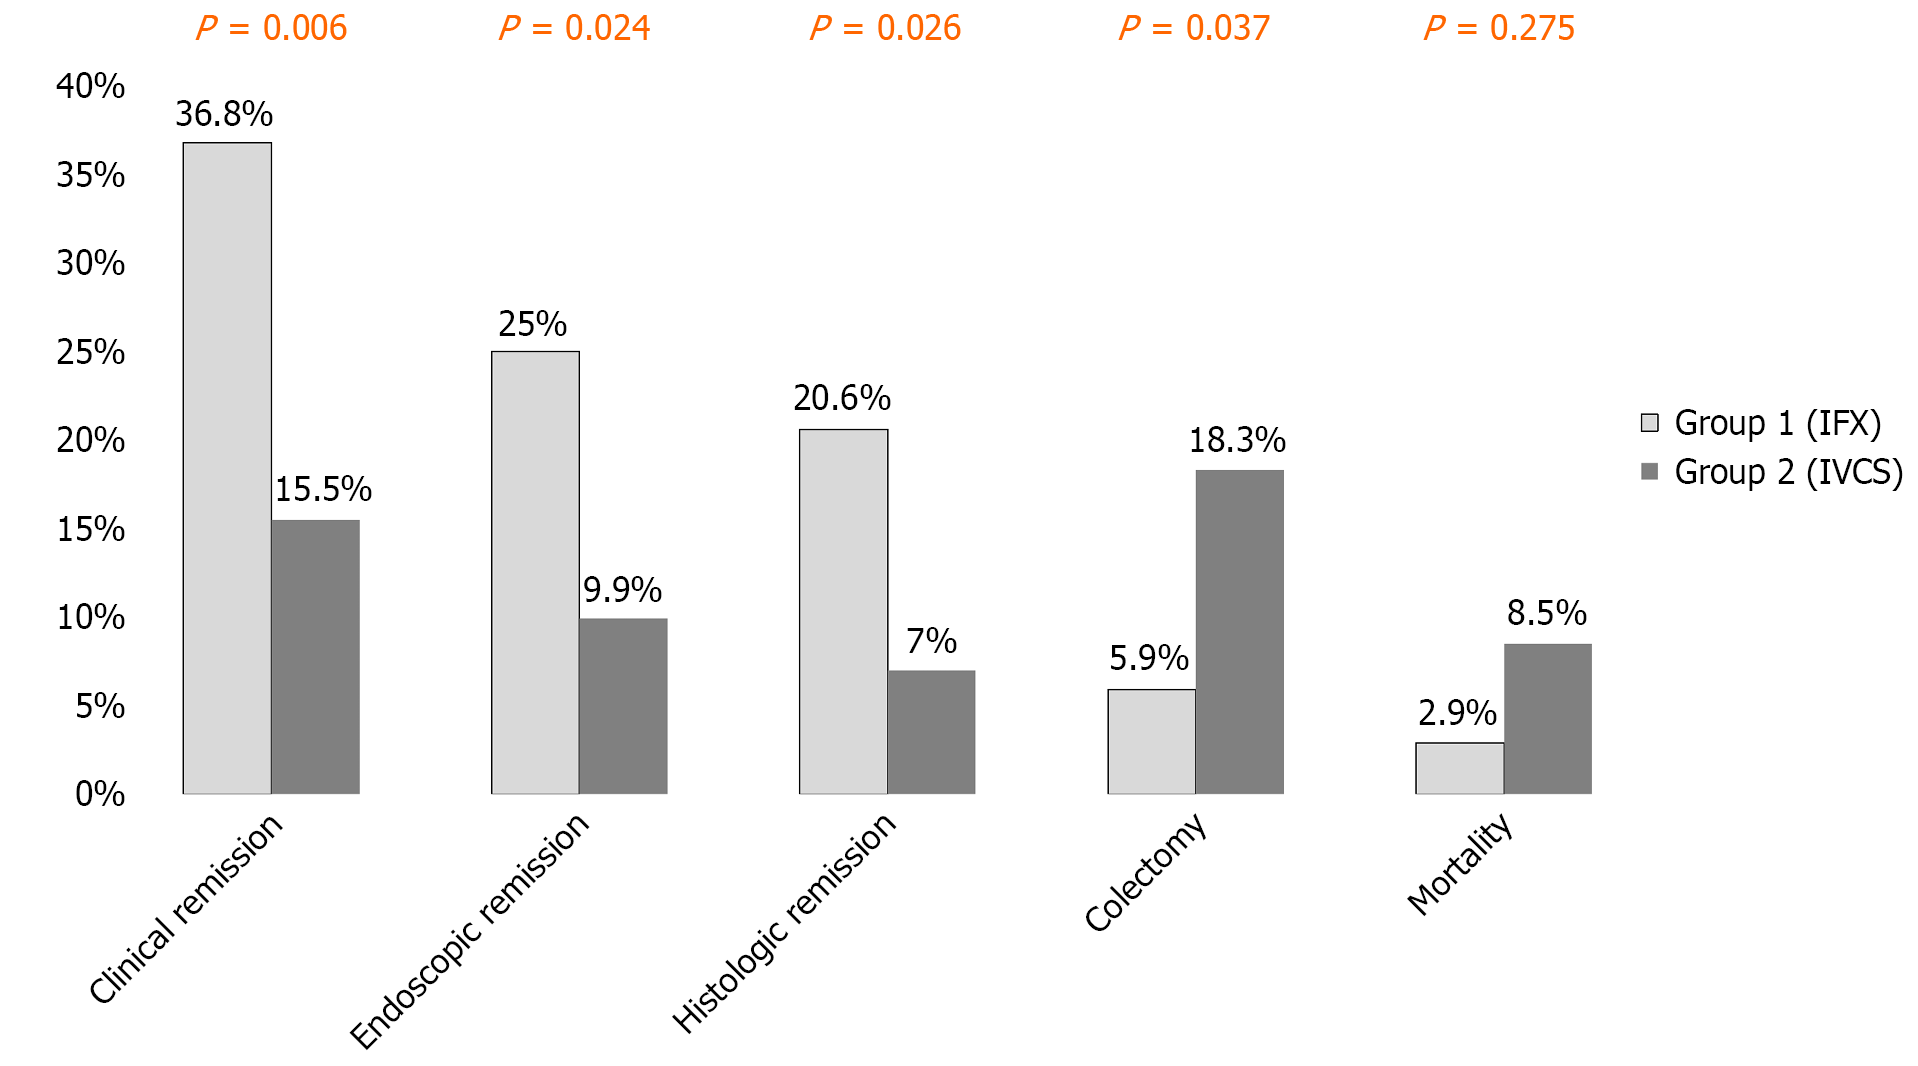
Figure 5 Long-term outcomes at the end of the follow-up period (weeks 144) among both groups.
IFX: Infliximab; IVCS: Intravenous corticosteroids.
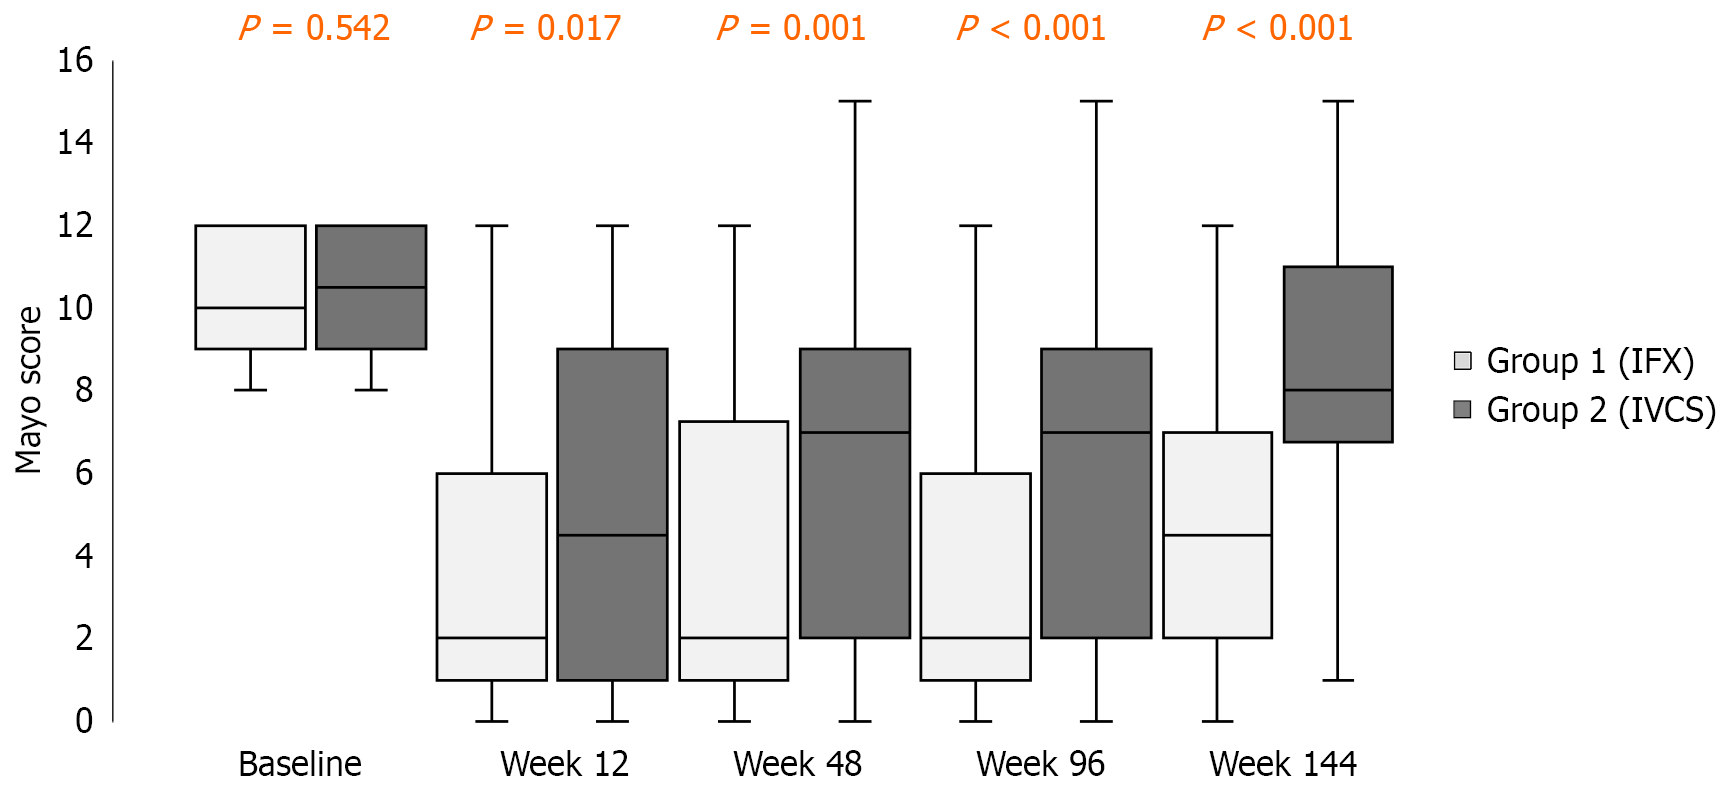
Figure 6 Comparison of Mayo scores between group 1 (infliximab) and group 2 (intravenous corticosteroids) at baseline and during follow-up (weeks 12, 48, 96, and 144).
Horizontal lines indicate the median, and boxes represent the interquartile range. IFX: Infliximab; IVCS: Intravenous corticosteroids.
- Citation: Elsaadany HM, Abd El-Hamid B, Elewesy EA, Mansour MI, Abdelghany WM, Shoukeer MAH, Khalaf M, Eid SM, Almaghraby MT. Long-term comparative effectiveness of first-line infliximab vs corticosteroids in ulcerative colitis: Remission and colectomy risk. World J Gastroenterol 2026; 32(38): 121333
- URL: https://www.wjgnet.com/1007-9327/full/v32/i38/121333.htm
- DOI: https://dx.doi.org/10.3748/wjg.121333