
















Copyright: ©Author(s) 2026.
World J Gastroenterol. Oct 7, 2026; 32(37): 121244
Published online Oct 7, 2026. doi: 10.3748/wjg.121244
Published online Oct 7, 2026. doi: 10.3748/wjg.121244
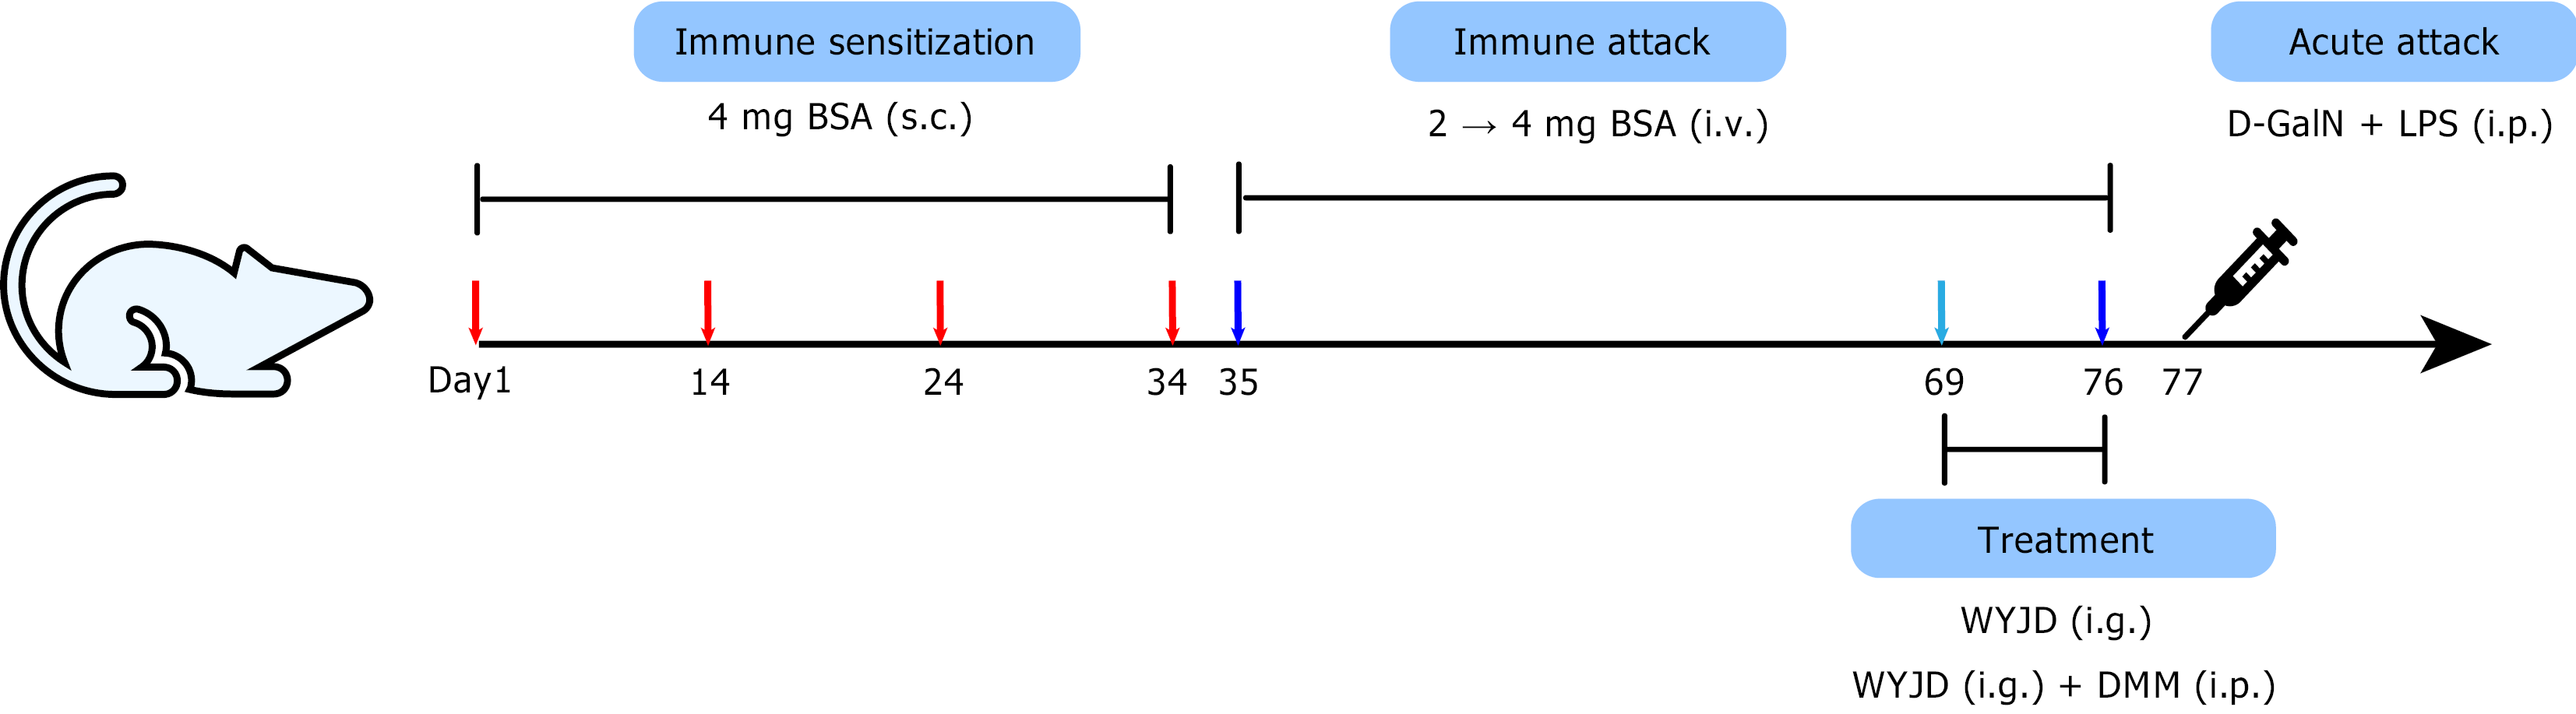
Figure 1 Schematic diagram of the acute-on-chronic liver failure rat model protocol.
BSA: Bovine serum albumin; D-GaIN: D-galactosamine; LPS: Lipopolysaccharide; WYJD: Wenyang Jiedu Huayu Formula; DMM: Dimethyl malonate.
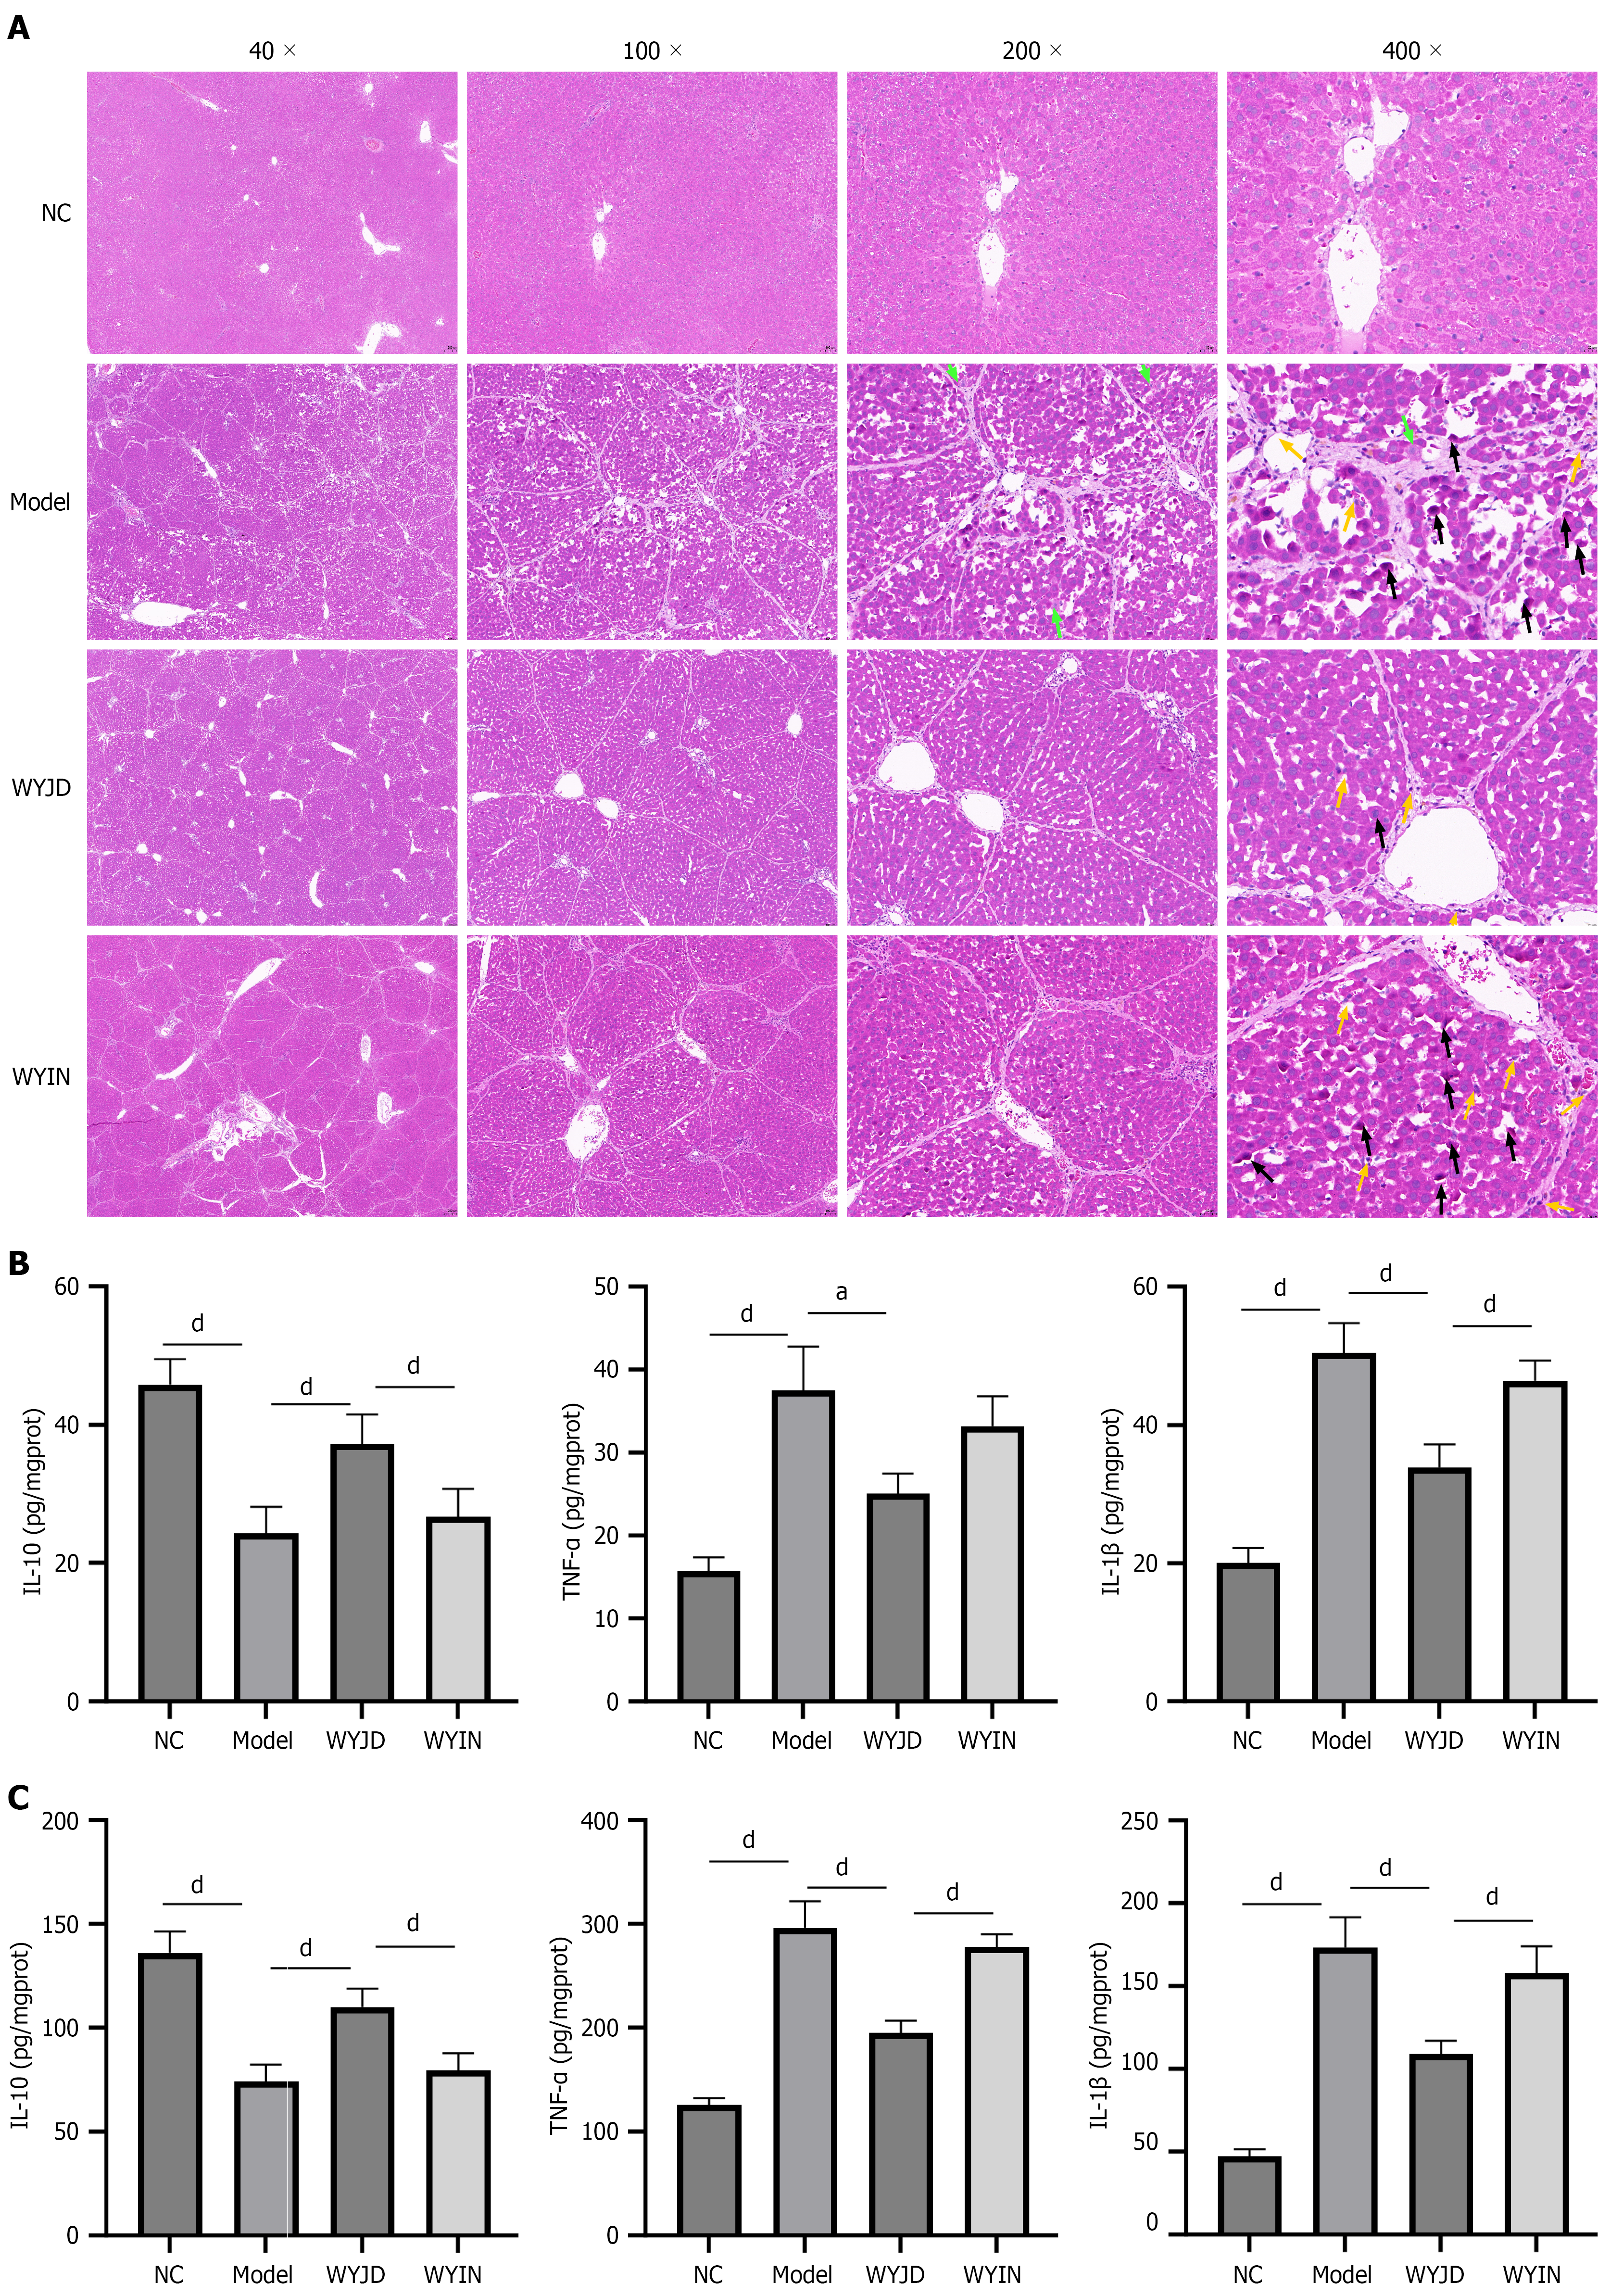
Figure 2 Wenyang Jiedu Huayu Formula ameliorates liver injury and inflammatory response in acute-on-chronic liver failure rats.
A: Representative images of hematoxylin and eosin-stained liver sections from each group. Black arrows indicate hepatocellular necrosis, green arrows indicate ballooning degeneration, and yellow arrows indicate inflammatory cell infiltration. Scale bars: 200 μm (× 40), 100 μm (× 100), 50 μm (× 200), 20 μm (× 400); B: Levels of inflammatory cytokines, including tumor necrosis factor-α, interleukin-1β, and interleukin-10, in liver tissue homogenates measured by ELISA; C: Serum levels of tumor necrosis factor-α, interleukin-1β, and interleukin-10 measured by ELISA. Data are presented as mean ± SD (n = 6 per group). aP < 0.05, dP < 0.0001. NC: Normal control group; WYJD: Wenyang Jiedu Huayu Formula; WYIN: Wenyang Jiedu Huayu Formula plus dimethyl malonate; IL: Interleukin; TNF-α: Tumor necrosis factor-α.
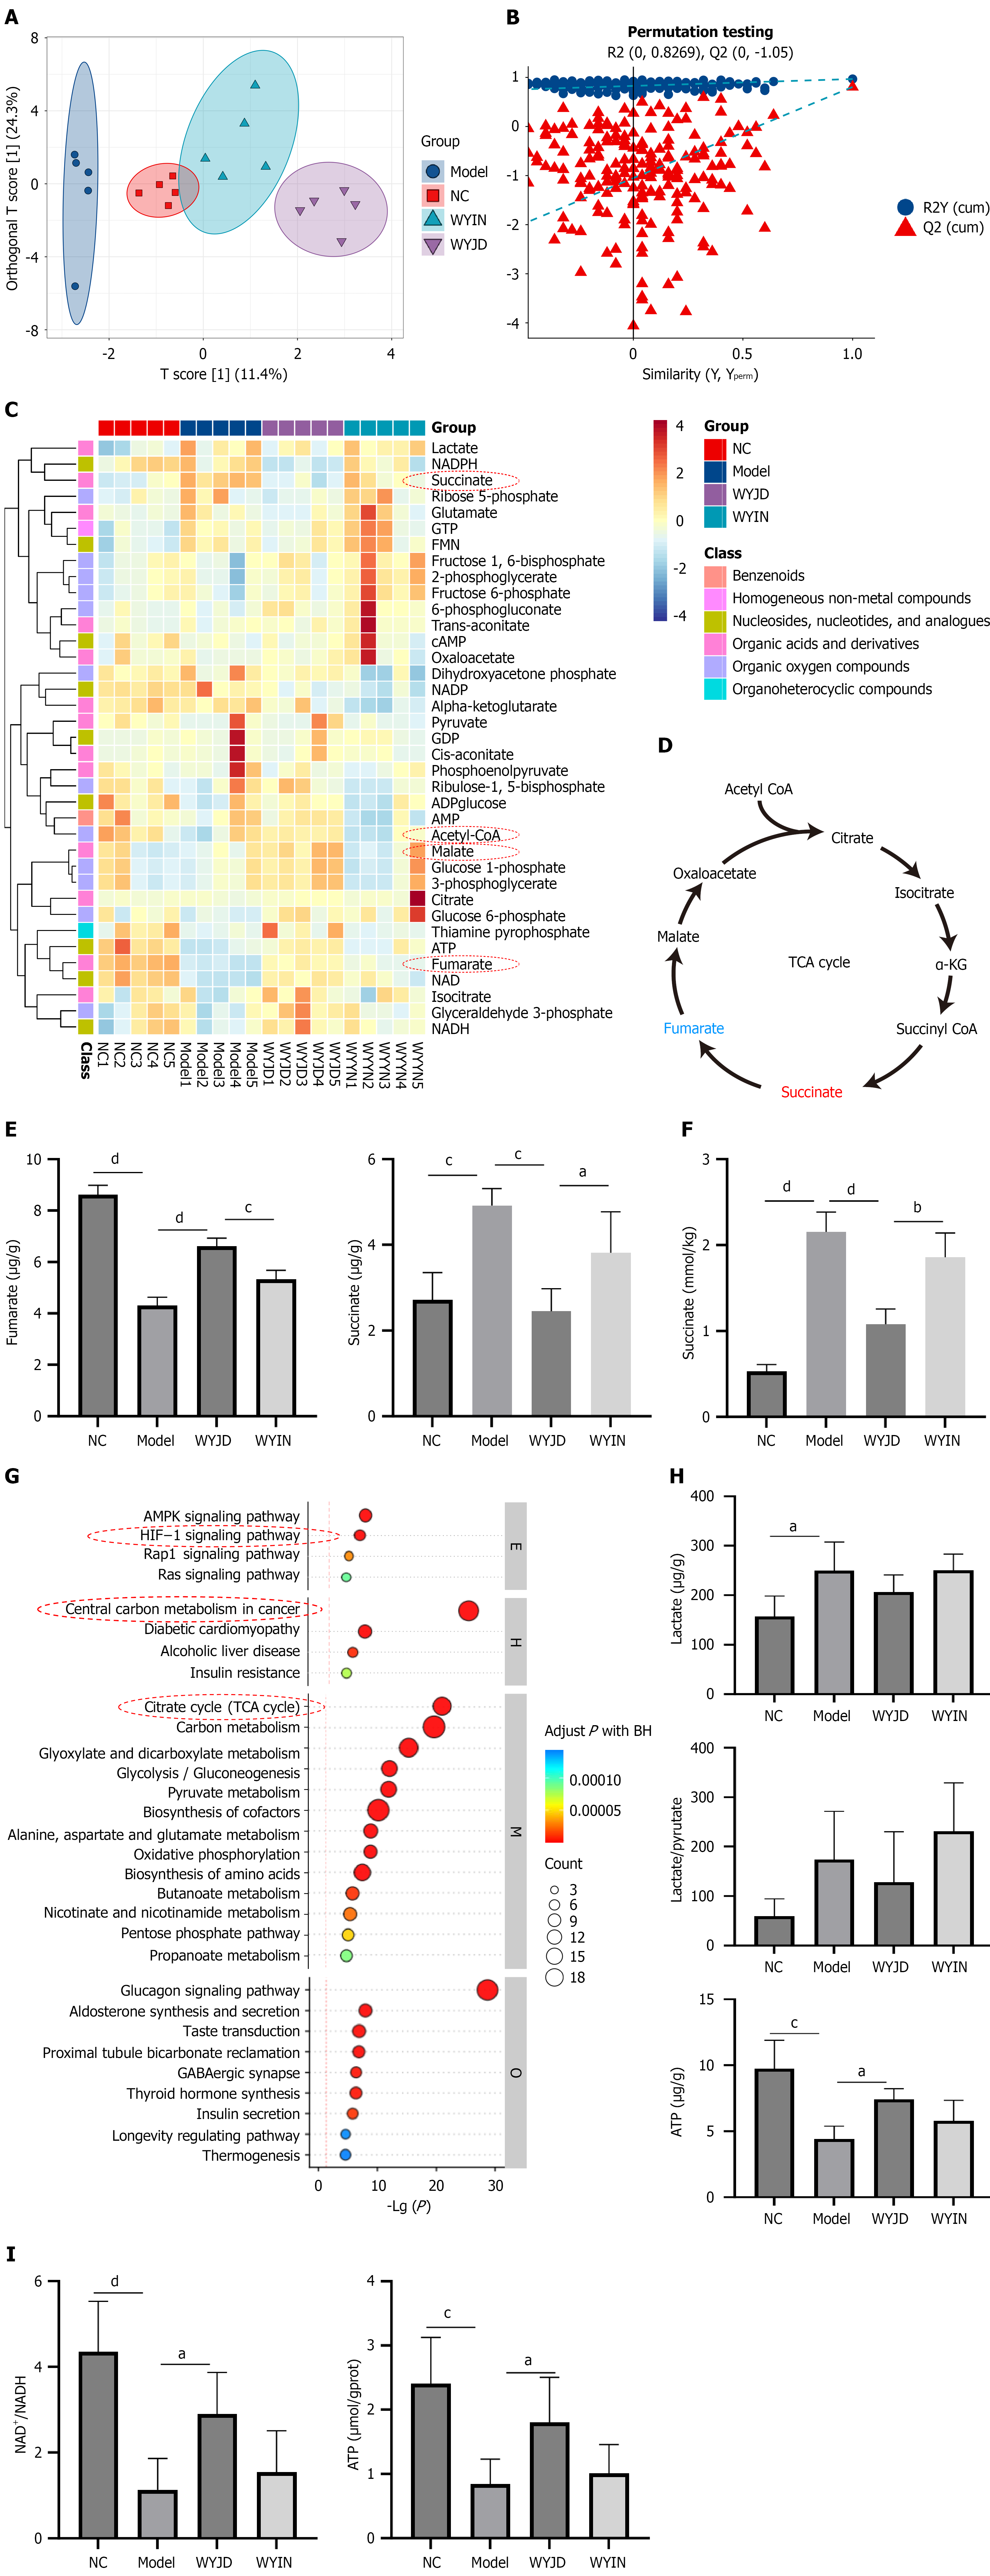
Figure 3 Wenyang Jiedu Huayu Formula reshapes hepatic energy metabolism by modulating succinate metabolism and correcting tricarboxylic acid cycle dysfunction.
A: Orthogonal partial least squares discriminant analysis score plot showing the overall separation pattern of energy metabolic profiles in liver tissues among the four groups; B: Permutation test (200 permutations) validating the robustness of the orthogonal partial least squares discriminant analysis model; C: Heatmap visualization of targeted energy metabolomics analysis in liver tissues from the four groups; D: Schematic diagram of tricarboxylic acid cycle; E: Quantitative analysis of succinate and fumarate levels in liver tissues measured by targeted metabolomics; F: Succinate content in liver tissue homogenates measured by a biochemical colorimetric assay; G: Kyoto Encyclopedia of Genes and Genomes pathway enrichment analysis of differentially expressed metabolites; H: Quantitative analysis of lactate levels, lactate/pyruvate ratio, and ATP content in liver tissues measured by targeted metabolomics; I: ATP levels and NAD+/NADH ratio in liver tissues measured by biochemical assays. Data are presented as mean ± SD (n = 5 per group). aP < 0.05, cP < 0.001, and dP < 0.0001. TCA: Tricarboxylic acid; NC: Normal control group; WYJD: Wenyang Jiedu Huayu Formula; WYIN: Wenyang Jiedu Huayu Formula plus dimethyl malonate.
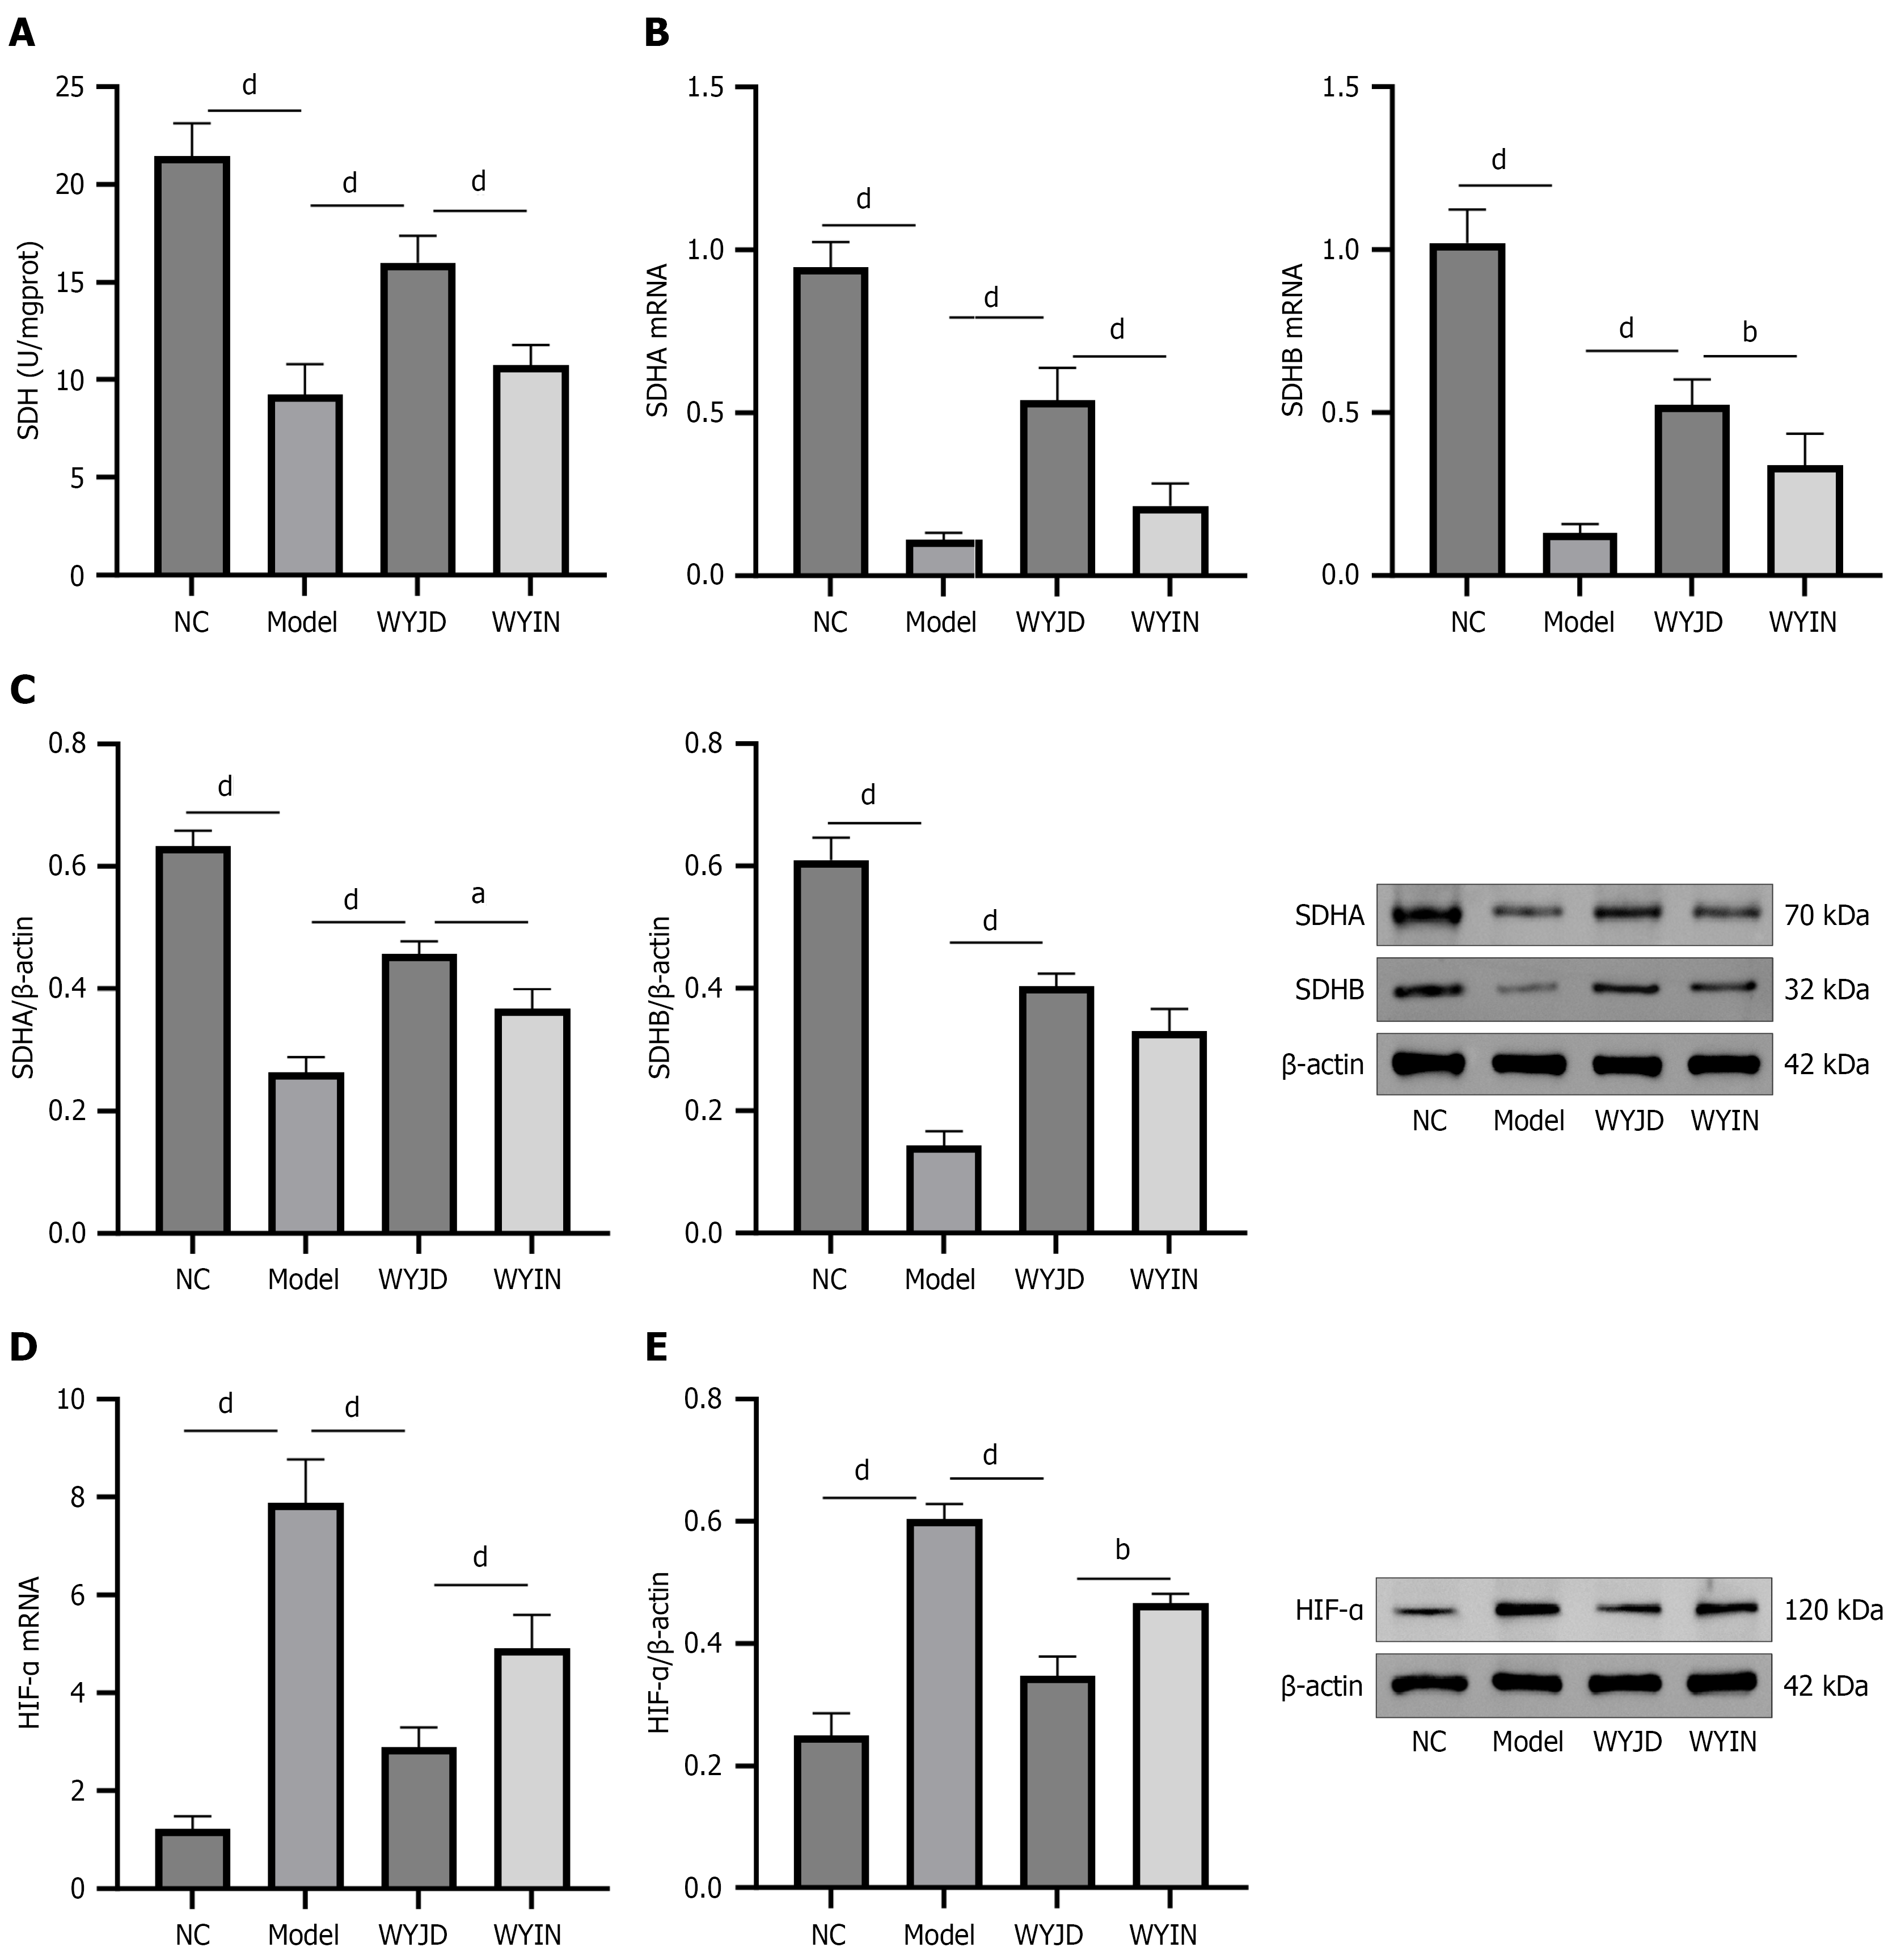
Figure 4 Wenyang Jiedu Huayu Formula upregulates succinate dehydrogenase activity to clear succinate and inhibit hypoxia-inducible factor-1α expression.
A: Succinate dehydrogenase enzyme activity in liver tissues measured by biochemical assay; B: Relative mRNA expression levels of Sdha and Sdhb in liver tissues determined by reverse transcription quantitative polymerase chain reaction; C: Western blot analysis of succinate dehydrogenase A and succinate dehydrogenase B protein expression in liver tissues; D: Relative mRNA expression level of Hif1a in liver tissues determined by reverse transcription quantitative polymerase chain reaction; E: Western blot analysis of hypoxia-inducible factor-1α protein expression in liver tissues. Data are presented as mean ± SD (n = 6 per group). aP < 0.05, bP < 0.01, and dP < 0.0001. NC: Normal control group; WYJD: Wenyang Jiedu Huayu Formula; WYIN: Wenyang Jiedu Huayu Formula plus dimethyl malonate; SDH: Succinate dehydrogenase; HIF-α: Hypoxia-inducible factor-α.
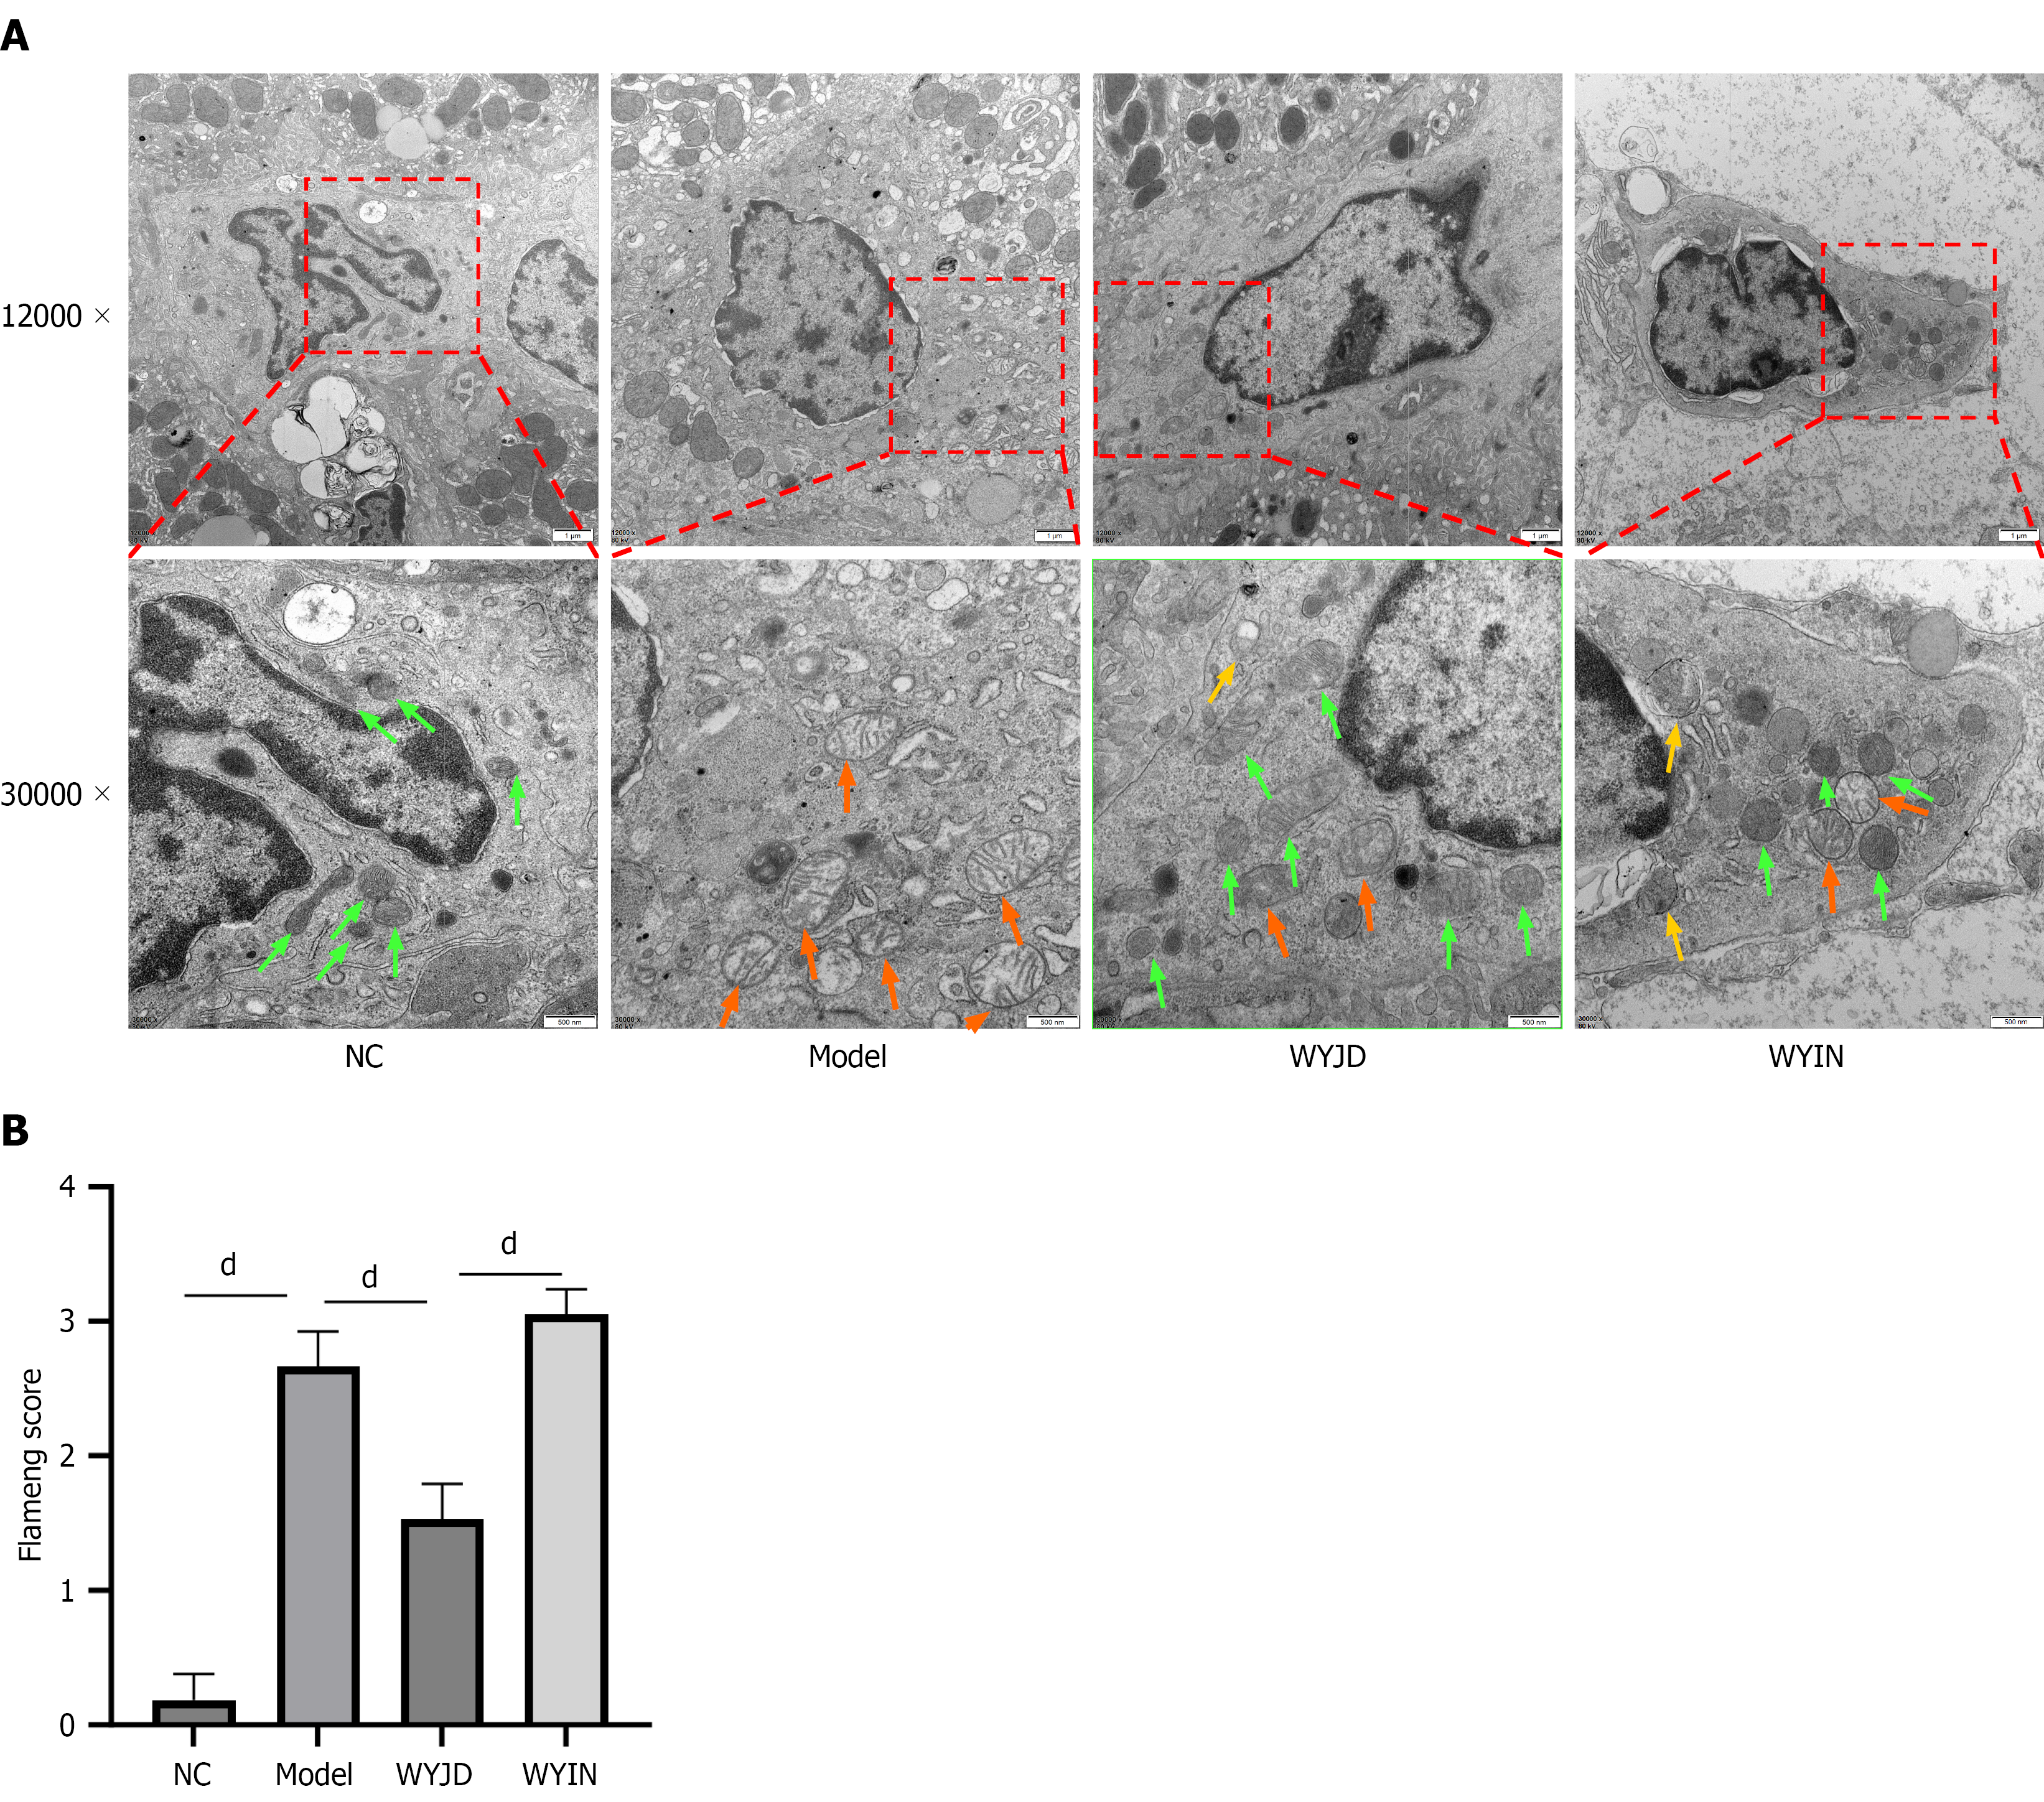
Figure 5 Wenyang Jiedu Huayu Formula improves mitochondrial ultrastructure in acute-on-chronic liver failure rats.
A: Representative transmission electron microscopy images of mitochondria in hepatocytes from each group. Scale bars: 1 μm (× 12000) and 500 nm (× 30000). Green arrows: Normal mitochondria; orange arrows: Damaged mitochondria; yellow arrows: Mitophagic structures; B: Semi-quantitative assessment of mitochondrial damage using the Flameng scoring system. Data are presented as mean ± SD. dP < 0.0001. NC: Normal control group; WYJD: Wenyang Jiedu Huayu Formula; WYIN: Wenyang Jiedu Huayu Formula plus dimethyl malonate.
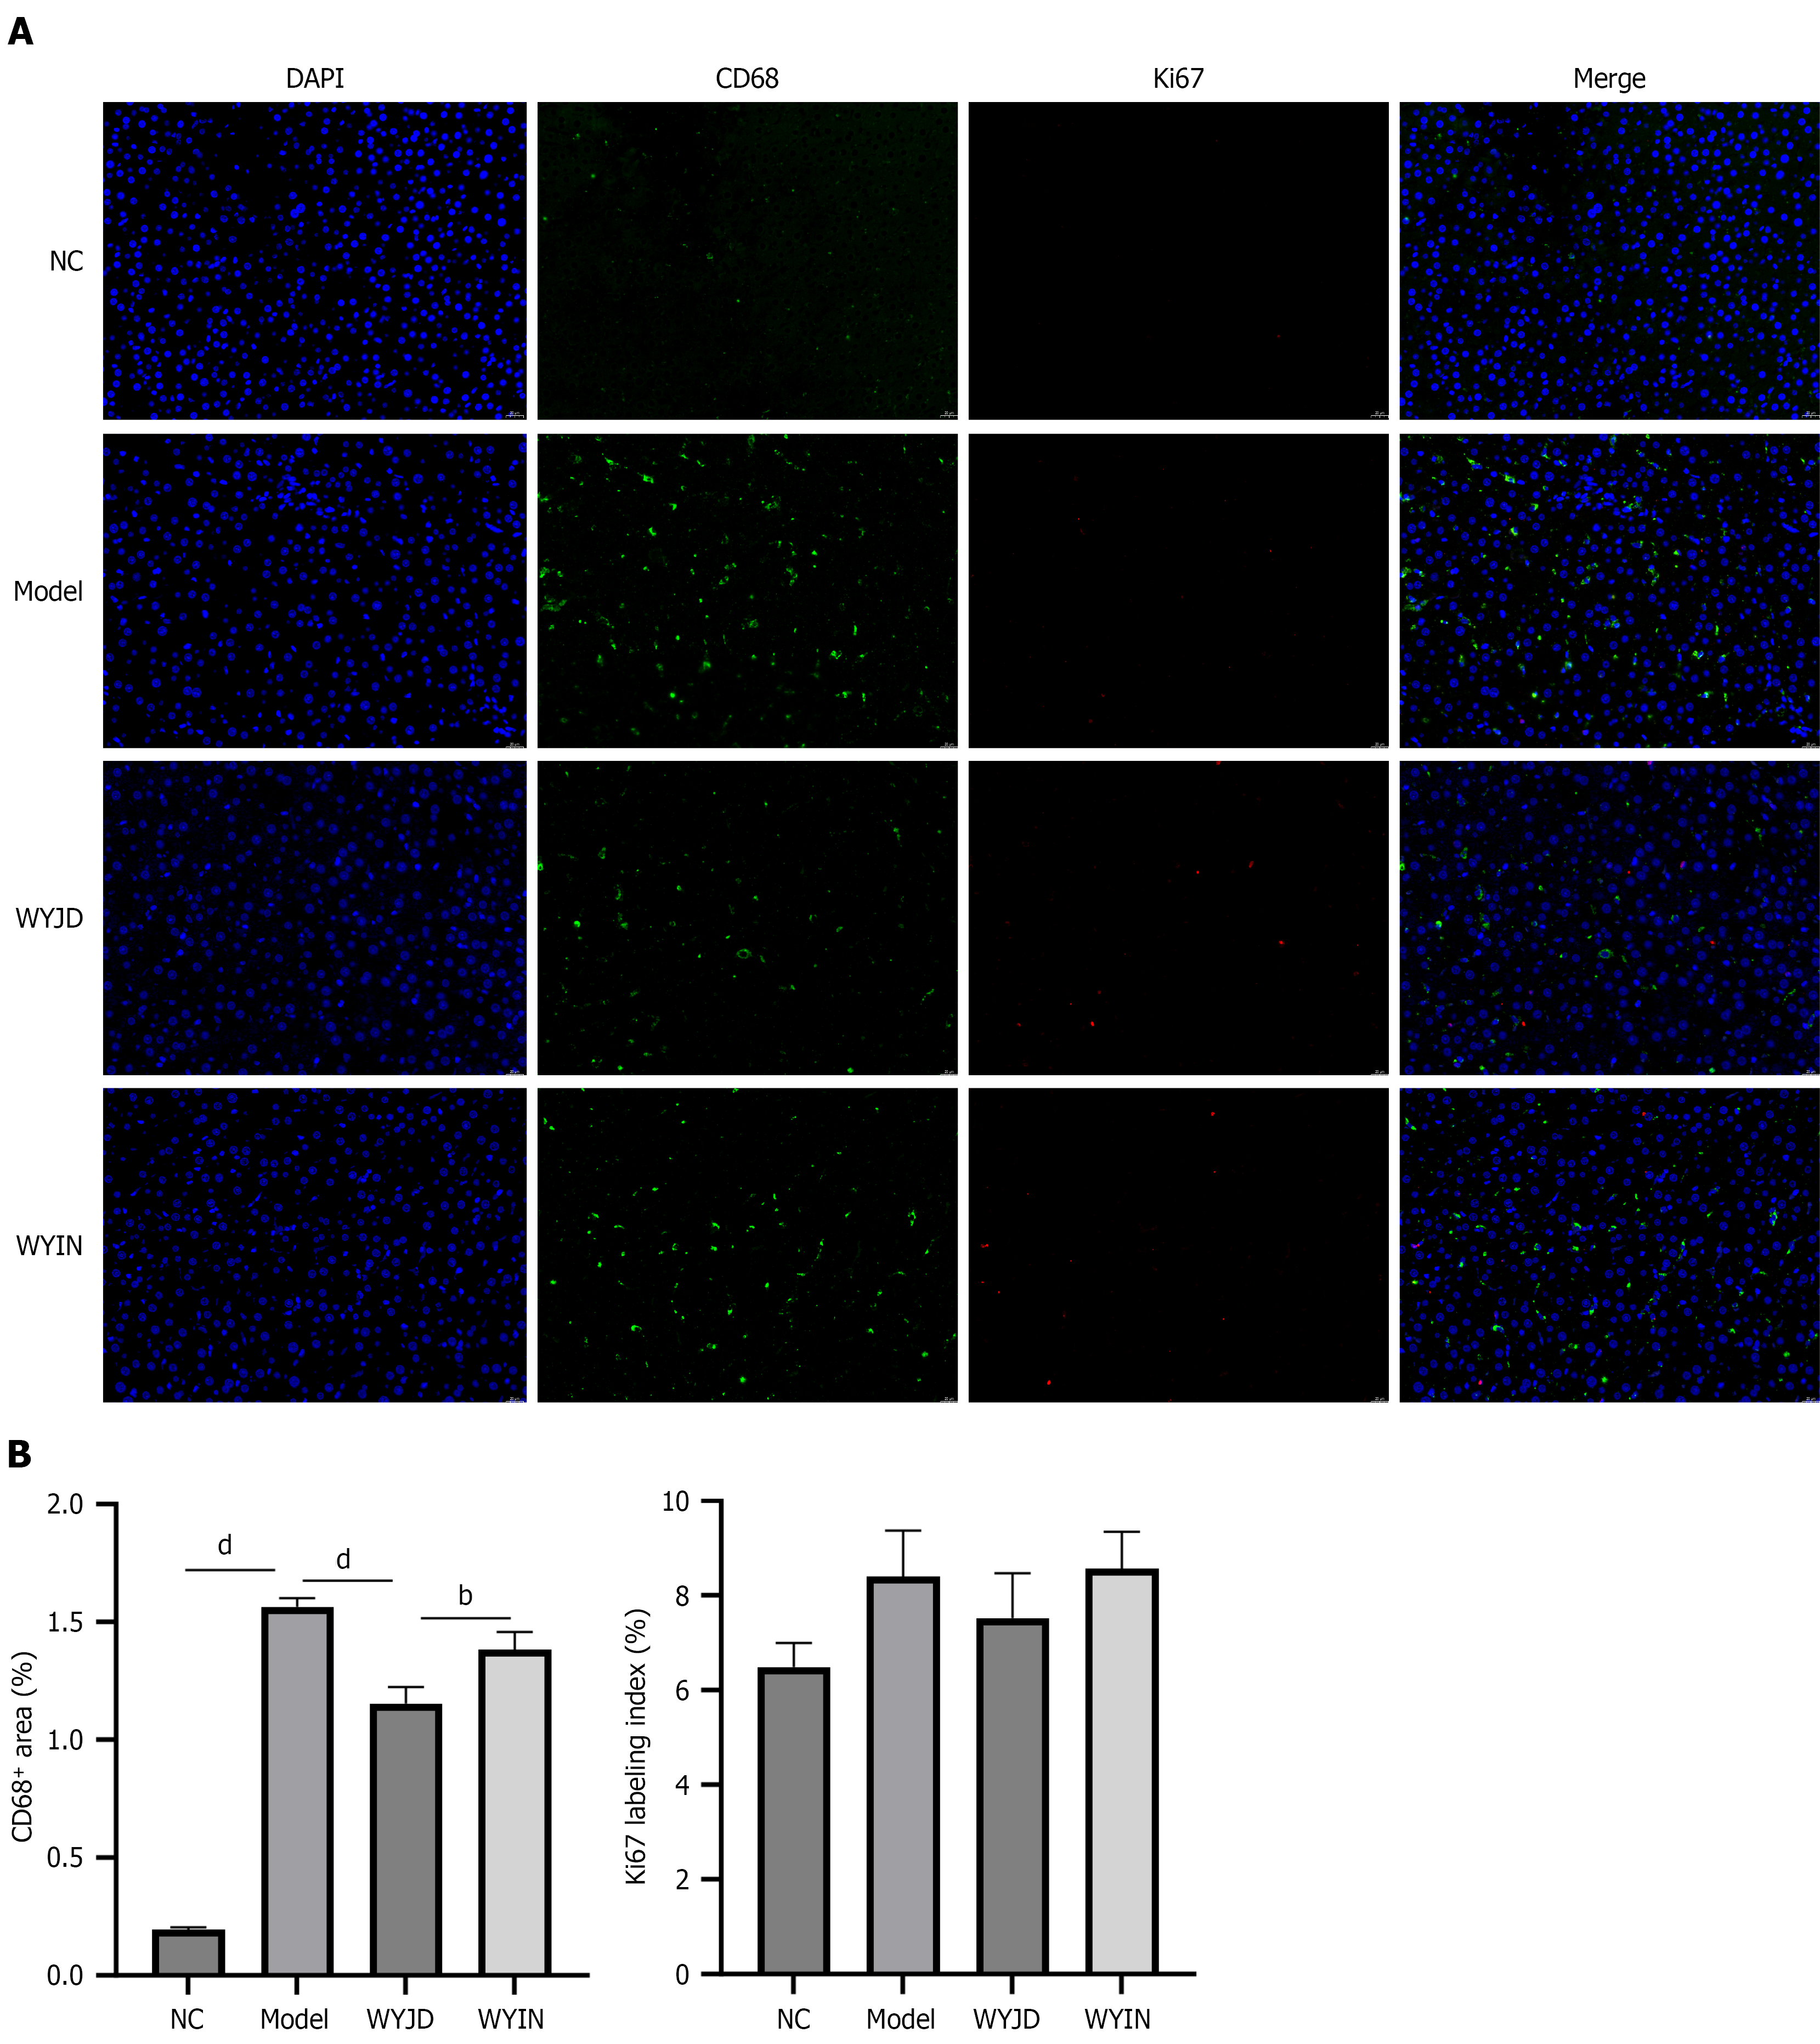
Figure 6 Wenyang Jiedu Huayu Formula inhibits macrophage infiltration in the liver of acute-on-chronic liver failure rats.
A: Representative immunofluorescence images of liver sections from the normal control, Model, Wenyang Jiedu Huayu Formula, and WYIN (Wenyang Jiedu Huayu Formula plus dimethyl malonate) groups stained for CD68 (green) and Ki67 (red). Nuclei were counterstained with DAPI (blue). Scale bar: 20 μm; B: Quantitative analysis of CD68+ area percentage and Ki67 labeling index. CD68+ area was calculated as the percentage of CD68-positive area relative to the total tissue area. The Ki67 labeling index was calculated as (Ki67 nuclei/DAPI total nuclei) × 100%. Data are presented as mean ± SD. bP < 0.01, dP < 0.0001. NC: Normal control group; WYJD: Wenyang Jiedu Huayu Formula; WYIN: Wenyang Jiedu Huayu Formula plus dimethyl malonate.
- Citation: Zhou J, Tian XL, Zhou YF, Zhou ZY, Tan NH, Chen B. Wenyang Jiedu Huayu Formula targets succinate metabolism to alleviate acute-on-chronic liver failure. World J Gastroenterol 2026; 32(37): 121244
- URL: https://www.wjgnet.com/1007-9327/full/v32/i37/121244.htm
- DOI: https://dx.doi.org/10.3748/wjg.121244