
















Copyright: ©Author(s) 2026.
World J Gastroenterol. Sep 14, 2026; 32(34): 119467
Published online Sep 14, 2026. doi: 10.3748/wjg.119467
Published online Sep 14, 2026. doi: 10.3748/wjg.119467
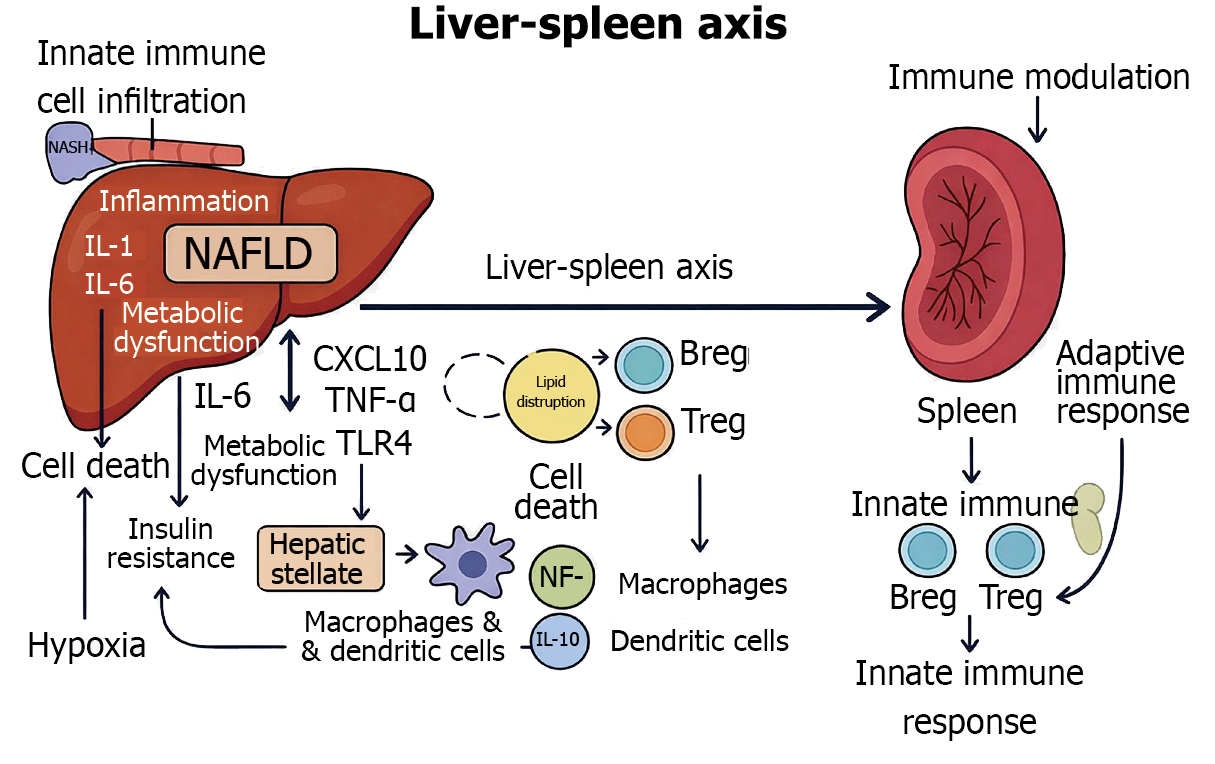
Figure 1 Crosstalk between the spleen and liver.
The liver-spleen axis is governed by a dynamic bidirectional immune-cell trafficking network in which splenic monocytes, natural killer (NK) cells, and lymphocytes are mobilized via sphingosine-1-phosphate (S1P)/S1P receptor 1-driven egress, guided through the portal circulation by C-X-C motif chemokine ligand 9/10 (CXCL9/10) and CXCL12 chemokine gradients, arrested on liver sinusoidal endothelial cells through selectin-P-selectin glycoprotein ligand-1 and intercellular adhesion molecule-1/Lymphocyte function-associated antigen-1 integrin-mediated firm adhesion, and conditioned within the hepatic microenvironment by reciprocal cytokine signals including interleukin (IL-6)/Janus kinase/signal transducer and activator of transcription 3, interferon gamma, transforming growth factor-beta/SMAD, and tumor necrosis factor alpha, while the liver in turn reprograms splenic immune tone through portal delivery of lipopolysaccharides/Toll-like receptor 4 (TLR4) agonists, bile acids, damage-associated molecular patterns-driven NOD-like receptor pyrin domain-containing protein 3/IL-1β, hepatokines such as fibroblast growth factor 21 and hepatocyte growth factor, and extracellular vesicle-encapsulated microRNA cargo, with the entire axis held in homeostatic balance by regulatory checkpoints including programmed cell death protein 1/programmed death-ligand 1 on liver sinusoidal endothelial cells, T-cell immunoglobulin and mucin domain-containing protein 3/galectin-9-mediated NK and T-cell exhaustion, cytotoxic T-lymphocyte associated protein 4/cluster of differentiation 80 (CD80)/CD86 regulatory T cell (Treg) suppression, and indoleamine-driven tryptophan depletion that collectively sustain hepatic immune tolerance. Cellular players: Kupffer cells, hepatic stellate cells, Tregs, regulatory B cells (Bregs), macrophages, and dendritic cells. Immune signaling: Tumor necrosis factor alpha (TNF-α), IL-6, IL-10, CXCL10, nuclear factor kappa B (NF-κB), TLR4; nonalcoholic steatohepatitis (NASH). Pathological progression: From steatosis to NASH, including fibrosis and hypoxia. Metabolic dysfunction: Lipid disruption, insulin resistance, de novo lipogenesis.
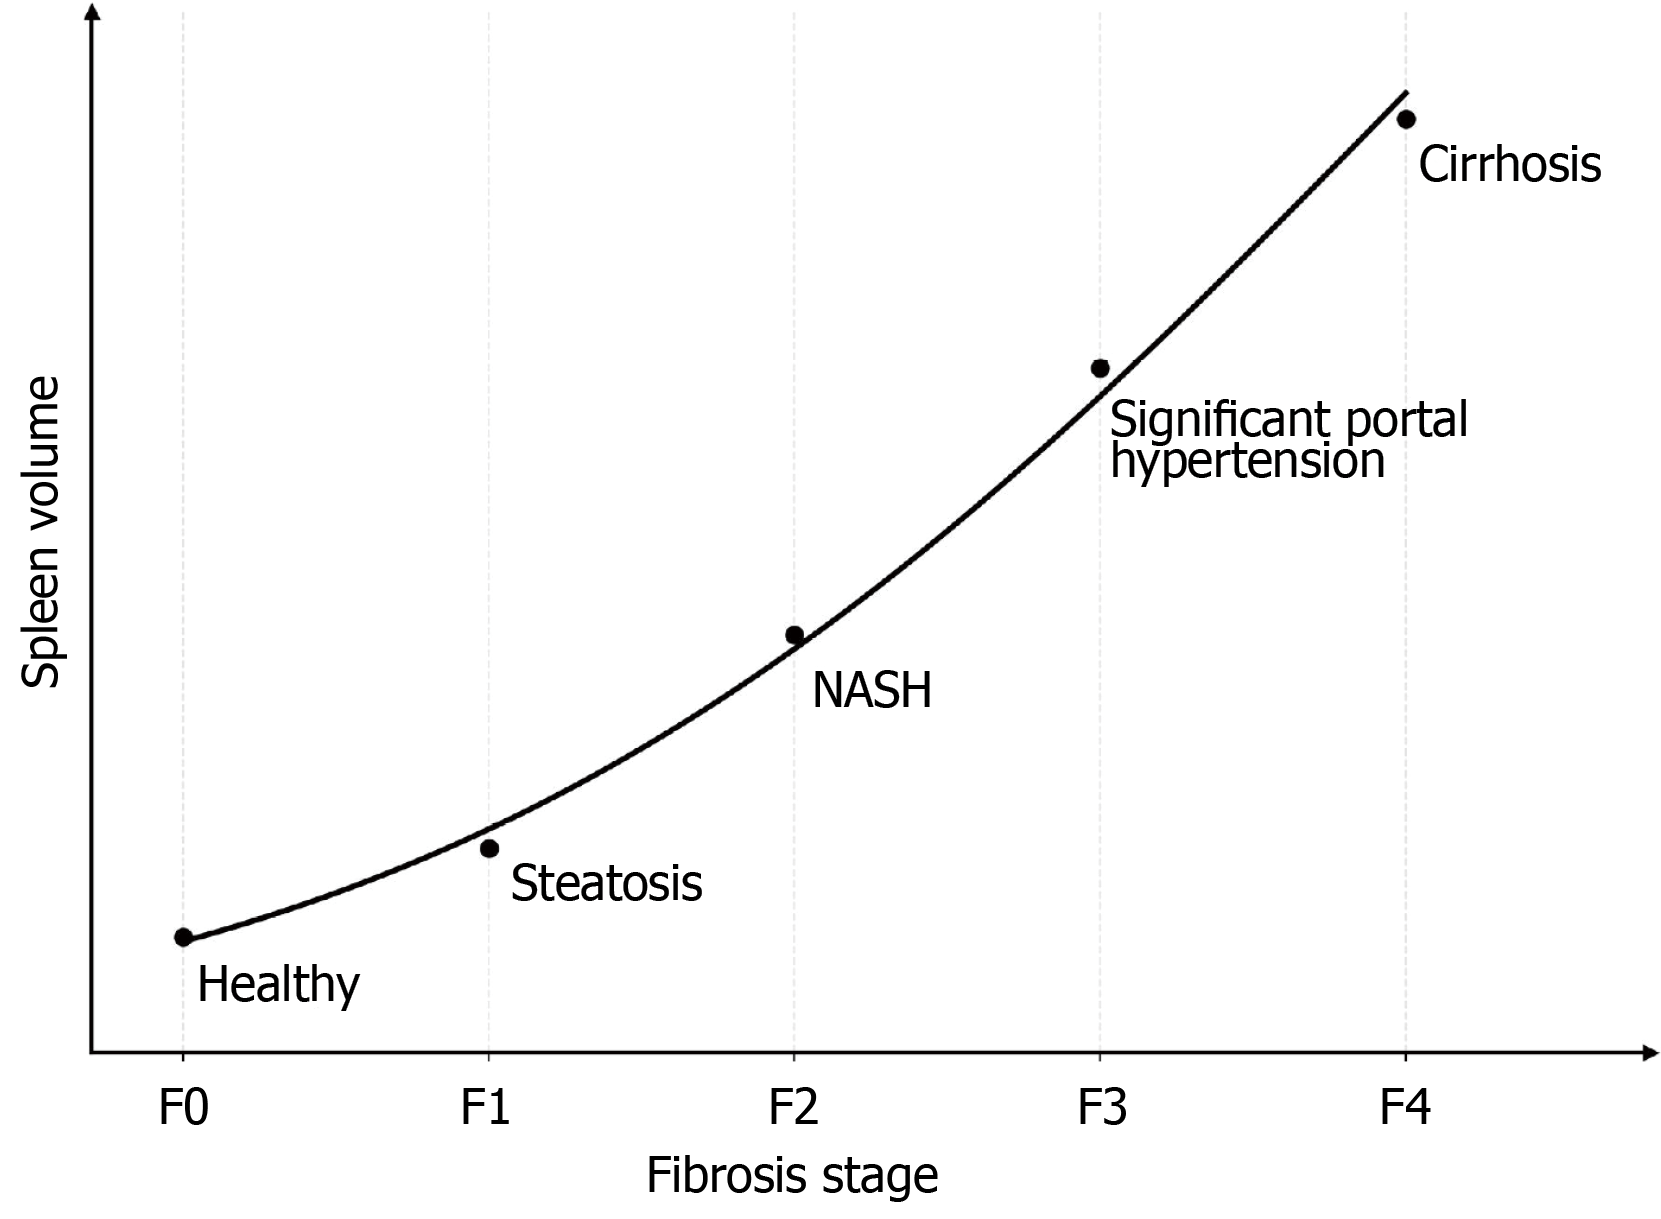
Figure 2 Line graph showing the trend of the spleen volume vs fibrosis in non-alcoholic fatty liver disease.
Splenic volume generally increases in parallel with the progression of liver fibrosis, with the most significant increases often observed in the transition from F3 to F4, although this can be variable due to collateral circulation. NASH: Nonalcoholic steatohepatitis.
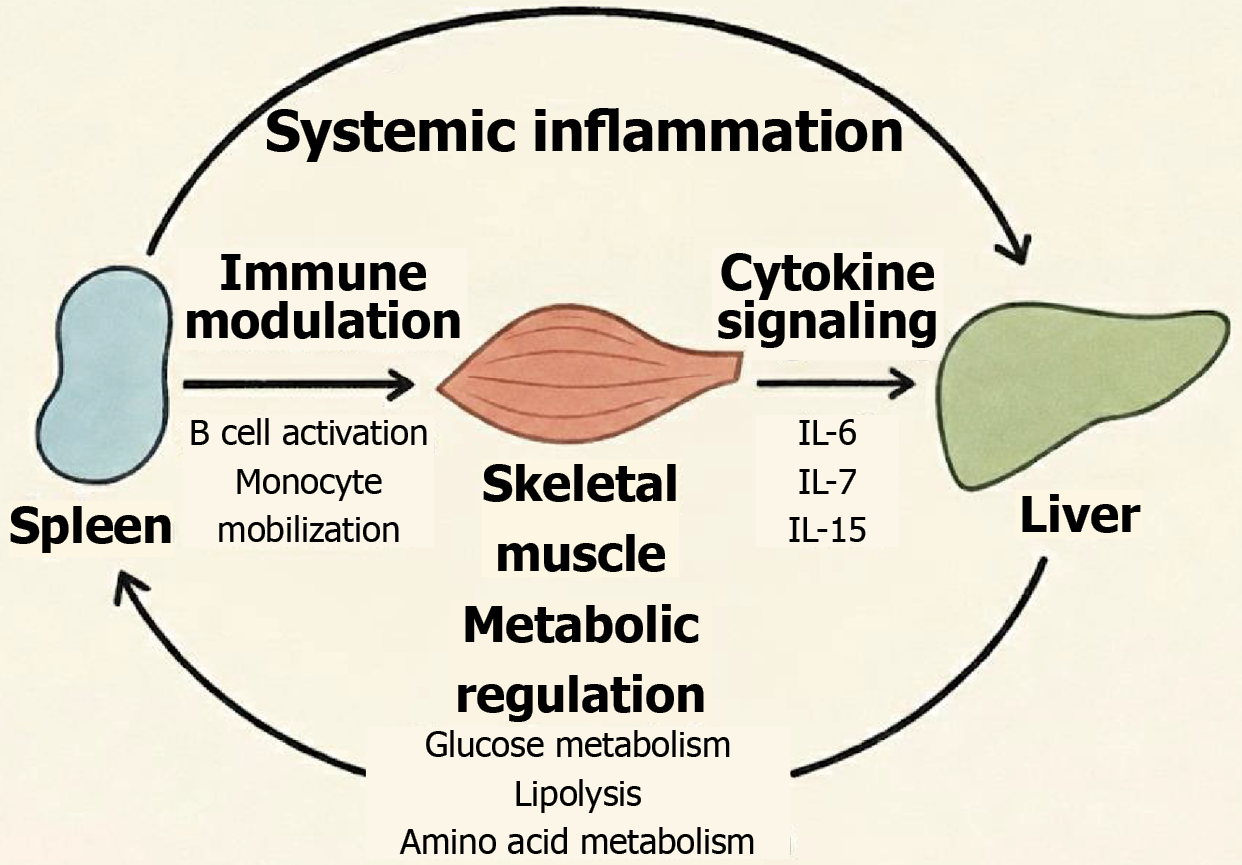
Figure 3 Crosstalk among the muscle, spleen, and liver.
The diagram shows a bidirectional crosstalk among the skeletal muscle, spleen, and liver in the context of metabolic dysfunction and chronic inflammation. Skeletal muscle communicates with the liver through myokines, aminoacid fluxes, and insulin sensitivity pathways, influencing hepatic lipid handling and systemic glucose homeostasis. The spleen contributes immunometabolic signals, including cytokines, monocyte trafficking, and modulation of systemic inflammatory tone that shape hepatic inflammation and fibrogenesis. Reciprocal feedback from the liver, via hepatokines and metabolic intermediates, affects both muscle metabolism and splenic immune activity, highlighting a dynamic tri-organ network central to metabolic disease progression[89-91].
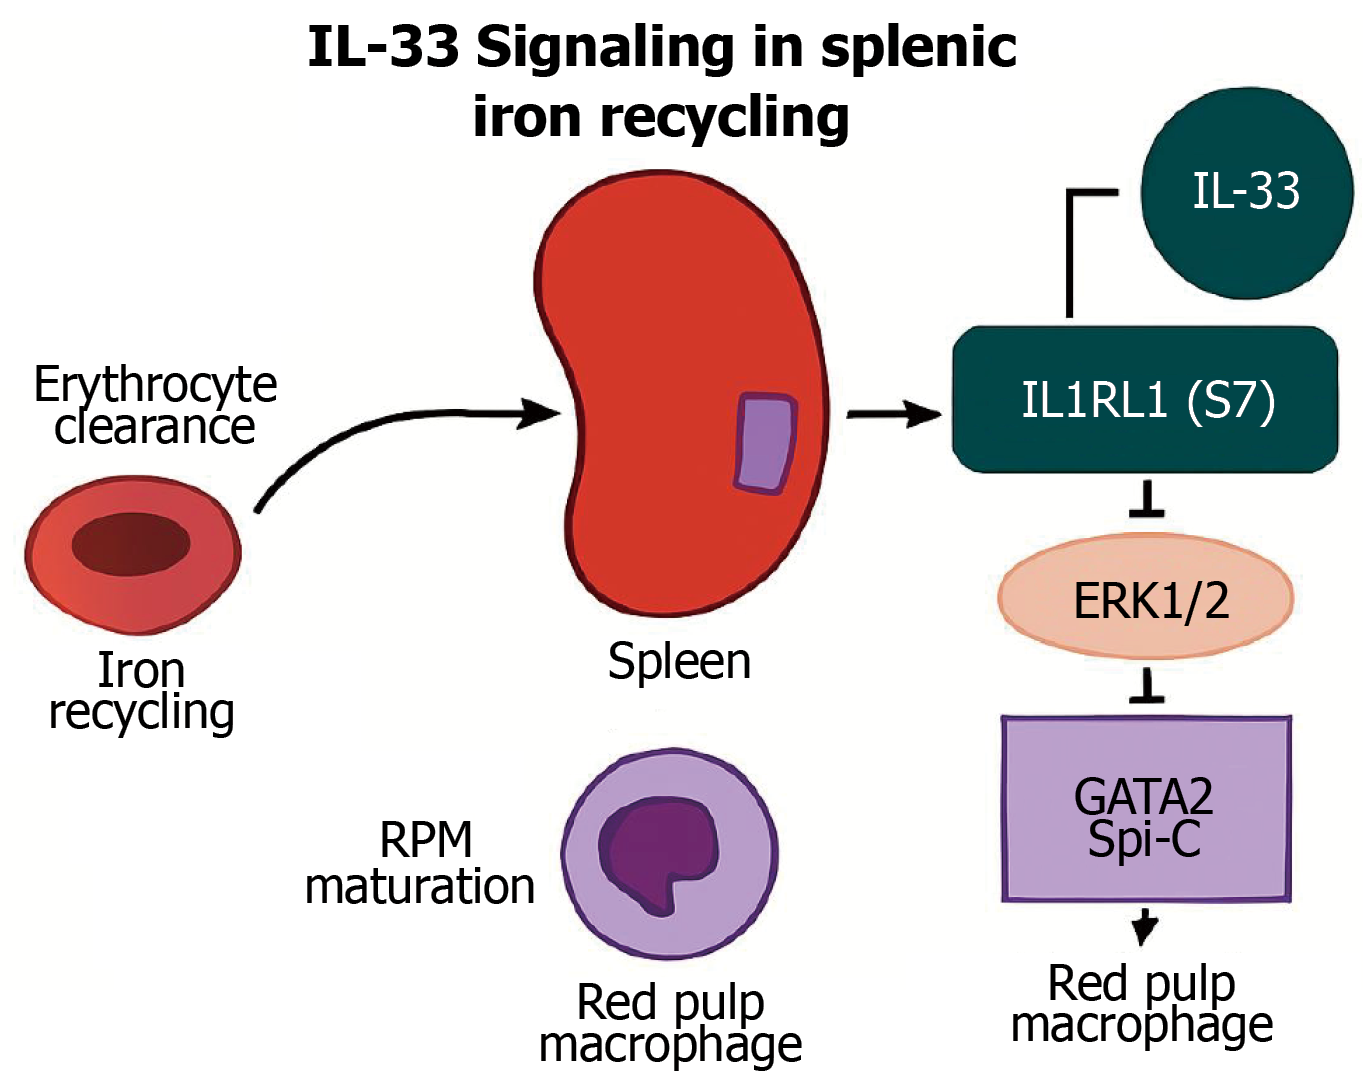
Figure 4 Interleukin 33 signaling in the spleen.
Diagram illustrates interleukin 33 (IL-33) signaling in splenic iron recycling, highlighting its role in red pulp macrophage maturation and erythrocyte clearance via the IL-1 receptor-like 1 (IL1RL1)-suppression of tumorigenicity 2 receptor pathway and downstream transcription factors GATA-binding factor 2 (GATA2) and Spi-C. RPM: Rat promegakaryoblast-like.
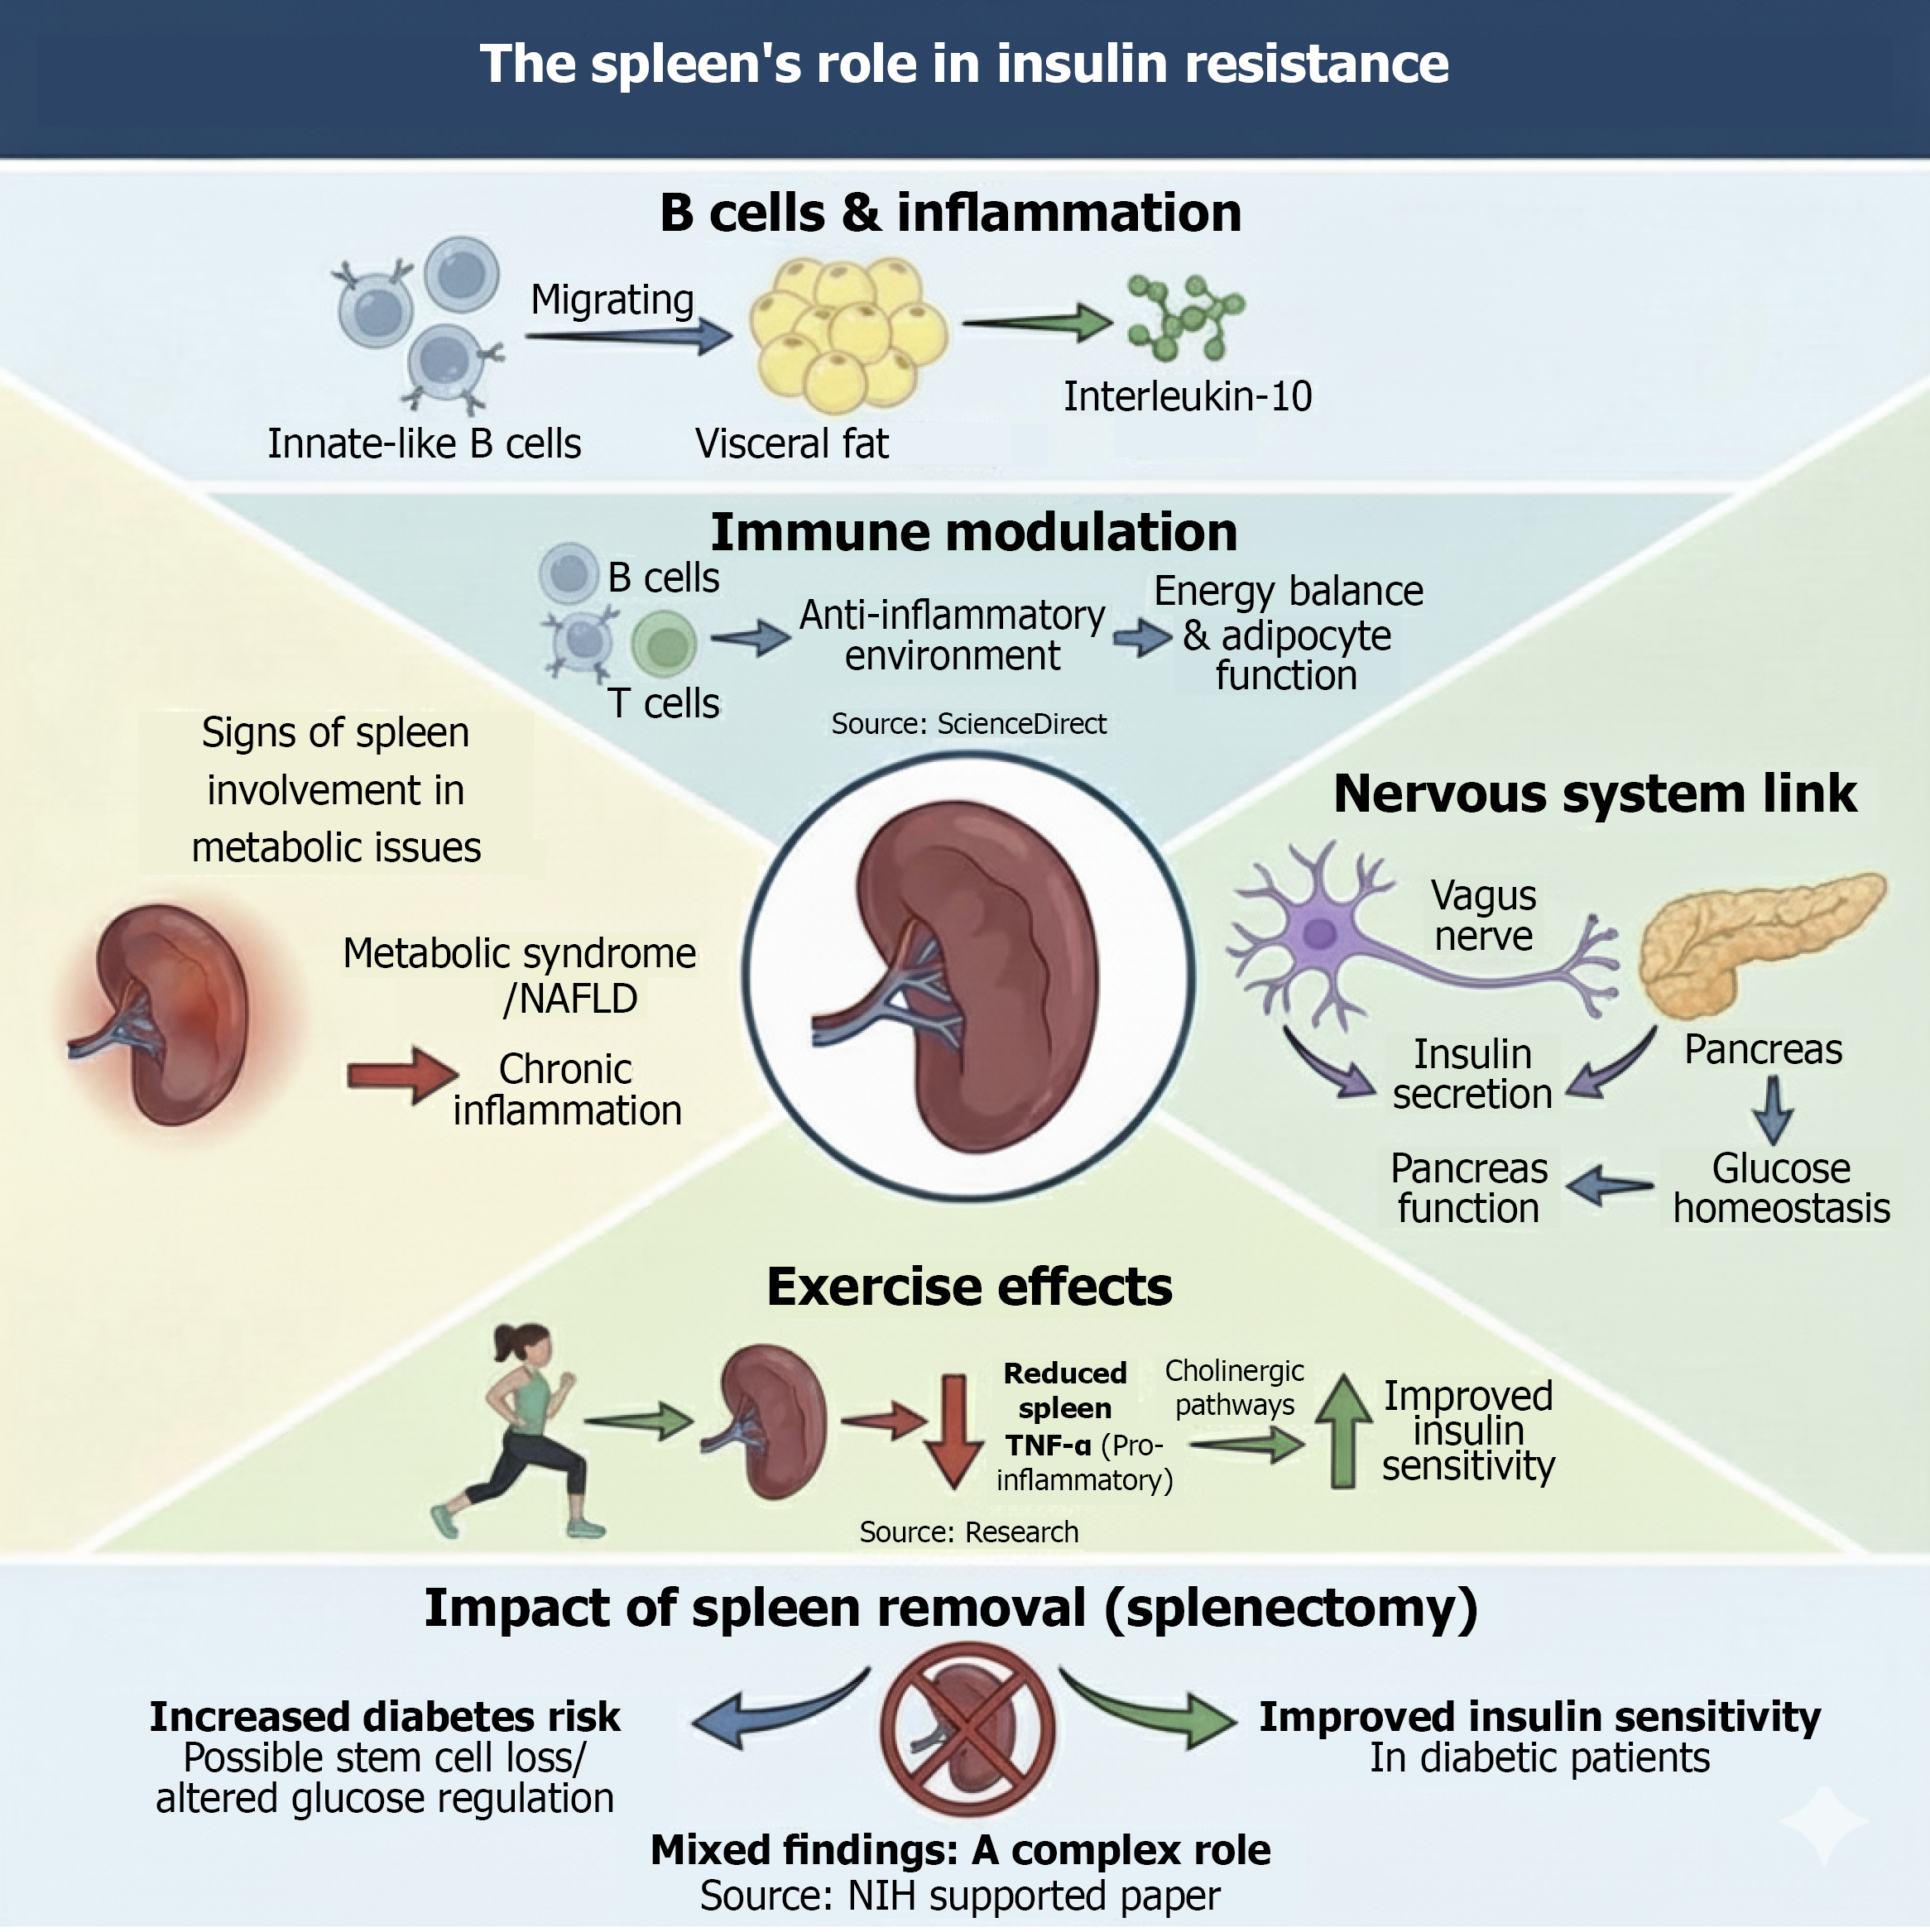
Figure 5 Mechanisms of spleen-mediated insulin resistance regulation.
This schematic illustrates six interconnected pathways through which the spleen modulates systemic inflammation and metabolic homeostasis[35]. NAFLD: Non-alcoholic fatty liver disease; TNF-α: Tumor necrosis factor alpha.
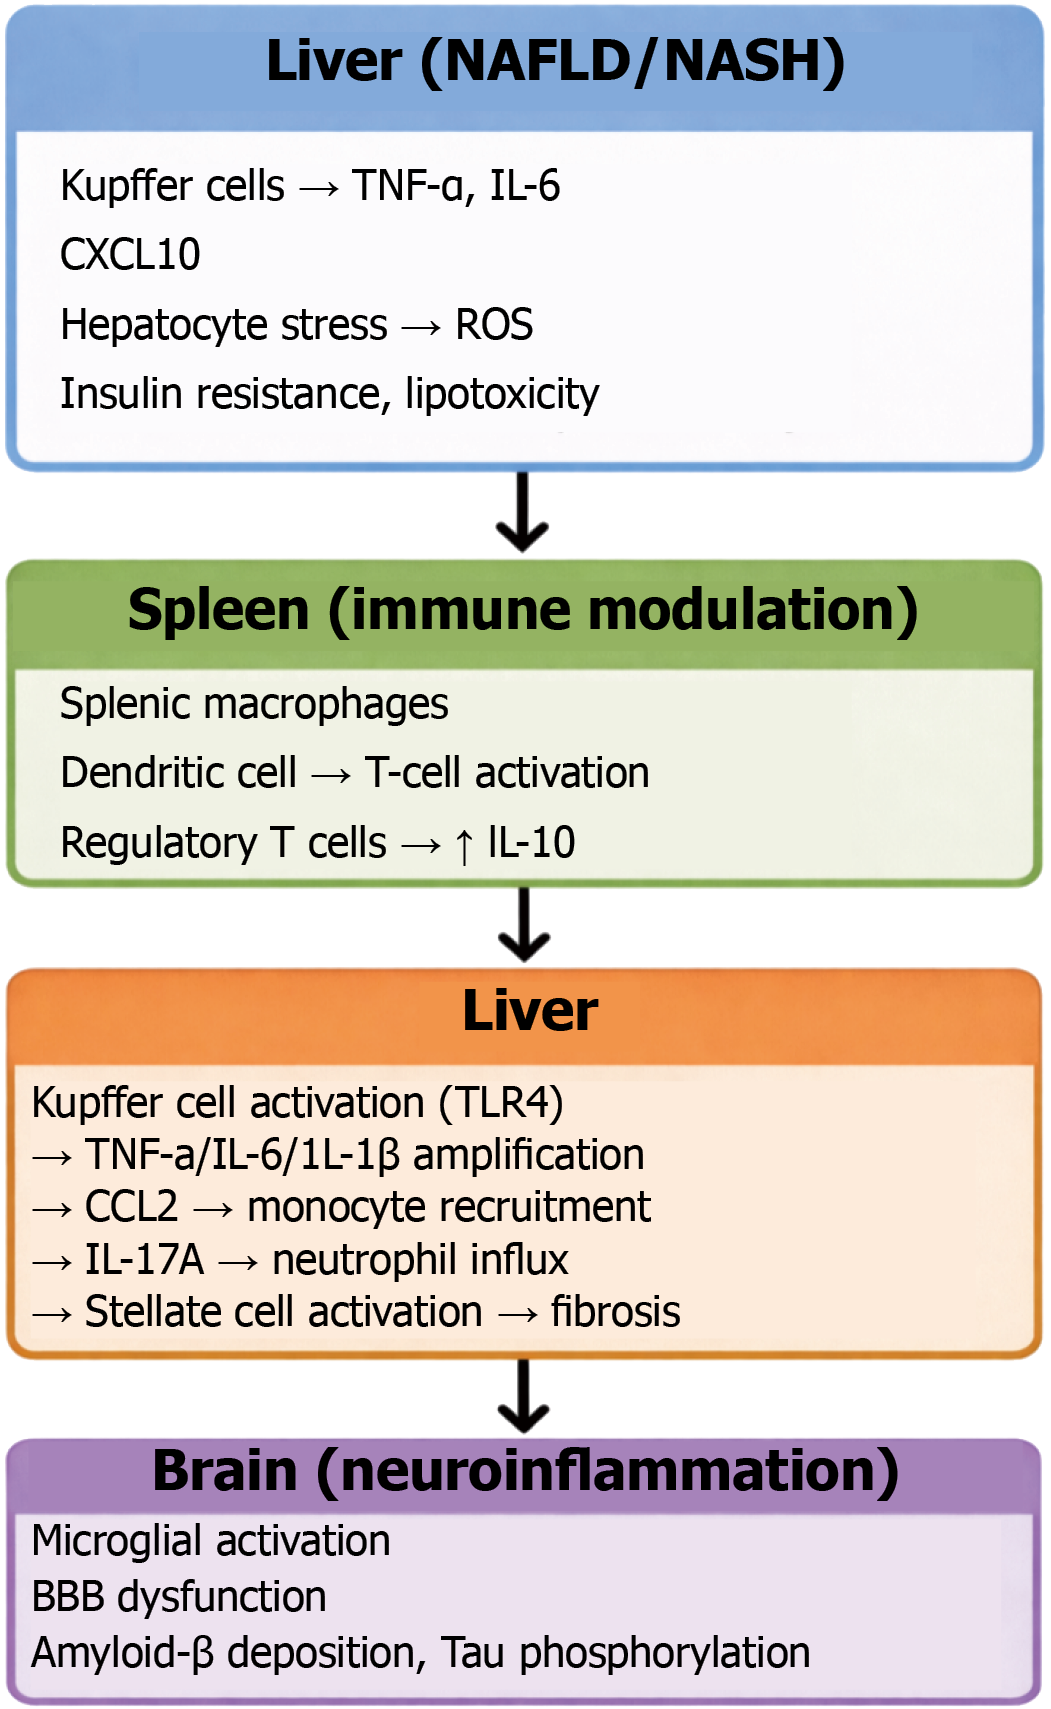
Figure 6 Liver-spleen-brain axis in patients with non-alcoholic fatty liver disease/nonalcoholic steatohepatitis with Alzheimer’s disease comorbidity.
Hepatic steatosis and steatohepatitis trigger systemic inflammation through Kupffer cell activation and tumor necrosis factor alpha (TNF-α) signaling, leading to insulin resistance and immune activation. The spleen acts as a central immune hub, where macrophages, dendritic cells, and monocytes are activated and recruited. These peripheral immune cells traffic to the central nervous system, where they drive neuroinflammation through microglial activation, promoting amyloid-β deposition and tau phosphorylation, key pathological hallmarks of Alzheimer’s disease. NAFLD: Non-alcoholic fatty liver disease; NASH: Nonalcoholic steatohepatitis; IL: Interleukin; CXCL10: C-X-C motif chemokine ligand 10; ROS: Reactive oxygen species; TLR4: Toll-like receptor 4; BBB: Blood-brain barrier.
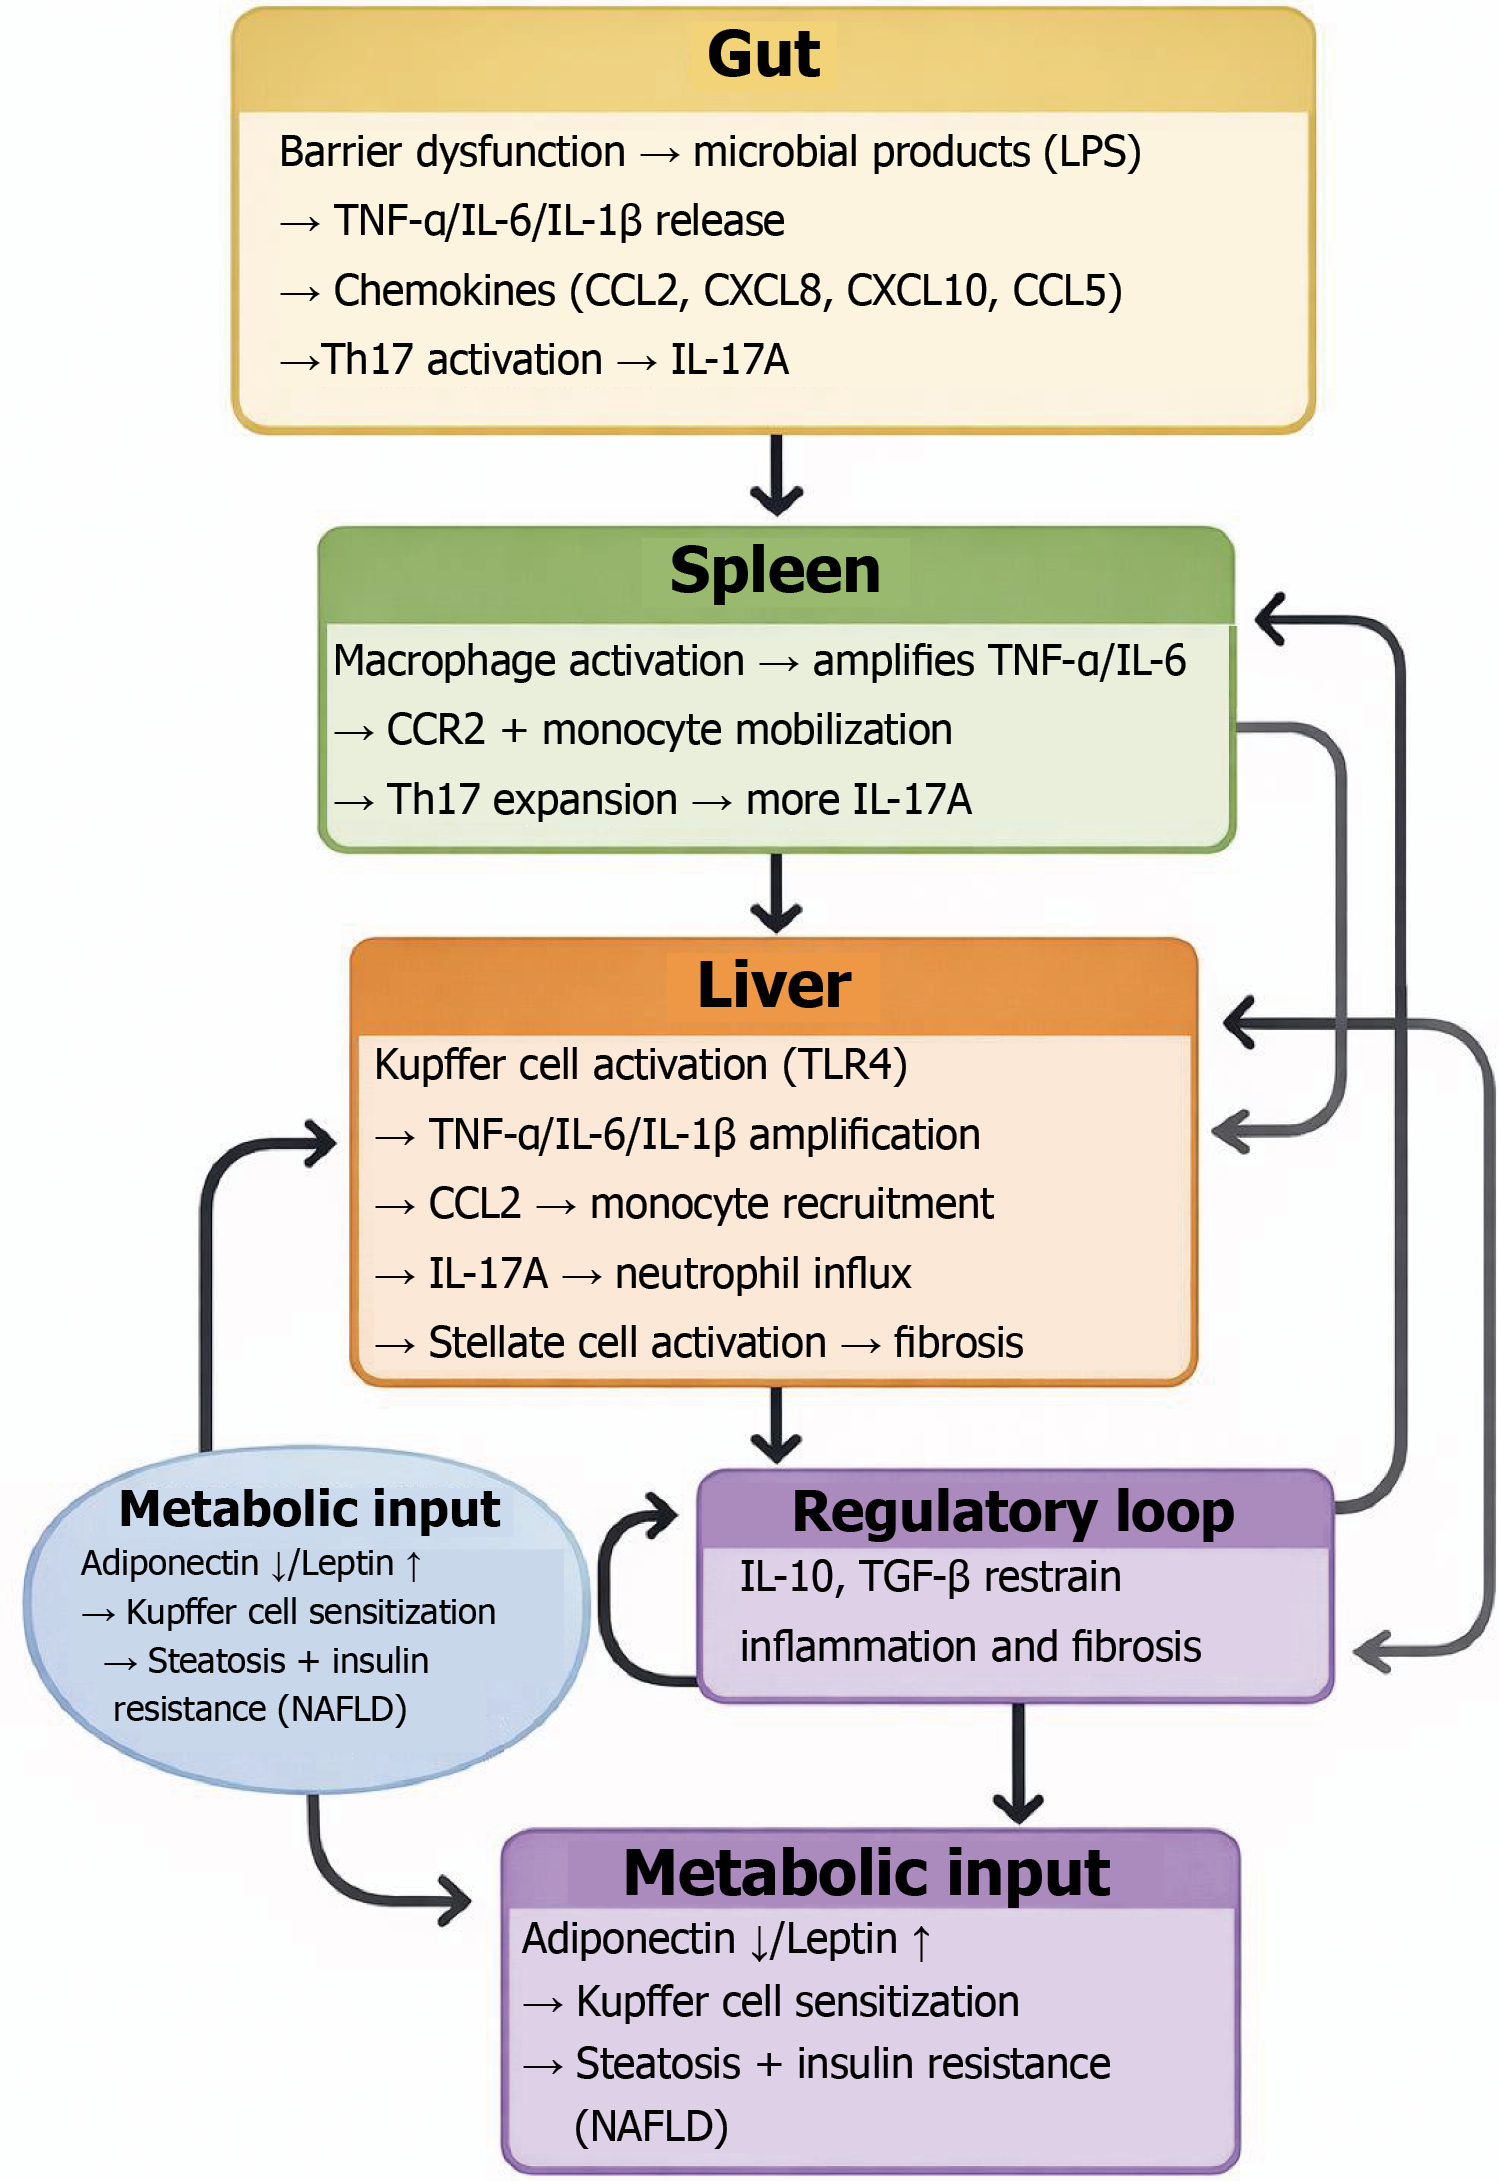
Figure 7 Systemic pathophysiology of the gut-liver-spleen axis.
This diagram illustrates the complex inter-organ communication and metabolic signaling that drive systemic inflammation and hepatic fibrosis. CXCL: C-X-C motif chemokine ligand; IL: Interleukin; LPS: Lipopolysaccharide; NAFLD: Non-alcoholic fatty liver disease; TGF-β: Transforming growth factor beta; TNF-α: Tumor necrosis factor alpha.
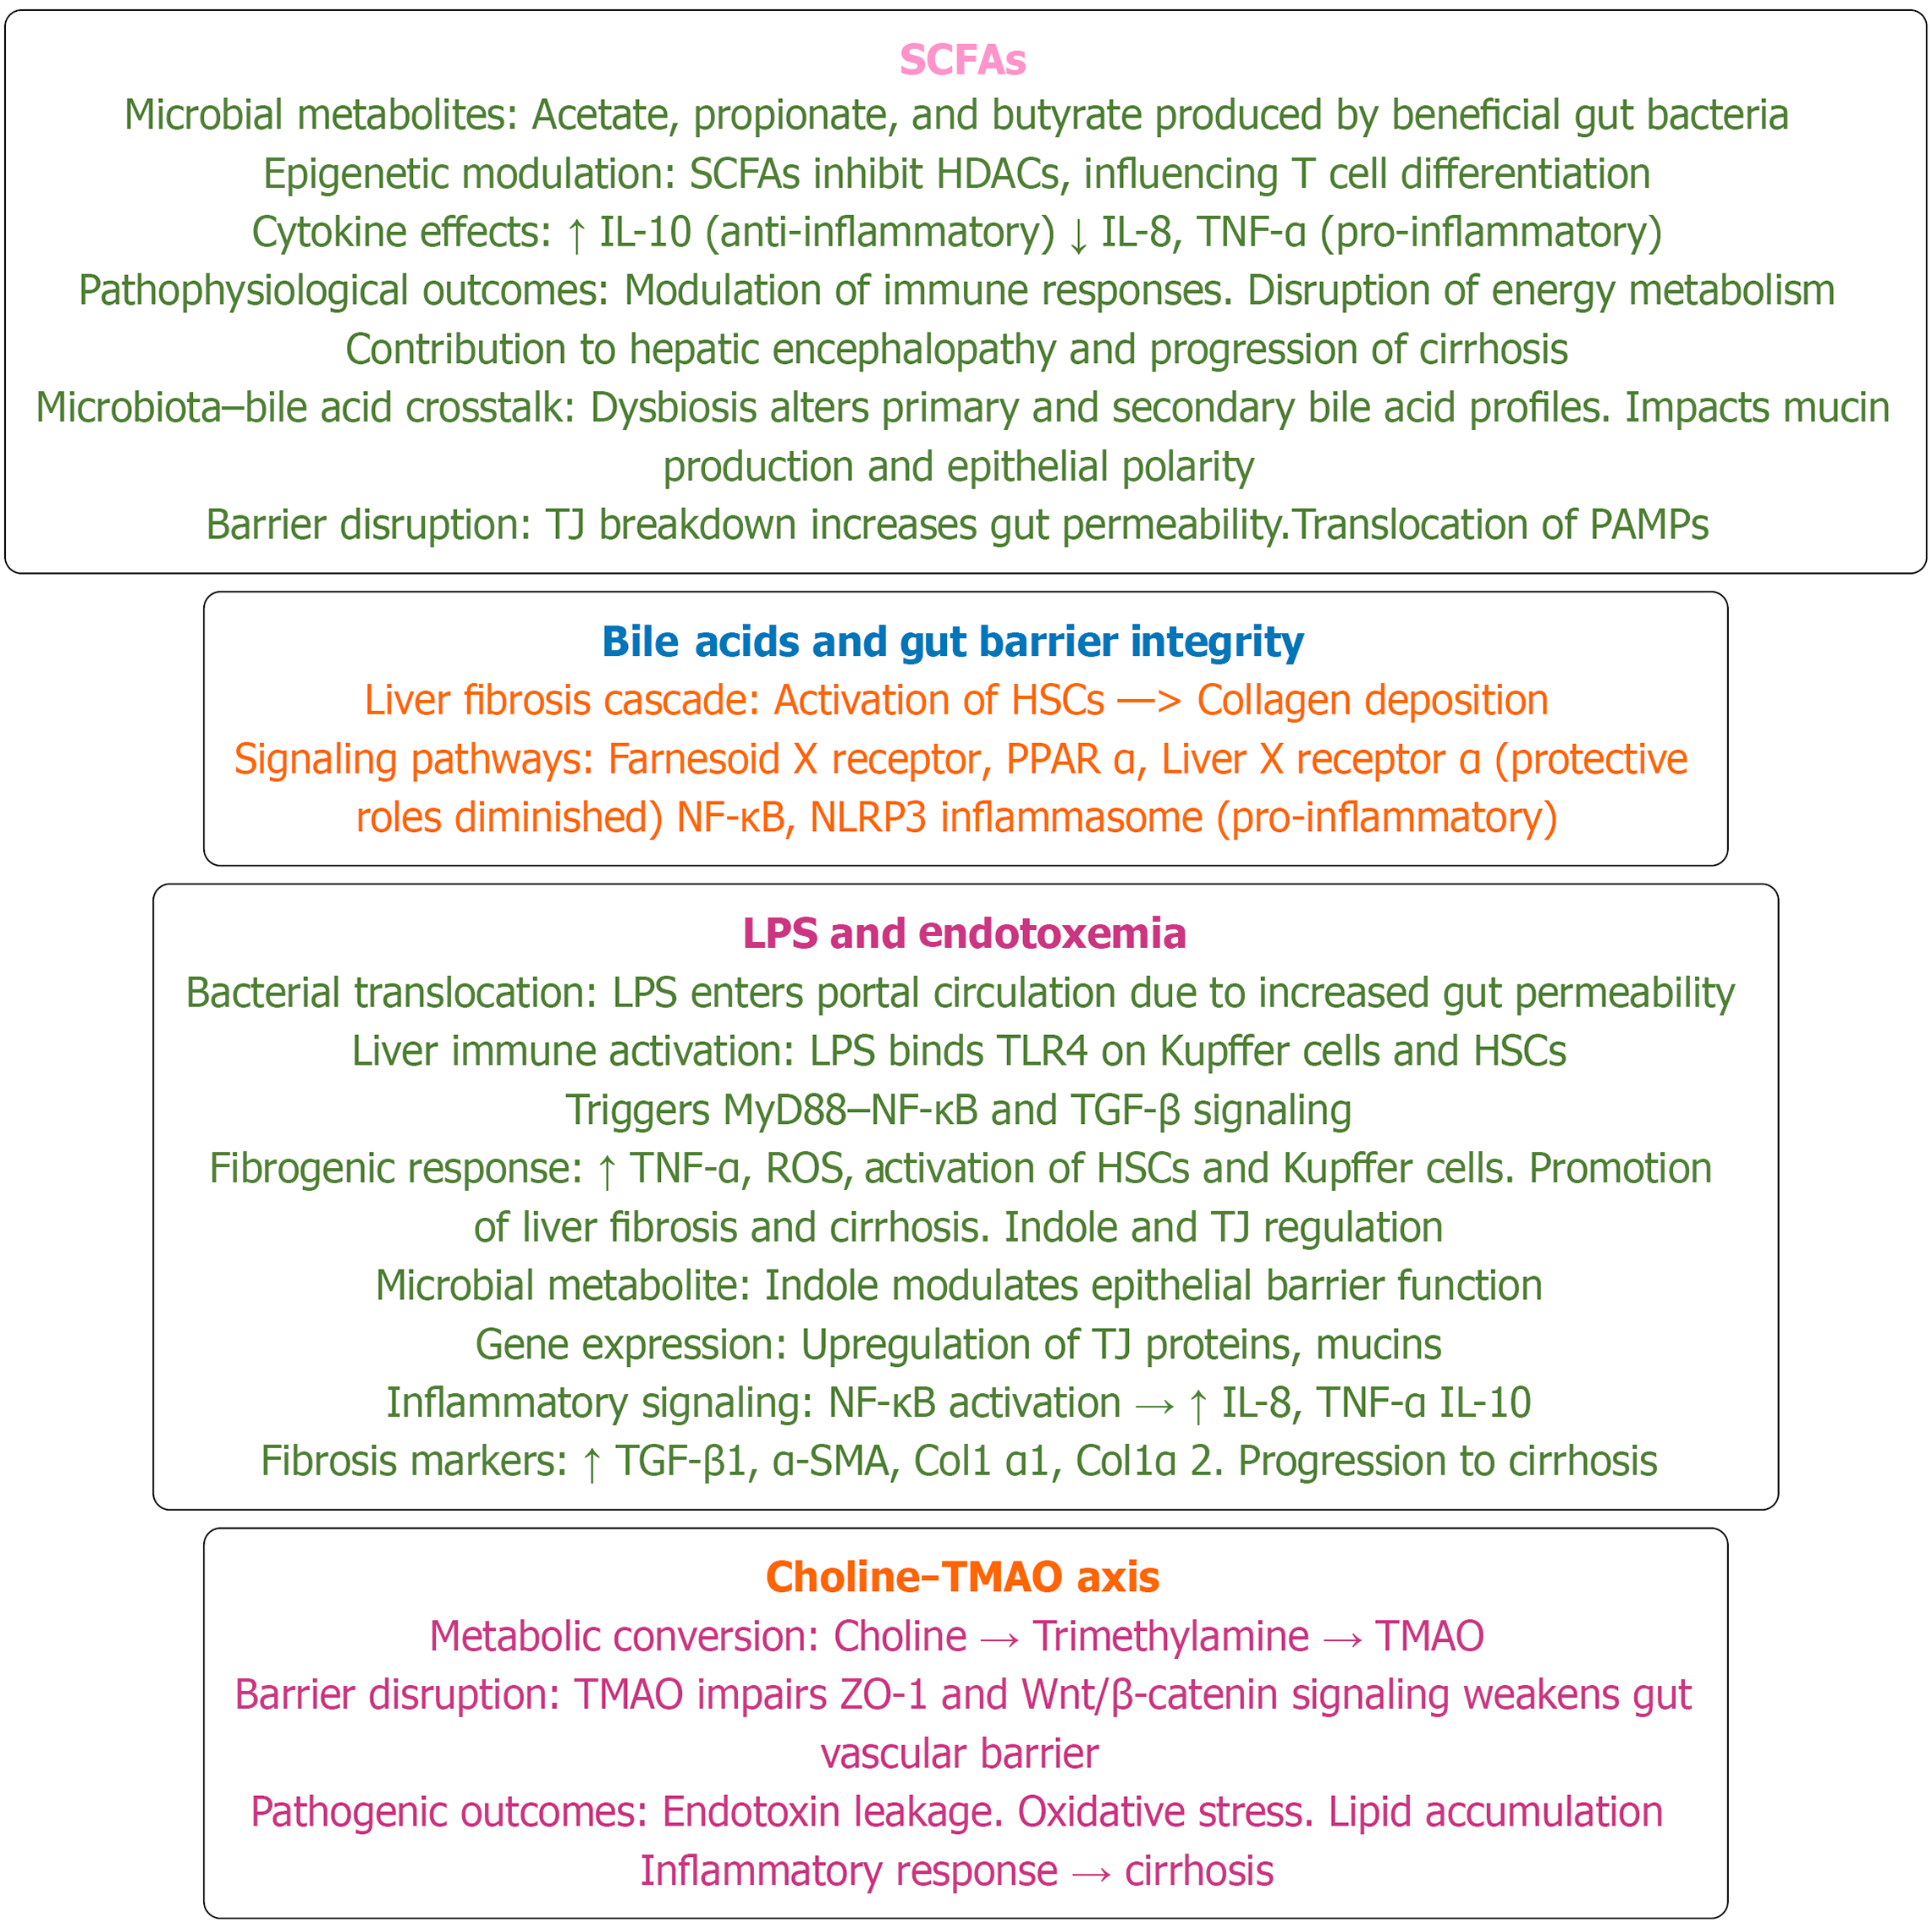
Figure 8 Gut-liver axis in cirrhosis: A vicious cycle.
Initial events and sub-sequential molecular processes linking gut and liver in cirrhosis. α-SMA: Alpha smooth muscle actin; HDAC: Histone deacetylase; IL: Interleukin; LPS: Lipopolysaccharide; NF-κB: Nuclear factor kappa B; NLRP3: NOD-like receptor pyrin domain-containing protein 3; PAMP: Pathogen-associated molecular pattern; PPAR: Peroxisome proliferator-activated receptor; ROS: Reactive oxygen species; SCFA: Short-chain fatty acid; TGF-β: Transforming growth factor-beta; TJ: Tight junctions; TLR4: Toll-like receptor 4; TMAO: Trimethylamine N-oxide; TNF-α: Tumor necrosis factor alpha.
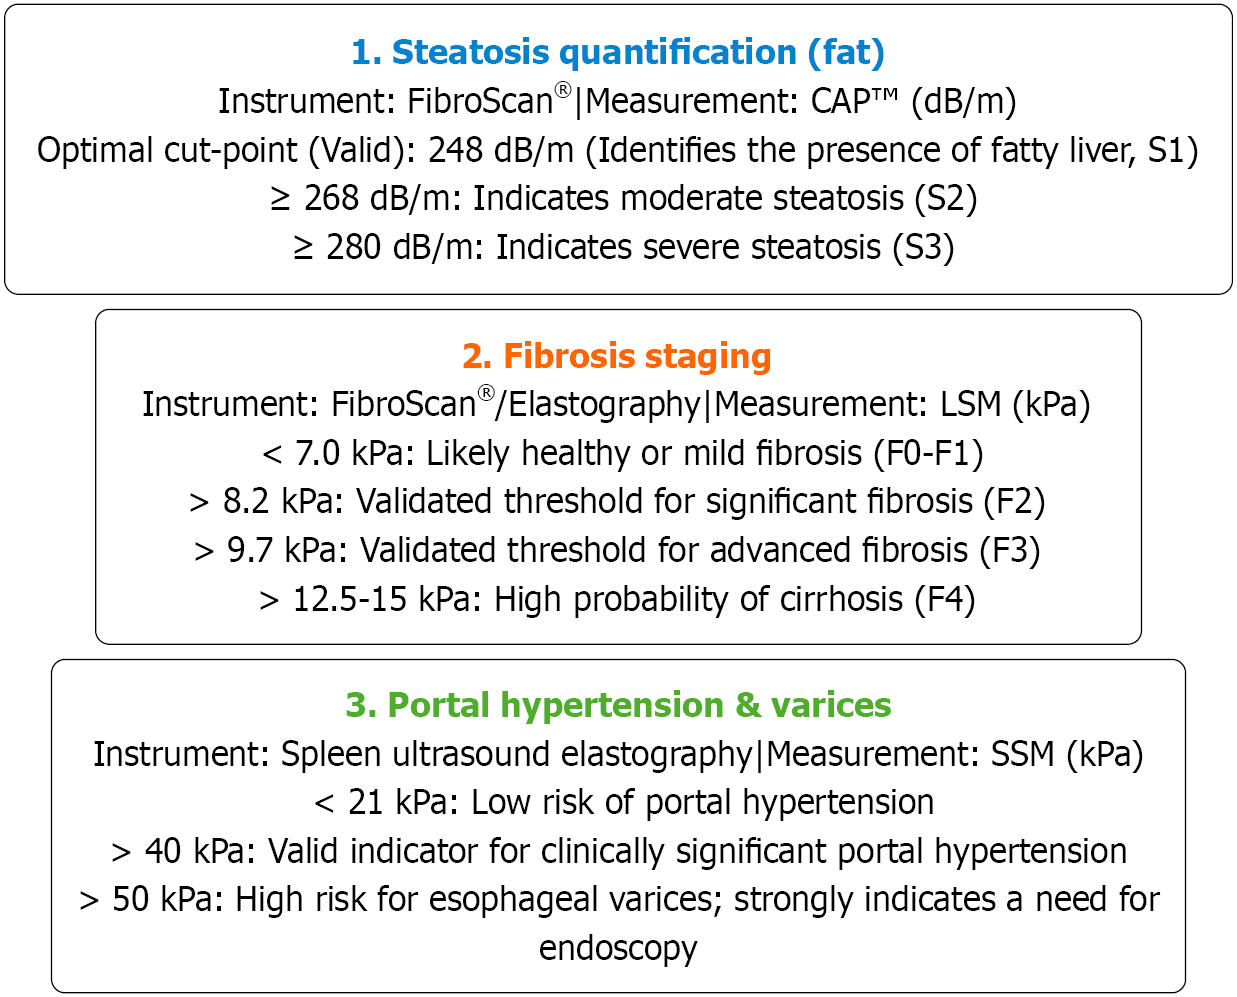
Figure 9 Validated metrics for non-alcoholic fatty liver disease/chronic liver disease.
Utilizing this suite of metrics enables physicians to lon
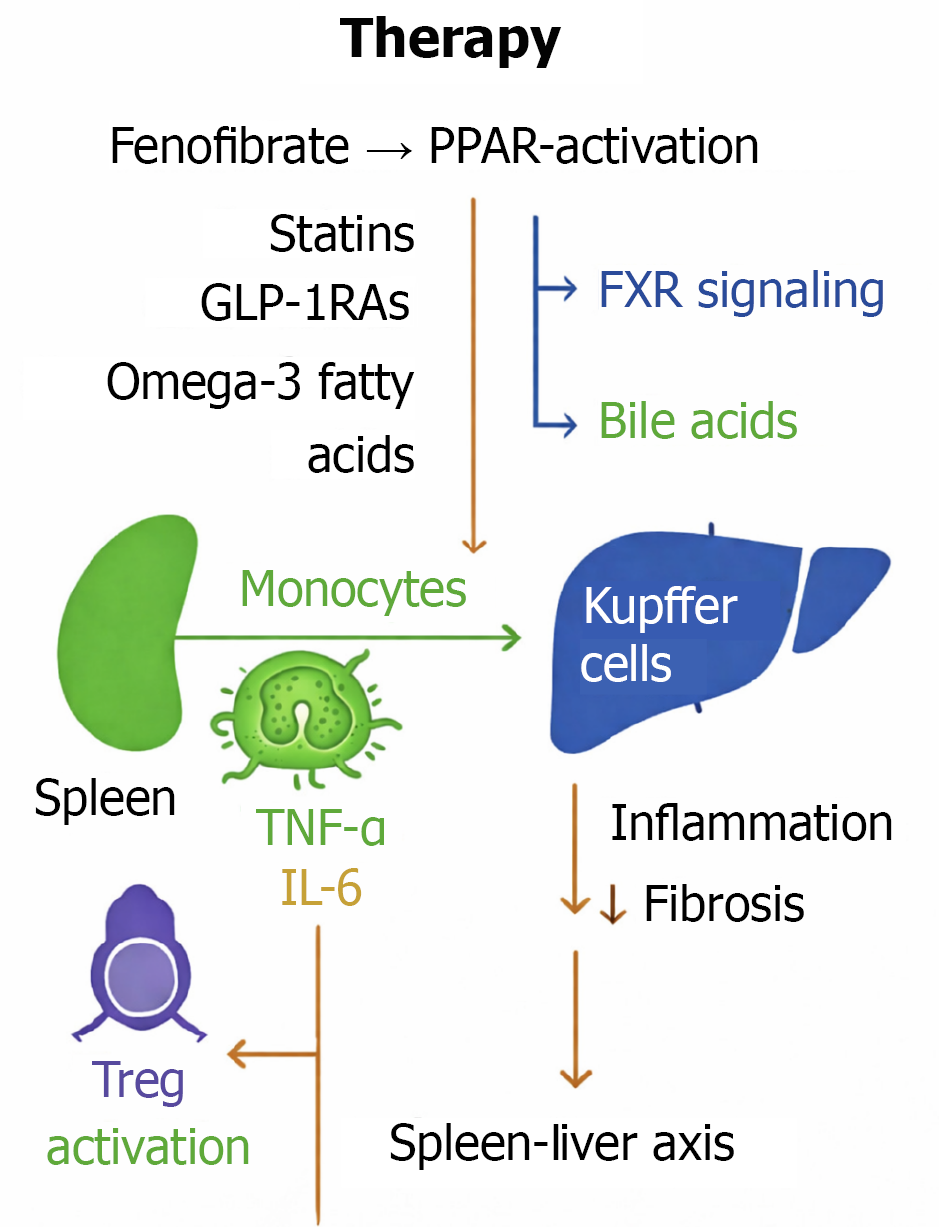
Figure 10 Integrated immune and metabolic actions of non-alcoholic fatty liver disease therapies on the spleen-liver axis.
Statins and other non-alcoholic fatty liver disease therapies act on monocytes and Kupffer cells, dampening cytokine output and reshaping immune-metabolic signaling across the spleen-liver axis[207-209]. FXR: Farnesoid X receptor; GLP-1RA: Glucagon-like peptide-1 receptor; IL: Interleukin; PPAR: Peroxisome proliferator-activated receptor; TNF-α: Tumor necrosis factor alpha.
- Citation: Tarantino G, Citro V. Liver-spleen axis: Deciphering a crucial crosstalk in non-alcoholic fatty liver disease progression and therapeutic implications. World J Gastroenterol 2026; 32(34): 119467
- URL: https://www.wjgnet.com/1007-9327/full/v32/i34/119467.htm
- DOI: https://dx.doi.org/10.3748/wjg.119467