
















Copyright: ©Author(s) 2026.
World J Gastroenterol. Sep 7, 2026; 32(33): 119646
Published online Sep 7, 2026. doi: 10.3748/wjg.119646
Published online Sep 7, 2026. doi: 10.3748/wjg.119646
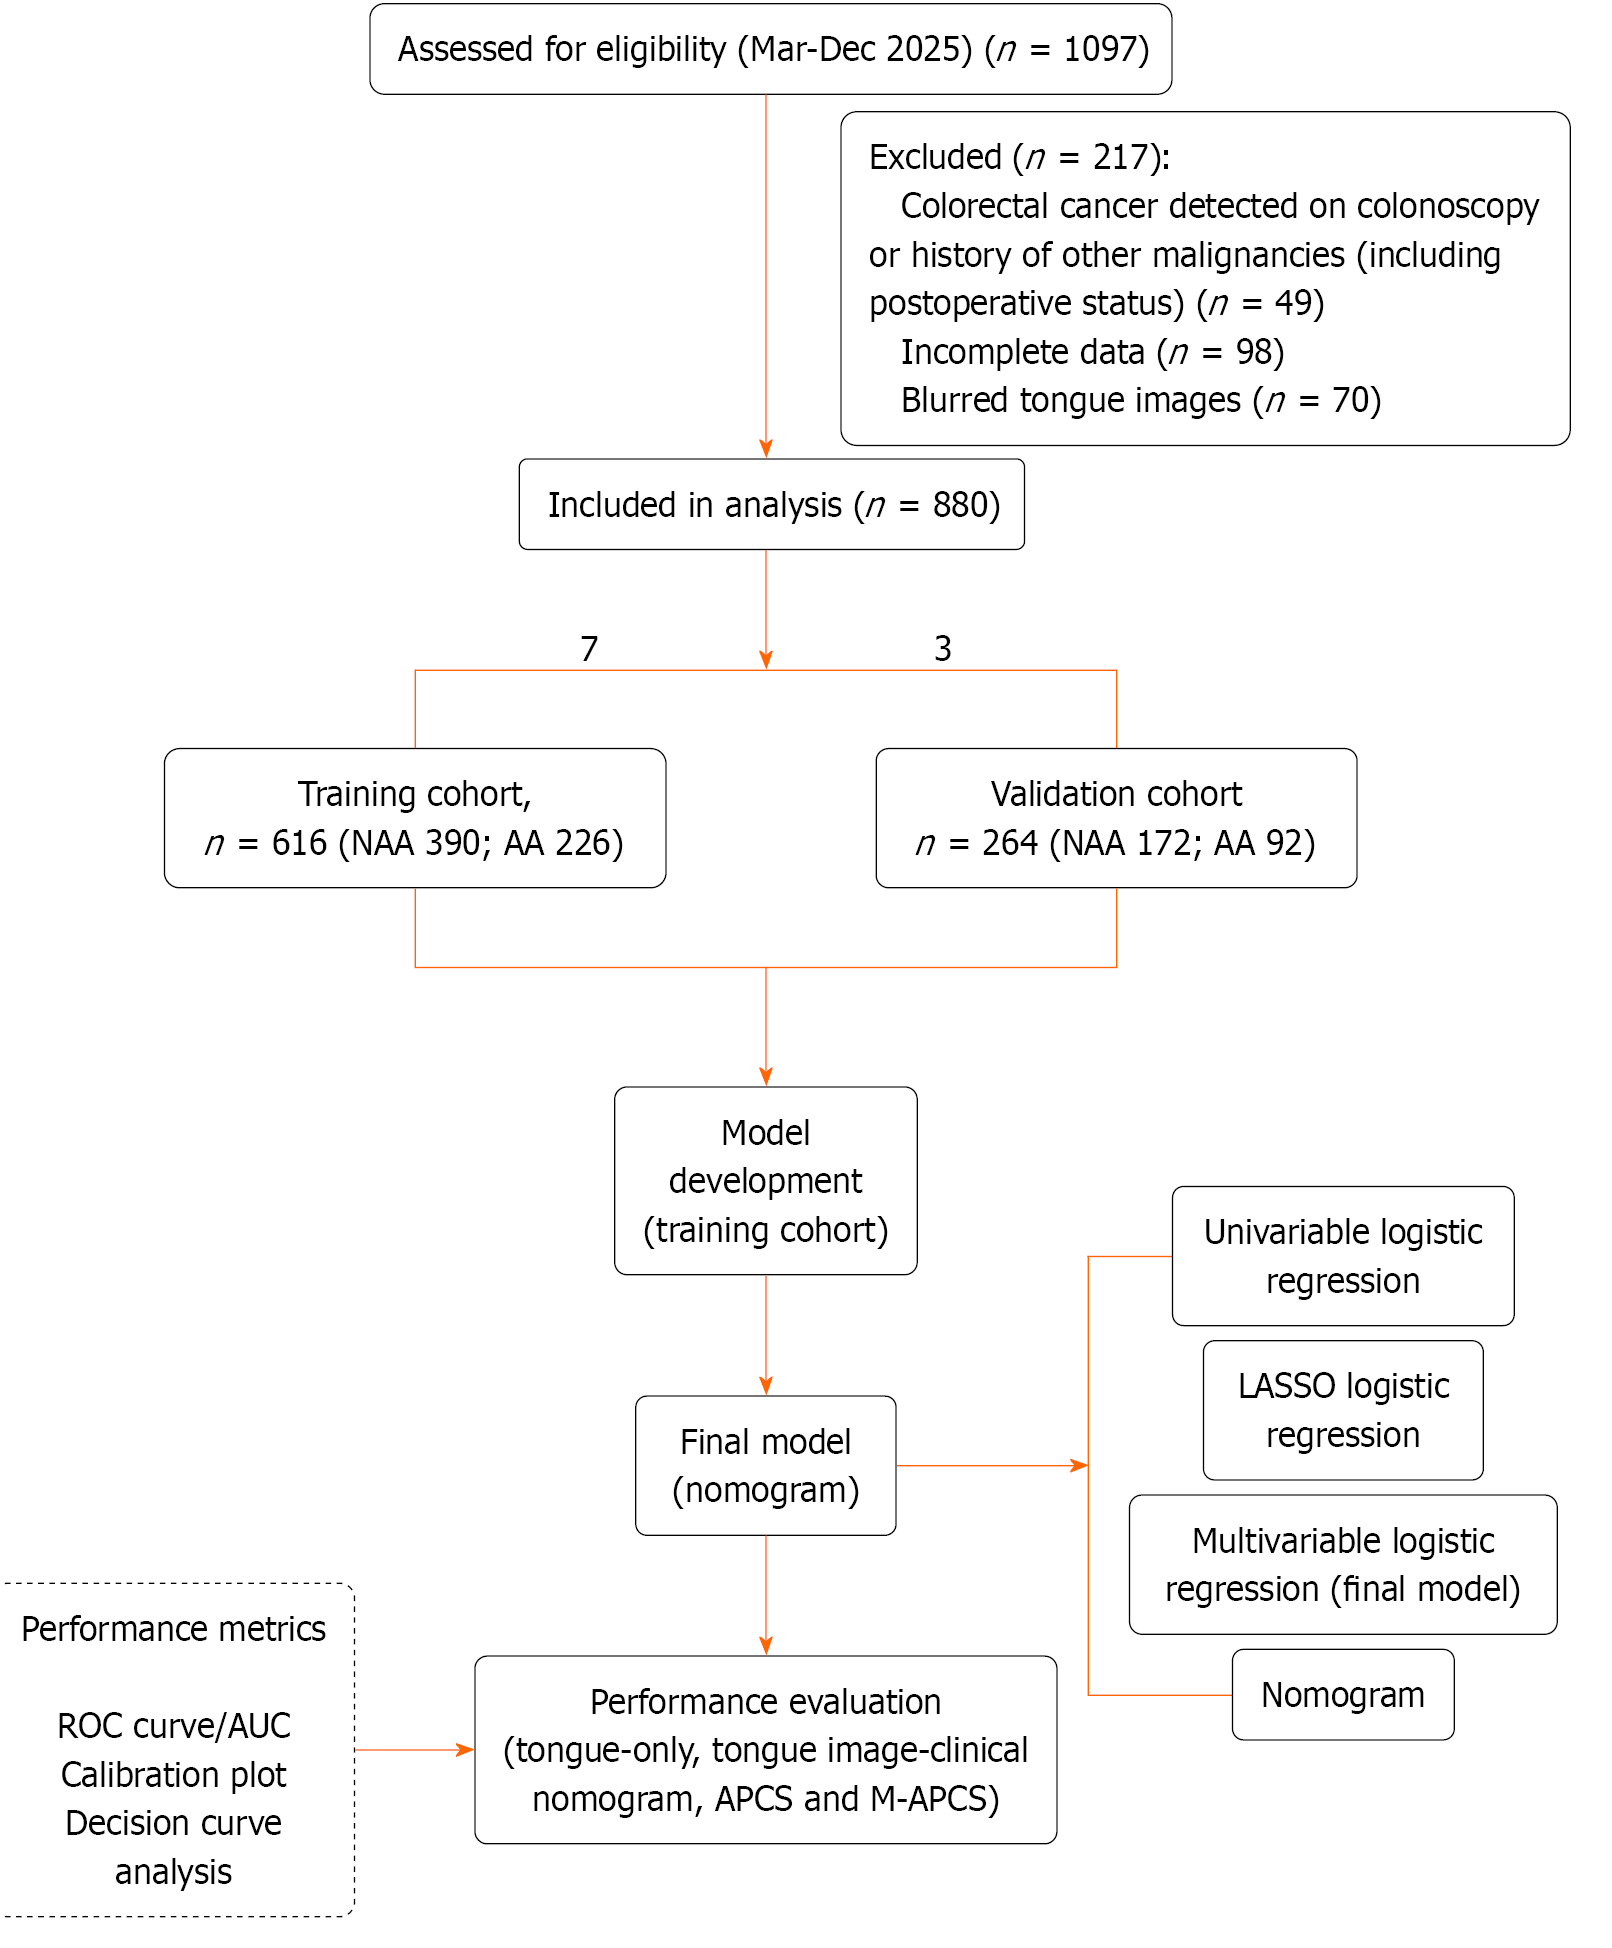
Figure 1 Flowchart of participant enrollment, cohort allocation, model development, and performance evaluation.
NAA: Nonadvanced adenoma; AA: Advanced adenoma; APCS: Asia-Pacific colorectal screening score; M-APCS: Modified Asia-Pacific colorectal screening score; ROC: Receiver operating characteristic; AUC: Area under the curve; LASSO: Least absolute shrinkage and selection operator.
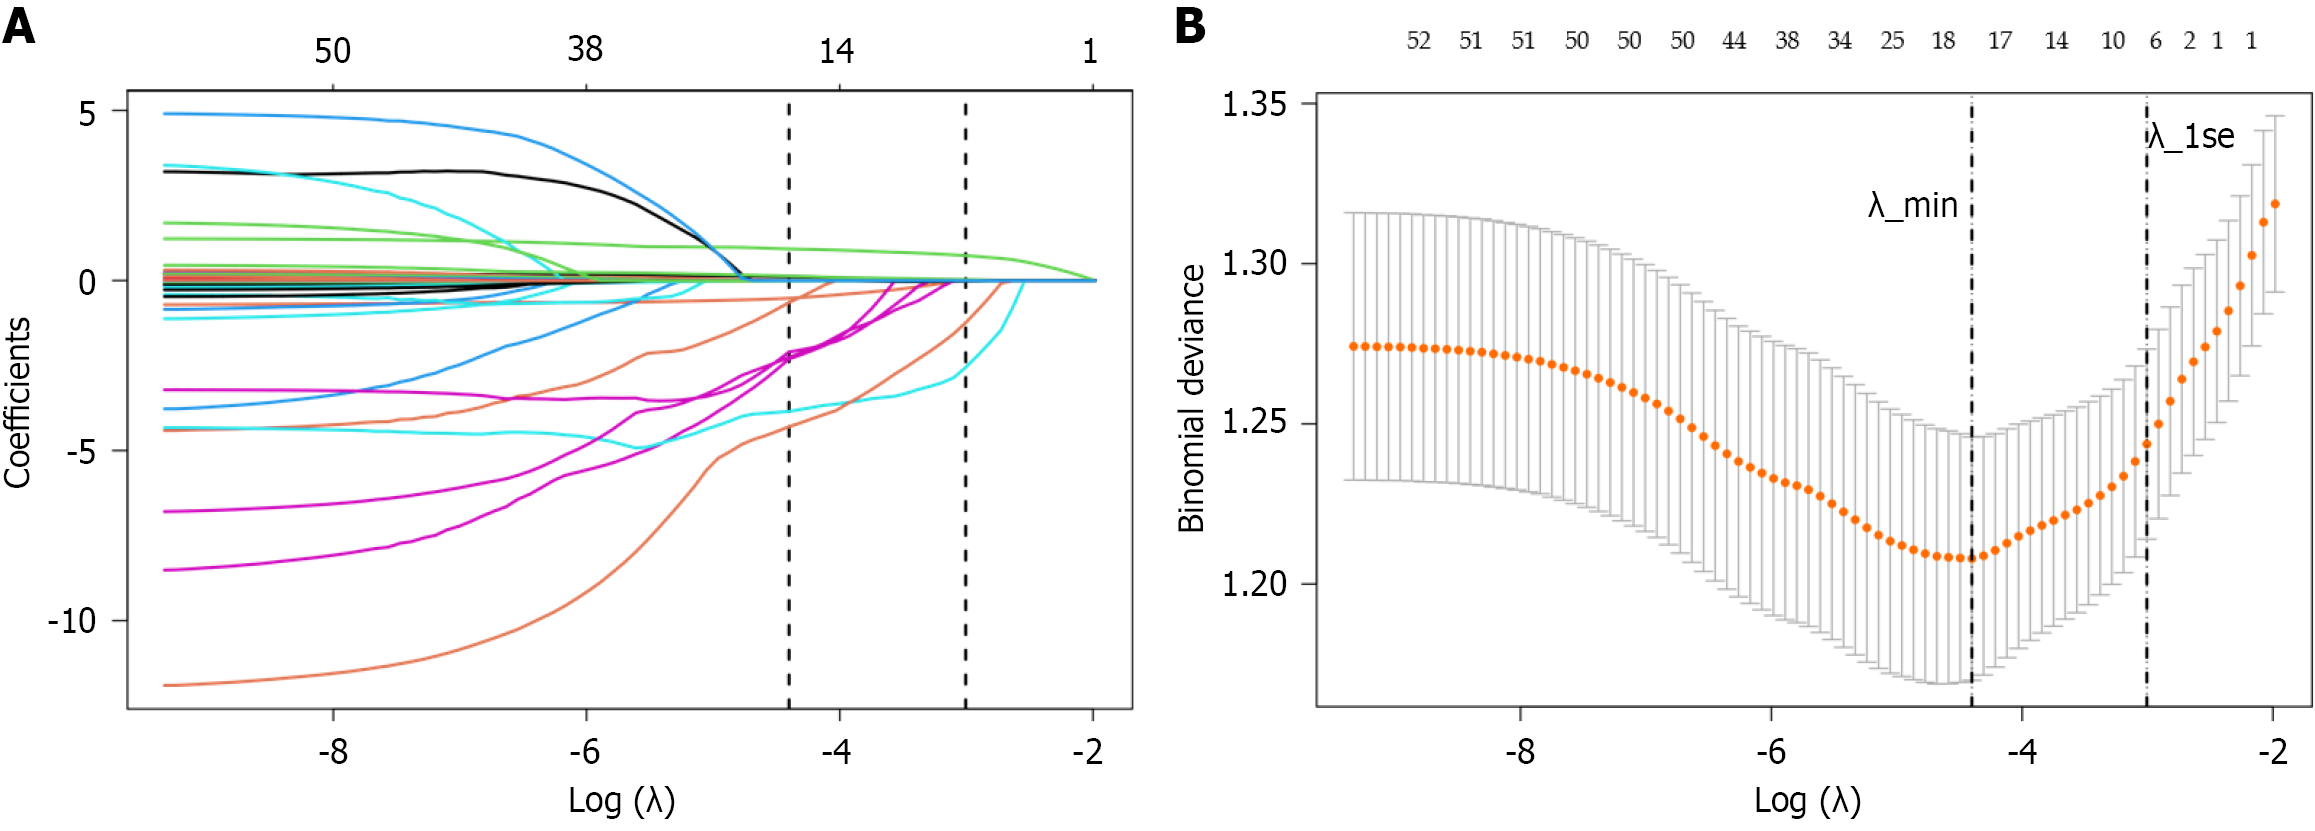
Figure 2 Least absolute shrinkage and selection operator logistic regression for tongue-image feature selection in the training cohort.
A: The coefficient path plot; B: Cross-validation curve, show feature shrinkage and selection of the optimal penalty parameter (λmin = 0.0122661; λ 1se = 0.04951844). λ 1se was chosen, yielding seven tongue-image features with non-zero coefficients. LASSO: Least absolute shrinkage and selection operator.
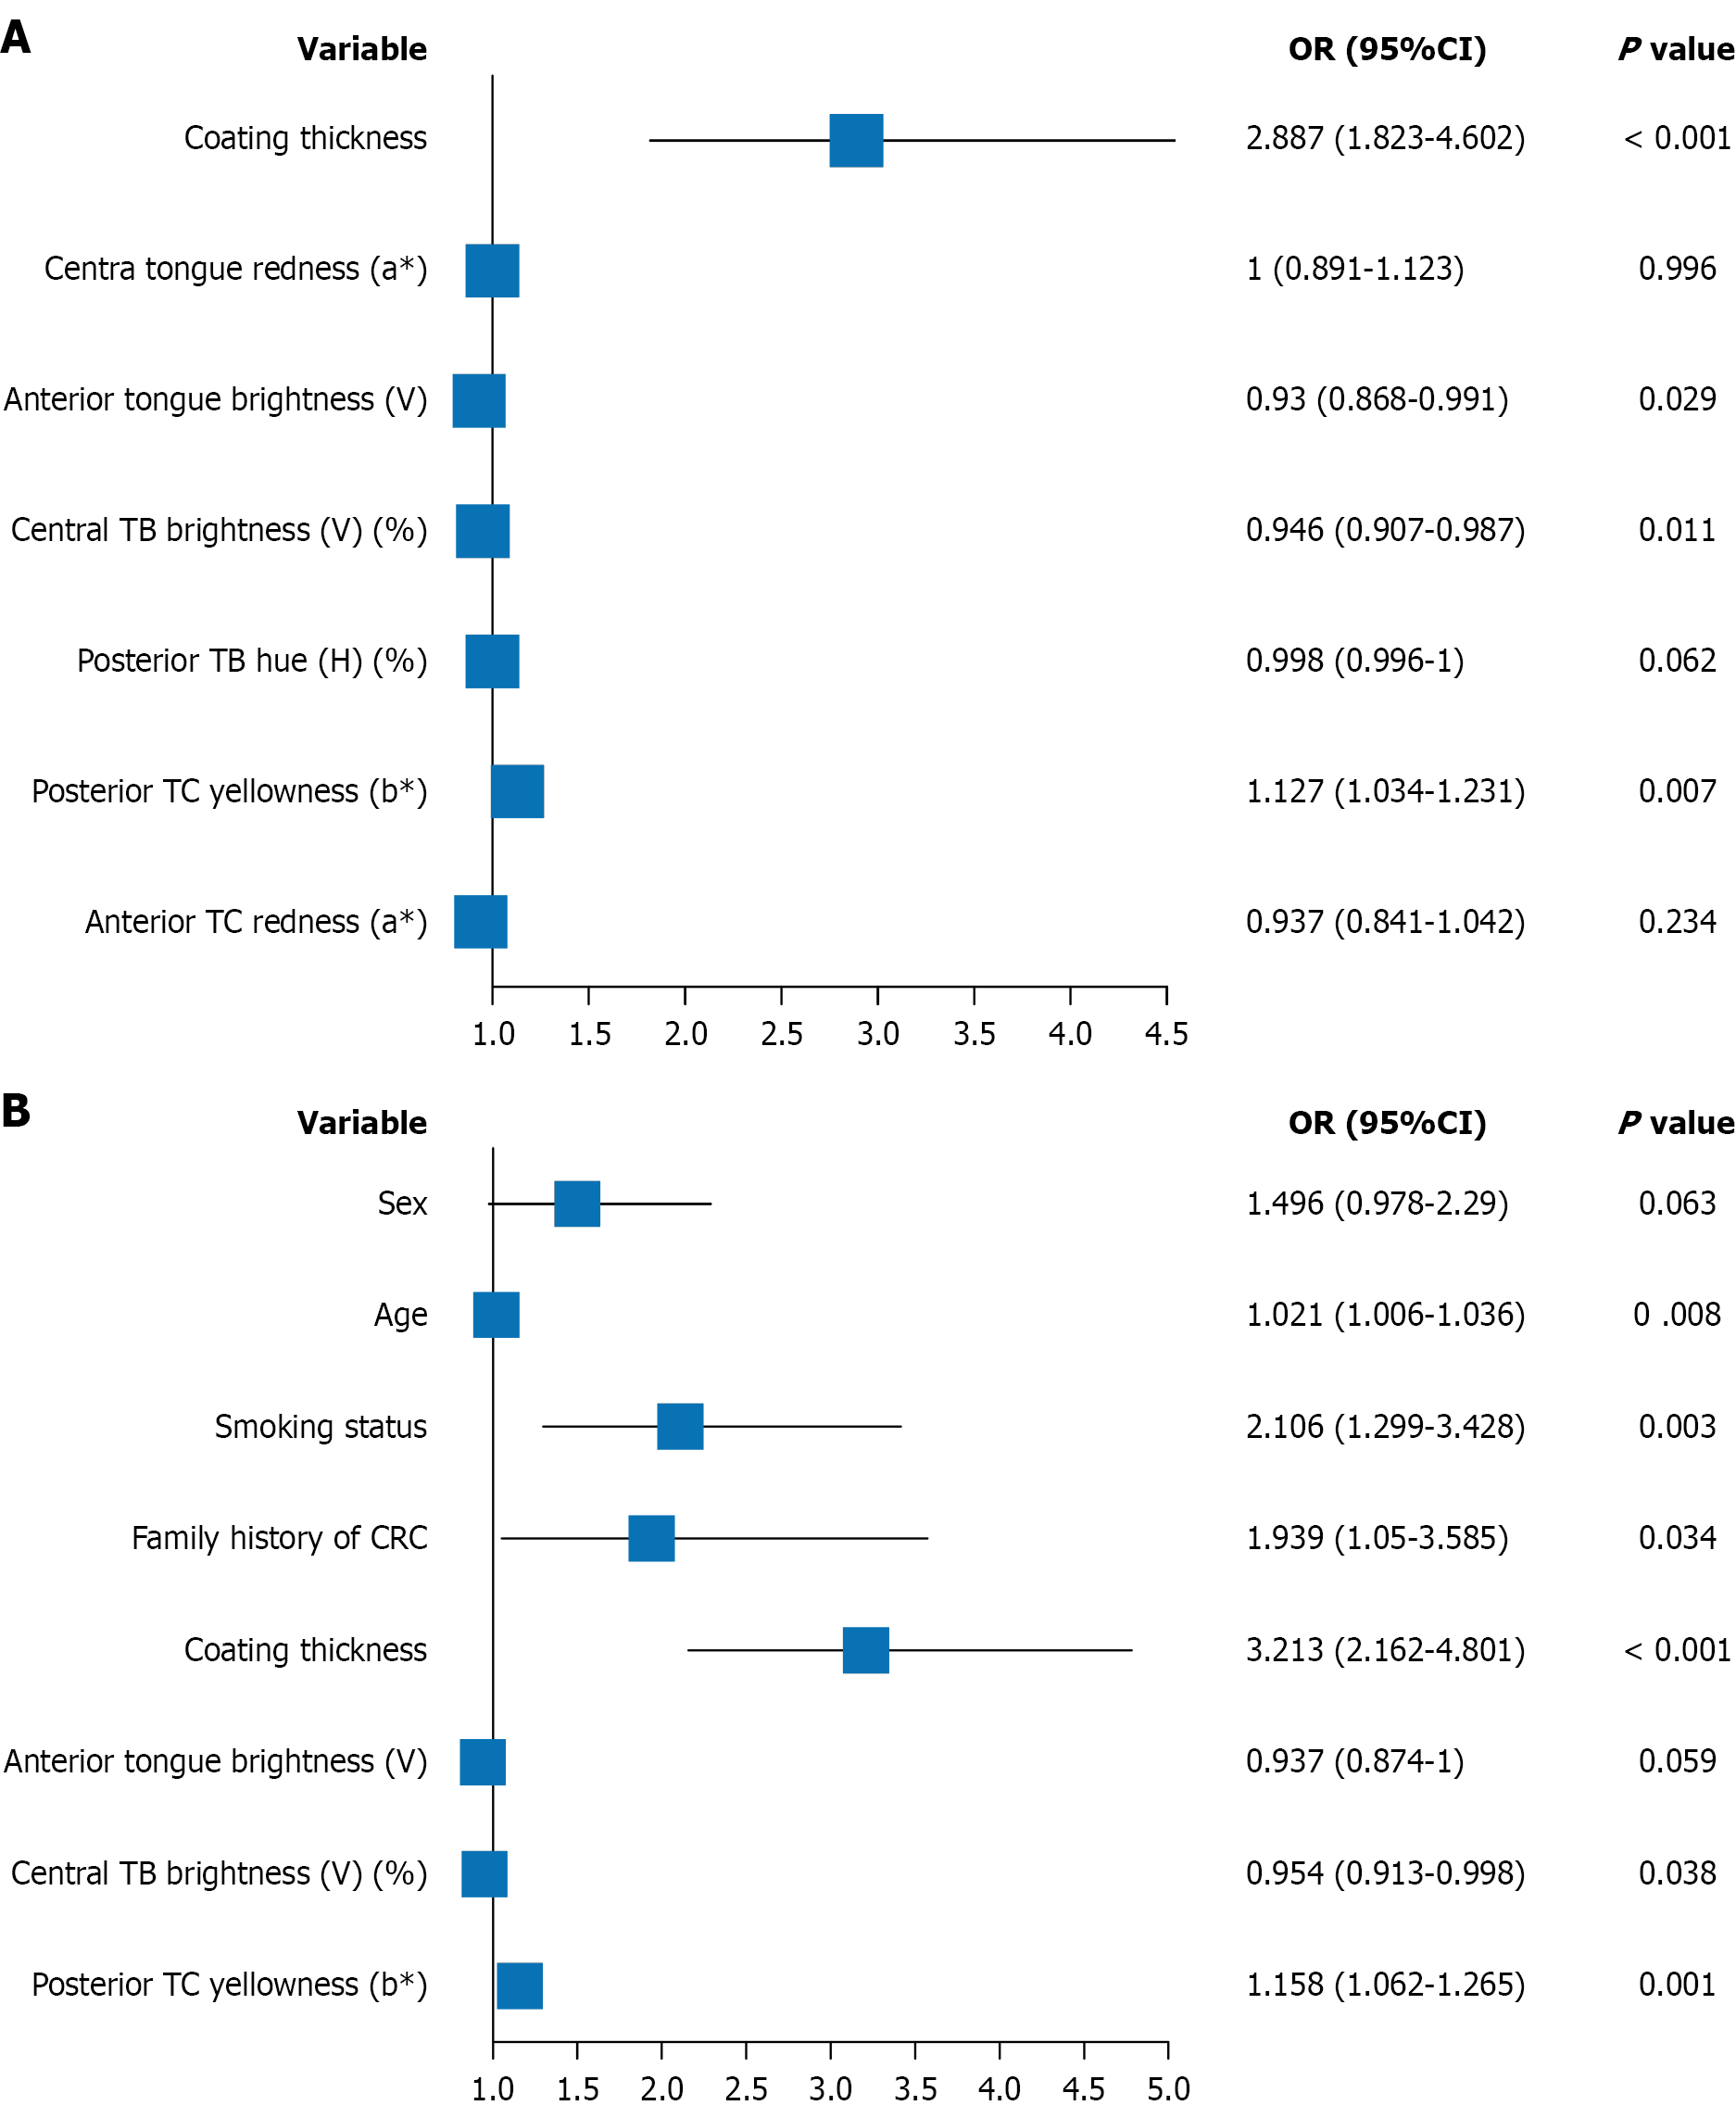
Figure 3 Multivariable logistic regression analysis in the training cohort.
A: For the tongue-only model. Forest plot of odds ratios (ORs) and 95% confidence interval (CIs) for the seven least absolute shrinkage and selection operator-selected tongue-image predictors entered simultaneously into the multivariable model; four predictors were retained in the final tongue-only model; B: For the tongue image-clinical model. Forest plot of ORs and 95%CIs for prespecified clinical predictors and tongue-image predictors entered simultaneously into the multivariable model. Anterior tongue brightness (V) was not retained in the final model (P = 0.059). OR: Odds ratio; CI: Confidence interval; TB: Tongue body; TC: Tongue coating; H: Hue in hue, saturation, value color space; V: Brightness (value) in hue, saturation, value color space; CRC: Colorectal cancer; a*: Red green axis in CIELAB color space; b*: Yellow-blue axis in CIELAB color space.
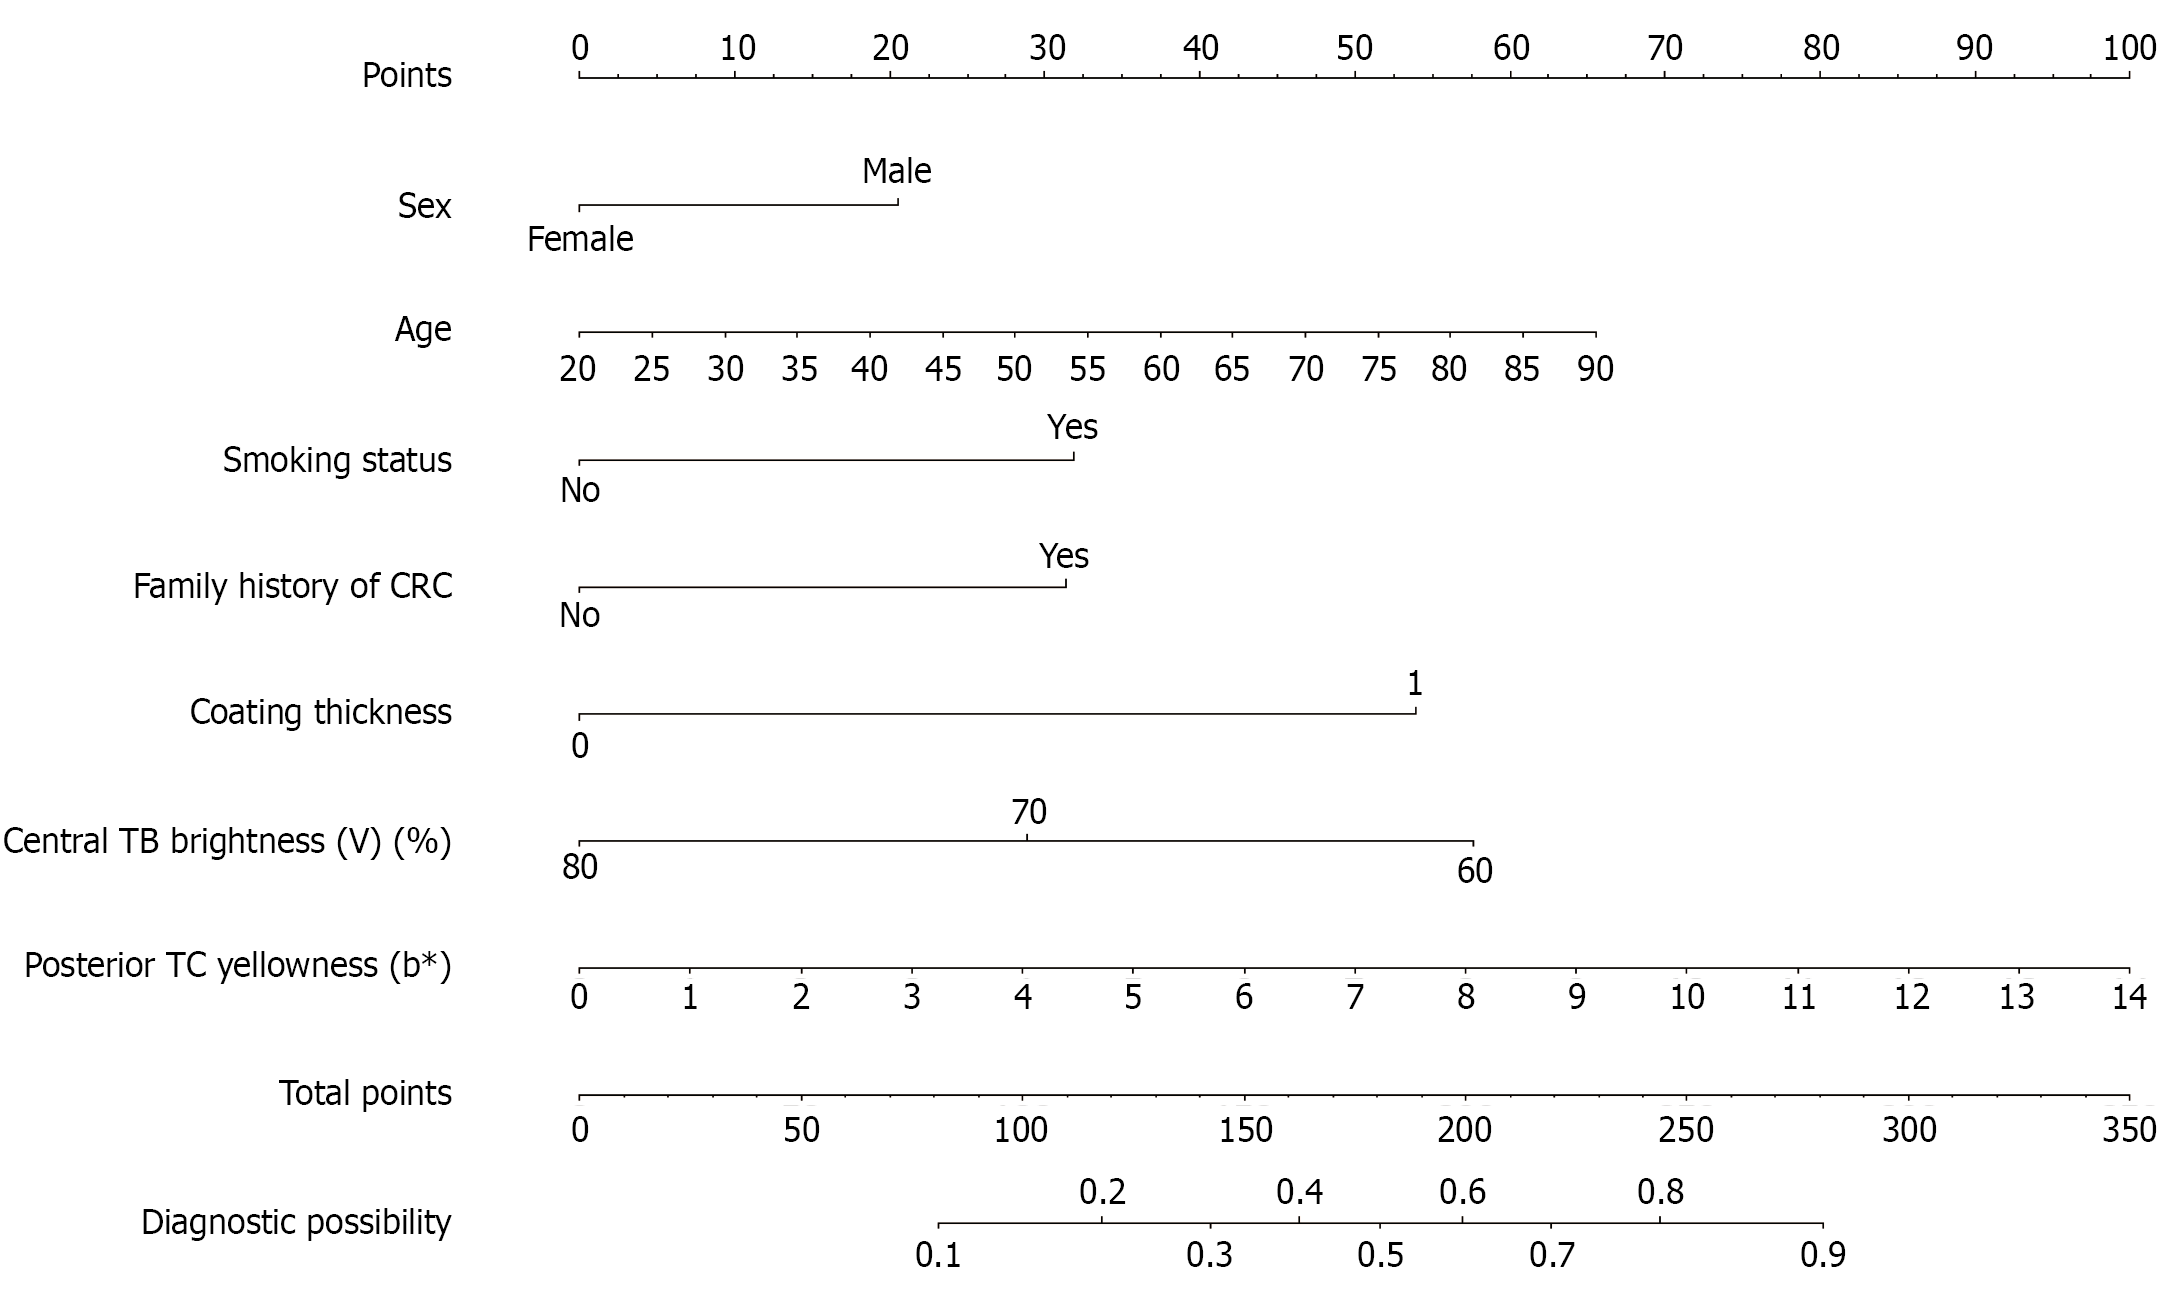
Figure 4 Nomogram derived from the final tongue image-clinical model for individualized prediction of advanced adenoma.
CRC: Colorectal cancer; TB: Tongue body; TC: Tongue coating; V: Brightness (value) in hue, saturation, value color space; b*: Yellow-blue axis in CIELAB color space.
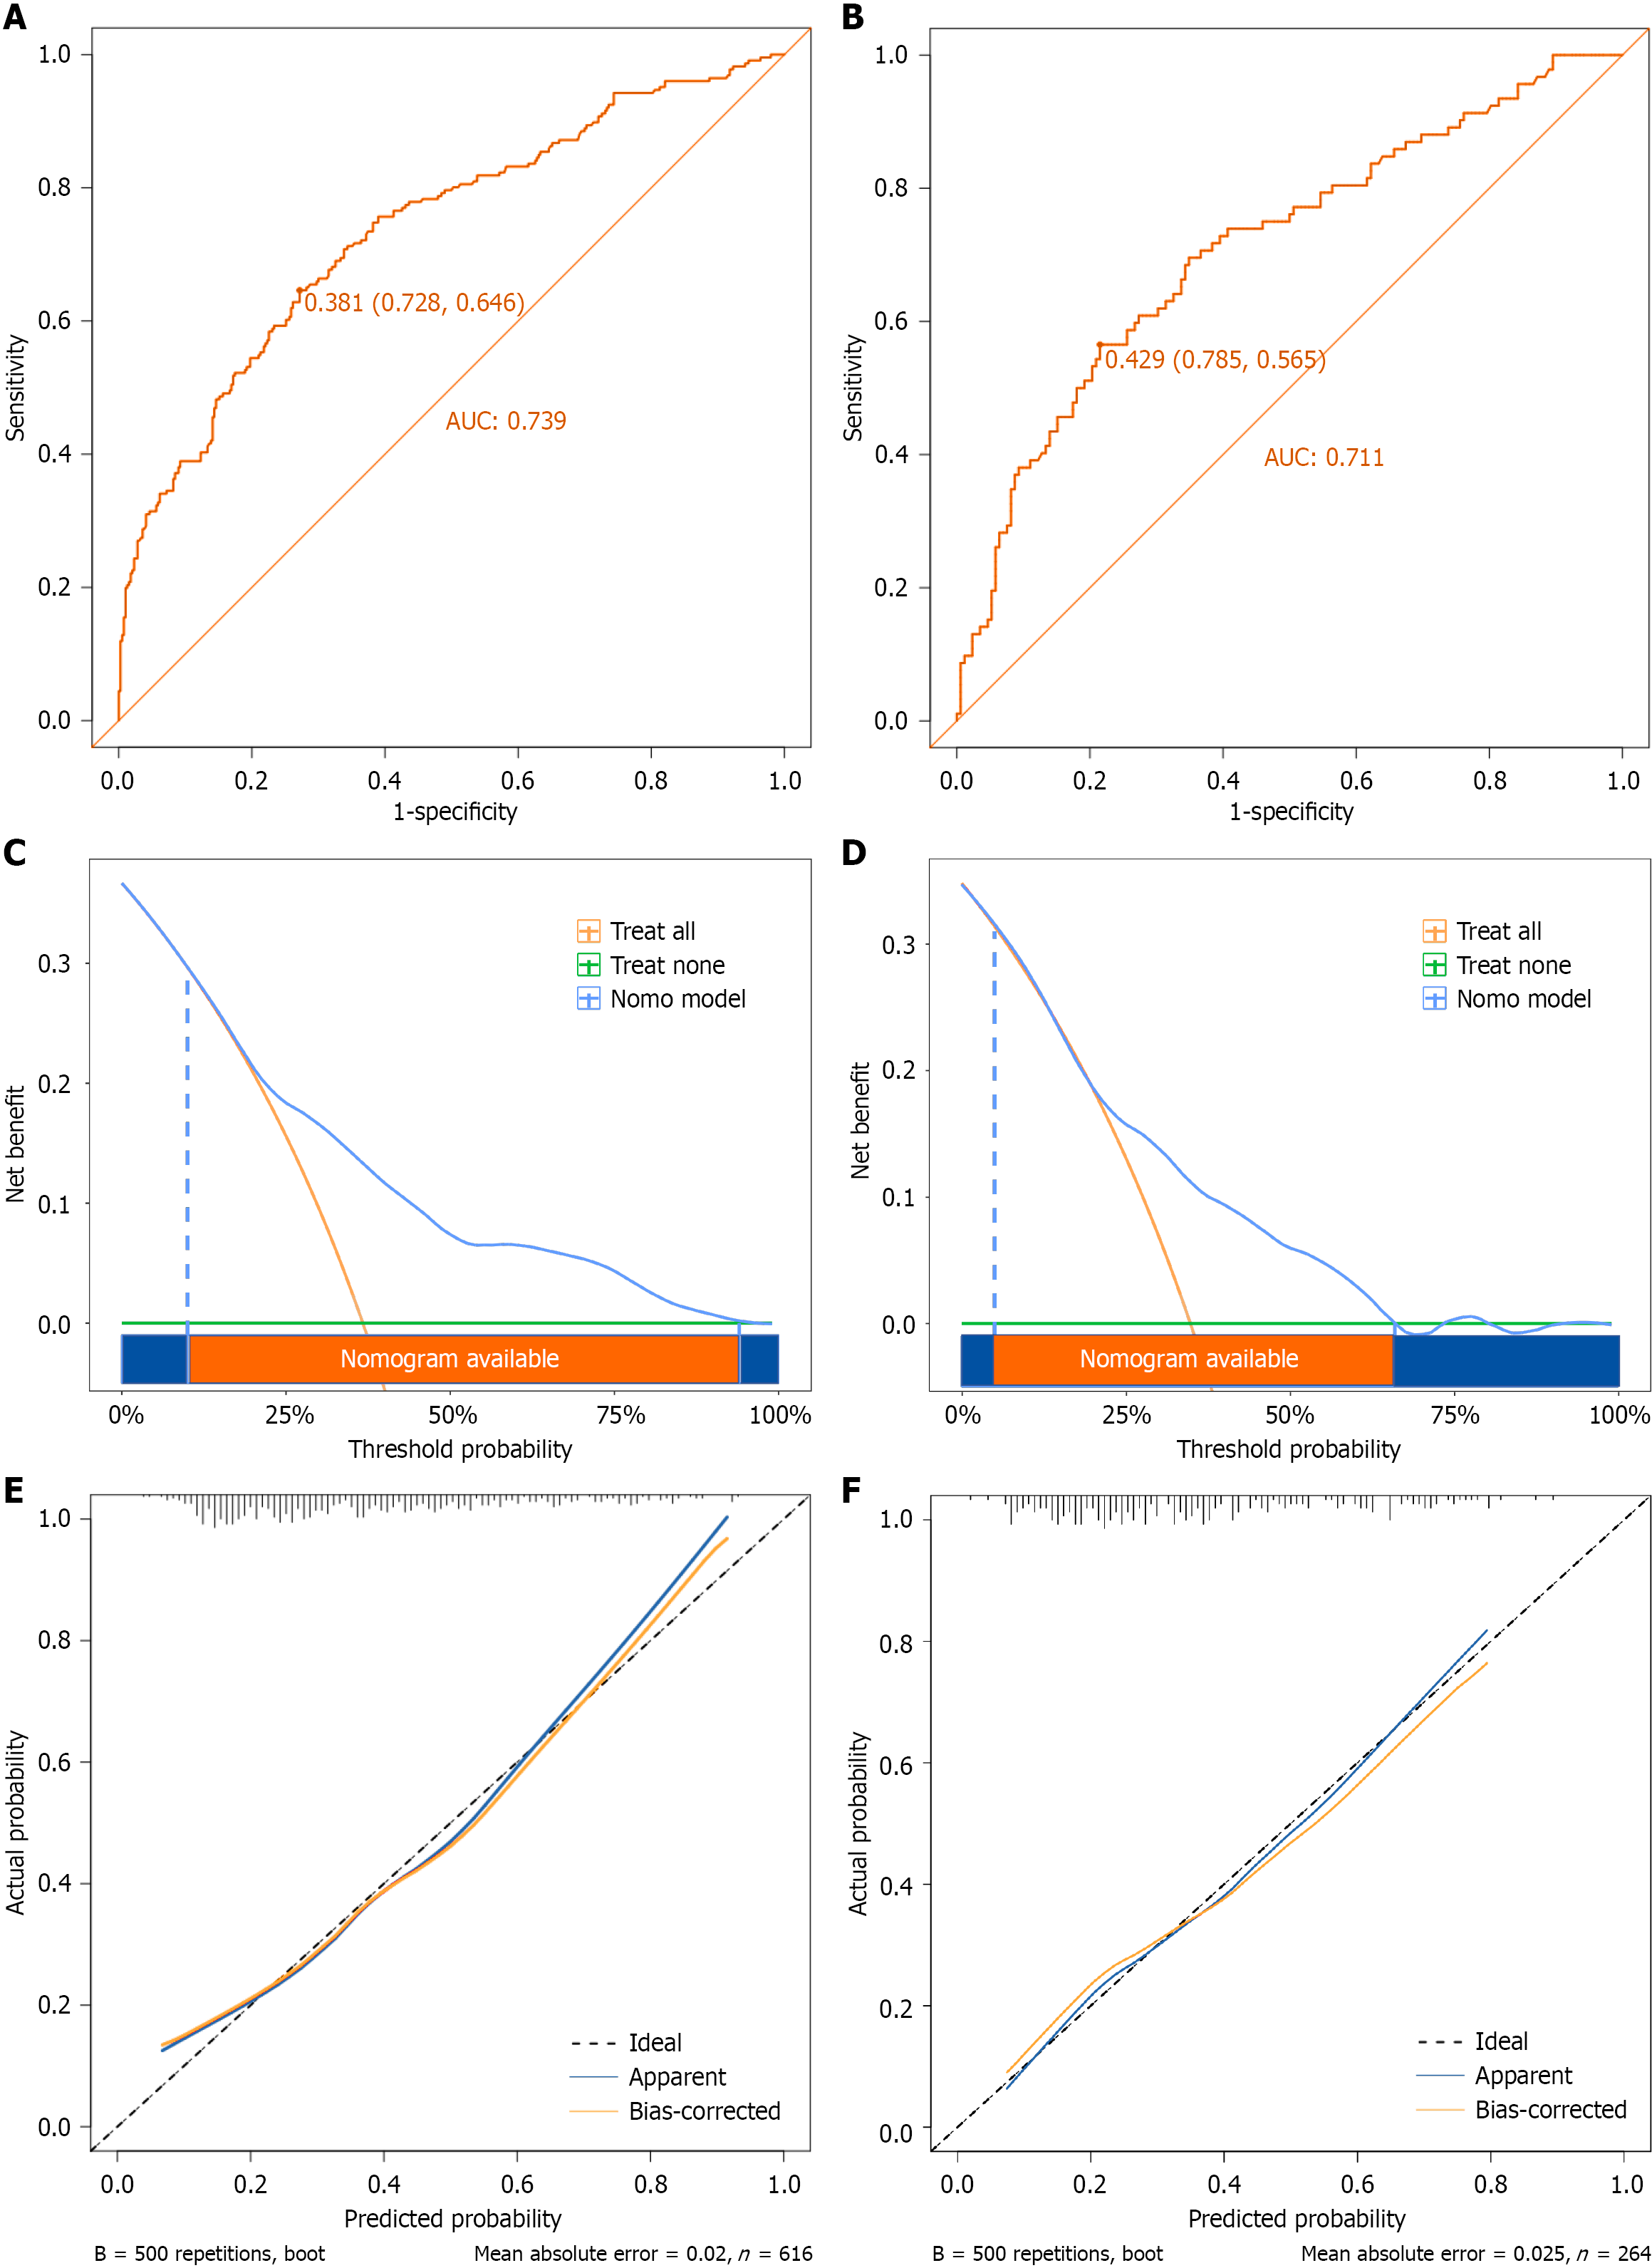
Figure 5 Performance evaluation of the tongue image-clinical nomogram in the training and validation cohorts.
A: Receiver operating characteristic (ROC) curve in the training cohort; B: ROC curve in the validation cohort; C: Decision curve analysis (DCA) in the training cohort; D: DCA in the validation cohort; E: Bootstrap-corrected calibration curve (500 resamples) in the training cohort; F: Bootstrap-corrected calibration curve (500 resamples) in the validation cohort. AUC: Area under the curve.
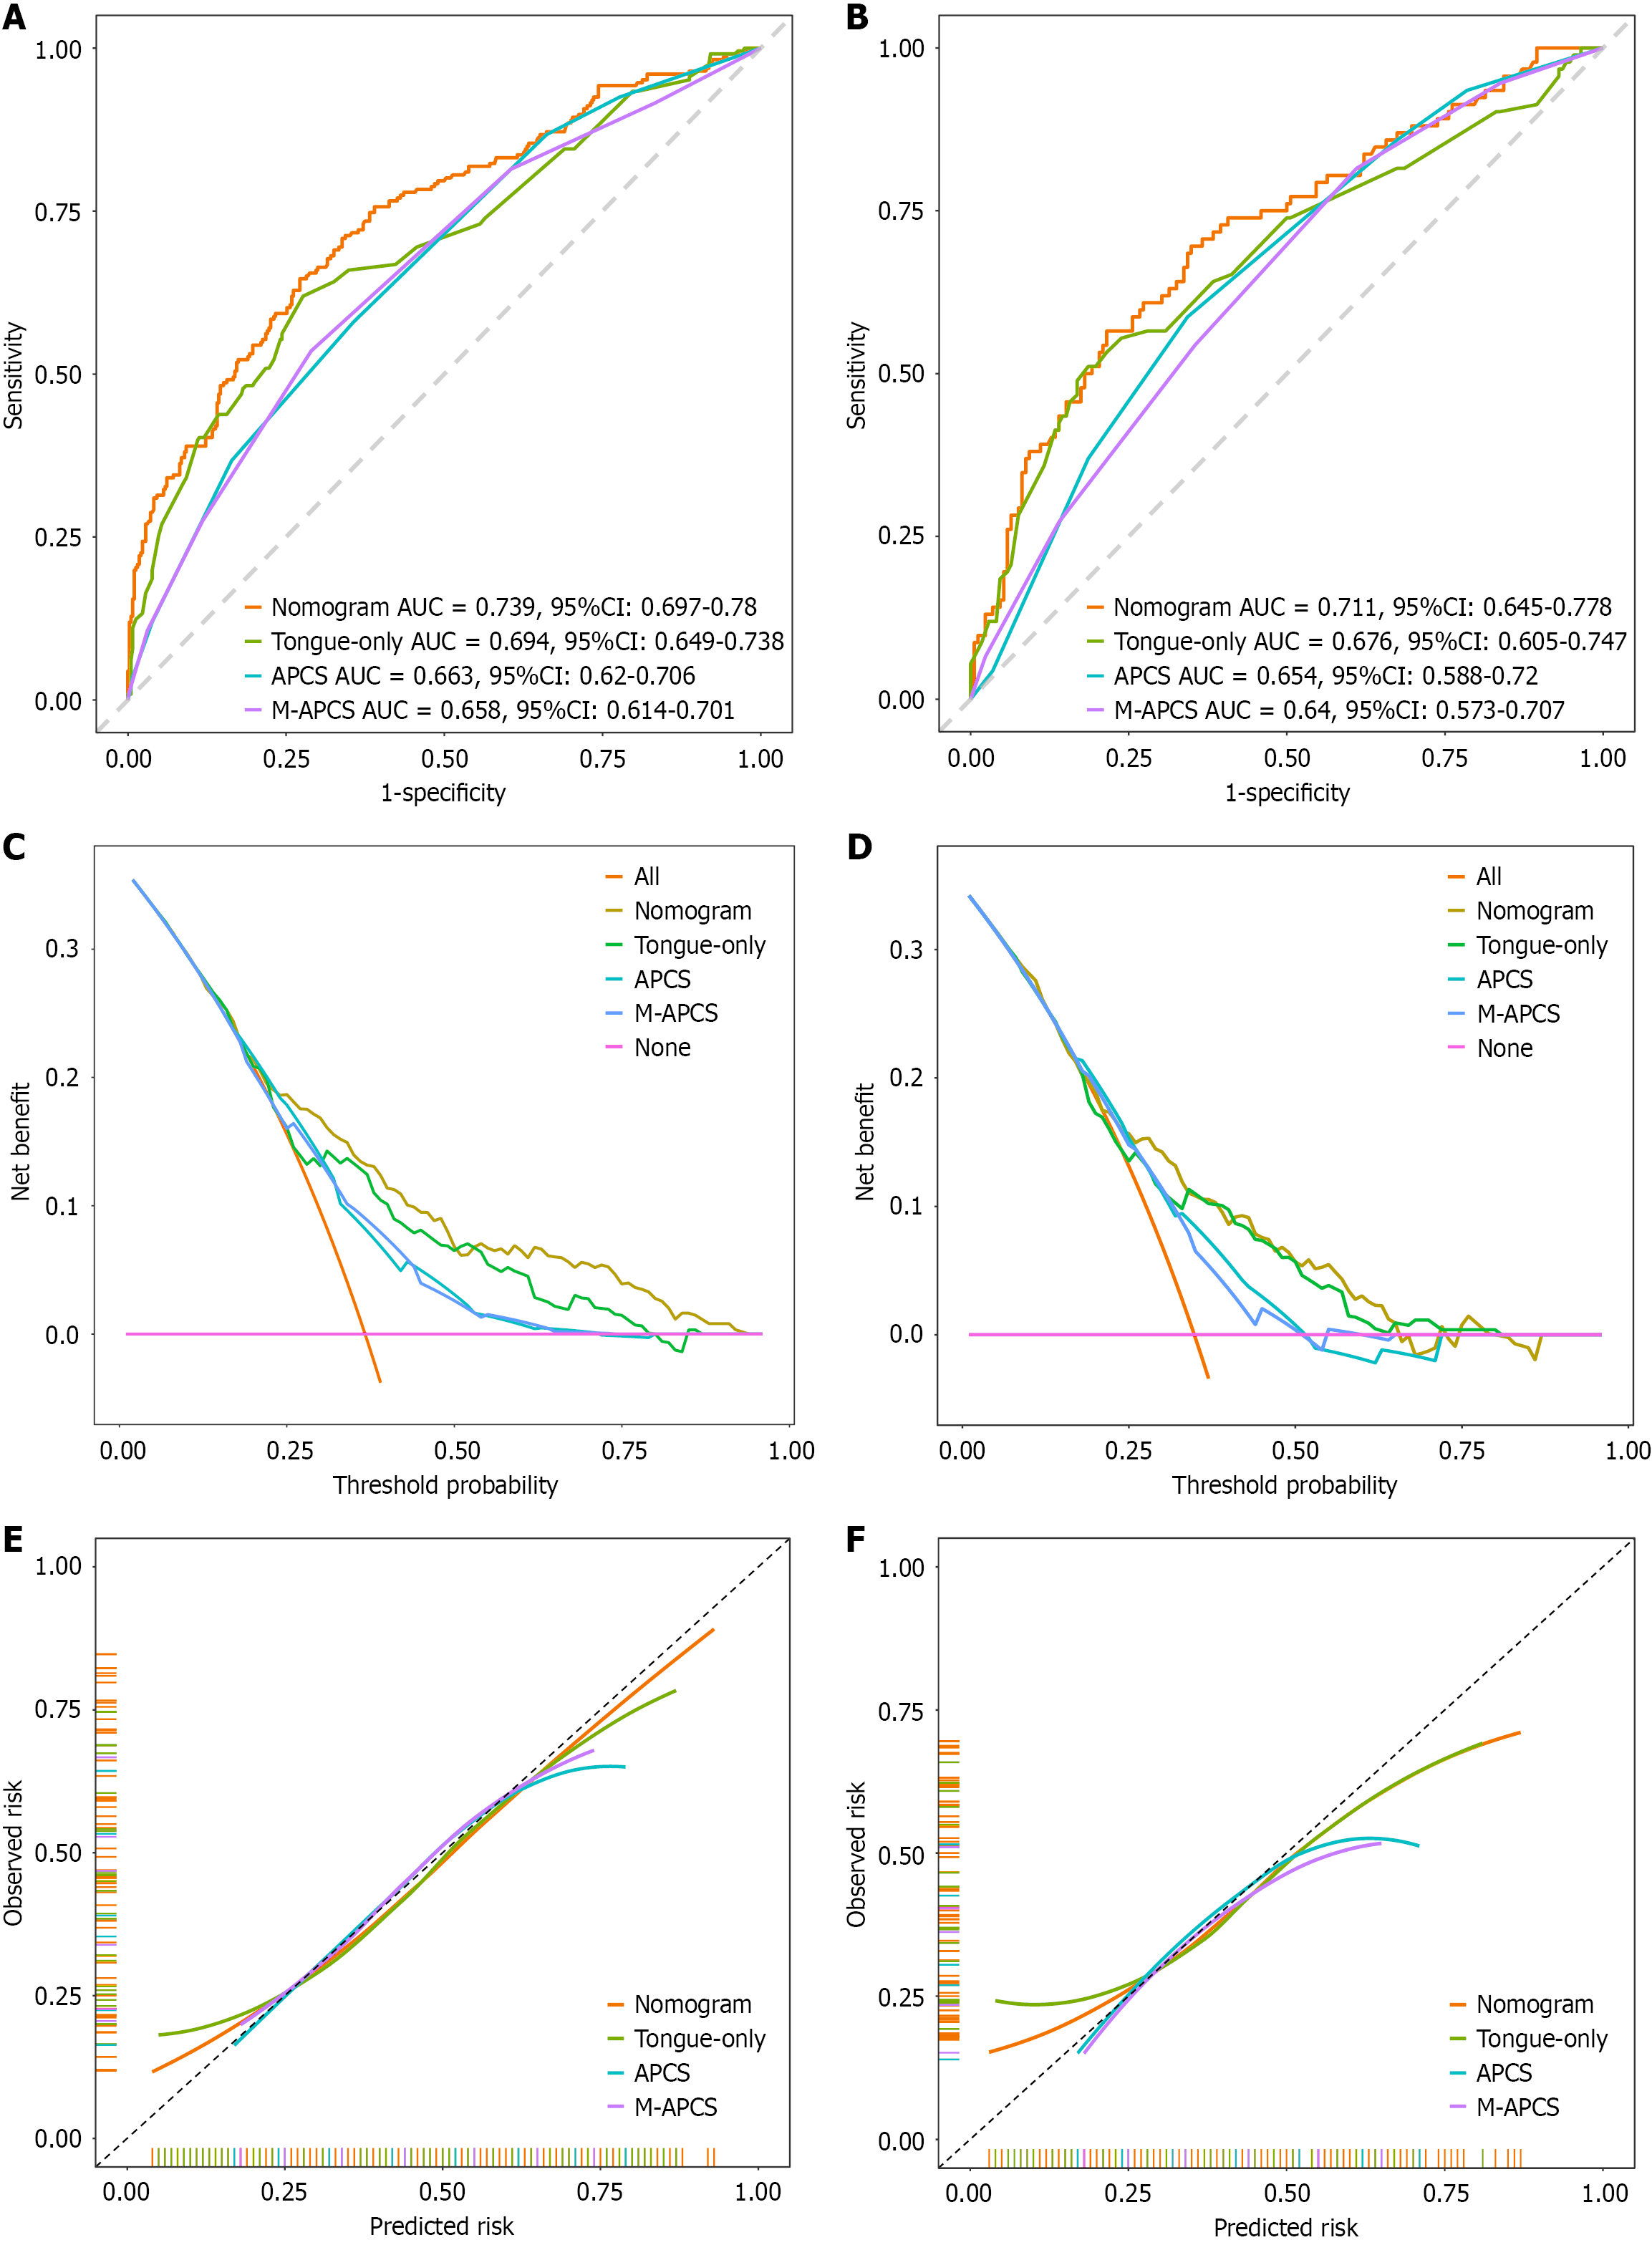
Figure 6 Discrimination, calibration, and decision curve analysis comparing the tongue image-clinical nomogram with the tongue-only model, Asia-Pacific colorectal screening score, and modified Asia-Pacific colorectal screening score.
A: Receiver operating characteristic (ROC) curves in the training cohort; B: ROC curves in the validation cohort; C: Decision curve analysis (DCA) in the training cohort; D: DCA in the validation cohort; E: Calibration curves in the training cohort; F: Calibration curves in the validation cohort. APCS: Asia-Pacific colorectal screening; M-APCS: Modified Asia-Pacific colorectal screening; AUC: Area under the curve; CI: Confidence interval.
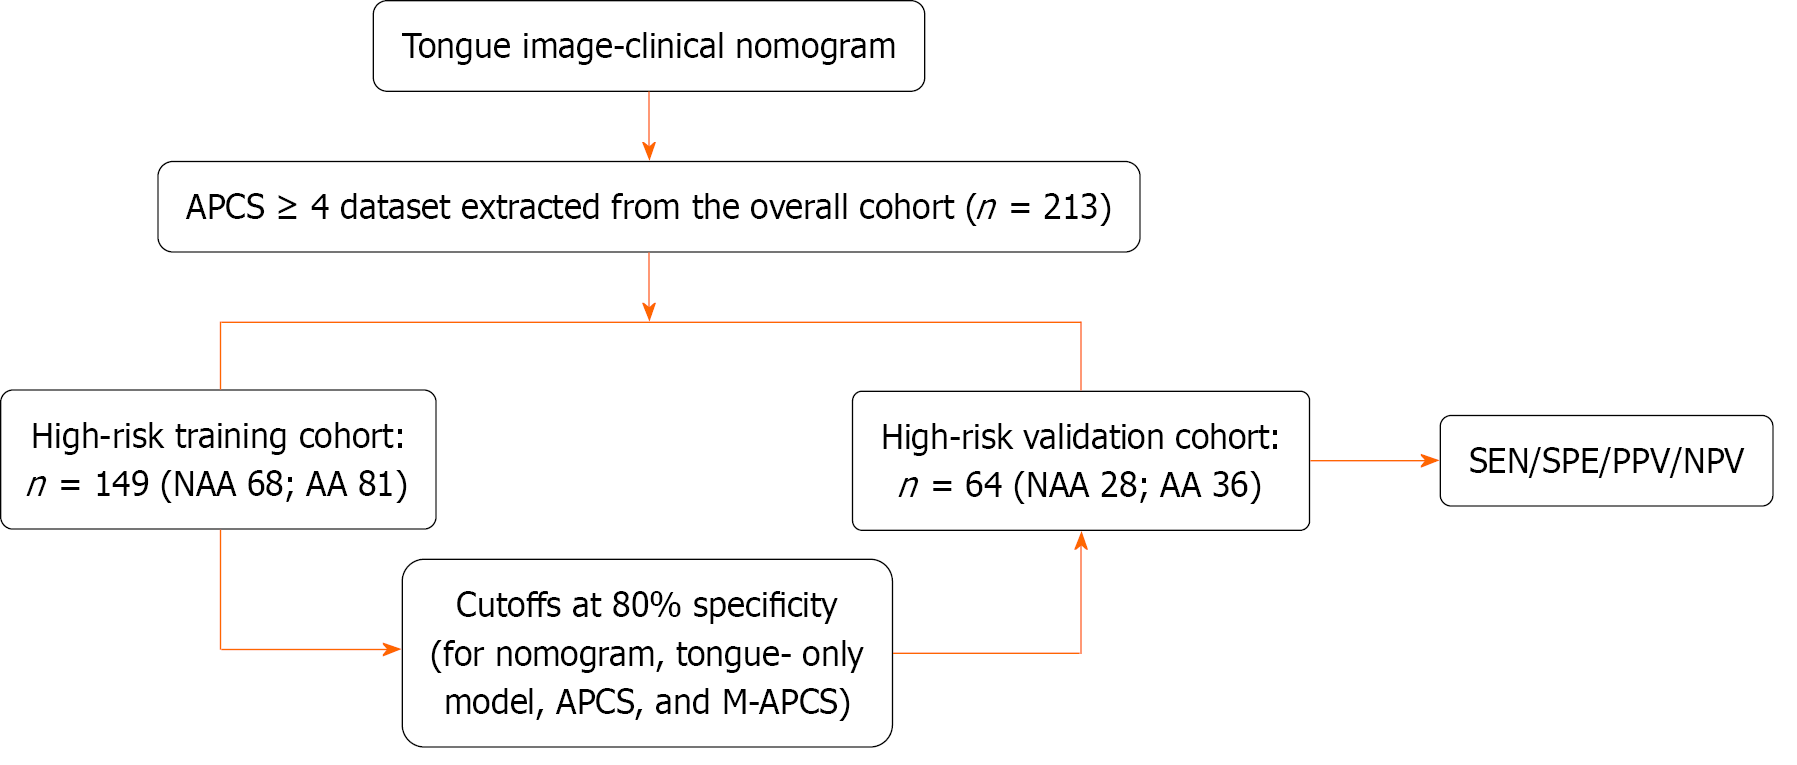
Figure 7 Workflow of the high-risk dataset for the Asia-Pacific colorectal screening score ≥ 4 analysis.
AA: Advanced adenoma; NAA: Nonadvanced adenoma; APCS: Asia-Pacific colorectal screening; M-APCS: Modified Asia-Pacific colorectal screening; NPV: Negative predictive value; PPV: Positive predictive value; SEN: Sensitivity; SPE: Specificity.
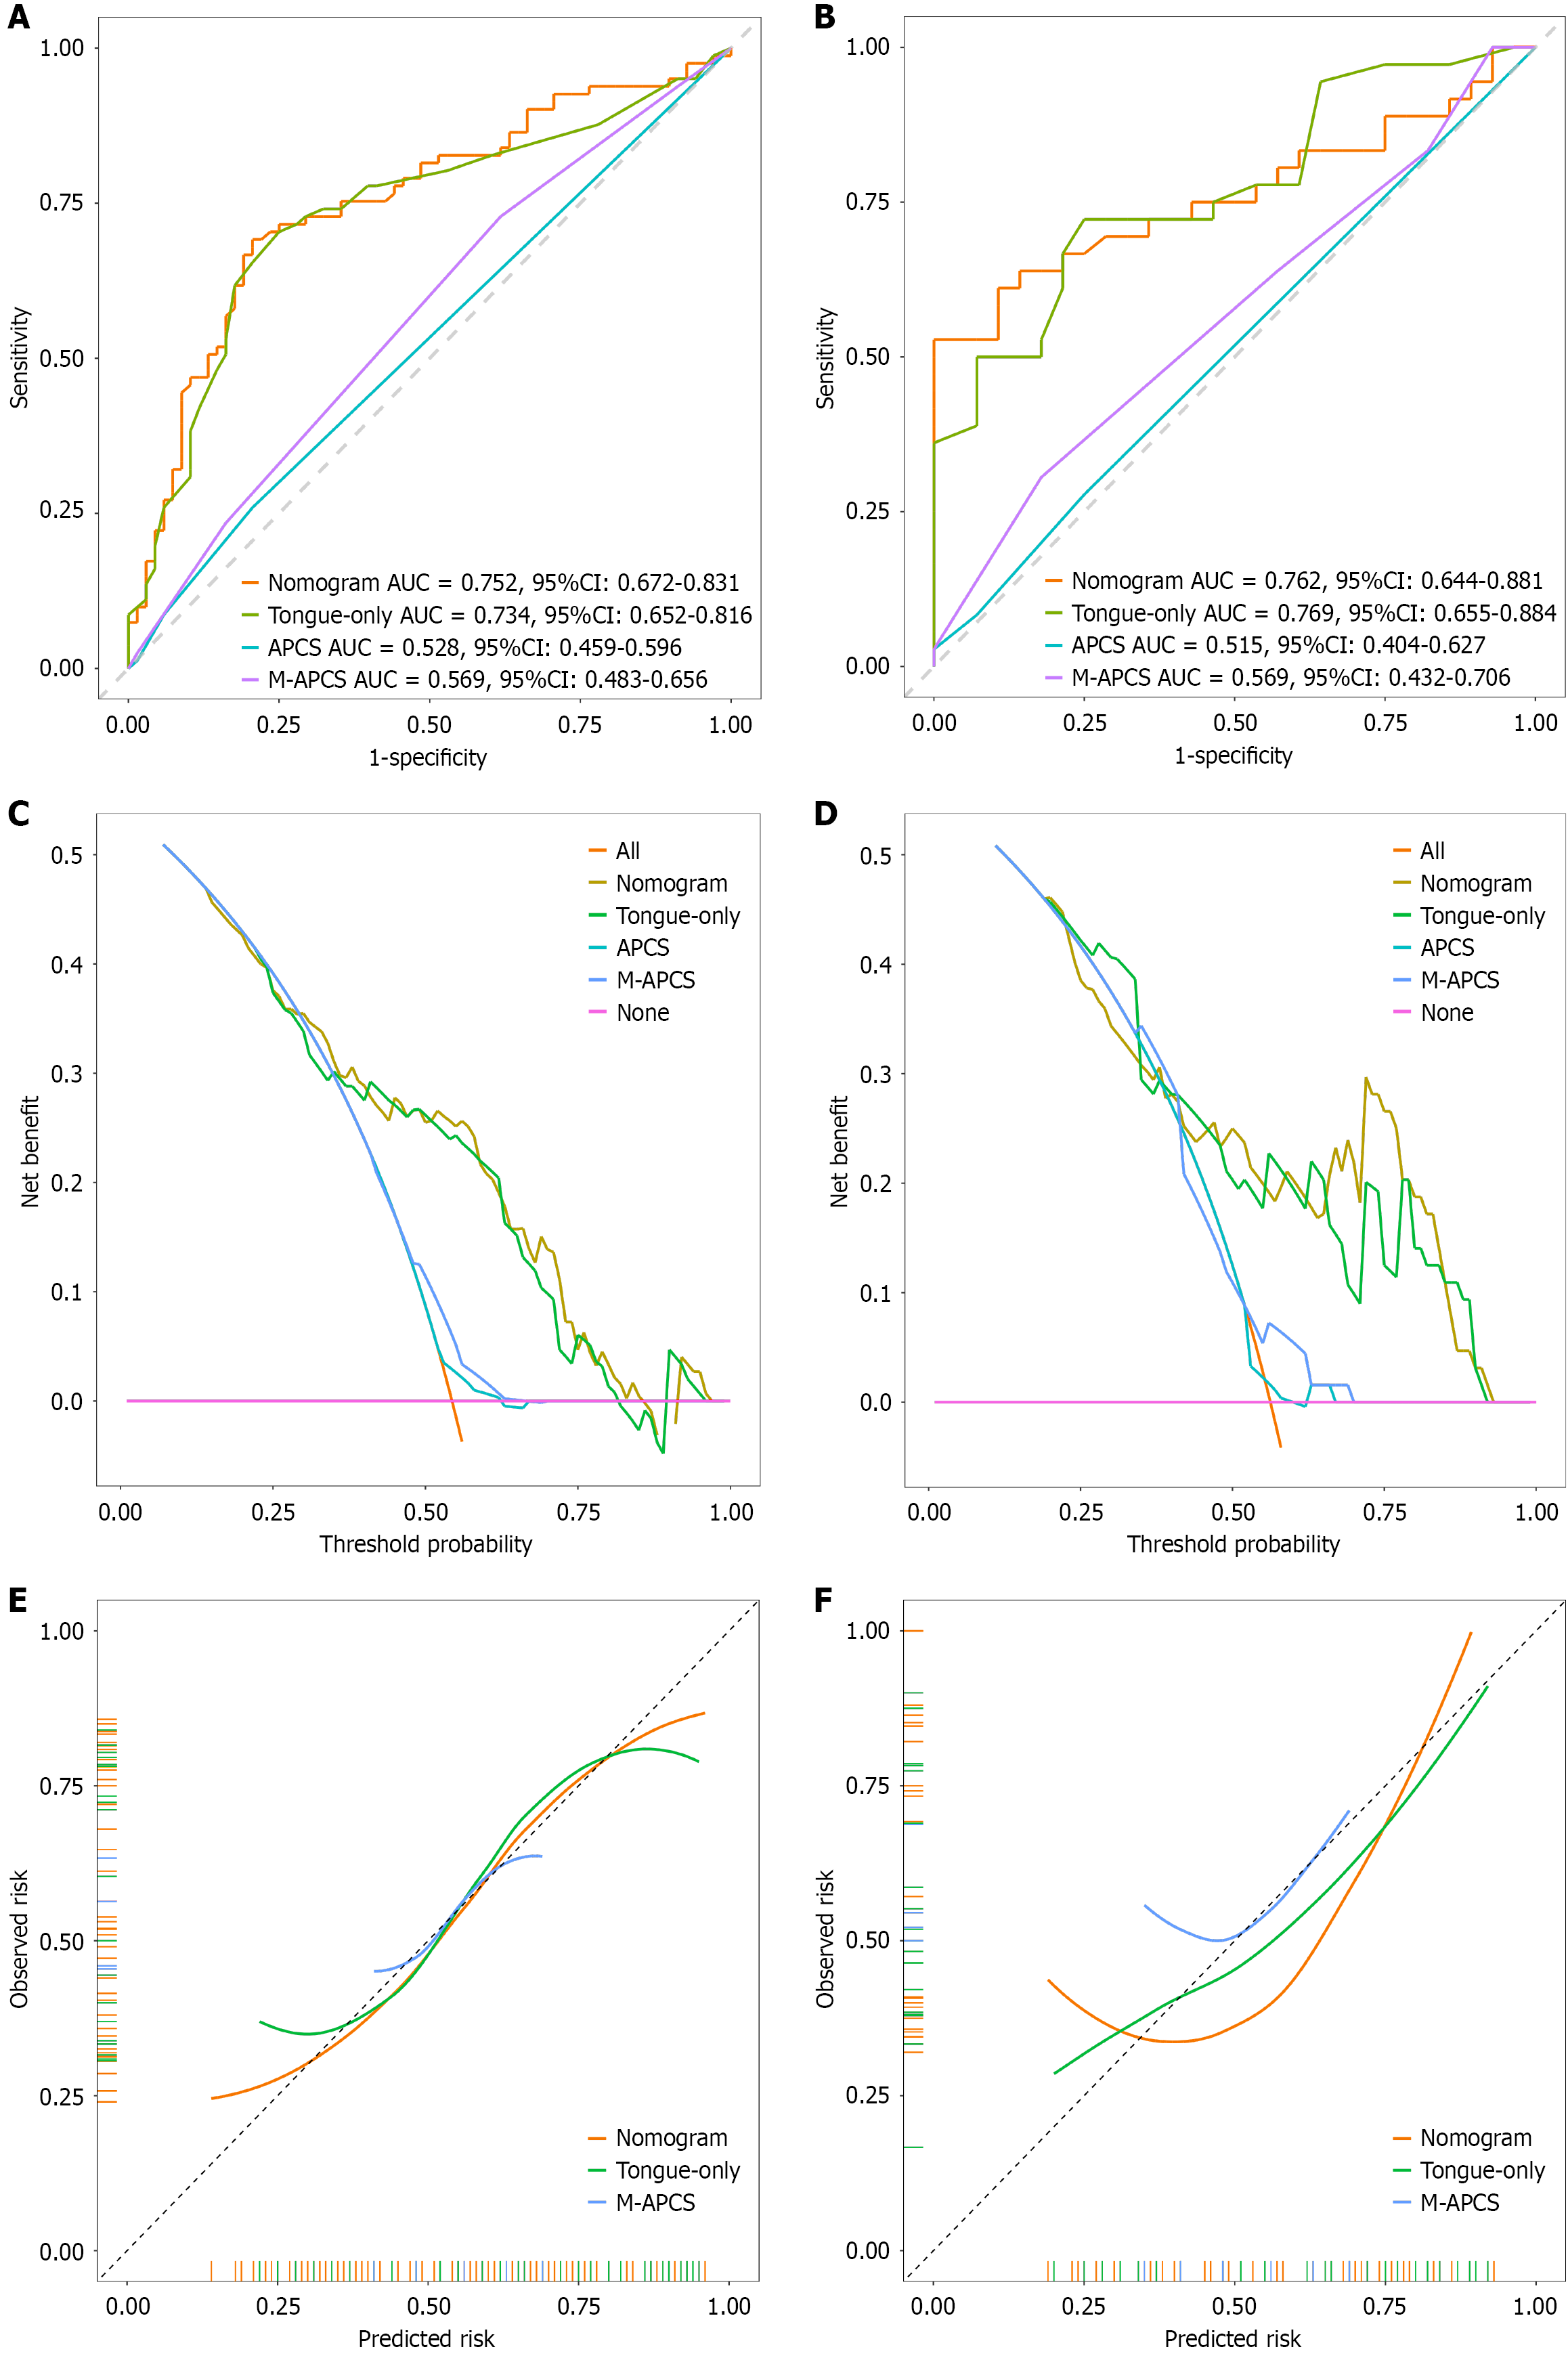
Figure 8 Comparison of tongue-based models and conventional risk scores in the Asia-Pacific colorectal screening score ≥ 4 high-risk subgroup.
A: Receiver operating characteristic (ROC) curves of the tongue image-clinical nomogram, tongue-only model, Asia-Pacific colorectal screening (APCS) score, and modified APCS score in the high-risk training cohort; B: ROC curves of the four approaches in the high-risk validation cohort; C: Decision curve analysis (DCA) in the high-risk training cohort, in which the all and none lines represent the treat-all and treat-none strategies, respectively; D: DCA in the high-risk validation cohort; E: Calibration curves in the high-risk training cohort; F: Calibration curves in the high-risk validation cohort. APCS: Asia-Pacific colorectal screening; M-APCS: Modified Asia-Pacific colorectal screening; AUC: Area under the curve; CI: Confidence interval.
- Citation: Zhang J, Zhu ML, Xie YX, Fan YQ, Zhang W, Liu SS, Yu XM, Wang W, Fu XY. Development and validation of a tongue image-clinical nomogram for detection of advanced colorectal adenoma. World J Gastroenterol 2026; 32(33): 119646
- URL: https://www.wjgnet.com/1007-9327/full/v32/i33/119646.htm
- DOI: https://dx.doi.org/10.3748/wjg.119646