
















Copyright: ©Author(s) 2026.
World J Gastroenterol. Sep 7, 2026; 32(33): 117979
Published online Sep 7, 2026. doi: 10.3748/wjg.117979
Published online Sep 7, 2026. doi: 10.3748/wjg.117979
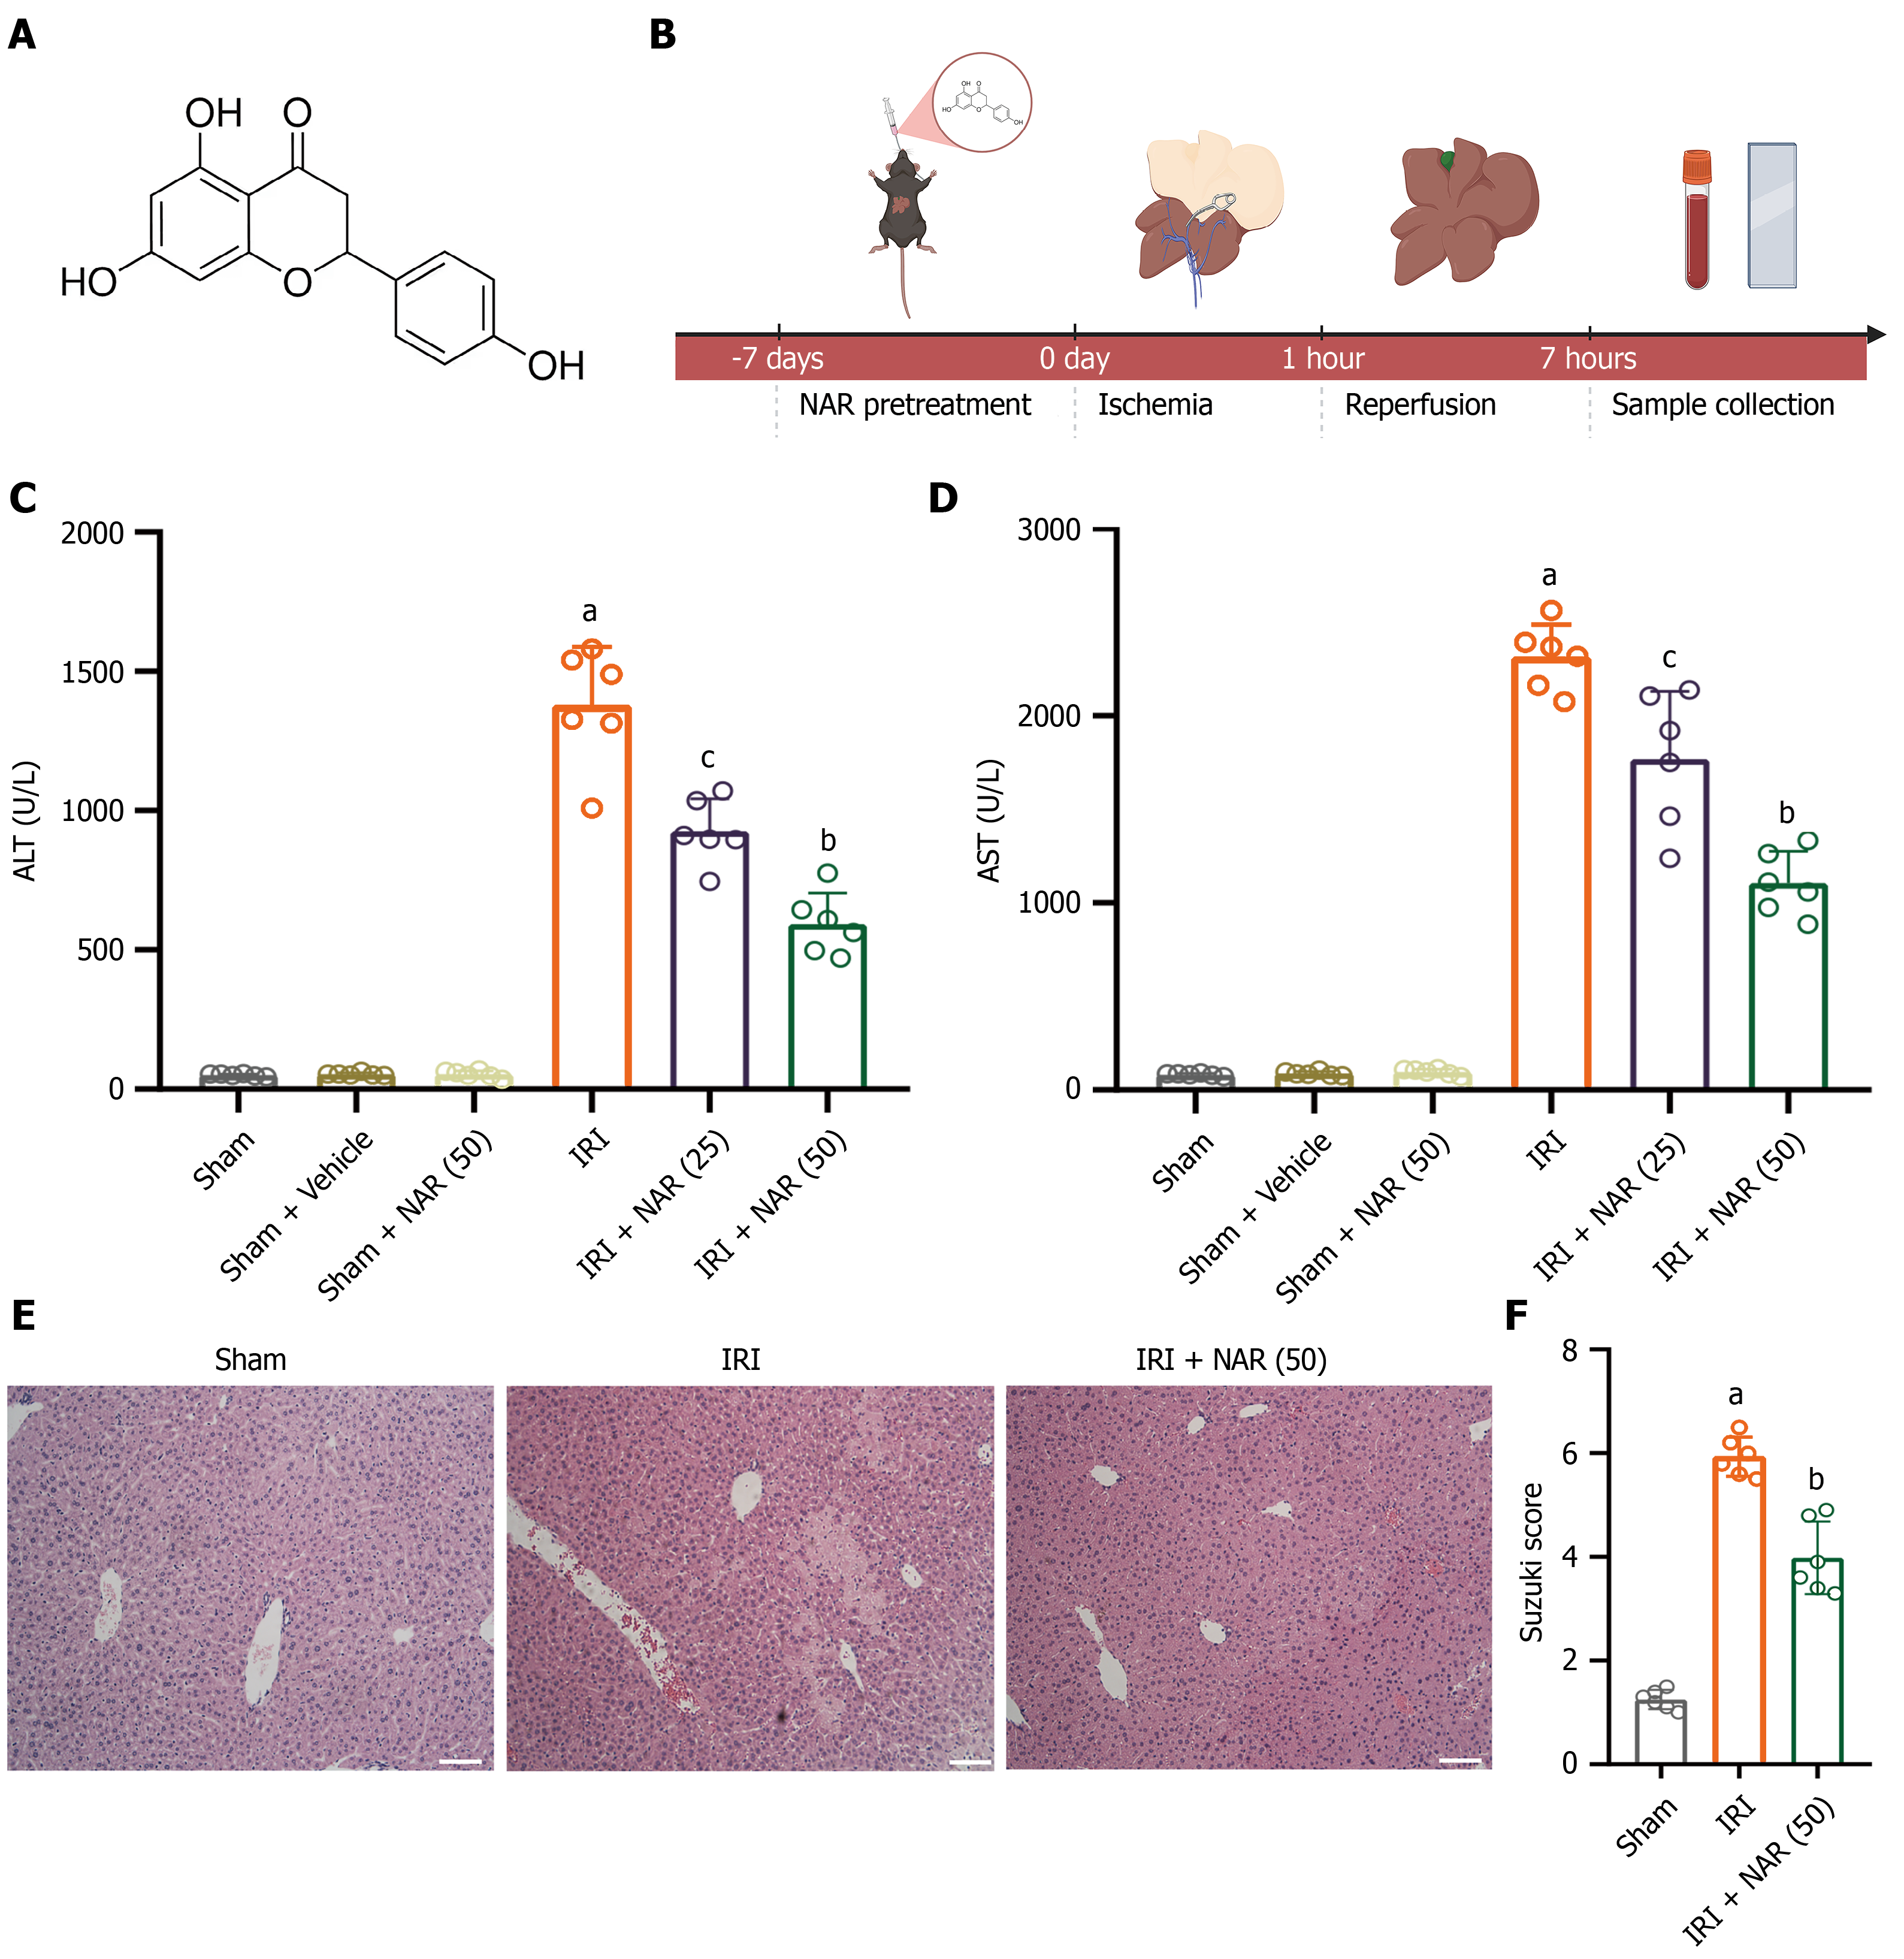
Figure 1 Naringenin pretreatment attenuates hepatic ischemia-reperfusion injury in mice.
A: Chemical structure of naringenin; B: Schematic timeline of naringenin intervention, ischemia-reperfusion injury model establishment and sample collection; C: Serum alanine aminotransferase activity (n = 6); D: Serum aspartate aminotransferase activity (n = 6); E: Hematoxylin and eosin staining of liver tissue; F: Suzuki pathological scores of liver injury based on hematoxylin and eosin staining (n = 6). Scale bar: 100 μm. aP < 0.05 vs the Sham group, bP < 0.05 vs the ischemia-reperfusion injury group, cP < 0.05 vs the ischemia-reperfusion injury + naringenin (50) group. NAR: Naringenin; ALT: Alanine aminotransferase; IRI: Ischemia-reperfusion injury; AST: Aspartate aminotransferase.
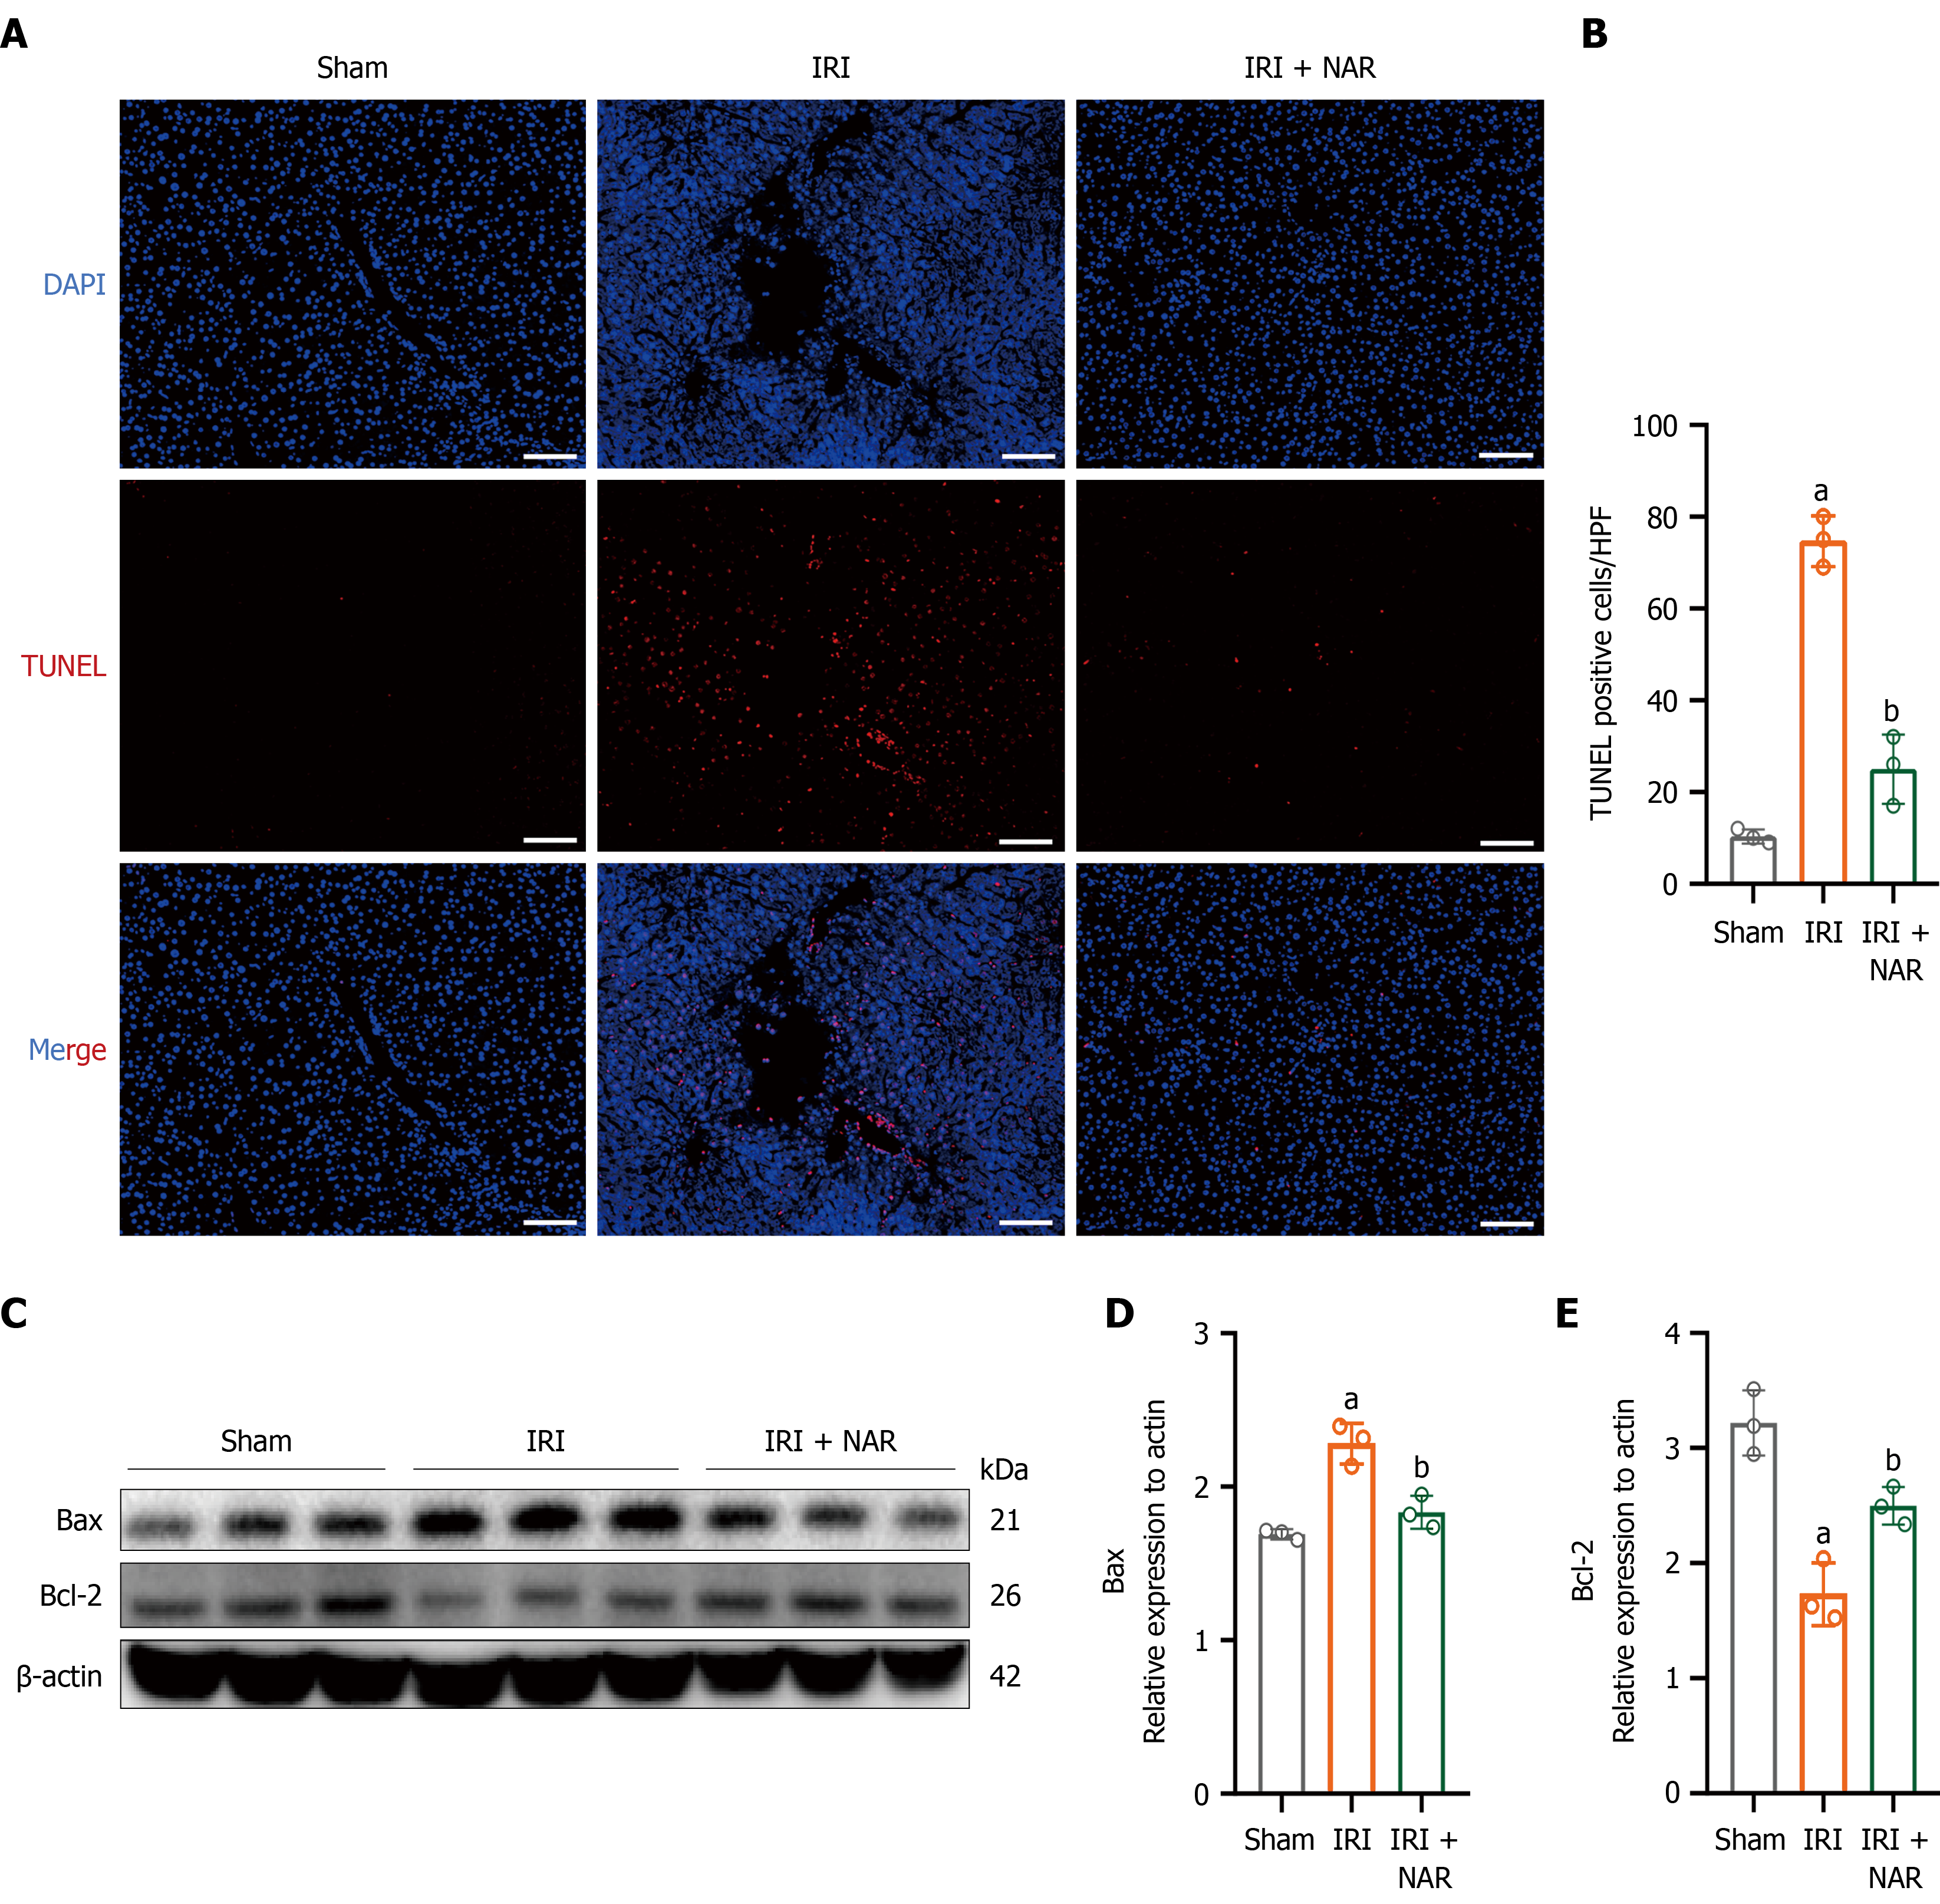
Figure 2 Naringenin attenuates hepatocyte apoptosis induced by hepatic ischemia-reperfusion injury.
A: TUNEL staining showing apoptotic cells in liver tissues; B: Quantitative analysis of TUNEL-positive cells (n = 3); C: Western blots showing protein expression levels of Bax and Bcl-2; D and E: Densitometric quantification of Bax and Bcl-2 protein levels normalized to β-actin (n = 3). Scale bar: 100 μm. aP < 0.05 vs the Sham group, bP < 0.05 vs the ischemia-reperfusion injury group. NAR: Naringenin; IRI: Ischemia-reperfusion injury.
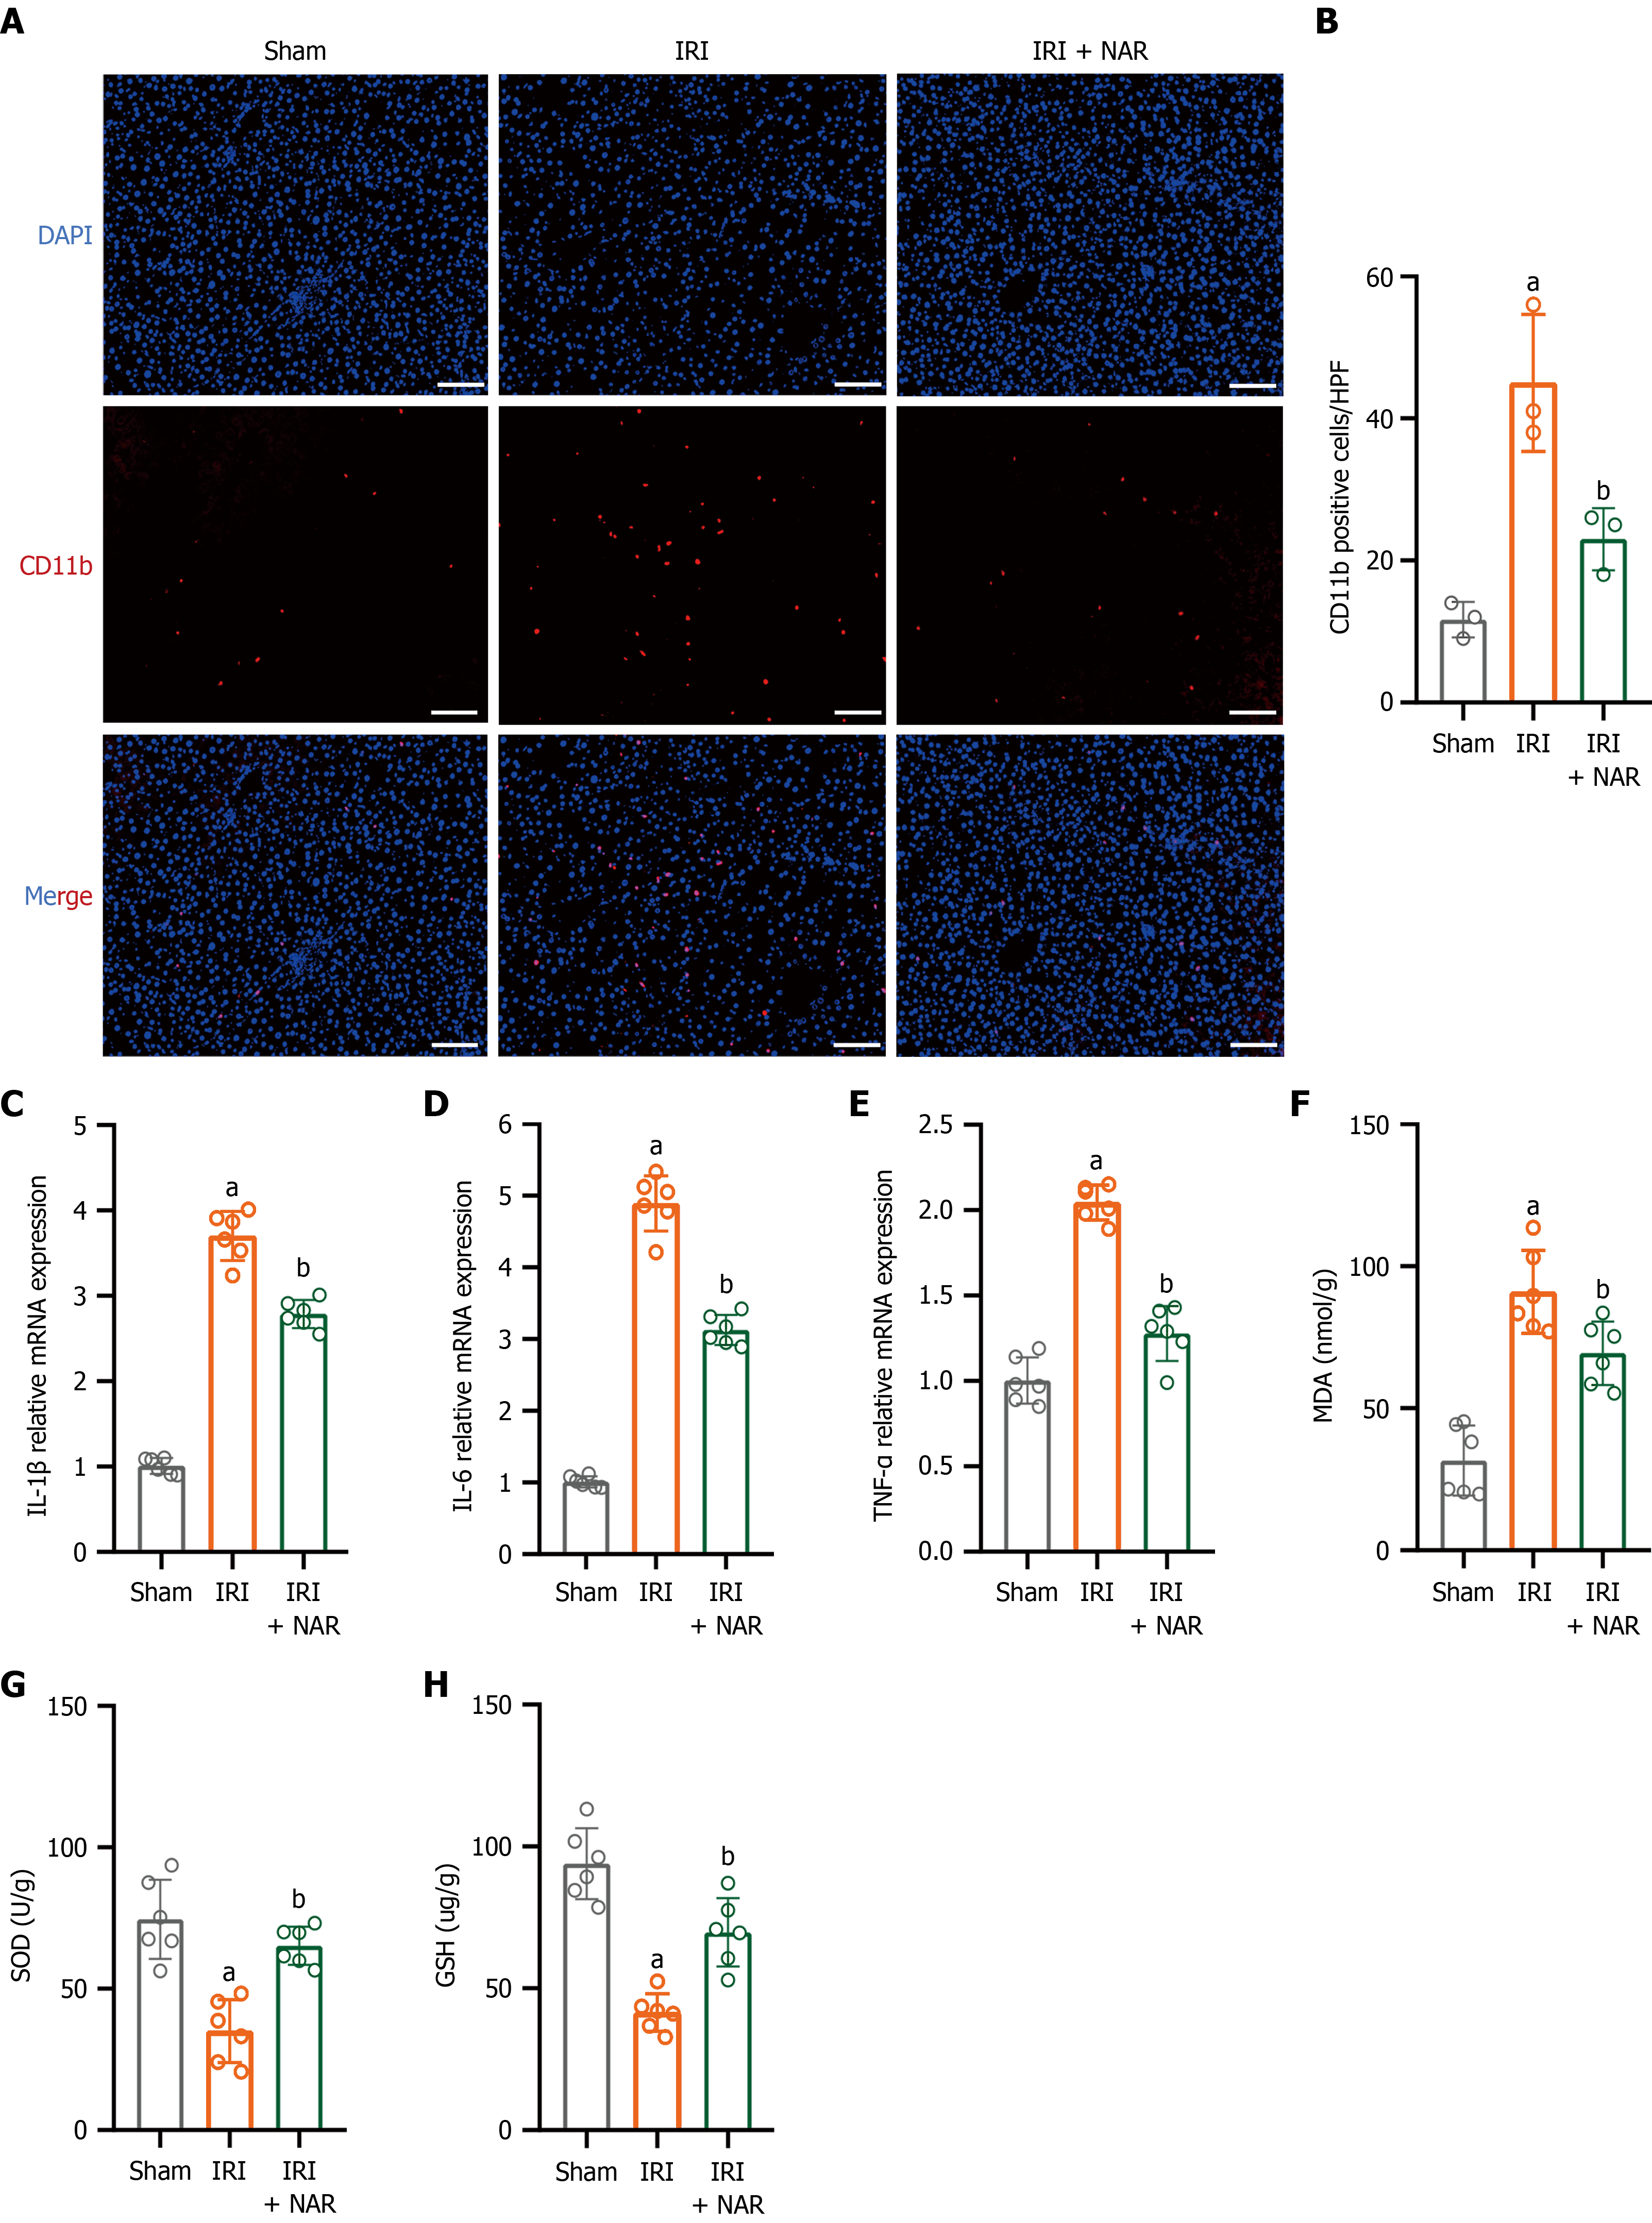
Figure 3 Naringenin pretreatment reduces inflammatory response and oxidative stress in hepatic ischemia-reperfusion injury.
A: Immunofluorescence staining images of CD11b+ cells in liver tissues; B: Quantitative analysis of CD11b+ positive cells (n = 3); C: MRNA expression levels of pro-inflammatory cytokines interleukin-1β (n = 3); D: MRNA expression levels of pro-inflammatory cytokines interleukin-6 (n = 3); E: MRNA expression levels of pro-inflammatory cytokines tumor necrosis factor-α (n = 3); F: Levels of malondialdehyde in liver tissue (n = 6); G: Levels of superoxide dismutase in liver tissue (n = 6); H: Levels of reduced glutathione in liver tissue (n = 6). Scale bar: 100 μm. aP < 0.05 vs the Sham group, bP < 0.05 vs the ischemia-reperfusion injury group. NAR: Naringenin; IRI: Ischemia-reperfusion injury; IL: Interleukin; TNF-α: Tumor necrosis factor-α; MDA: Malondialdehyde; SOD: Superoxide dismutase; GSH: Reduced glutathione.
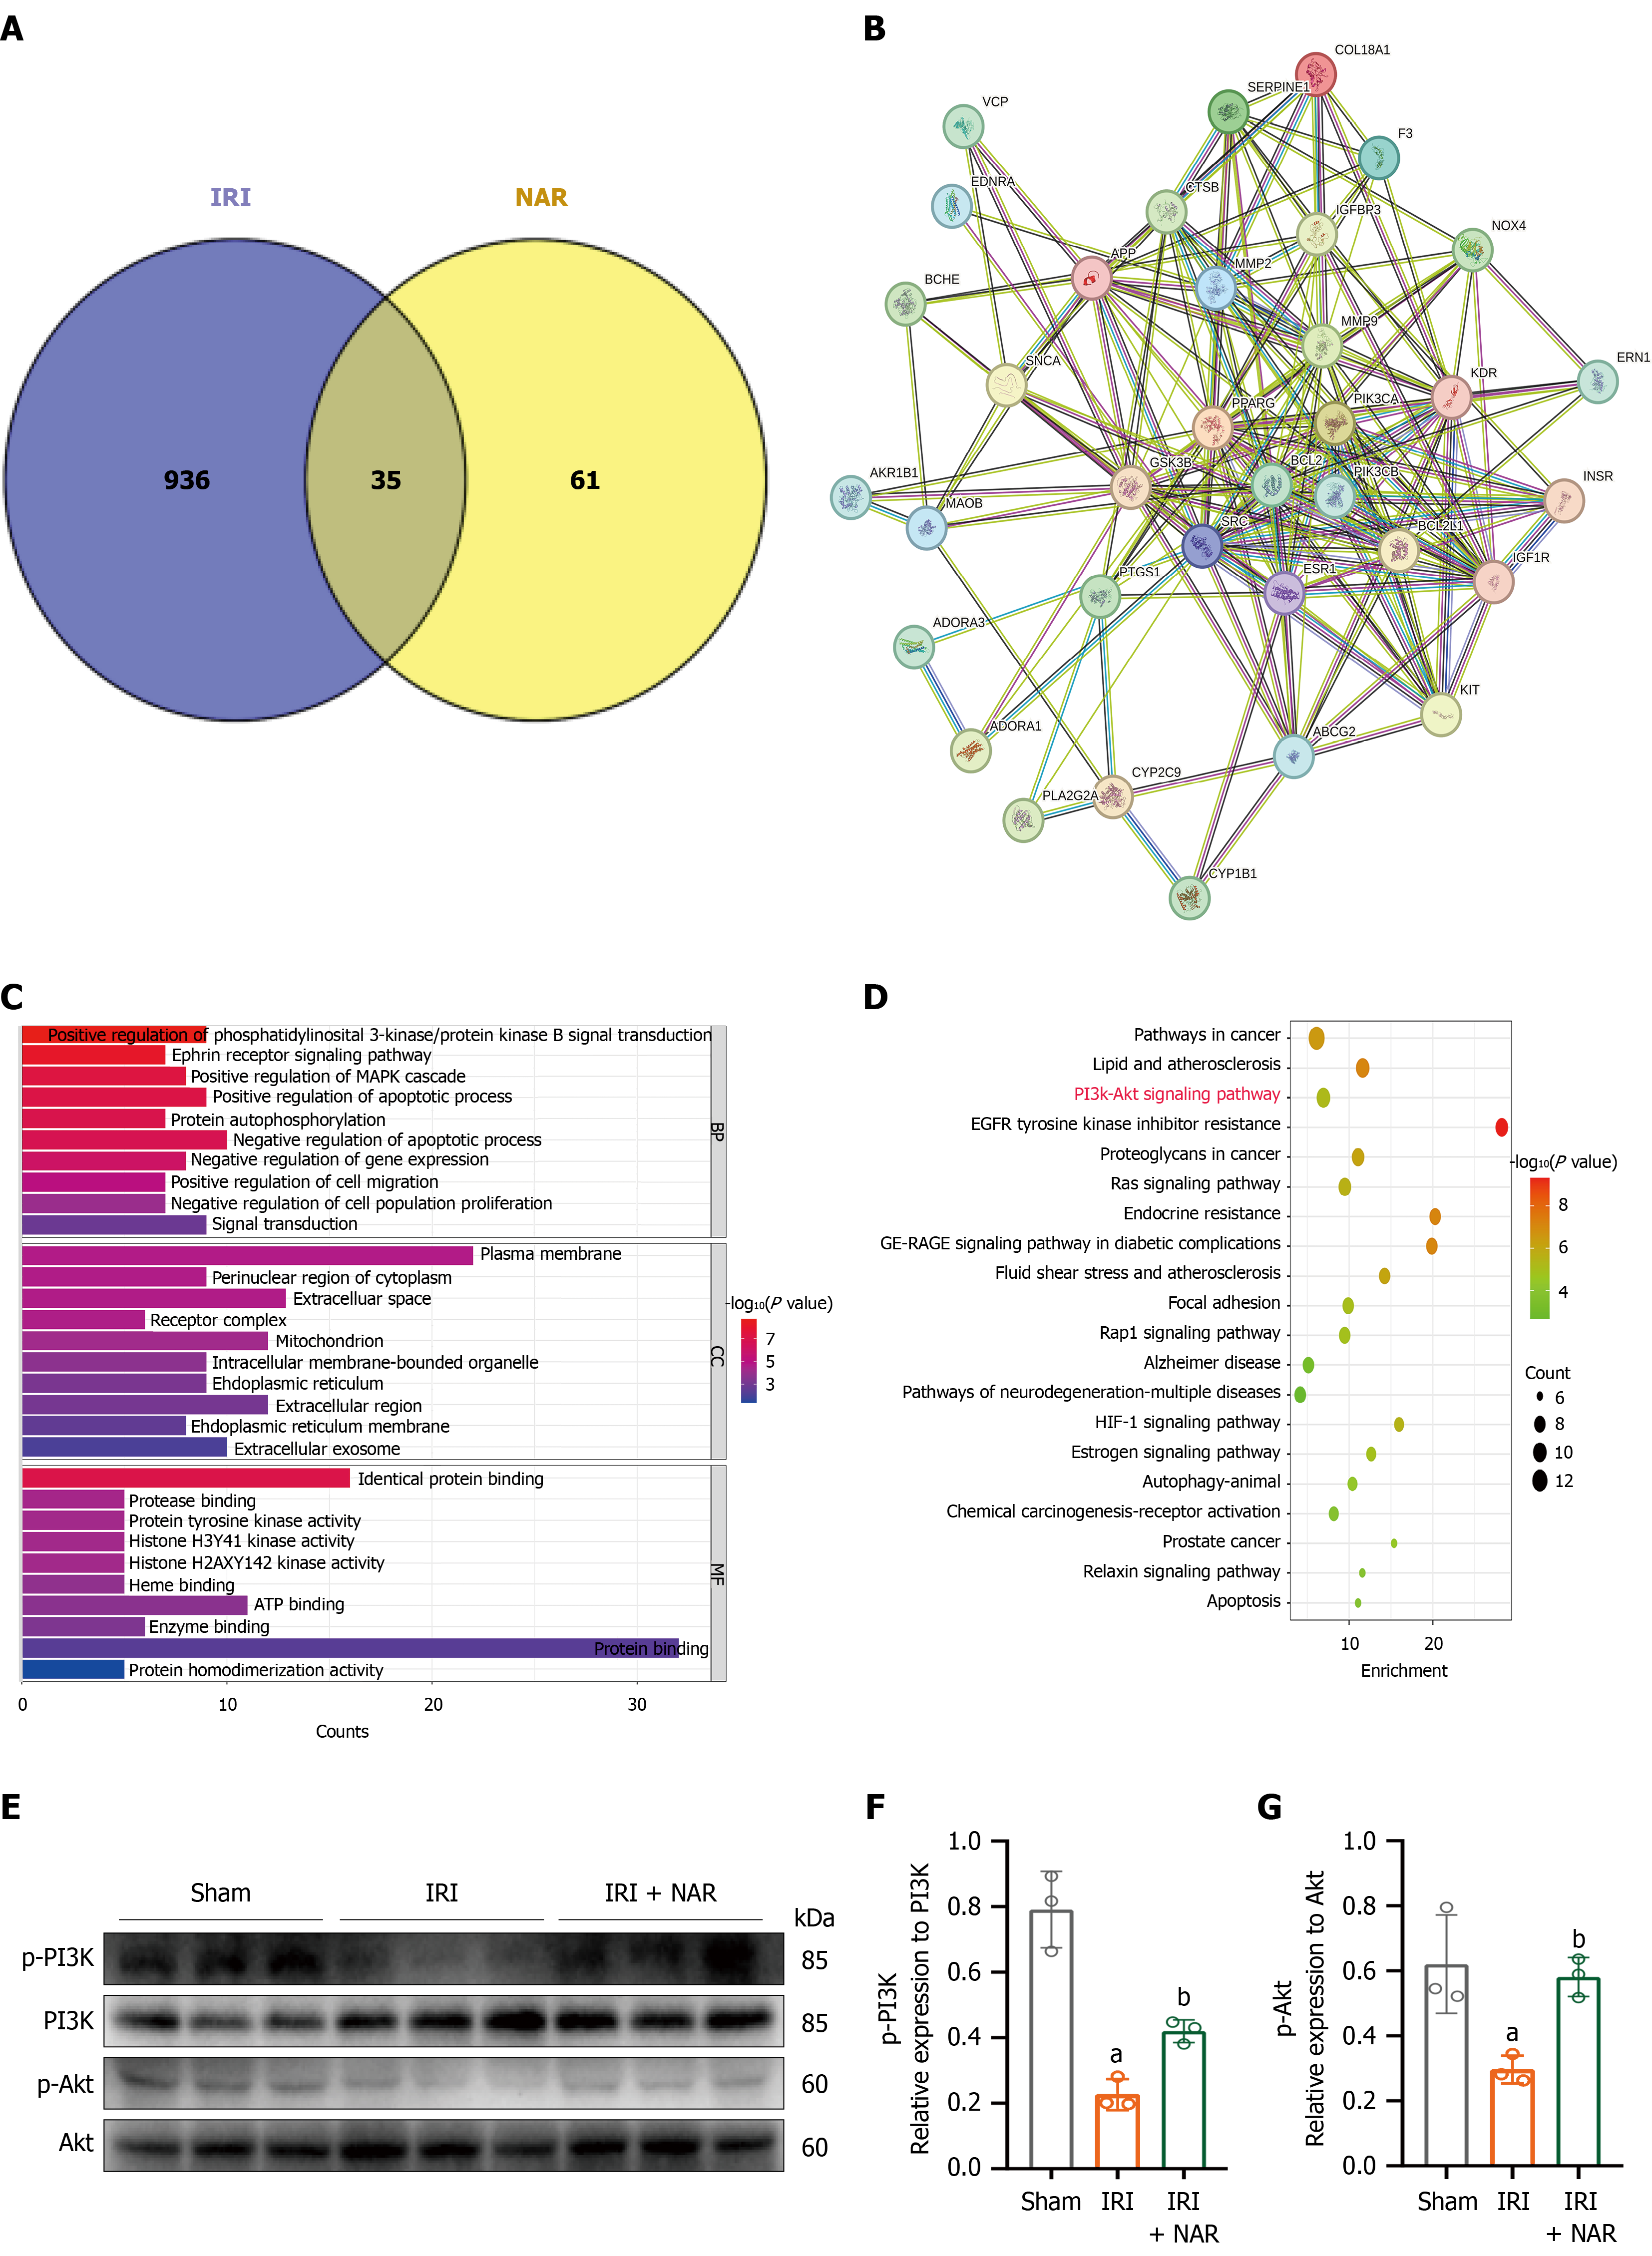
Figure 4 Screen of the mechanisms that naringenin reduces the occurrence of hepatic ischemia-reperfusion injury utilizing network pharmacology analysis.
A: Common genes display of potential target genes of naringenin and liver ischemia-reperfusion injury genes; B: Protein-protein interaction network diagram of naringenin and ischemia-reperfusion injury common genes constructed from String database; C: Gene Ontology analysis of common genes; D: Kyoto Encyclopedia of Genes and Genomes analysis of common genes; E: Western blots showing protein expression levels of p-phosphatidylinositol 3-kinase (PI3K) and p-protein kinase B (Akt); F and G: Densitometric quantification of p-PI3K and p-Akt protein levels normalized to PI3K and Akt (n = 3). aP < 0.05 vs the Sham group, bP < 0.05 vs the ischemia-reperfusion injury group. NAR: Naringenin; IRI: Ischemia-reperfusion injury; PI3K: Phosphatidylinositol 3-kinase; Akt: Protein kinase B.
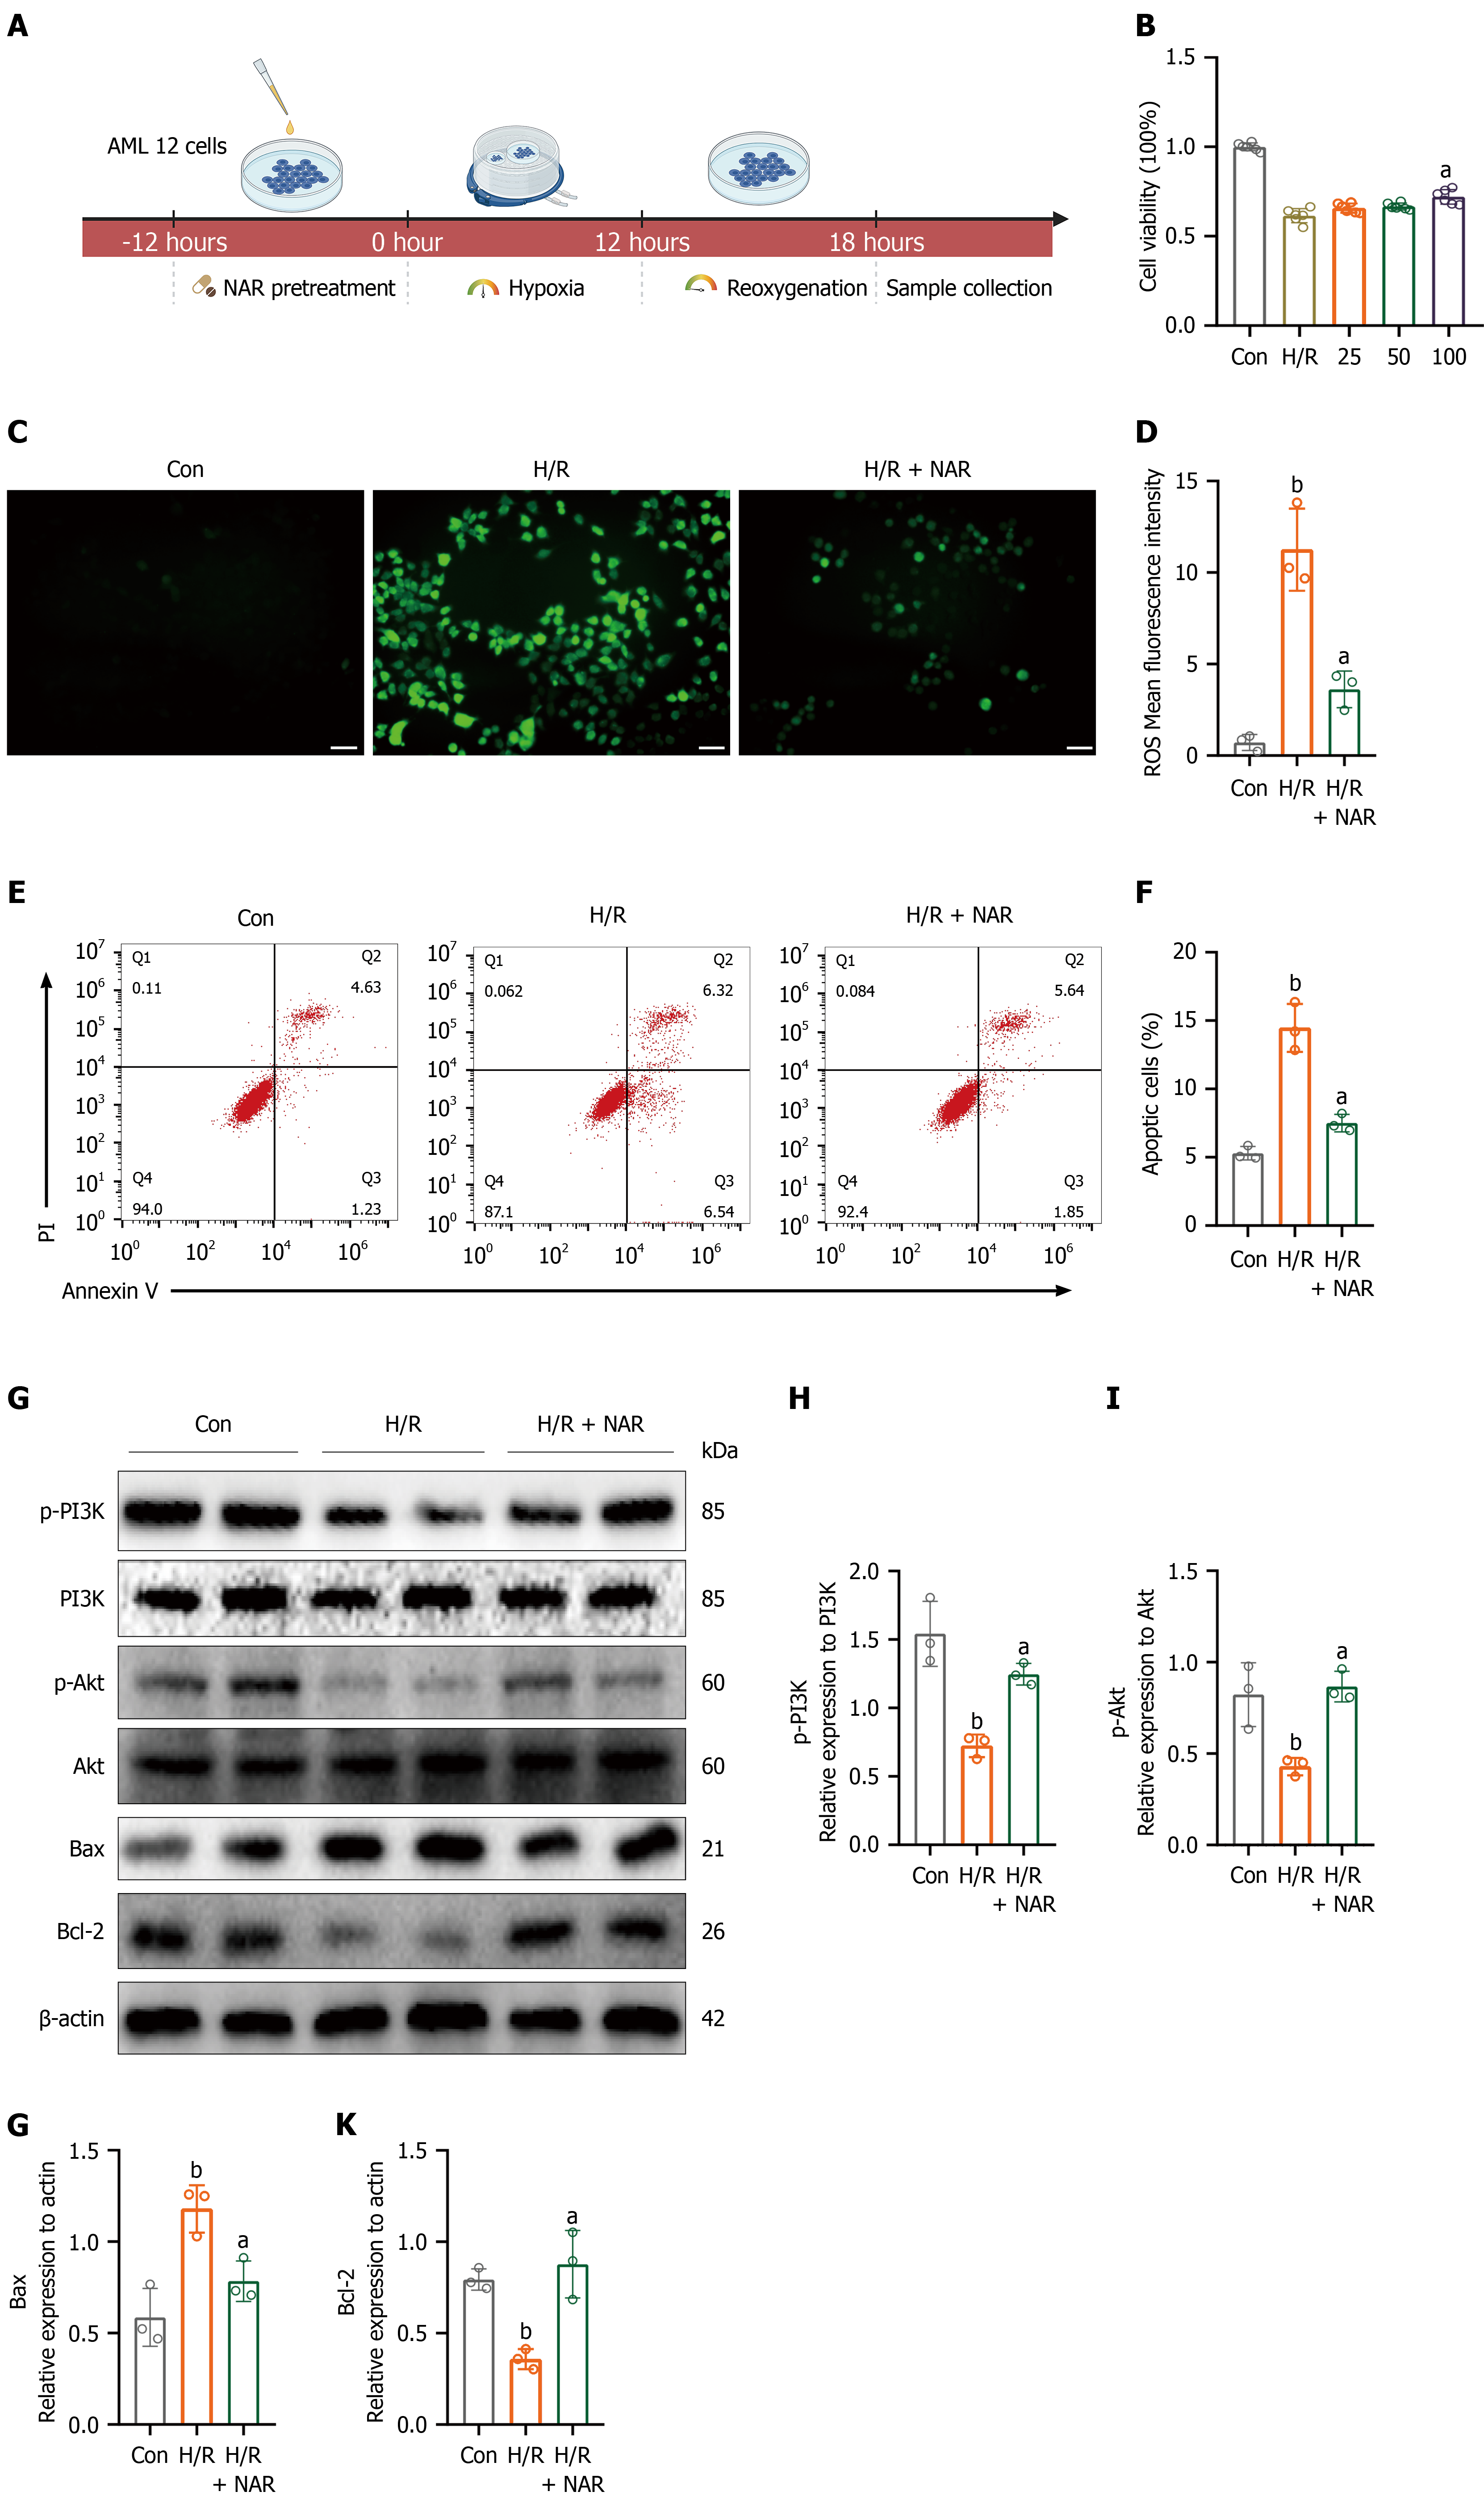
Figure 5 In vitro naringenin ameliorates hypoxia/reoxygenation-induced injury in AML12 cells.
A: In vitro AML12 cells experimental procedure; B: Cell counting kit-8 experiment detects cell viability (n = 6); C: Reactive oxygen species in situ detection assay; D: Quantification of mean reactive oxygen species fluorescence intensity (n = 3); E: Apoptosis detection by flow cytometry; F: Statistical analysis of apoptotic cell rate (n = 3); G: Western blots showing protein expression levels of p-phosphatidylinositol 3-kinase, p-protein kinase B, Bax and Bcl-2; H-K: Densitometric quantification of p-phosphatidylinositol 3-kinase, p-protein kinase B, Bax and Bcl-2 (n = 3). Scale bar: 50 μm. aP < 0.05 vs the hypoxia/reoxygenation group, bP < 0.05 vs the control group. NAR: Naringenin; IRI: Ischemia-reperfusion injury; PI3K: Phosphatidylinositol 3-kinase; Akt: Protein kinase B; H/R: Hypoxia/reoxygenation.
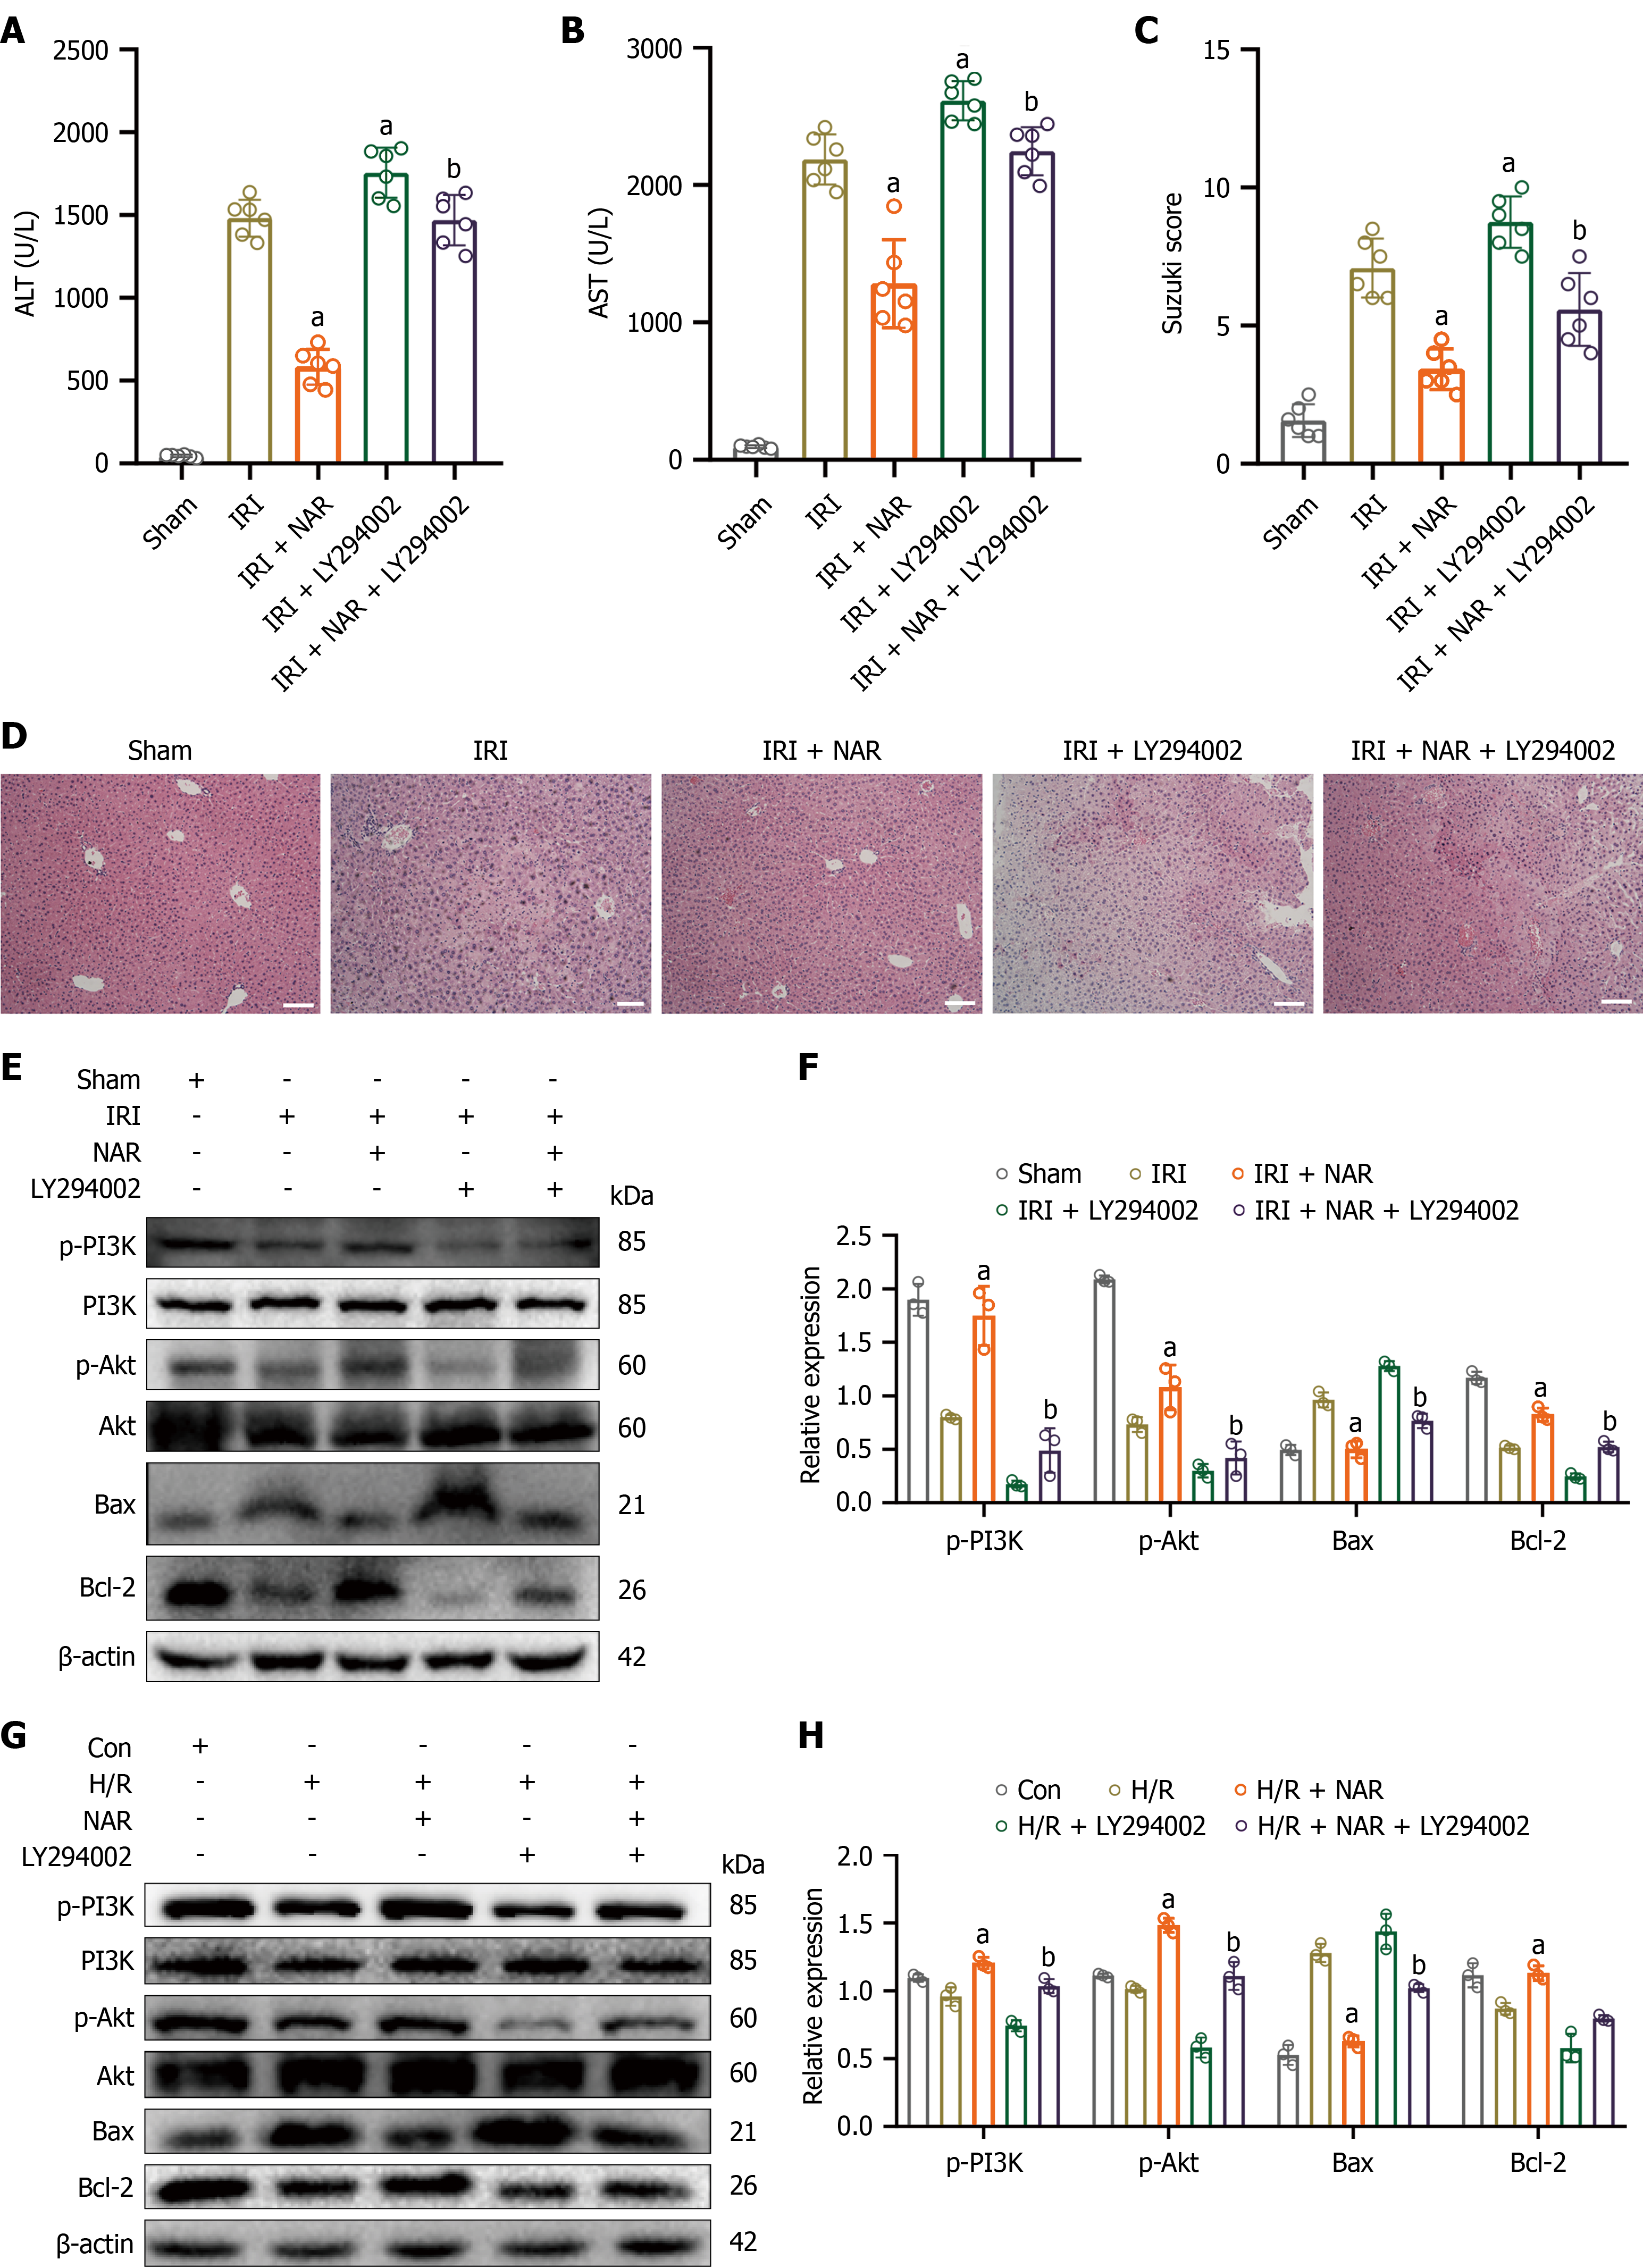
Figure 6 Naringenin attenuates hepatic ischemia-reperfusion injury through activation of the phosphatidylinositol 3-kinase-protein kinase B signaling pathway.
A: Serum levels of alanine aminotransferase (n = 6); B: Serum levels of aspartate aminotransferase (n = 6); C: Suzuki pathological scores of liver injury based on hematoxylin and eosin staining (n = 6); D: Hematoxylin and eosin staining of liver sections; E: In vitro western blots showing protein expression levels of p-phosphatidylinositol 3-kinase (PI3K), p-protein kinase B (Akt), Bax and Bcl-2; F: Densitometric quantification of p-PI3K, p-Akt, Bax and Bcl-2 (n = 3); G: In vivo western blots showing protein expression levels of p-PI3K, p-Akt, Bax and Bcl-2; H: Densitometric quantification of p-PI3K, p-Akt, Bax and Bcl-2 (n = 3). Scale bar: 100 μm. aP < 0.05 vs the ischemia-reperfusion injury group, bP < 0.05 vs the ischemia-reperfusion injury + naringenin group. NAR: Naringenin; IRI: Ischemia-reperfusion injury; PI3K: Phosphatidylinositol 3-kinase; Akt: Protein kinase B; AST: Aspartate aminotransferase; ALT: Alanine aminotransferase.
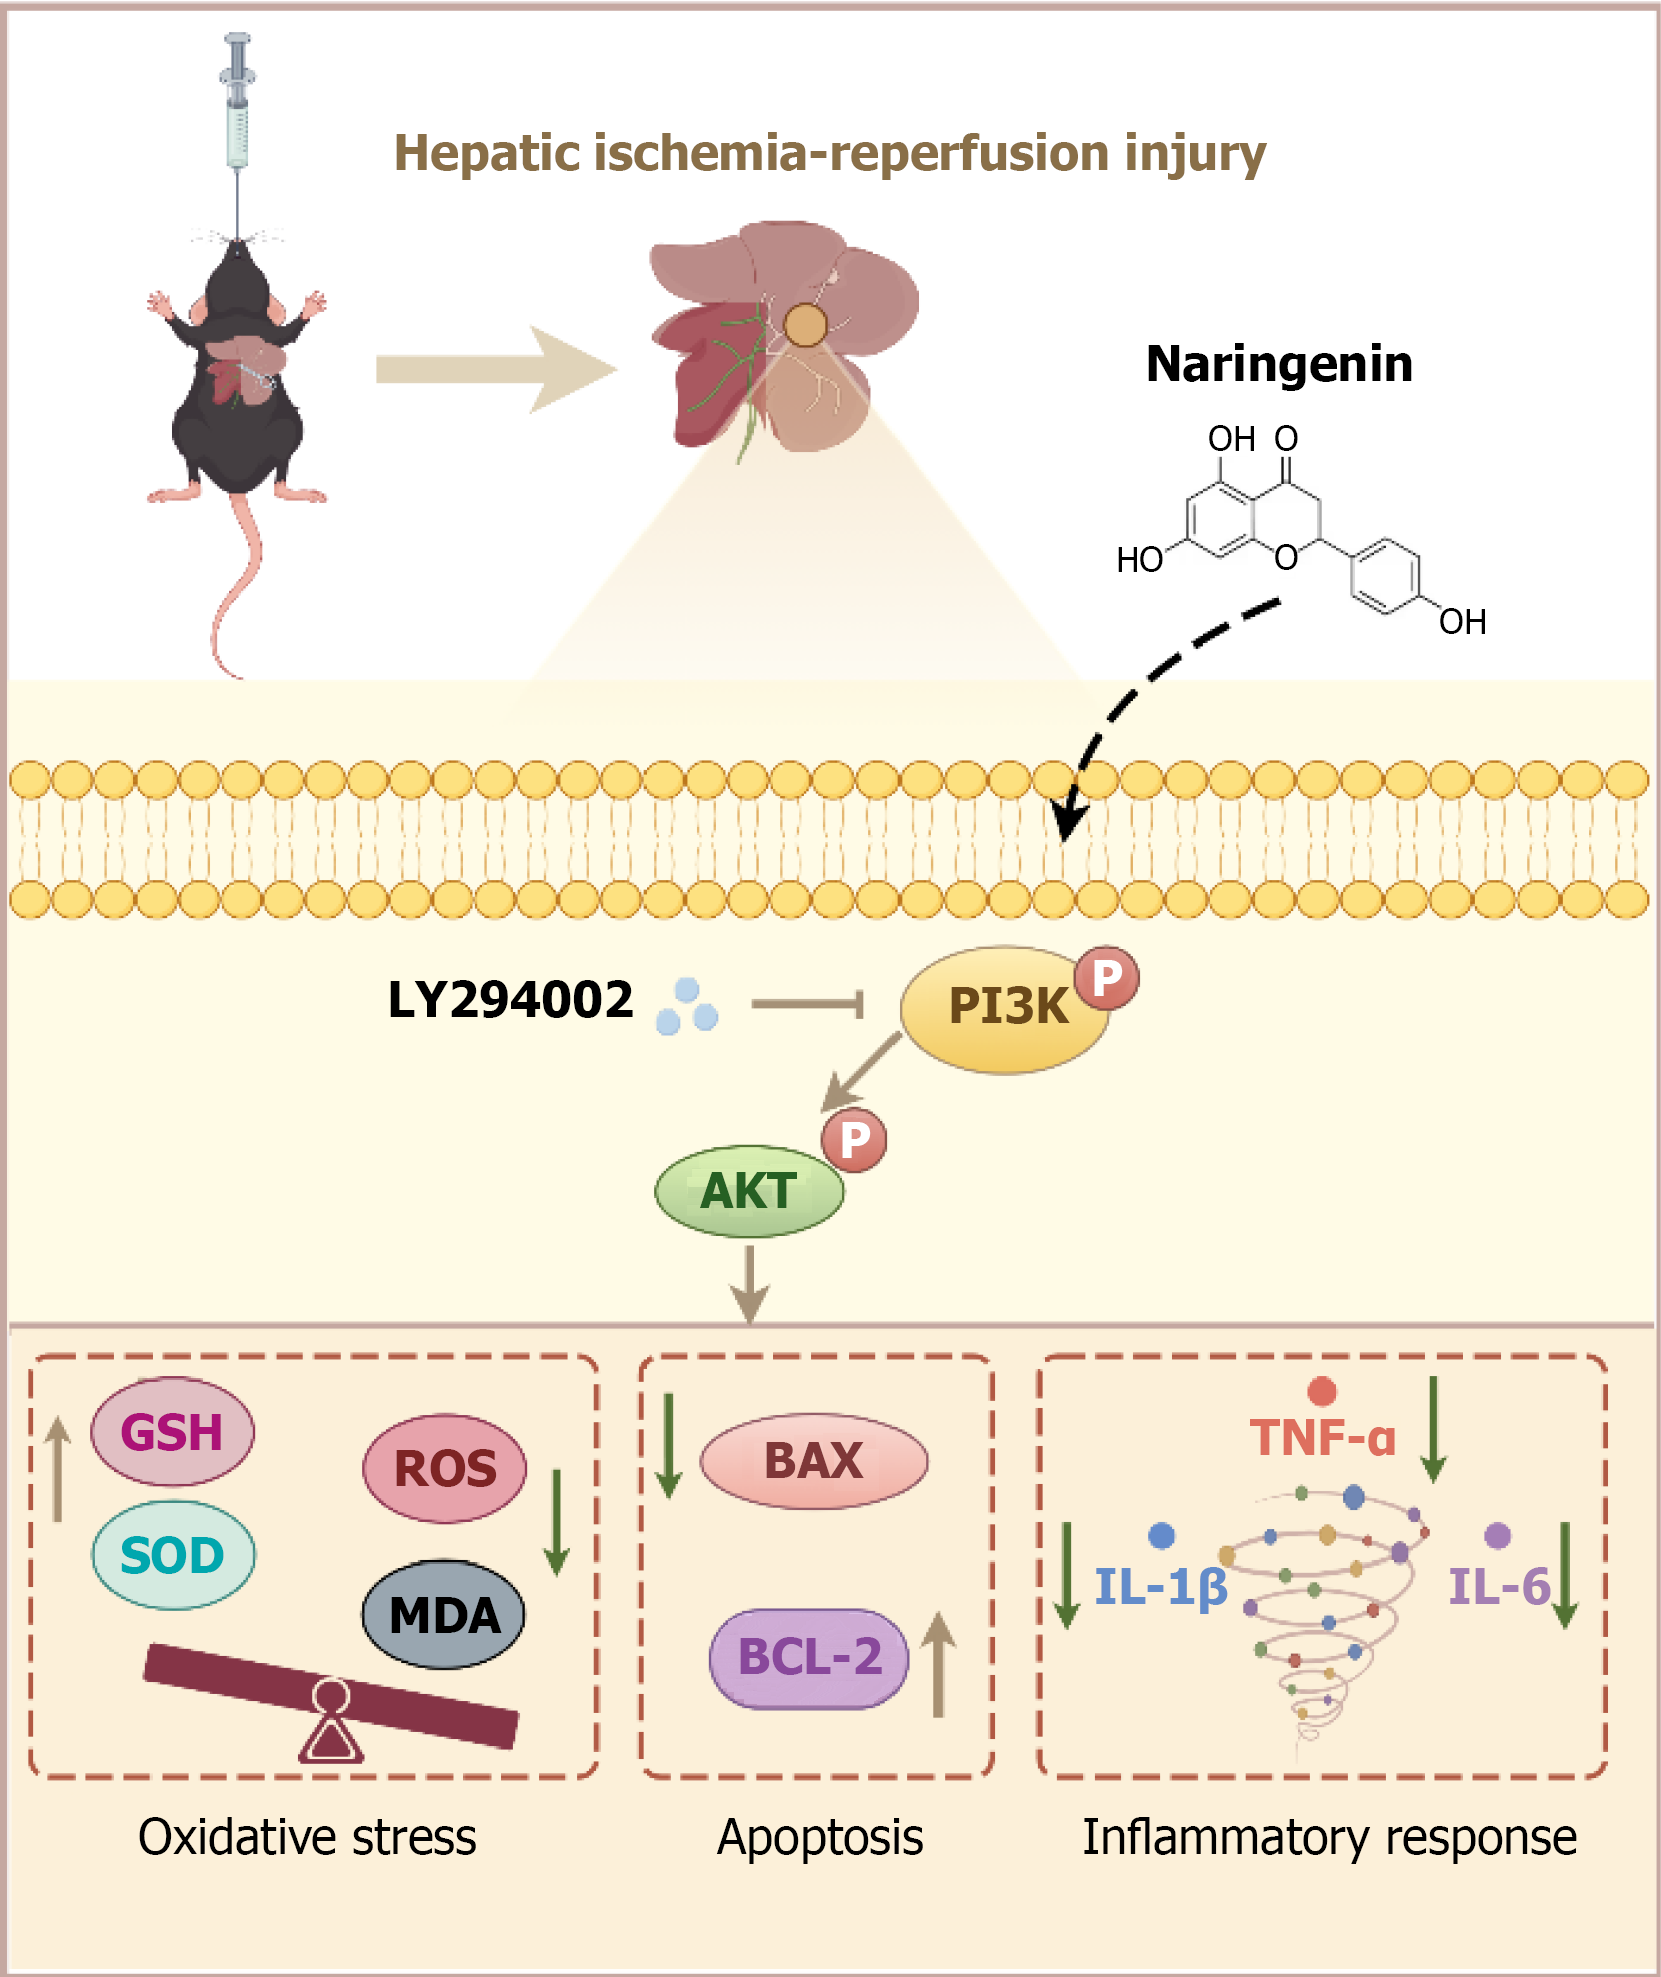
Figure 7 Summary of research results.
MDA: Malondialdehyde; SOD: Superoxide dismutase; GSH: Reduced glutathione; ROS: Reactive oxygen species; IL: Interleukin; TNF-α: Tumor necrosis factor-α; PI3K: Phosphatidylinositol 3-kinase; Akt: Protein kinase B.
- Citation: Lu JS, Liang HL, Chen DC, Pan H, Han T, Zhang WY, Fan M, Hou W, Shen ZY. Naringenin pretreatment attenuates hepatic ischemia-reperfusion injury by activating the PI3K-Akt signaling pathway. World J Gastroenterol 2026; 32(33): 117979
- URL: https://www.wjgnet.com/1007-9327/full/v32/i33/117979.htm
- DOI: https://dx.doi.org/10.3748/wjg.117979