
















Copyright: ©Author(s) 2026.
World J Gastroenterol. Aug 21, 2026; 32(31): 118472
Published online Aug 21, 2026. doi: 10.3748/wjg.118472
Published online Aug 21, 2026. doi: 10.3748/wjg.118472
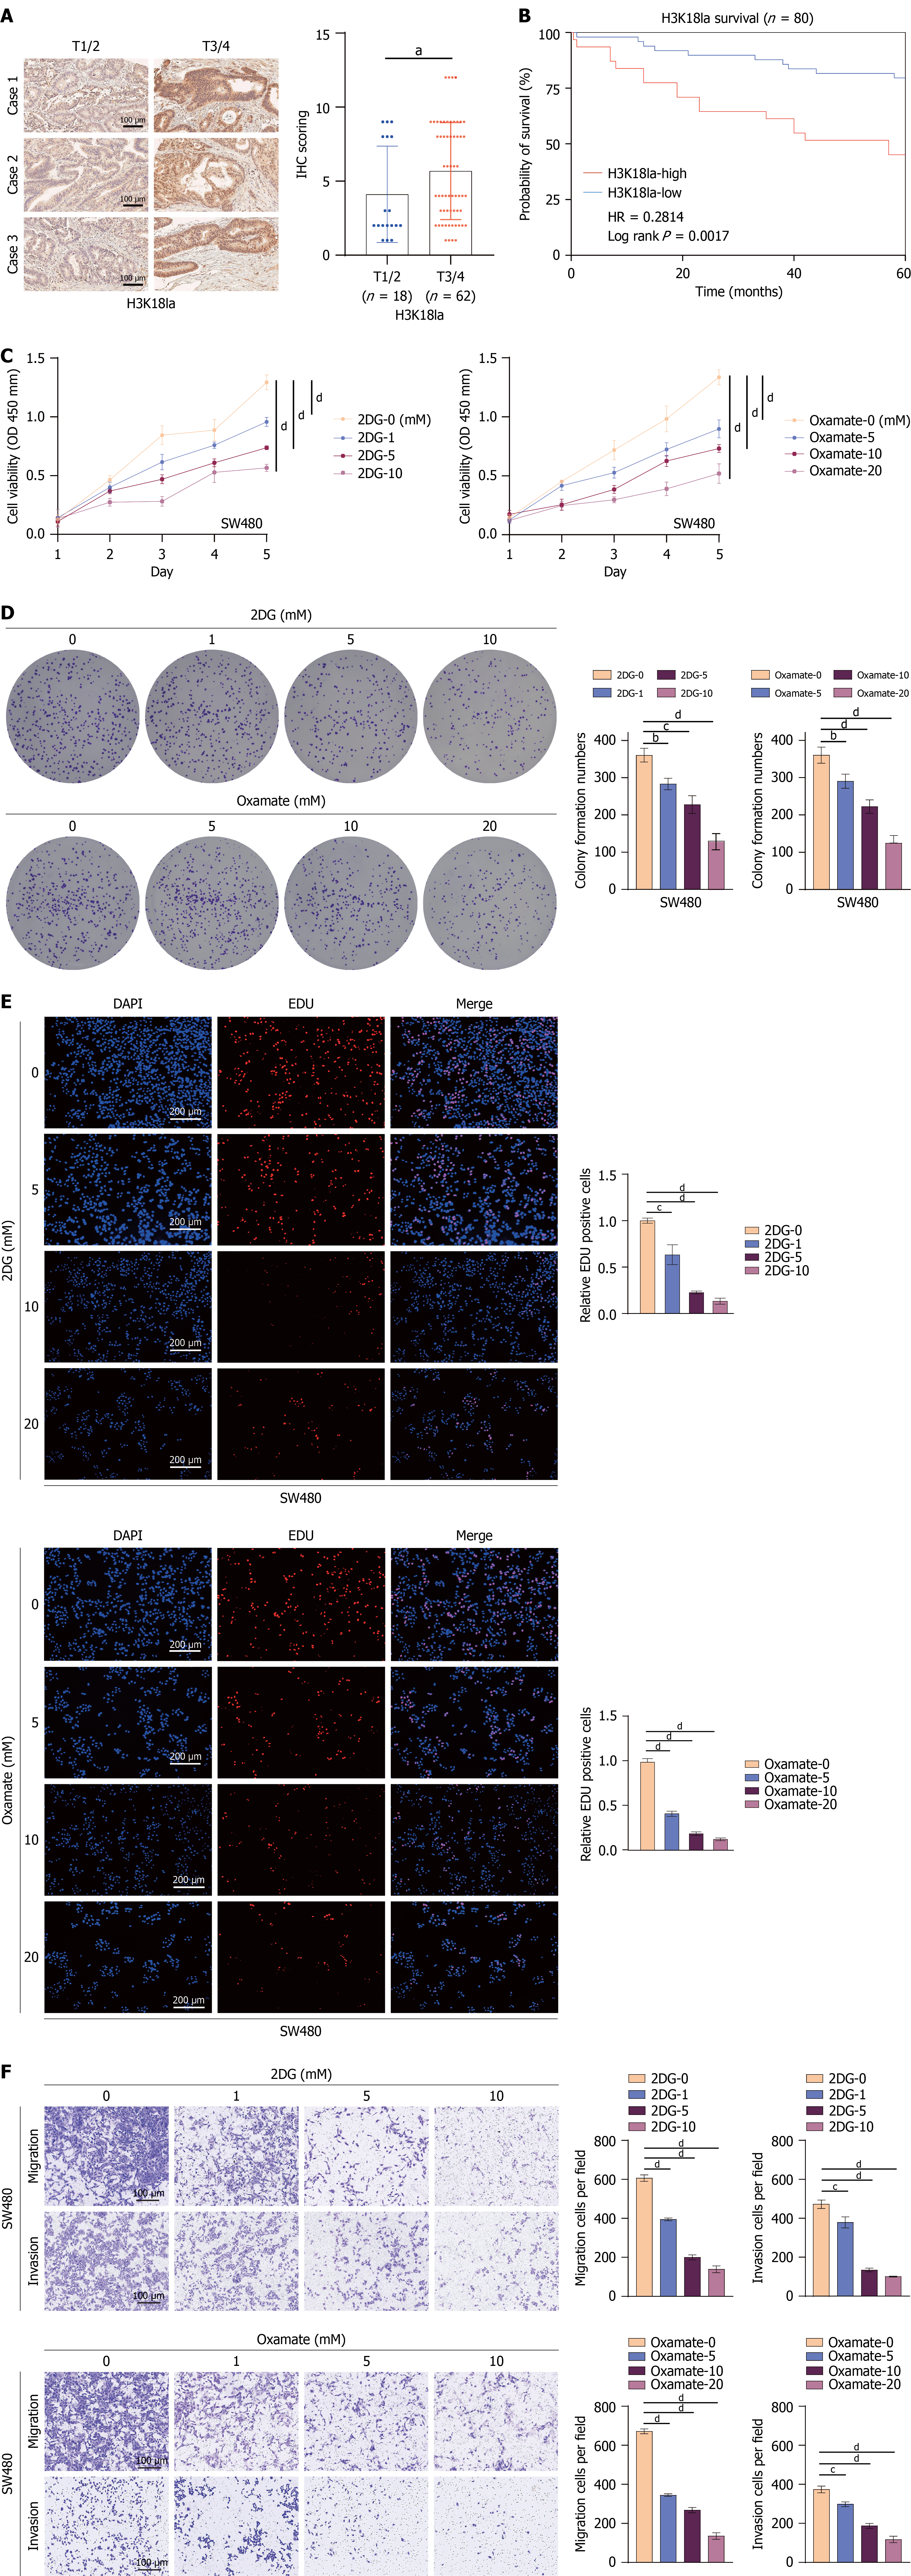
Figure 1 Lactylation is closely associated with the prognosis of patients with colorectal cancer.
A: Immunohistochemistry detection of H3K18 La in 80 colorectal cancer (CRC) tissue samples, including 18 cases at stage T1/2 and 62 cases at stage T3/4 (left panel, scale bar: 100 μm). H3K18 La expression was quantified using the Allred scoring system (right). Stage T1/2: In situ CRC without lymph node or distant metastasis; stage T3/4: Advanced CRC with lymph node or distant metastasis; B: Survival analysis of the 80 patients. Patients were divided into low-expression (Allred score ≤ 2, n = 24) and high-expression (score ≥ 3, n = 56) based on H3K18 La levels; C: SW480 cells (1 × 10⁴ cells/well) cultured with different concentrations of 2-DG or oxamate for 5 days. Cell viability was detected using the cell counting kit-8 for 5 consecutive days, and cell growth curves were plotted; D: SW480 cells (5 × 10² cells/well) cultured with different concentrations of 2-DG or oxamate for 14 days. Subsequently, crystal violet staining was performed to visualize the formation of cell colonies, and the number of monoclonal cell clusters was counted and subjected to quantitative analysis; E: SW480 cells (5 × 10³ cells/well) cultured with different concentrations of 2-DG or oxamate for 24 hours and incubated with EdU for an additional 2 hours. The number of EdU-positive cells was detected by fluorescence microscopy and subjected to quantitative comparison; F: SW480 cells (1.5 × 10⁴ cells/chamber) seeded in Transwell insert or Matrigel-coated Transwell insert with medium containing 2-DG or oxamate. After 48 hours of culture, cells were stained with crystal violet (scale bar: 100 μm). aP < 0.05, bP < 0.01, cP < 0.001, and dP < 0.0001.
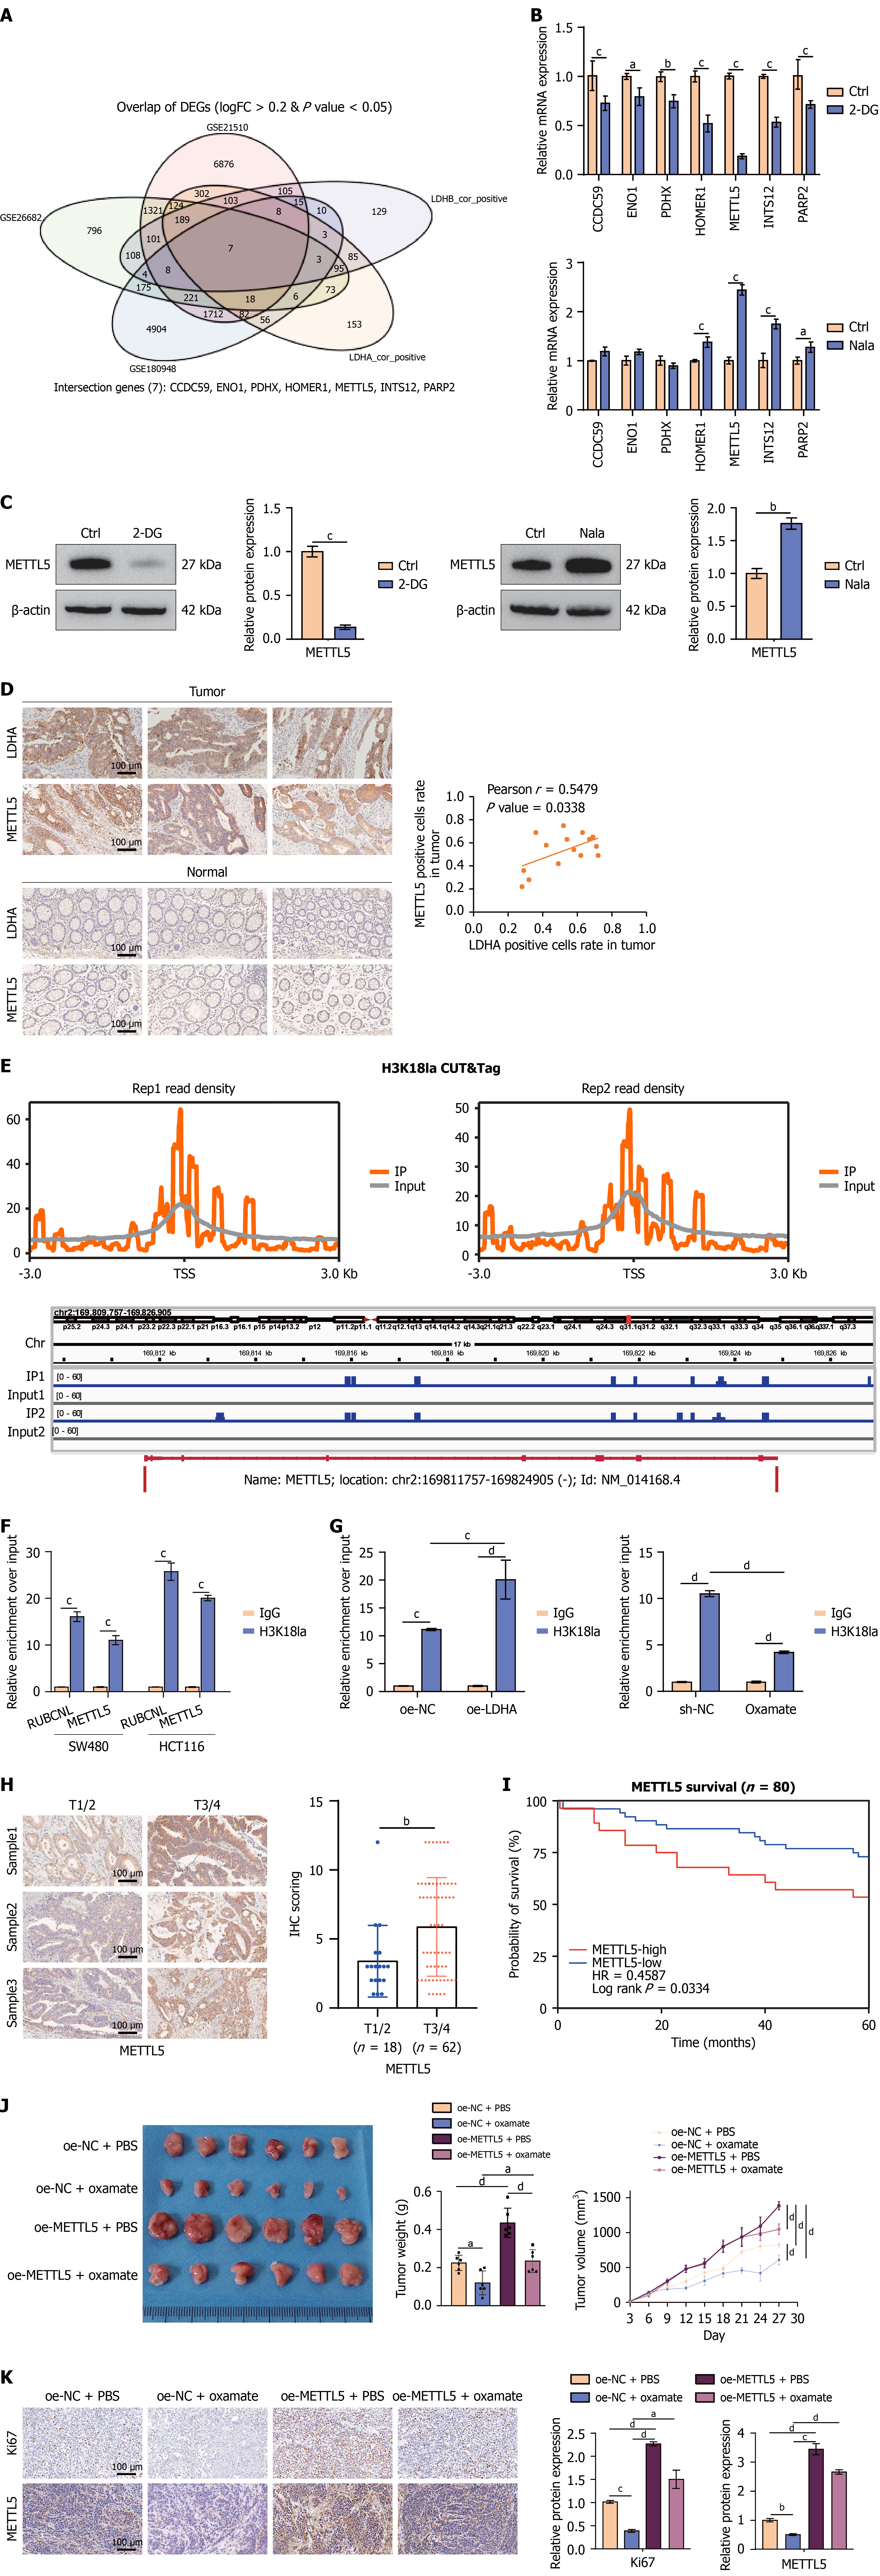
Figure 2 Lactate and H3K18 La promote METTL5 transcription.
A: Venn diagram illustrating overlapping genes among gene sets highly expressed in colorectal cancer (CRC) tissues (GSE21510, GSE26692, and GSE180948) and gene sets positively correlated with LDHA or LDHB expression (LDHA_cor_positive, LDHB_cor_positive); B: SW480 cells treated with 5 mmol/L 2-DG or 5 mmol/L sodium lactate (Nala) for 24 hours. Quantitative polymerase chain reaction (qPCR) to detect the mRNA expression levels of CCDC59, ENO1, PDHX, HOMER1, METTL5, INTS12, and PARP2; C: SW480 cells treated with 5 mmol/L 2-DG or 5 mmol/L Nala for 24 hours. Western blotting to detect METTL5 protein expression; β-actin served as the internal reference; D: Immunohistochemistry (IHC) of METTL5 and LDHA protein expression in 15 randomly selected CRC tissues (T) and adjacent non-tumor tissues (N) (left panel). Positive cell proportion and correlation between METTL5 and LDHA expression were analyzed; E: SW480 cells treated with 5 mmol/L Nala for 24 hours, followed by the cleavage under targets and tagmentation assay using H3K18 La antibody and IgG control antibody. The upper panel depicts the genome-wide enrichment of H3K18 La near transcription start sites; the lower panel displays the sequencing signal peaks of H3K18 La and IgG in the chromosomal region of METTL5; F: Chromatin immunoprecipitation in SW480 and HCT116 cells using H3K18 La antibody and IgG, respectively. qPCR to detect the enrichment level of H3K18 La in the region near the METTL5 promoter; G: SW480 cells transfected with LDHA-overexpressing plasmid (left) or treated with 10 mmol/L oxamate for 24 hours (right). A subsequent chromatin immunoprecipitation assay was conducted, and qPCR was used to analyze the enrichment of H3K18 La in the METTL5 promoter region; H: IHC quantification of METTL5 expression in 80 CRC tissue samples (left panel, scale bar: 100 μm). The Allred scoring system to quantify METTL5 expression level (right panel); I: Survival analysis of the 80 patients. Based on the Allred score of METTL5, patients were divided into low-expression (score ≤ 2, n = 23) and high-expression (score ≥ 3, n = 57) groups. Differences in overall survival between the two groups were compared; J: SW480 cells stably transfected with empty vector plasmid or METTL5-overexpressing plasmid (1 × 10⁶ cells/mouse) were subcutaneously inoculated into BALB/c nude mice to establish a cell-derived xenograft model. Tumor volume was measured every 3 days starting from day 3 post-inoculation. On day 6 post-inoculation, mice were administered phosphate-buffered saline (control group) or oxamate (750 mg/kg, intraperitoneal injection daily). Mice were euthanized on day 27 post-inoculation; tumors were dissected and photographed (left), weighed for statistical analysis (middle, n = 6), and tumor growth curves were plotted (right); K: IHC to detect Ki67 and METTL5 expression in xenograft tumors from different treatment groups (as in J), followed by quantitative analysis. PBS: Phosphate-buffered saline. aP < 0.05, bP < 0.01, cP < 0.001, and dP < 0.0001.
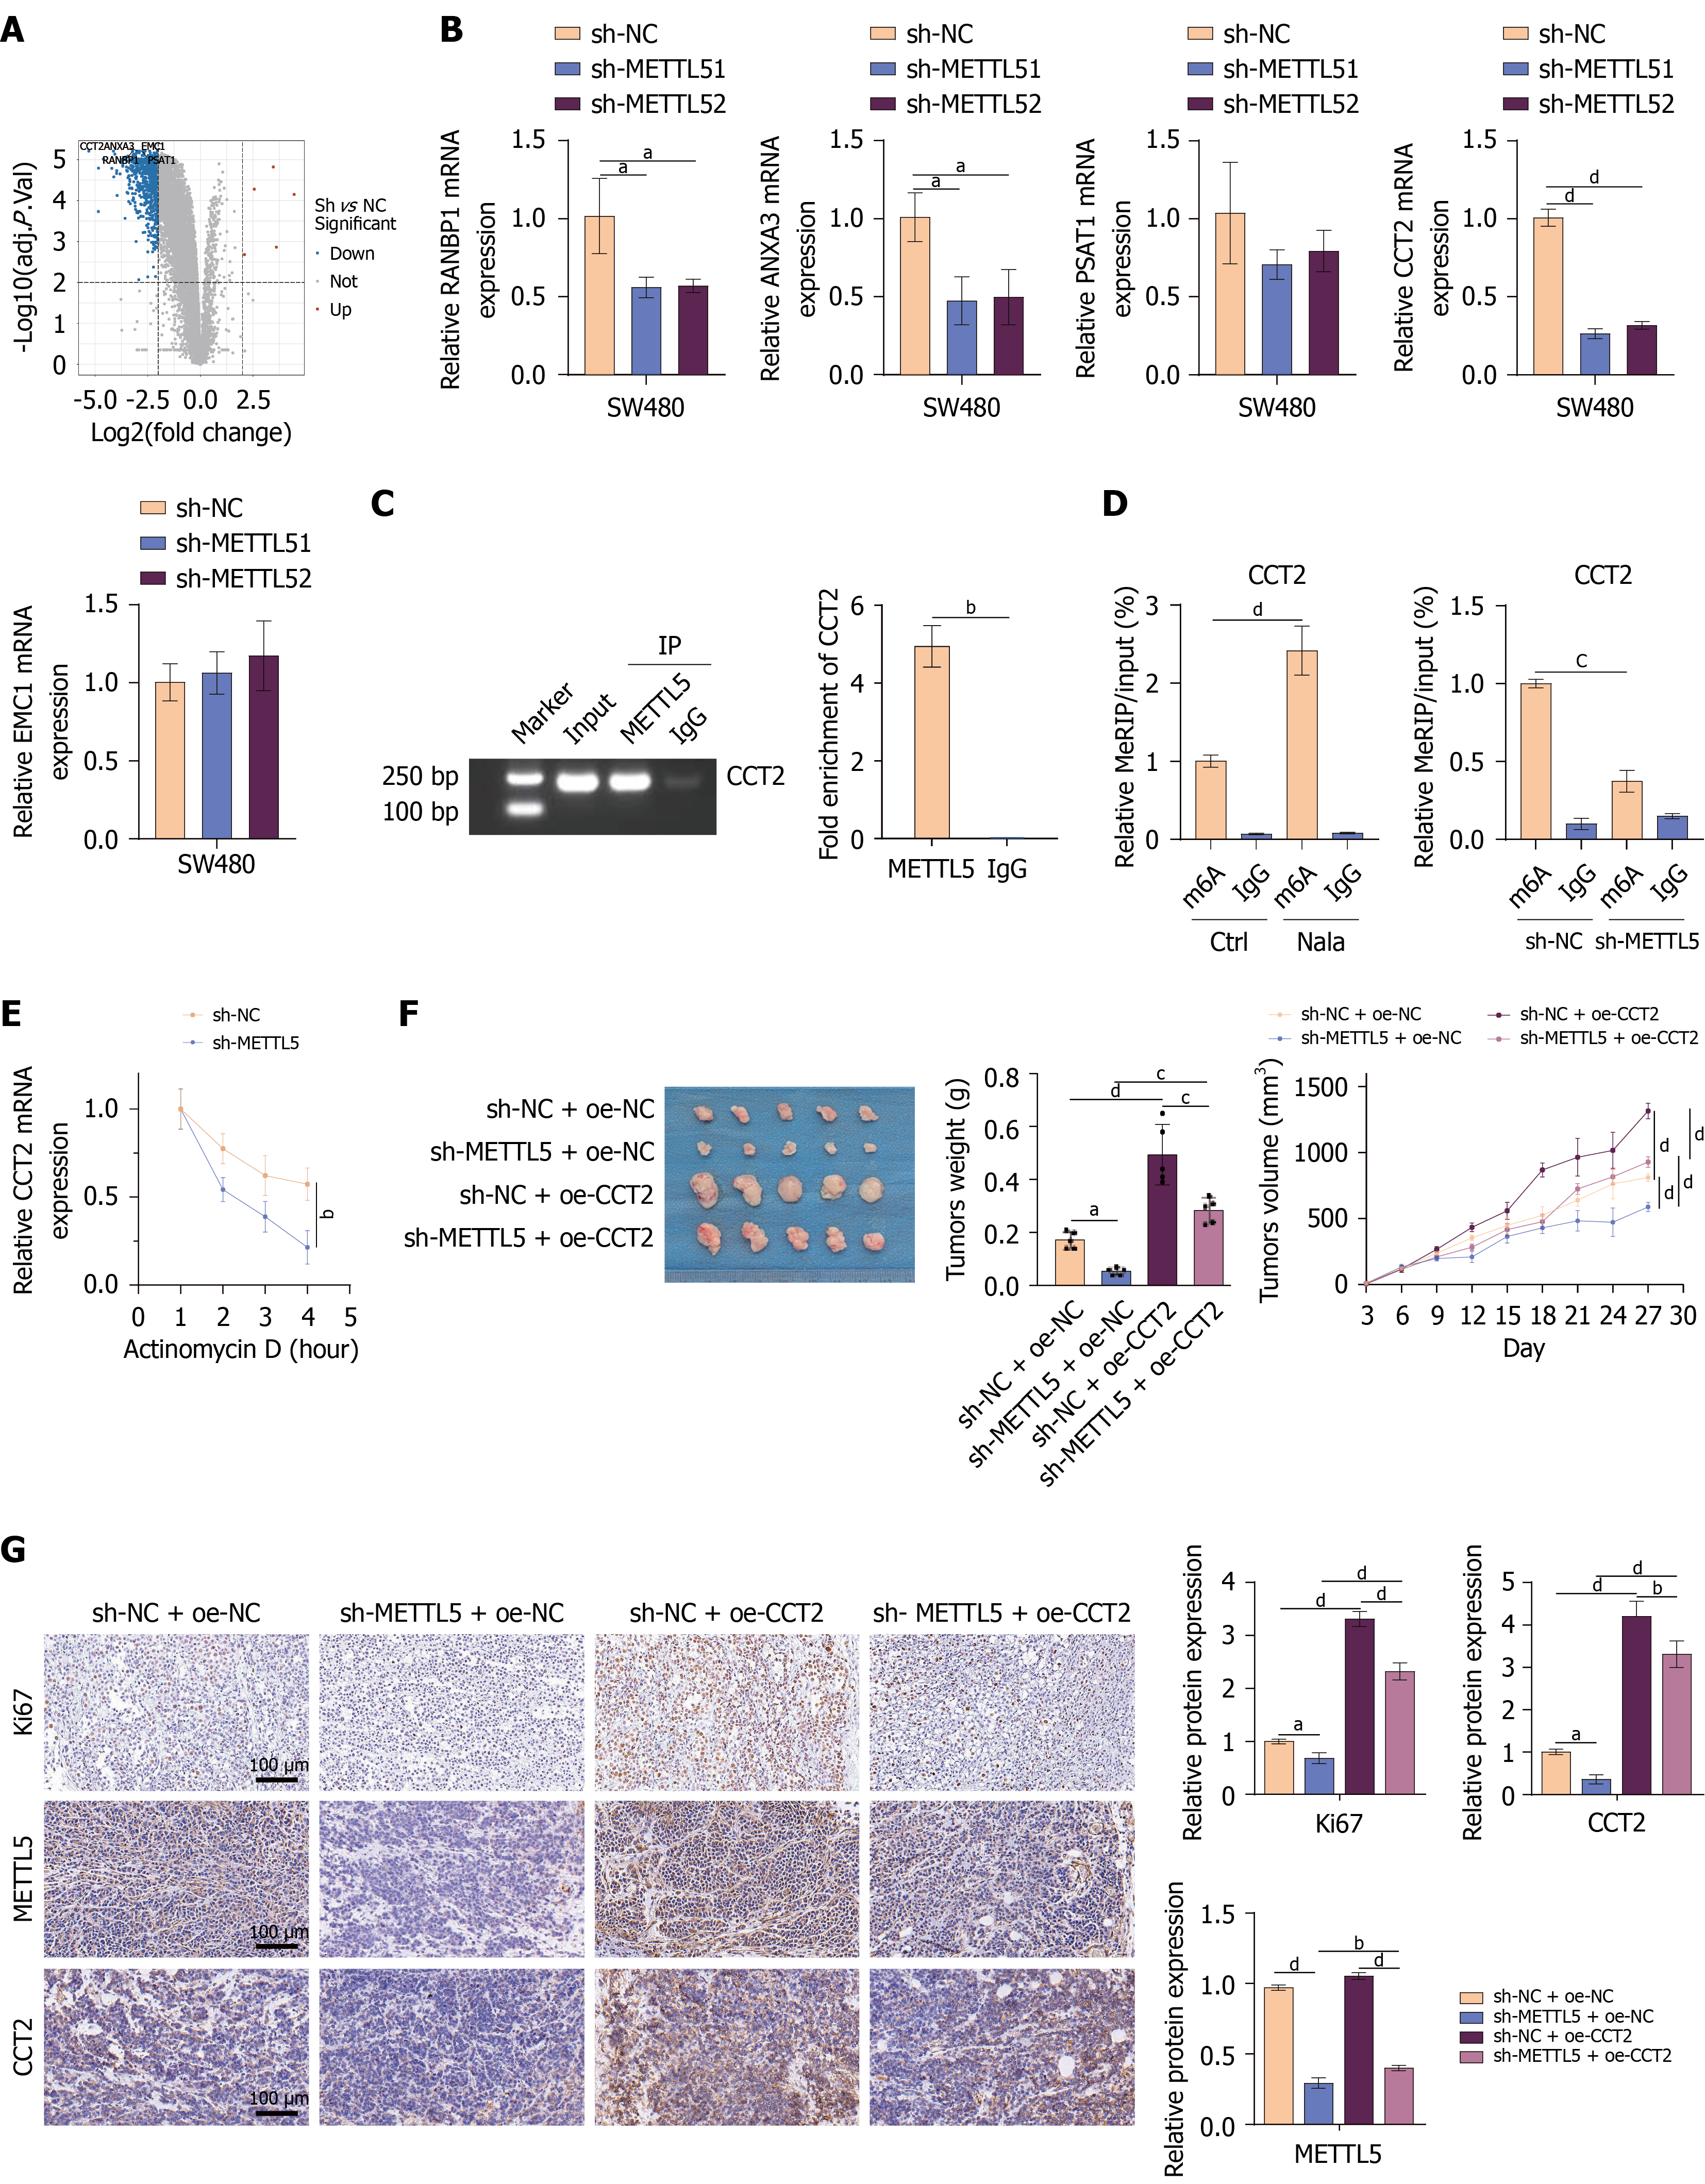
Figure 3 METTL5 promotes CCT2 expression in an m6A-dependent manner.
A: Total RNA from SW480 cells before and after METTL5 knockdown subjected to transcriptome sequencing. Volcano plot to visualize the global changes in mRNA expression; genes with |logFC| > 2 and adj.P.Val < 0.01 are labeled; B: SW480 cells with stable METTL5 knockdown were analyzed via quantitative polymerase chain reaction for mRNA expression of RANBP1, ANXA3, PSAT1, CCT2, and EMC1; C: RNA immunoprecipitation in SW480 cells using a METTL5 antibody, with an IgG antibody as the negative control. The enrichment of METTL5 protein on CCT2 mRNA (left panel). The enrichment difference (right panel); D: SW480 cells cultured in normal medium (con) or medium containing 5 mmol/L sodium lactate for 24 hours. MeRIP using an m6A antibody, with an IgG antibody as the negative control. Quantitative polymerase chain reaction to analyze the level of m6A modification on CCT2 mRNA; E: METTL5-knockdown and control SK-Hep1 cells treated with cycloheximide at a final concentration of 100 μM for 0, 1, 2, and 4 hours. Western blotting was used to detect METTL5 protein expression, and grayscale value quantitative analysis was performed; F: SW480 cells with non-targeted knockdown (sh-NC) or METTL5 knockdown (sh-METTL5) were stably transfected with oe-NC or CCT2-overexpressing plasmid (oe-CCT2), respectively. These cells (1 × 10⁶ cells/mouse) were subcutaneously inoculated into BALB/c nude mice to establish a cell line-derived xenograft model. Tumor photograph (left panel), tumor weight (middle panel, n = 6), and tumor volume plot (right panel); G: Immunohistochemistry to detect the expression levels of Ki67, METTL5, and CCT2 in xenograft tumors from different treatment groups (as in F), followed by quantitative analysis. aP < 0.05, bP < 0.01, cP < 0.001, and dP < 0.0001.
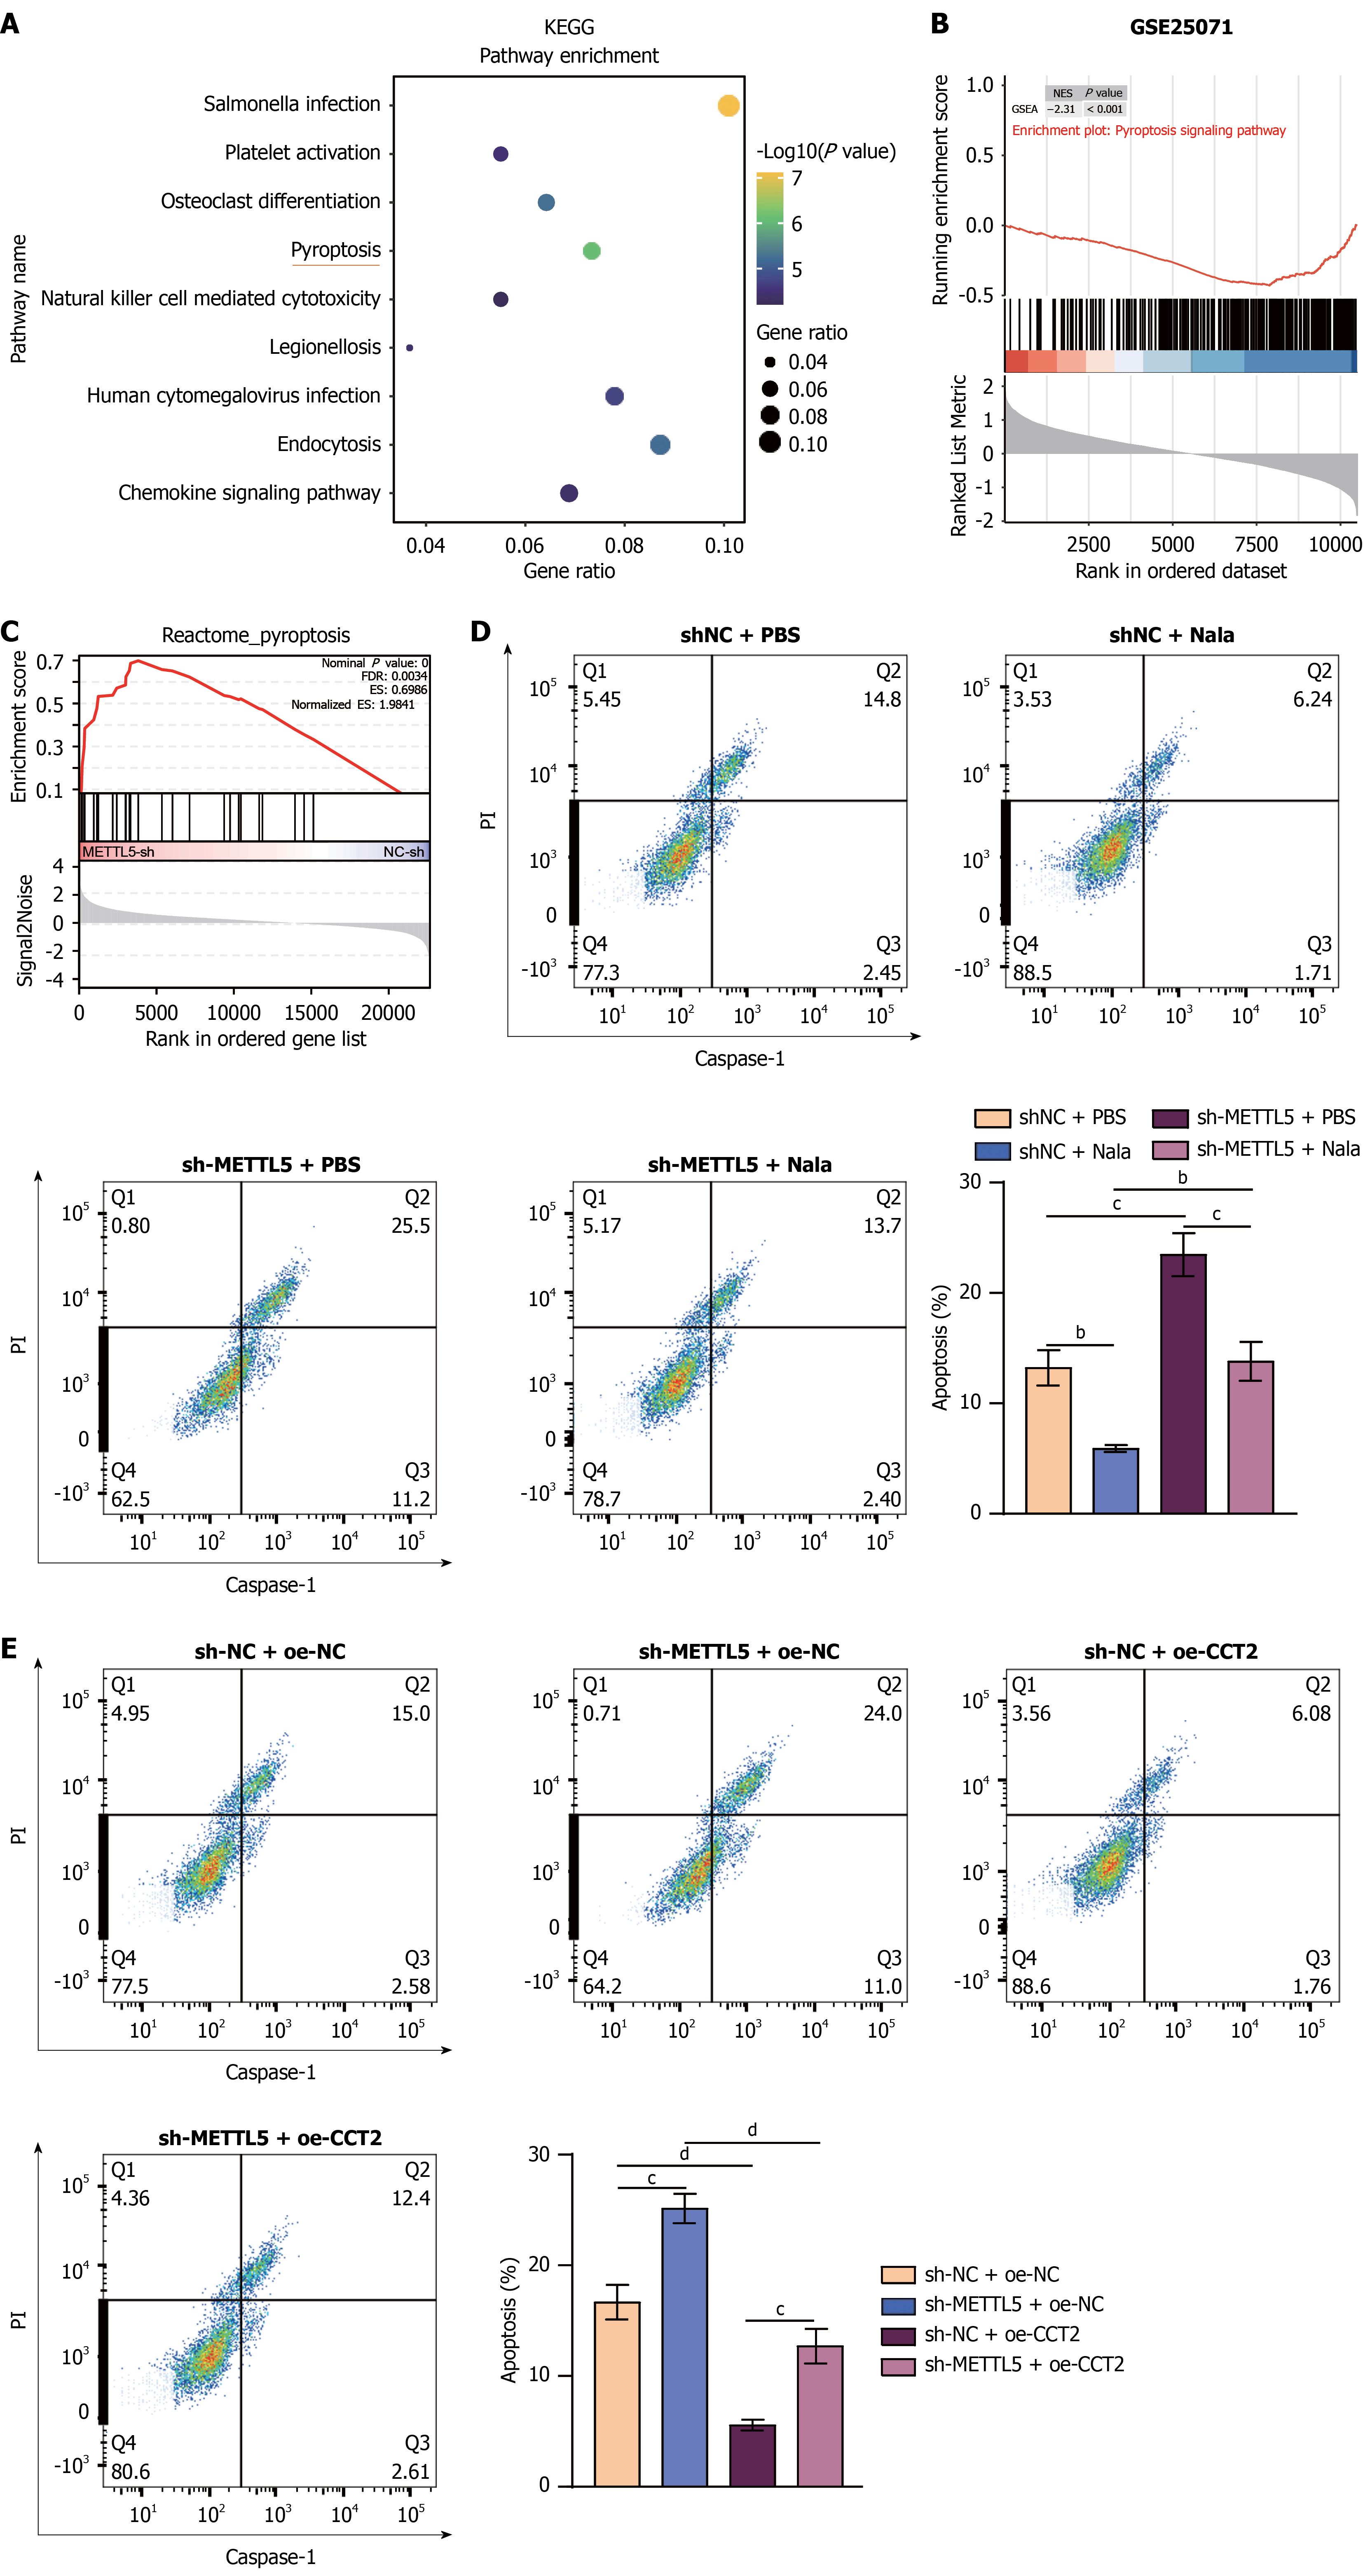
Figure 4 H3K18 La-METTL5-CCT2 signaling axis promotes tumor progression by inhibiting pyroptosis in colorectal cancer cells.
A and B: Colorectal cancer samples were divided into high- and low-expression groups based on CCT2 expression levels, and differentially expressed genes between the two groups were identified. KEGG pathway enrichment analysis (A). Gene set enrichment analysis for the pyroptosis signaling pathway (B). Bubbles size represents GeneRatio, and bubble color indicates -log10(P value); C: Gene set enrichment analysis of transcriptome sequencing data of METTL5-knockdown SW480 cells for pyroptosis-related genes; D: SW480 cells in the non-targeted short hairpin RNA control (sh-NC) and METTL5-knockdown (sh-METTL5) groups were treated with medium containing phosphate-buffered saline or 5 mmol/L sodium lactate for 24 hours. Pyroptosis was assessed by flow cytometry. Propidium iodide staining was used to indicate cell membrane permeability, and Caspase-1 activity was used to reflect the activation status of inflammatory caspases; E: SW480 cells in the sh-NC and sh-METTL5 groups were stably transfected with oe-NC or oe-CCT2. Pyroptosis was assessed via flow cytometry and quantified for comparison. PBS: Phosphate-buffered saline; Nala: Sodium lactate. aP < 0.05, bP < 0.01, cP < 0.001, and dP < 0.0001.
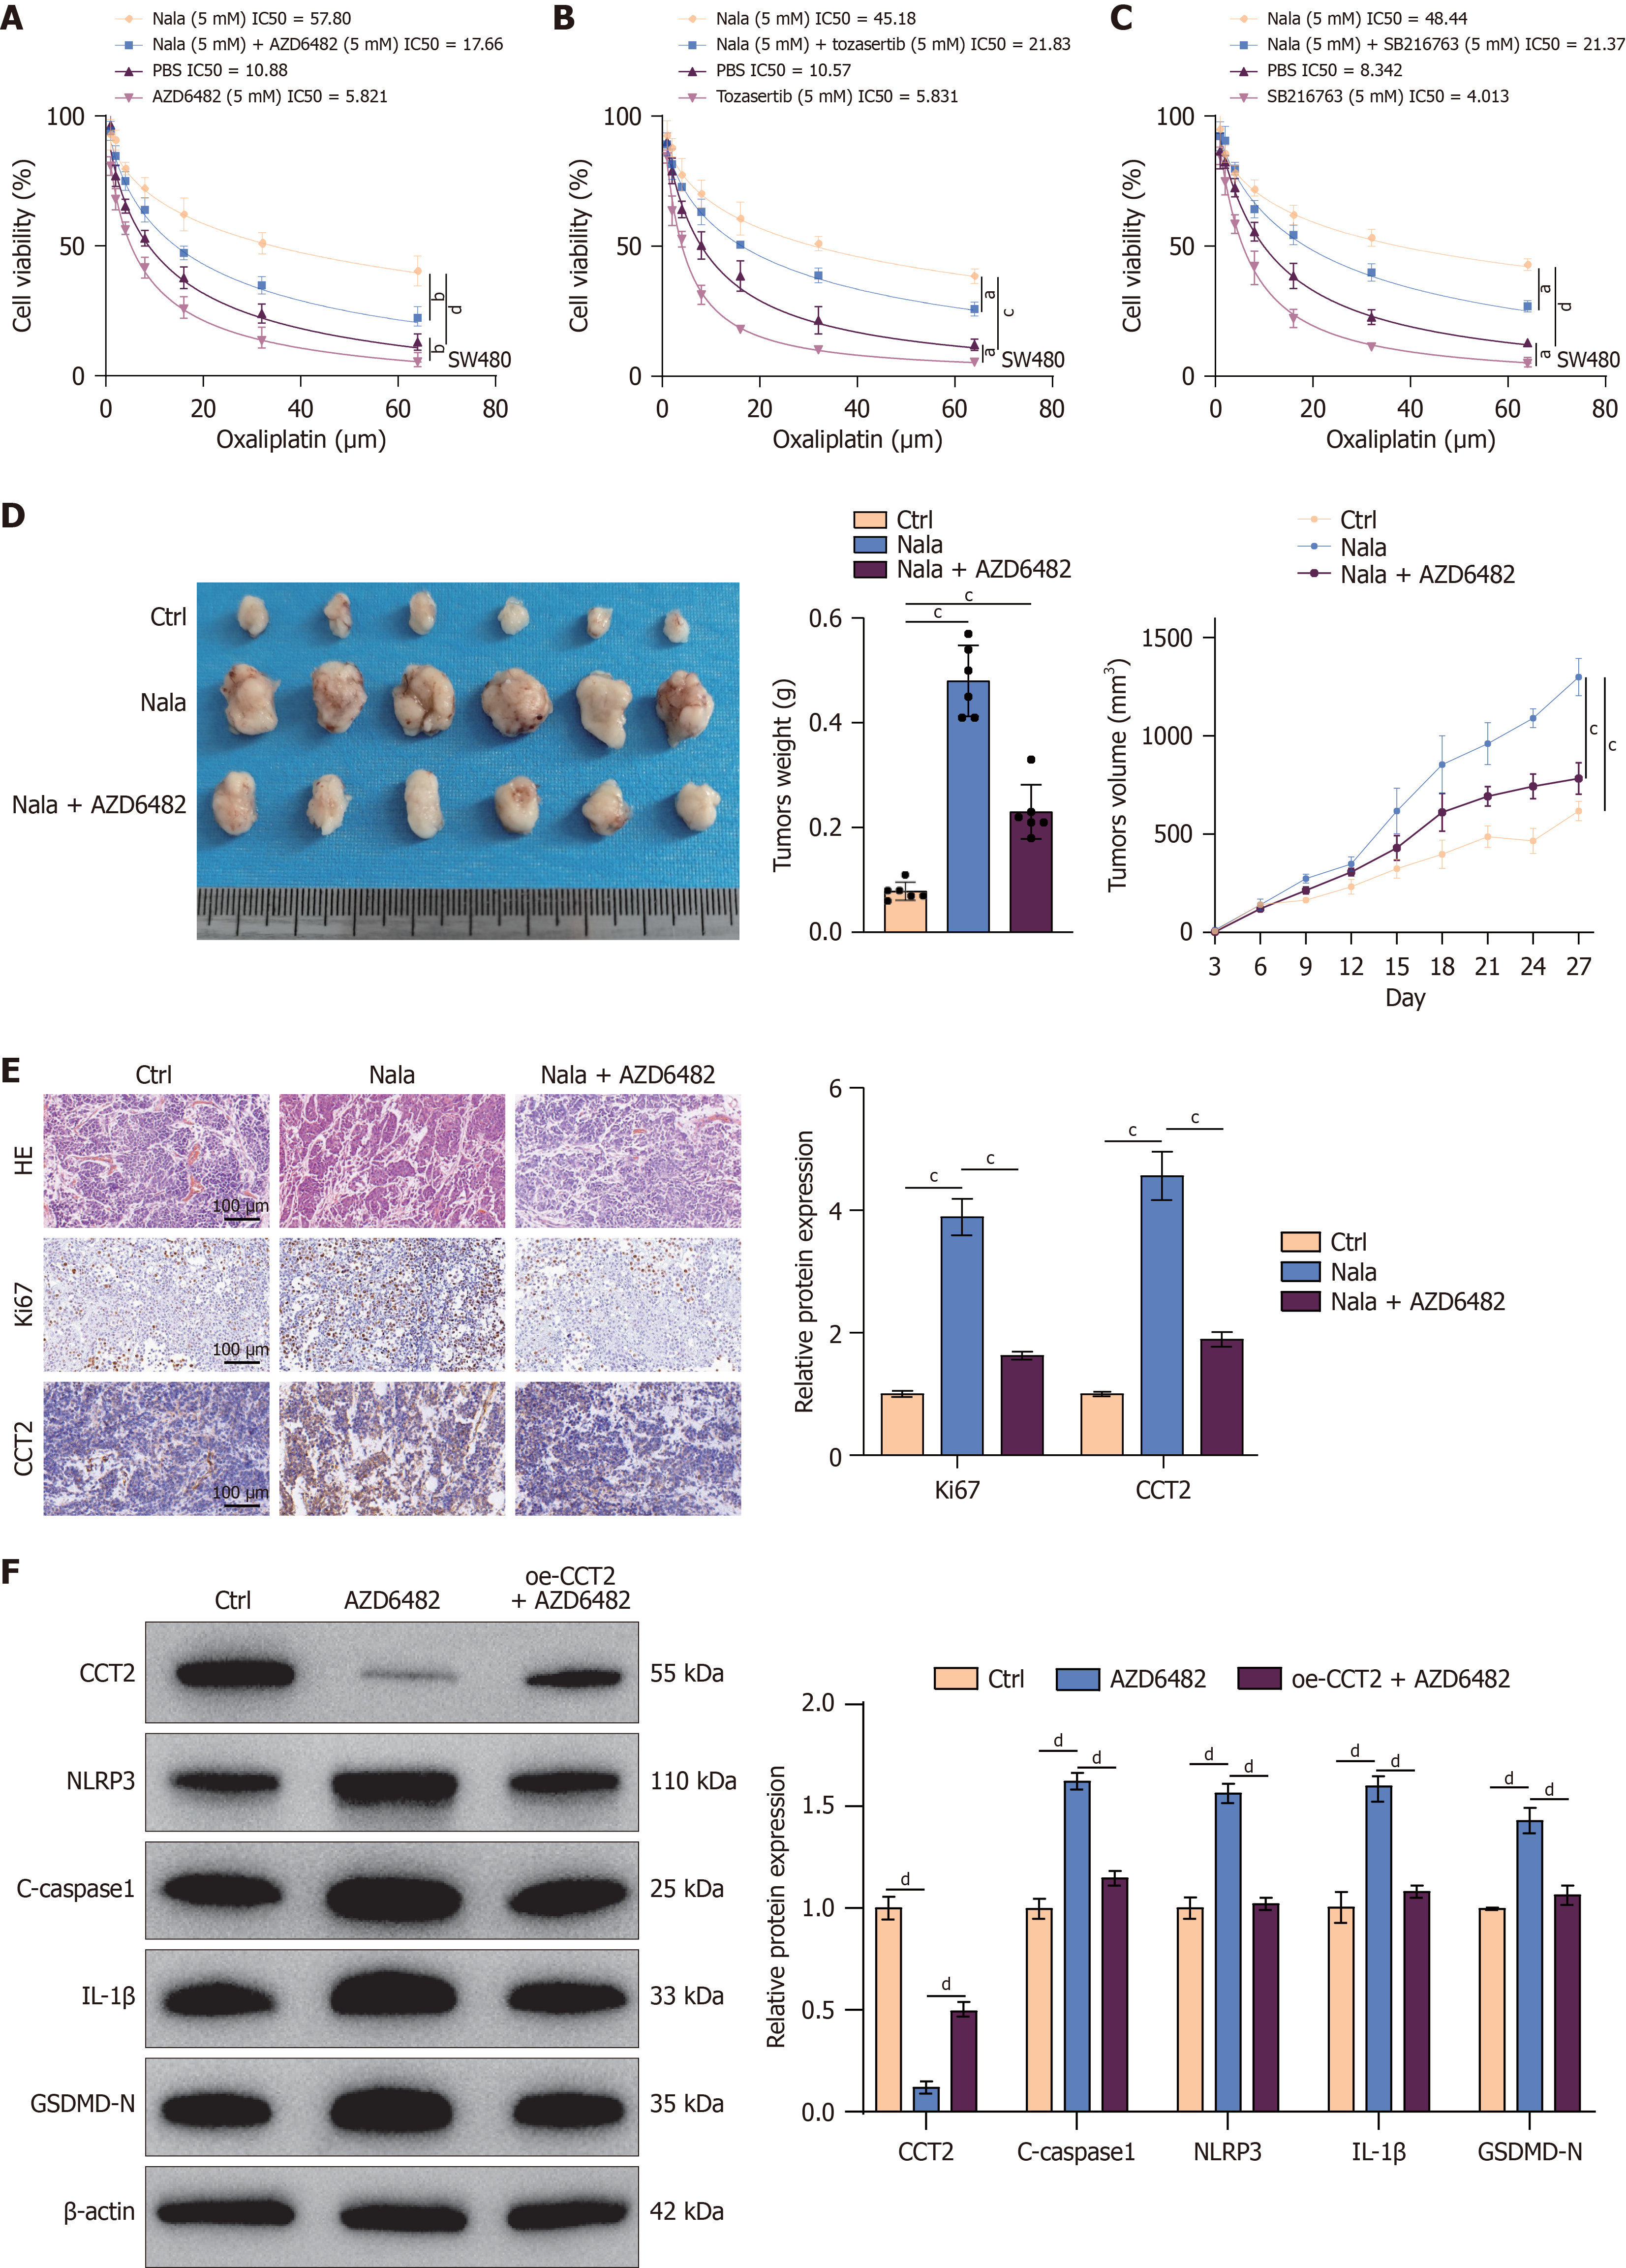
Figure 5 AZD6482 enhances the cytotoxic sensitivity of oxaliplatin to colorectal cancer cells in a high-lactate microenvironment.
A: SW480 cells (5 × 10³ cells/well) cultured in medium containing different concentrations of oxaliplatin (0, 1, 2, 5, 10, 25, 50, and 100 μM) with the following treatments added simultaneously: Phosphate-buffered saline (PBS), 5 mmol/L sodium lactate (Nala), PBS + 20 μM AZD6482, or 5 mmol/L Nala + 20 μM AZD6482. After 48 hours of further culture, the cell counting kit-8 (CCK-8) kit was used to detect cell viability, and cell survival curves were plotted; B: SW480 cells were seeded as in (A), cultured in medium with gradient concentrations of oxaliplatin (0-100 μM), and treated with PBS, 5 mmol/L Nala, PBS + 5 μM SB216763, or 5 mmol/L Nala + 5 μM SB216763, respectively. After 48 hours of culture, the CCK-8 method was used to detect cell viability, and survival curves were plotted; C: Cells were seeded as in (B), cultured under conditions with different concentrations of oxaliplatin, and supplemented with PBS, 5 mmol/L Nala, PBS + 5 μM Tozasertib, or 5 mmol/L Nala + 5 μM Tozasertib. After 48 hours, cell viability was detected using the CCK-8 assay, and dose-response curves were generated; D: SW480 cells (1 × 10⁶ cells/mouse) were subcutaneously inoculated into BALB/c nude mice to establish a cell line-derived xenograft model. Tumor volume was measured every 3 days starting from day 6 post-inoculation. From day 7 post-inoculation, mice received the following treatments via daily gavage: PBS (control), 200 mg/kg Nala, or 200 mg/kg Nala + 50 mg/kg AZD6482. Mice were euthanized 28 days later. Tumor photographs (left panel), tumor weight (middle panel, n = 6), and tumor growth curves (right panel); E: A portion of the xenograft tumor tissues obtained in (D) was subjected to hematoxylin-eosin staining, and another portion was used for immunohistochemistry detection of the expression levels of Ki67 and CCT2, followed by quantitative analysis; F: SW480 cells stably overexpressing oe-NC (control) or oe-CCT2 were treated with 20 μM AZD6482 for 24 hours. Western blotting was performed to detect the protein expression levels of METTL5, CCT2, GSDMD-N, NLRP3, and cleaved Caspase-1 (C-caspase1), and grayscale quantitative analysis of the bands was conducted. PBS: Phosphate-buffered saline; Nala: Sodium lactate; HE: Hematoxylin-eosin. aP < 0.05, bP < 0.01, cP < 0.001, and dP < 0.0001.
- Citation: Wang XP, Liu C, Zhang HW, Zhai JM, Zhu JX, Sun GD, An YH, Yang HJ, Jing DS, Liu DC. H3K18 La-METTL5-CCT2 signaling axis promotes colorectal cancer progression by inhibiting pyroptosis. World J Gastroenterol 2026; 32(31): 118472
- URL: https://www.wjgnet.com/1007-9327/full/v32/i31/118472.htm
- DOI: https://dx.doi.org/10.3748/wjg.118472