
















Copyright: ©Author(s) 2026.
World J Gastroenterol. Aug 14, 2026; 32(30): 119465
Published online Aug 14, 2026. doi: 10.3748/wjg.v32.i30.119465
Published online Aug 14, 2026. doi: 10.3748/wjg.v32.i30.119465
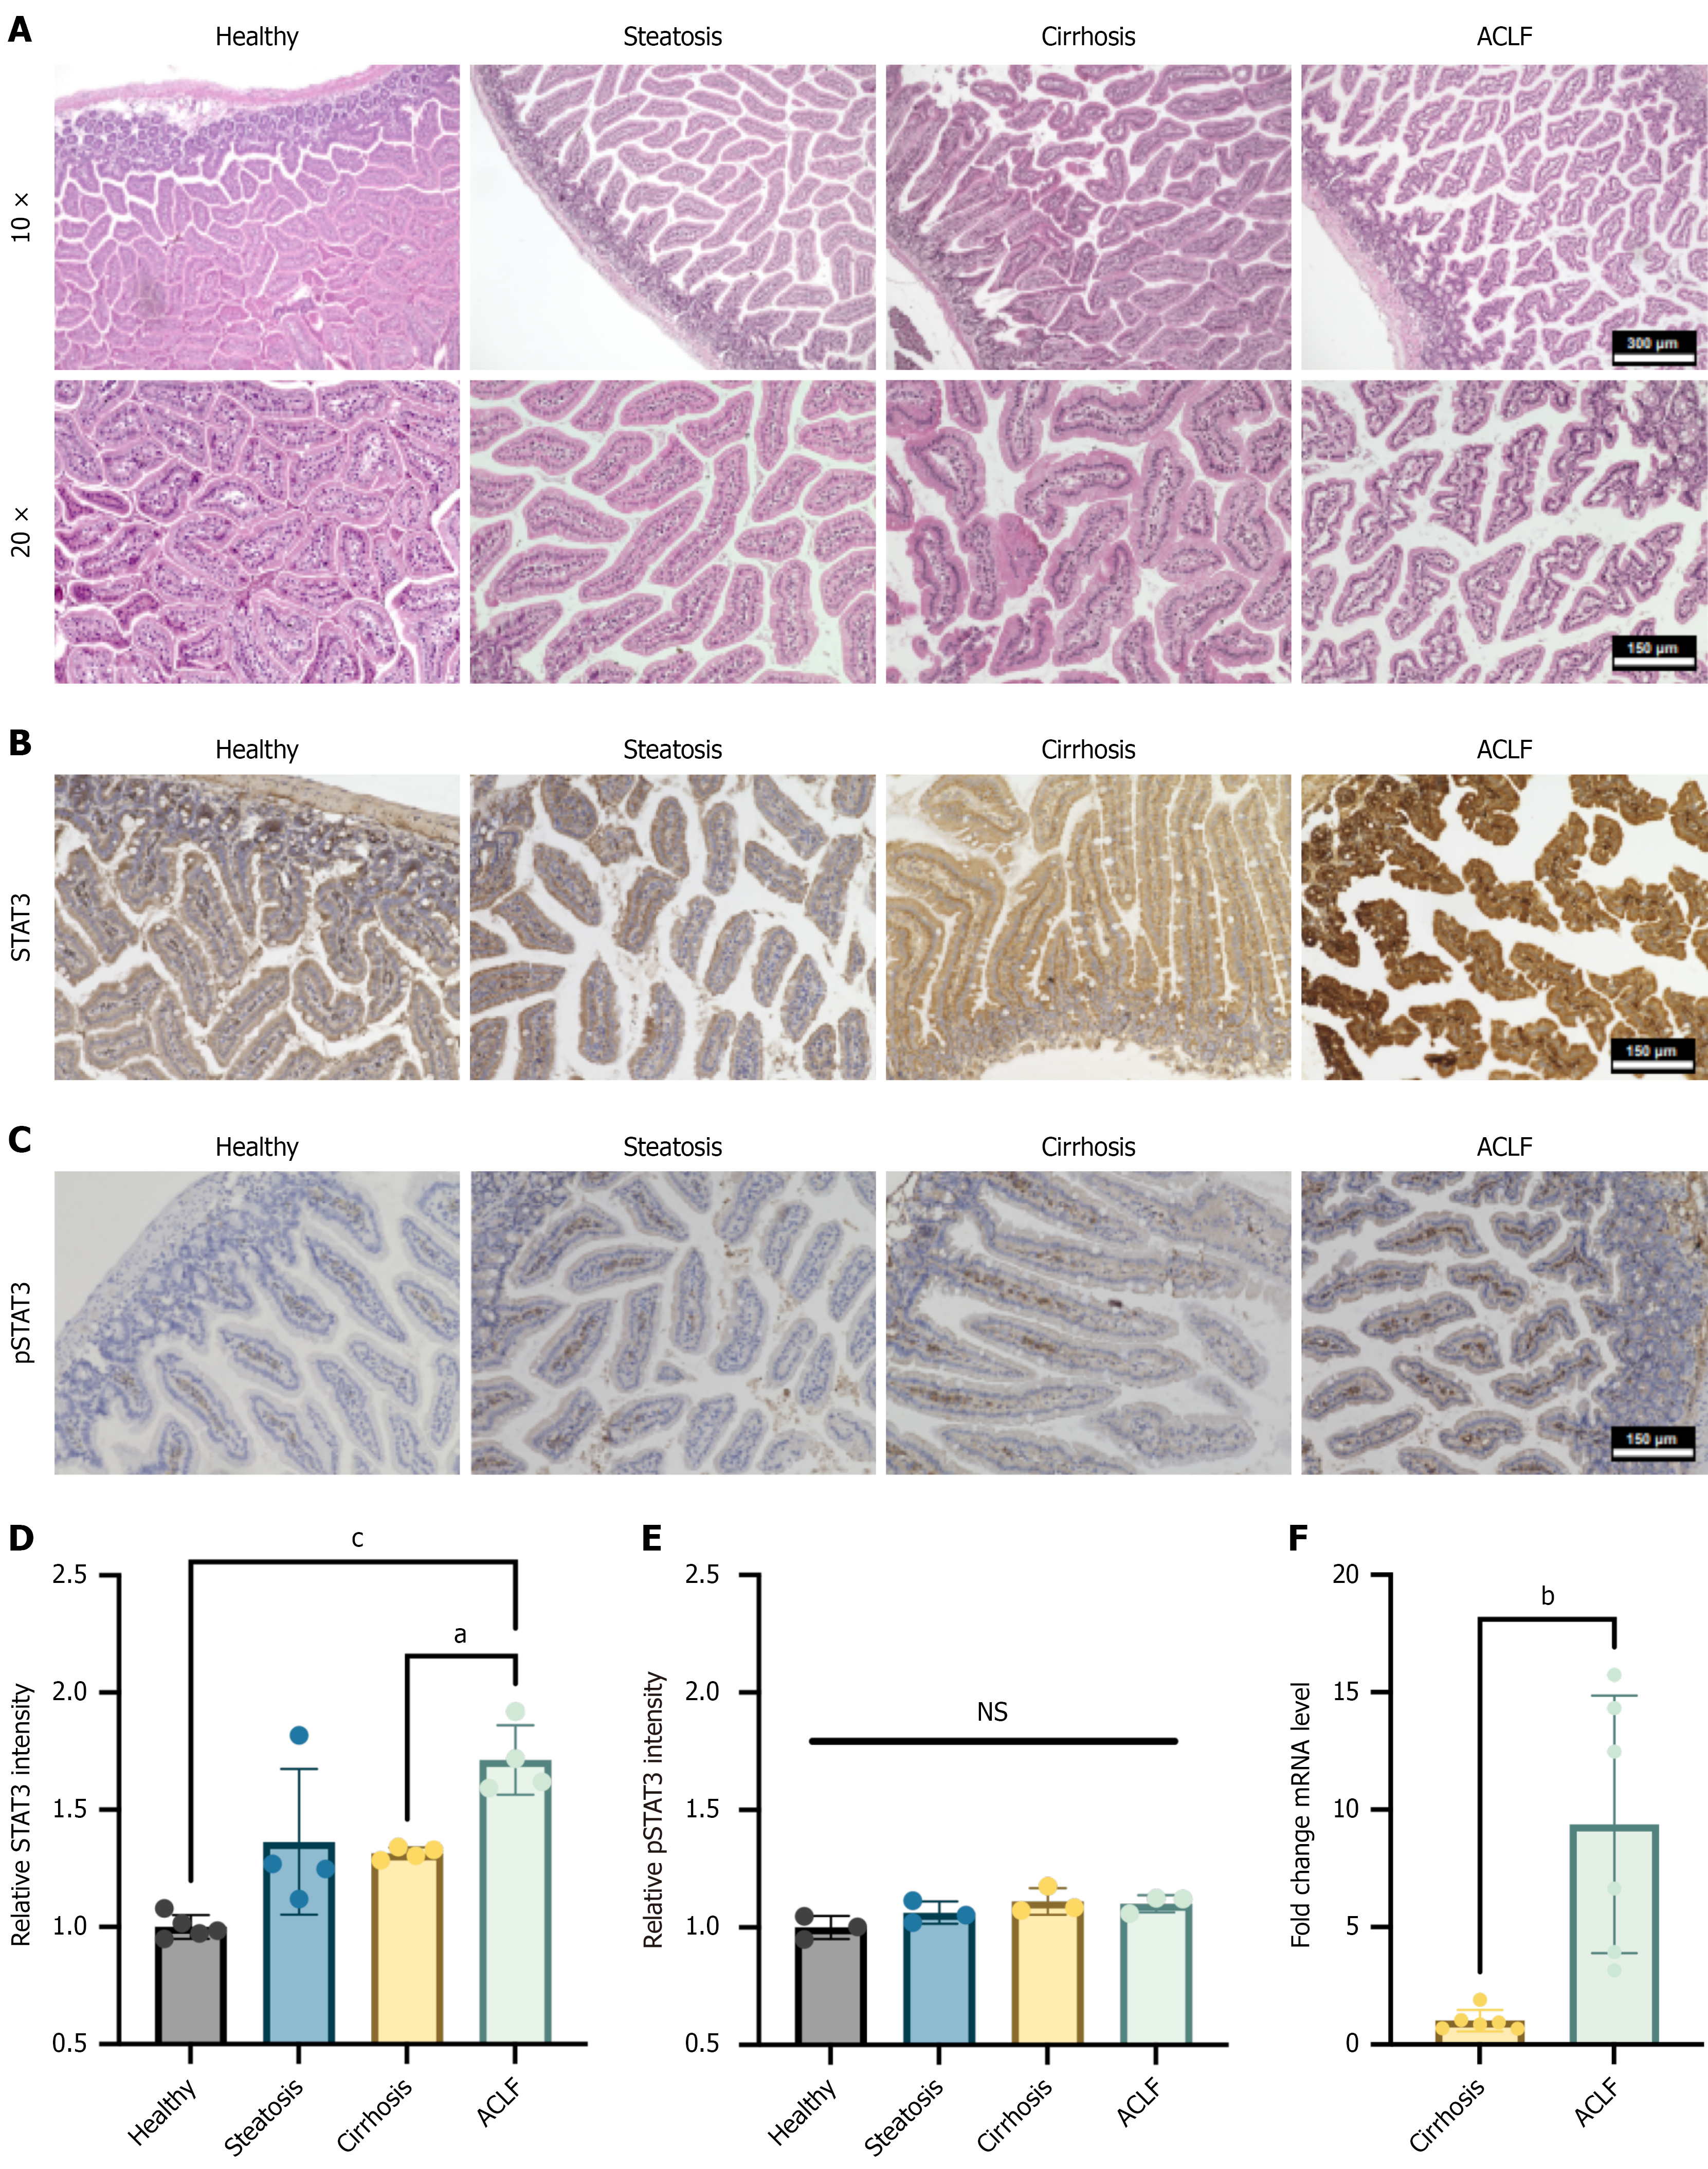
Figure 1 Intestinal tissue of mouse models shows increased signal transducer and activator of transcription 3 expression and altered epithelial integrity during progression from liver steatosis to acute-on-chronic liver failure.
A-C: Paraffin embedded intestinal tissue of mouse models generating steatosis, cirrhosis, and acute-on-chronic liver failure (ACLF) was used for: Hematoxylin and eosin (HE) staining (A); Immunohistochemical analysis of signal transducer and activator of transcription 3 (STAT3) and phospho-STAT3 (pSTAT3) and compared to tissue of healthy controls, respectively (B and C); D and E: STAT3 and pSTAT3 protein levels of immunohistochemical staining were quantified using Fiji (ImageJ) by color deconvolution, followed by signal quantification and graphical representation in GraphPad Prism; F: Disease stage-dependent changes of STAT3 messenger RNA levels from cirrhosis to ACLF were determined by reverse transcription-quantitative polymerase chain reaction (RT-qPCR) and compared. HE staining demonstrated a progressive disruption of intestinal epithelial architecture during disease progression. Immunohistochemistry revealed a significant upregulation of STAT3 expression in intestinal tissue from ACLF mice compared with healthy controls, which was confirmed by RT-qPCR. Statistical analysis of immunohistochemical staining was performed using one-way analysis of variance followed by Tukey’s multiple comparisons test. Differences in STAT3 messenger RNA expression were assessed by unpaired Student’s t-test. P values are two-sided (n = 3-6). aP < 0.05. bP < 0.01. cP < 0.001. ACLF: Acute-on-chronic liver failure; STAT3: Signal transducer and activator of transcription 3; pSTAT3: Phospho-signal transducer and activator of transcription 3; mRNA: Messenger RNA; NS: Not significant.
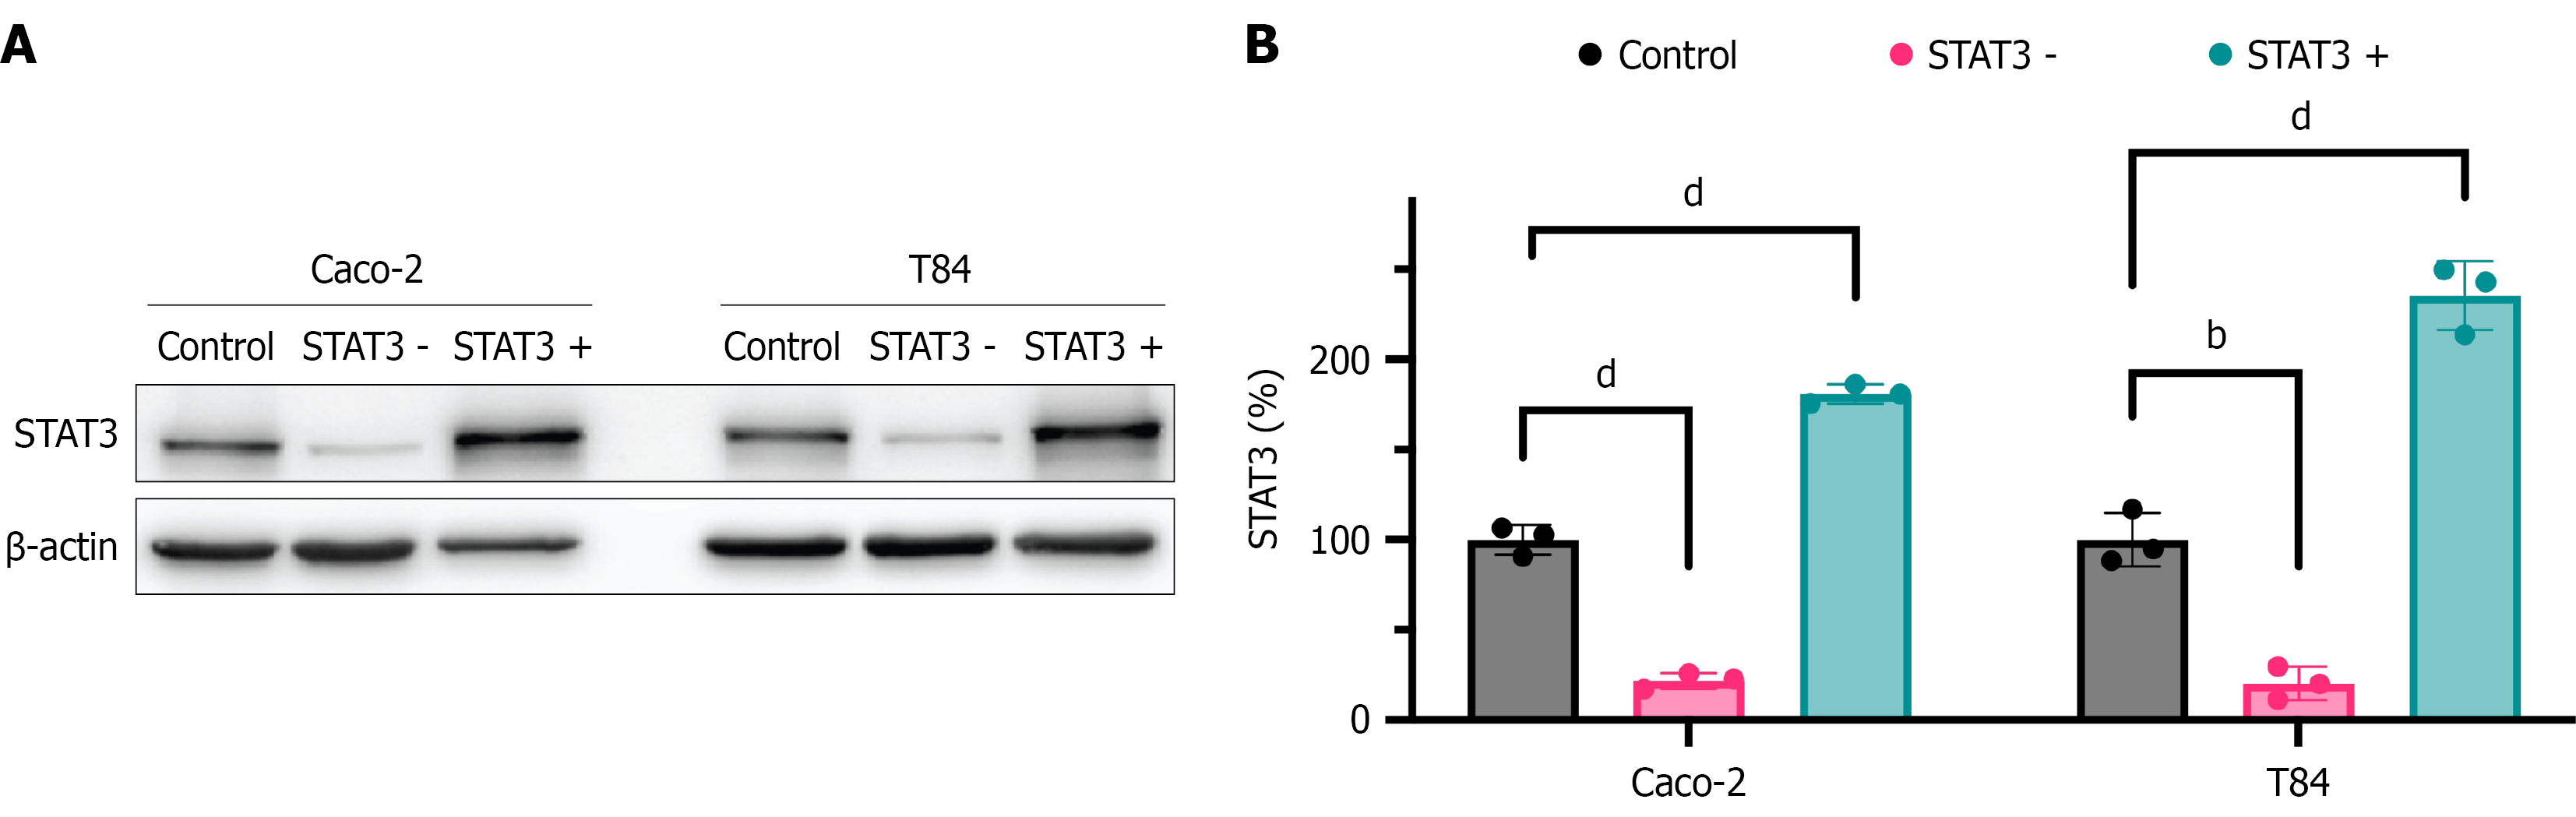
Figure 2 Successful generation of differential signal transducer and activator of transcription 3 expressing cell lines.
Signal transducer and activator of transcription 3 (STAT3) expression was modified by generation of differential, stable, lentiviral transduced Caco-2 or T84 cell lines. Reduction of STAT3 (STAT3 -) was produced via short hairpin RNA (shRNA) targeting STAT3. Enhanced STAT3 expression (STAT3 +) was induced by transduction of STAT3 expression plasmids. A non-mammalian shRNA expressing pLKO.1 vector was used as a control. Differential STAT3 expression was validated frequently from the start to the end of the experiments. Total protein was extracted, and proteins of interest were analyzed. A: Western blot; B: Quantified using Fiji (ImageJ distribution; version 2.14.0/1.54f). Values were normalized to Caco-2 or T84 control cell lines. Bars indicate mean ± SD. P values were calculated using one-way analysis of variance and post hoc Tukey analysis (n = 4). bP < 0.01. dP < 0.0001. STAT3: Signal transducer and activator of transcription 3.
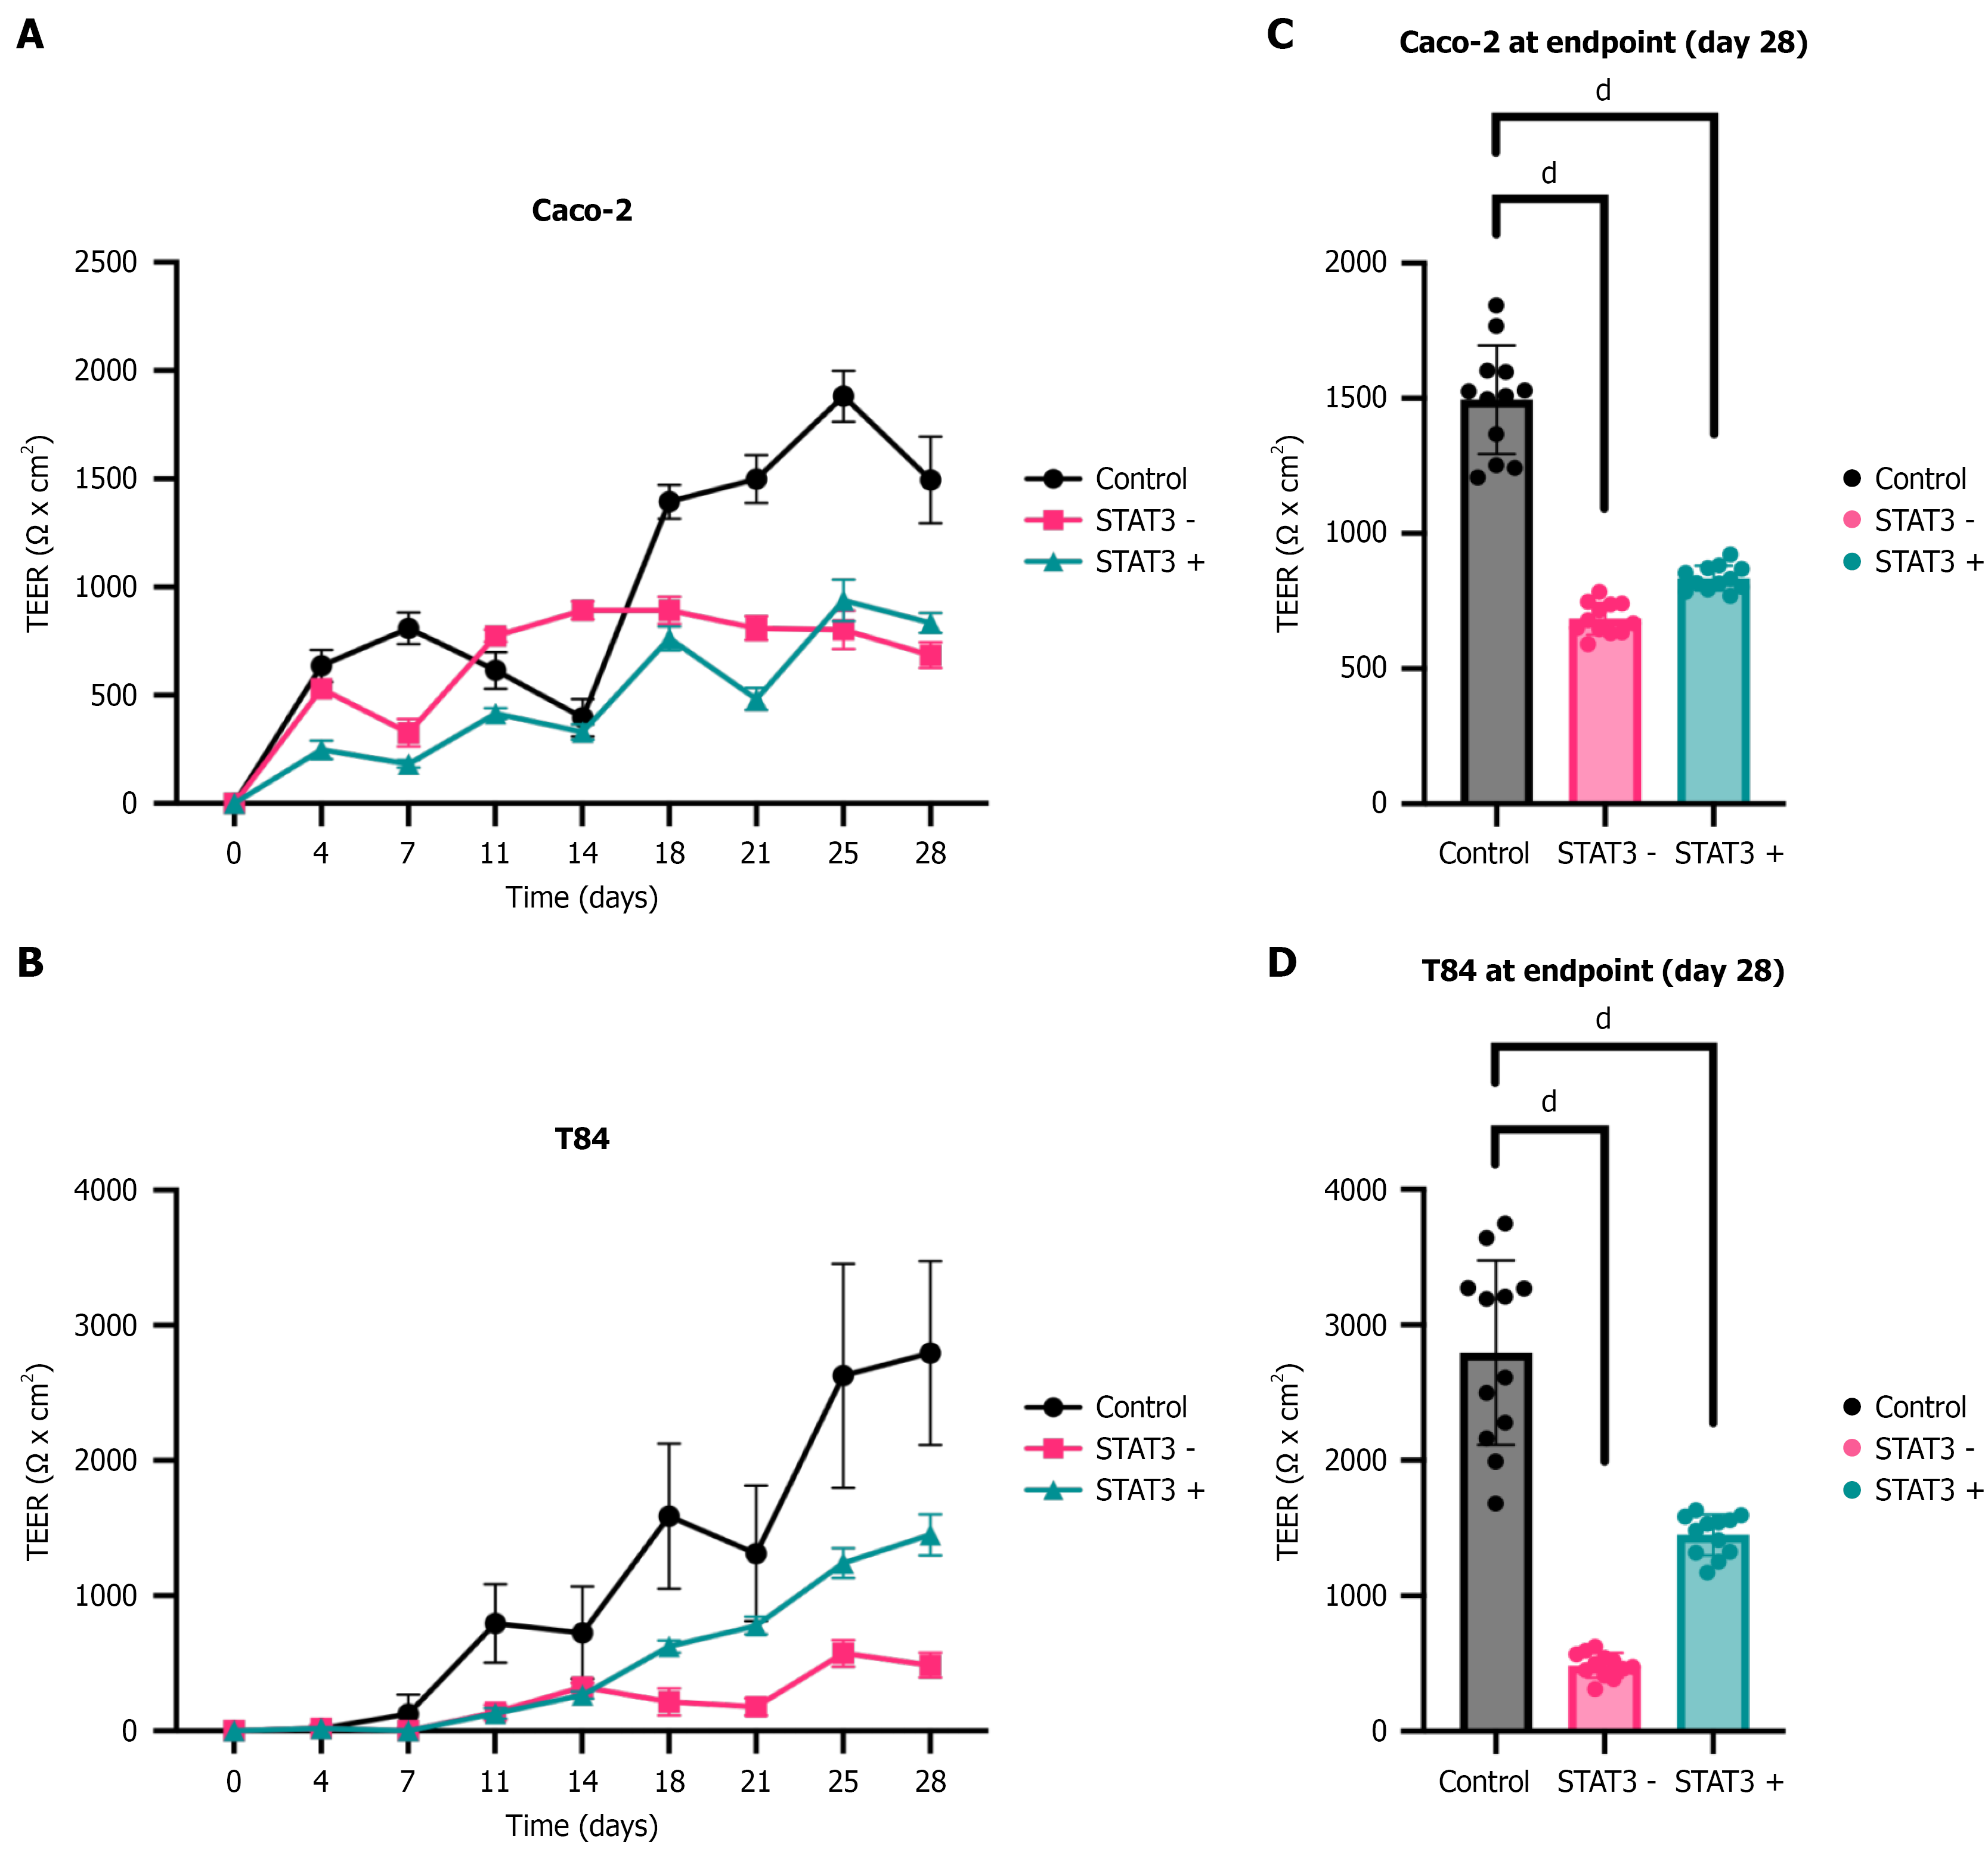
Figure 3 Signal transducer and activator of transcription 3 reduction as well as enhanced signal transducer and activator of transcription 3 expression impairs permeability of epithelial cell layers.
To determine the influence of signal transducer and activator of transcription 3 (STAT3) on epithelial permeability, monolayers consisting of Caco-2 or T84 cells with different levels of STAT3 expression were generated and epithelial permeability was analyzed by transepithelial electrical resistance (TEER) measurements over 28 days and compared to controls. A and B: Graphs show the differences of TEER values after 4 days, 7 days, 11 days, 14 days, 18 days, 21 days, 25 days and 28 days compared with endogenous STAT3 expressing (pLKO.1 transduced) controls; C and D: TEER values at day 28 were calculated in relation to controls in percent and shown as bar diagrams. Reduced (STAT3 -) as well as enhanced STAT3 (STAT3 +) expression resulted in a significant reduction in monolayer resistance values of Caco-2 and T84 monolayers. Data are expressed as mean ± SEM as appropriate. Differences between mean resistance values were assessed for statistical significance using one-way analysis of variance followed by Dunnett multiple comparisons test. P values are two-sided (n = 3-5). dP < 0.0001. STAT3: Signal transducer and activator of transcription 3; TEER: Transepithelial electrical resistance.
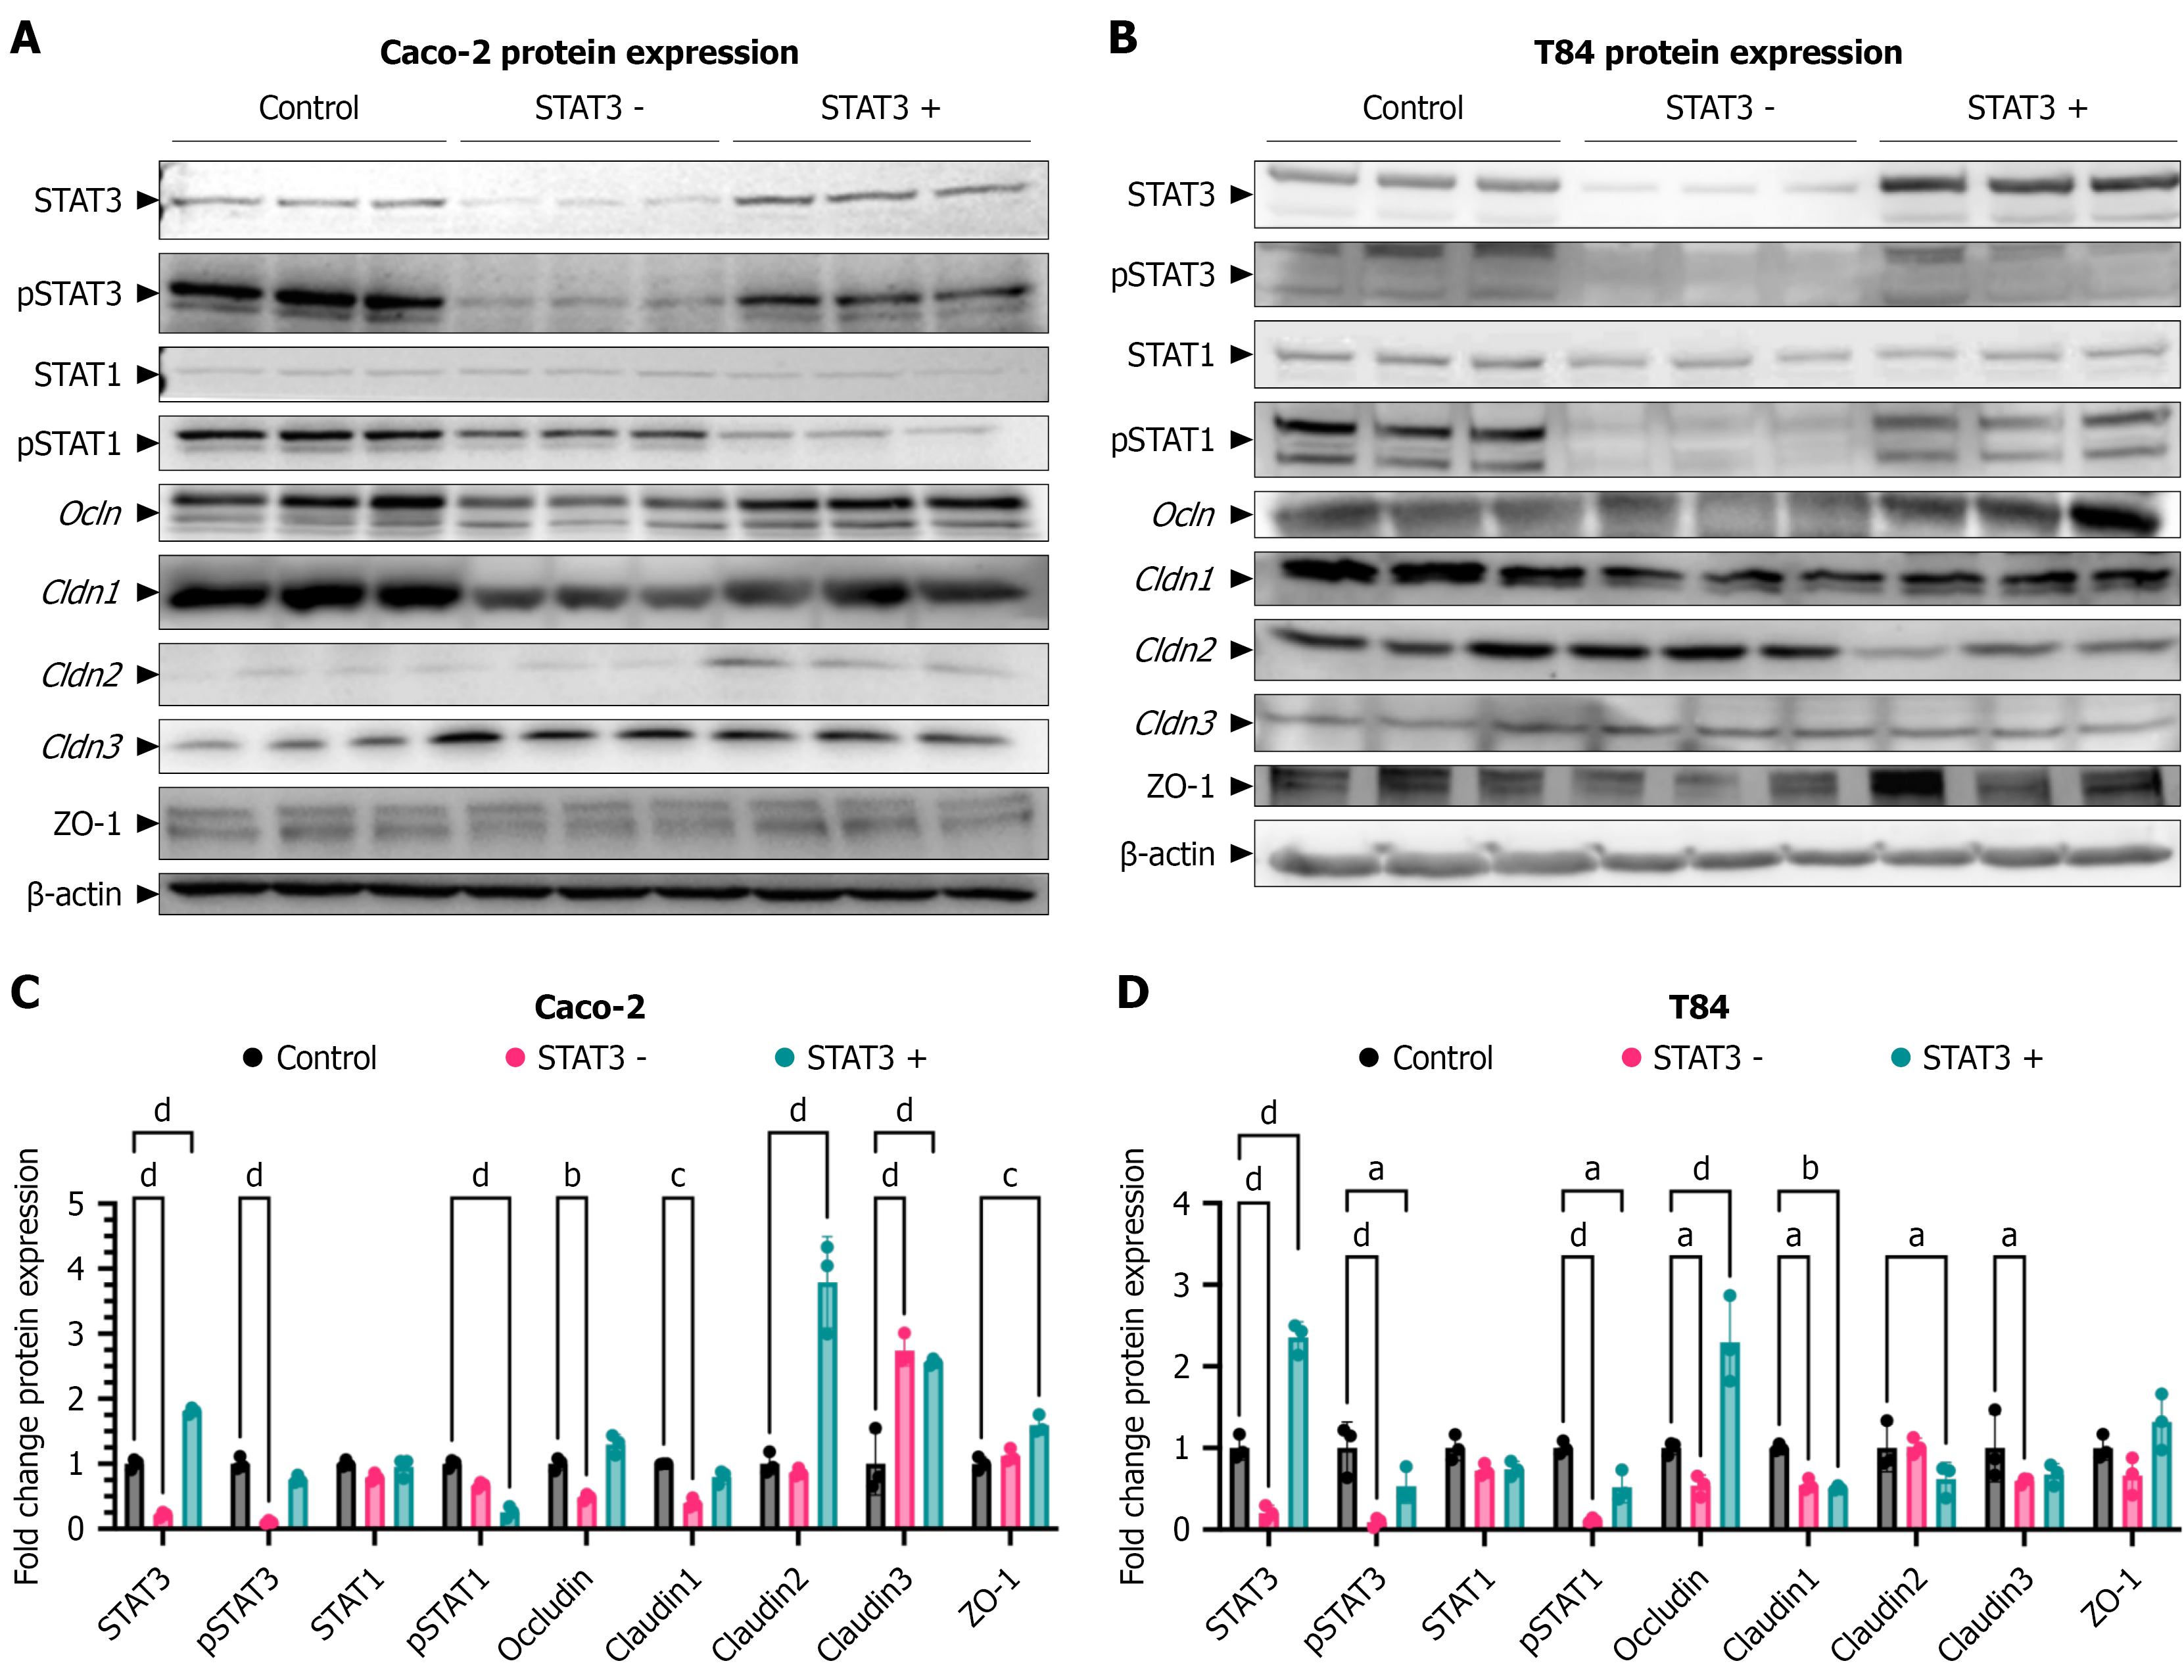
Figure 4 Expression of relevant tight junction proteins is significantly modified by differential signal transducer and activator of transcription 3 expression in Caco-2 and T84 monolayers.
Monolayers consisting of Caco-2 or T84 cells with different levels of signal transducer and activator of transcription 3 (STAT3) expression were generated and epithelial permeability was determined by transepithelial electrical resistance measurements over 28 days. A and B: Whole protein extracts were analyzed via western blot (an exemplary blot is shown on which the protein extracts from three independently performed test series were applied next to each other; C and D: Quantified using Fiji (ImageJ distribution; version 2.14.0/1.54f). Values were normalized to Caco-2 or T84 control cell lines. Bars indicate mean ± SD. Western blots were performed with specific primary antibodies against STAT3, phospho-STAT3, STAT1, phospho-STAT1, Ocln, Cldn1, Cldn2, Cldn3 and zonulin 1, while β-actin served as a housekeeping protein. As shown, reduced (STAT3 -) as well as enhanced STAT3 (STAT3 +) expression had an important impact on the activation of STAT1 as well as the expression of tight junction proteins. P values were calculated using two-way analysis of variance followed by Dunnett’s multiple comparisons test. The data shown are mean ± SD, and the following P values were considered statistically significant (n ≥ 3). aP < 0.05. bP < 0.01. cP < 0.001. dP < 0.0001. STAT3: Signal transducer and activator of transcription 3; pSTAT3: Phospho-signal transducer and activator of transcription 3; STAT1: Signal transducer and activator of transcription 1; pSTAT1: Phospho-signal transducer and activator of transcription 1; ZO-1: Zonula occludens-1.
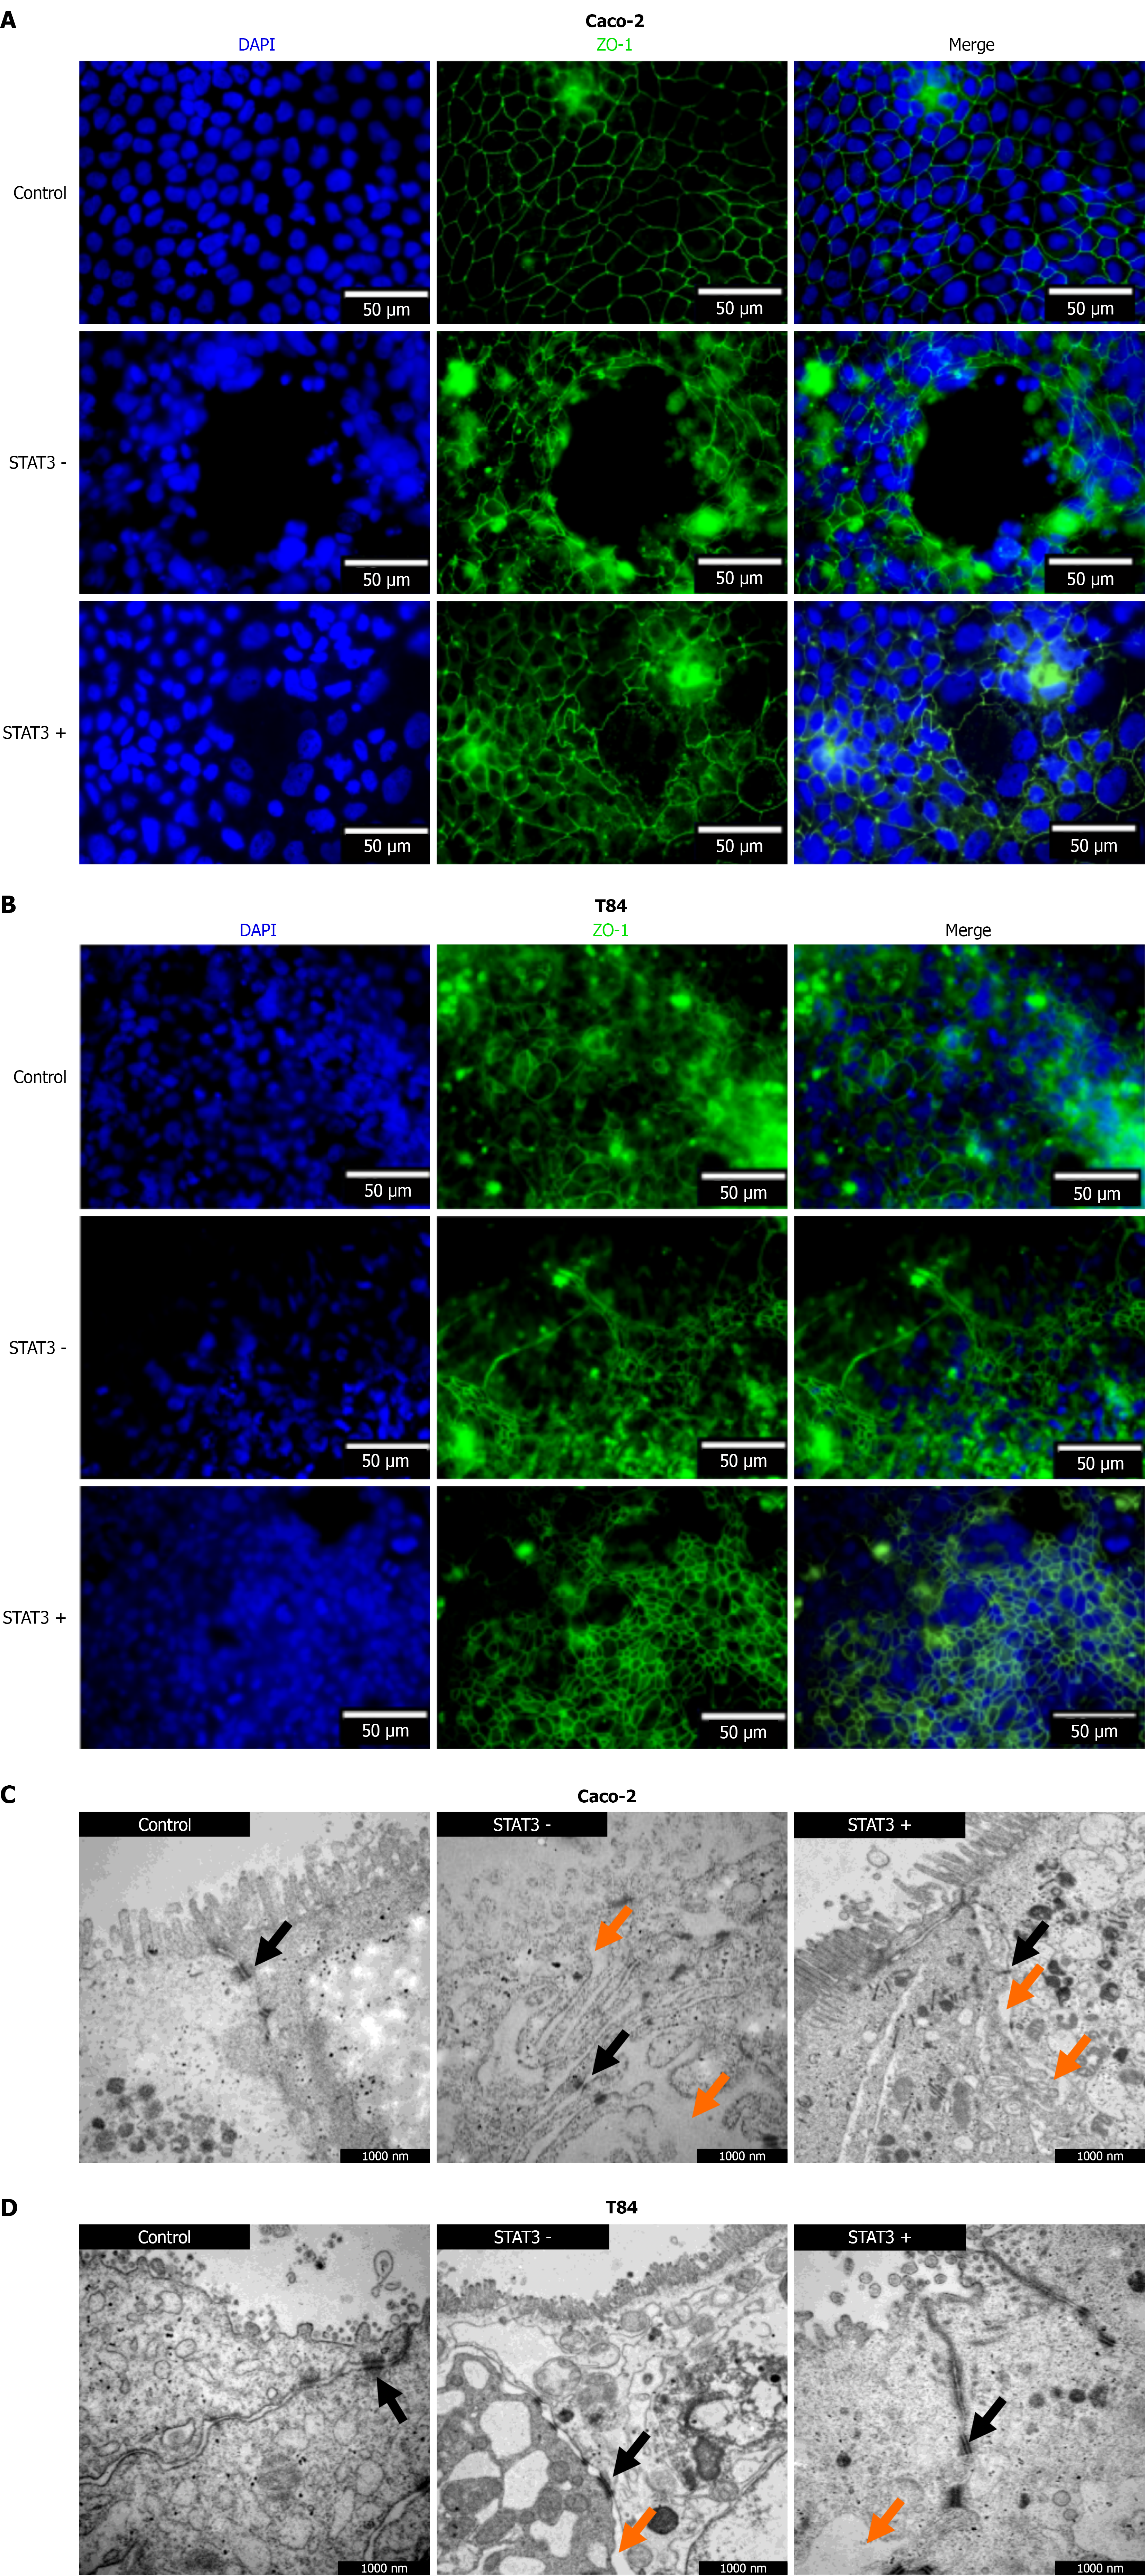
Figure 5 Immunofluorescence staining and transmission electron microscopy verify deconstructed monolayer architecture in enhanced as well as reduced signal transducer and activator of transcription 3 expressing Caco-2 and T84 monolayers.
Differential signal transducer and activator of transcription 3 (STAT3) expressing Caco-2 and T84 cell lines were grown over a period of 28 days and the formation of Caco-2 and T84 monolayers was verified during this period. A and B: Caco-2 (A) T84 (B) monolayers were fixed, permeabilized, incubated with anti zonula occludens-1, and subsequently stained with a fluorescent-labeled antibody. Nuclei were counterstained with 4’,6-diamidino-2-phenylindole. Imaging was performed using a Keyence BZ X810 fluorescence microscope; C and D: In parallel, Caco-2 (C) and T84 (D) monolayers were prepared for transmission electron microscopy (TEM). Immunofluorescence as well as TEM showed the deconstructed architecture in enhanced STAT3 (STAT3 +) as well as reduced STAT3 (STAT3 -) expressing monolayers. Orange arrows = gaps at cell boundaries, black arrows = location of tight junctions. STAT3: Signal transducer and activator of transcription 3; DAPI: 4’,6-diamidino-2-phenylindole; ZO-1: Zonula occludens-1.
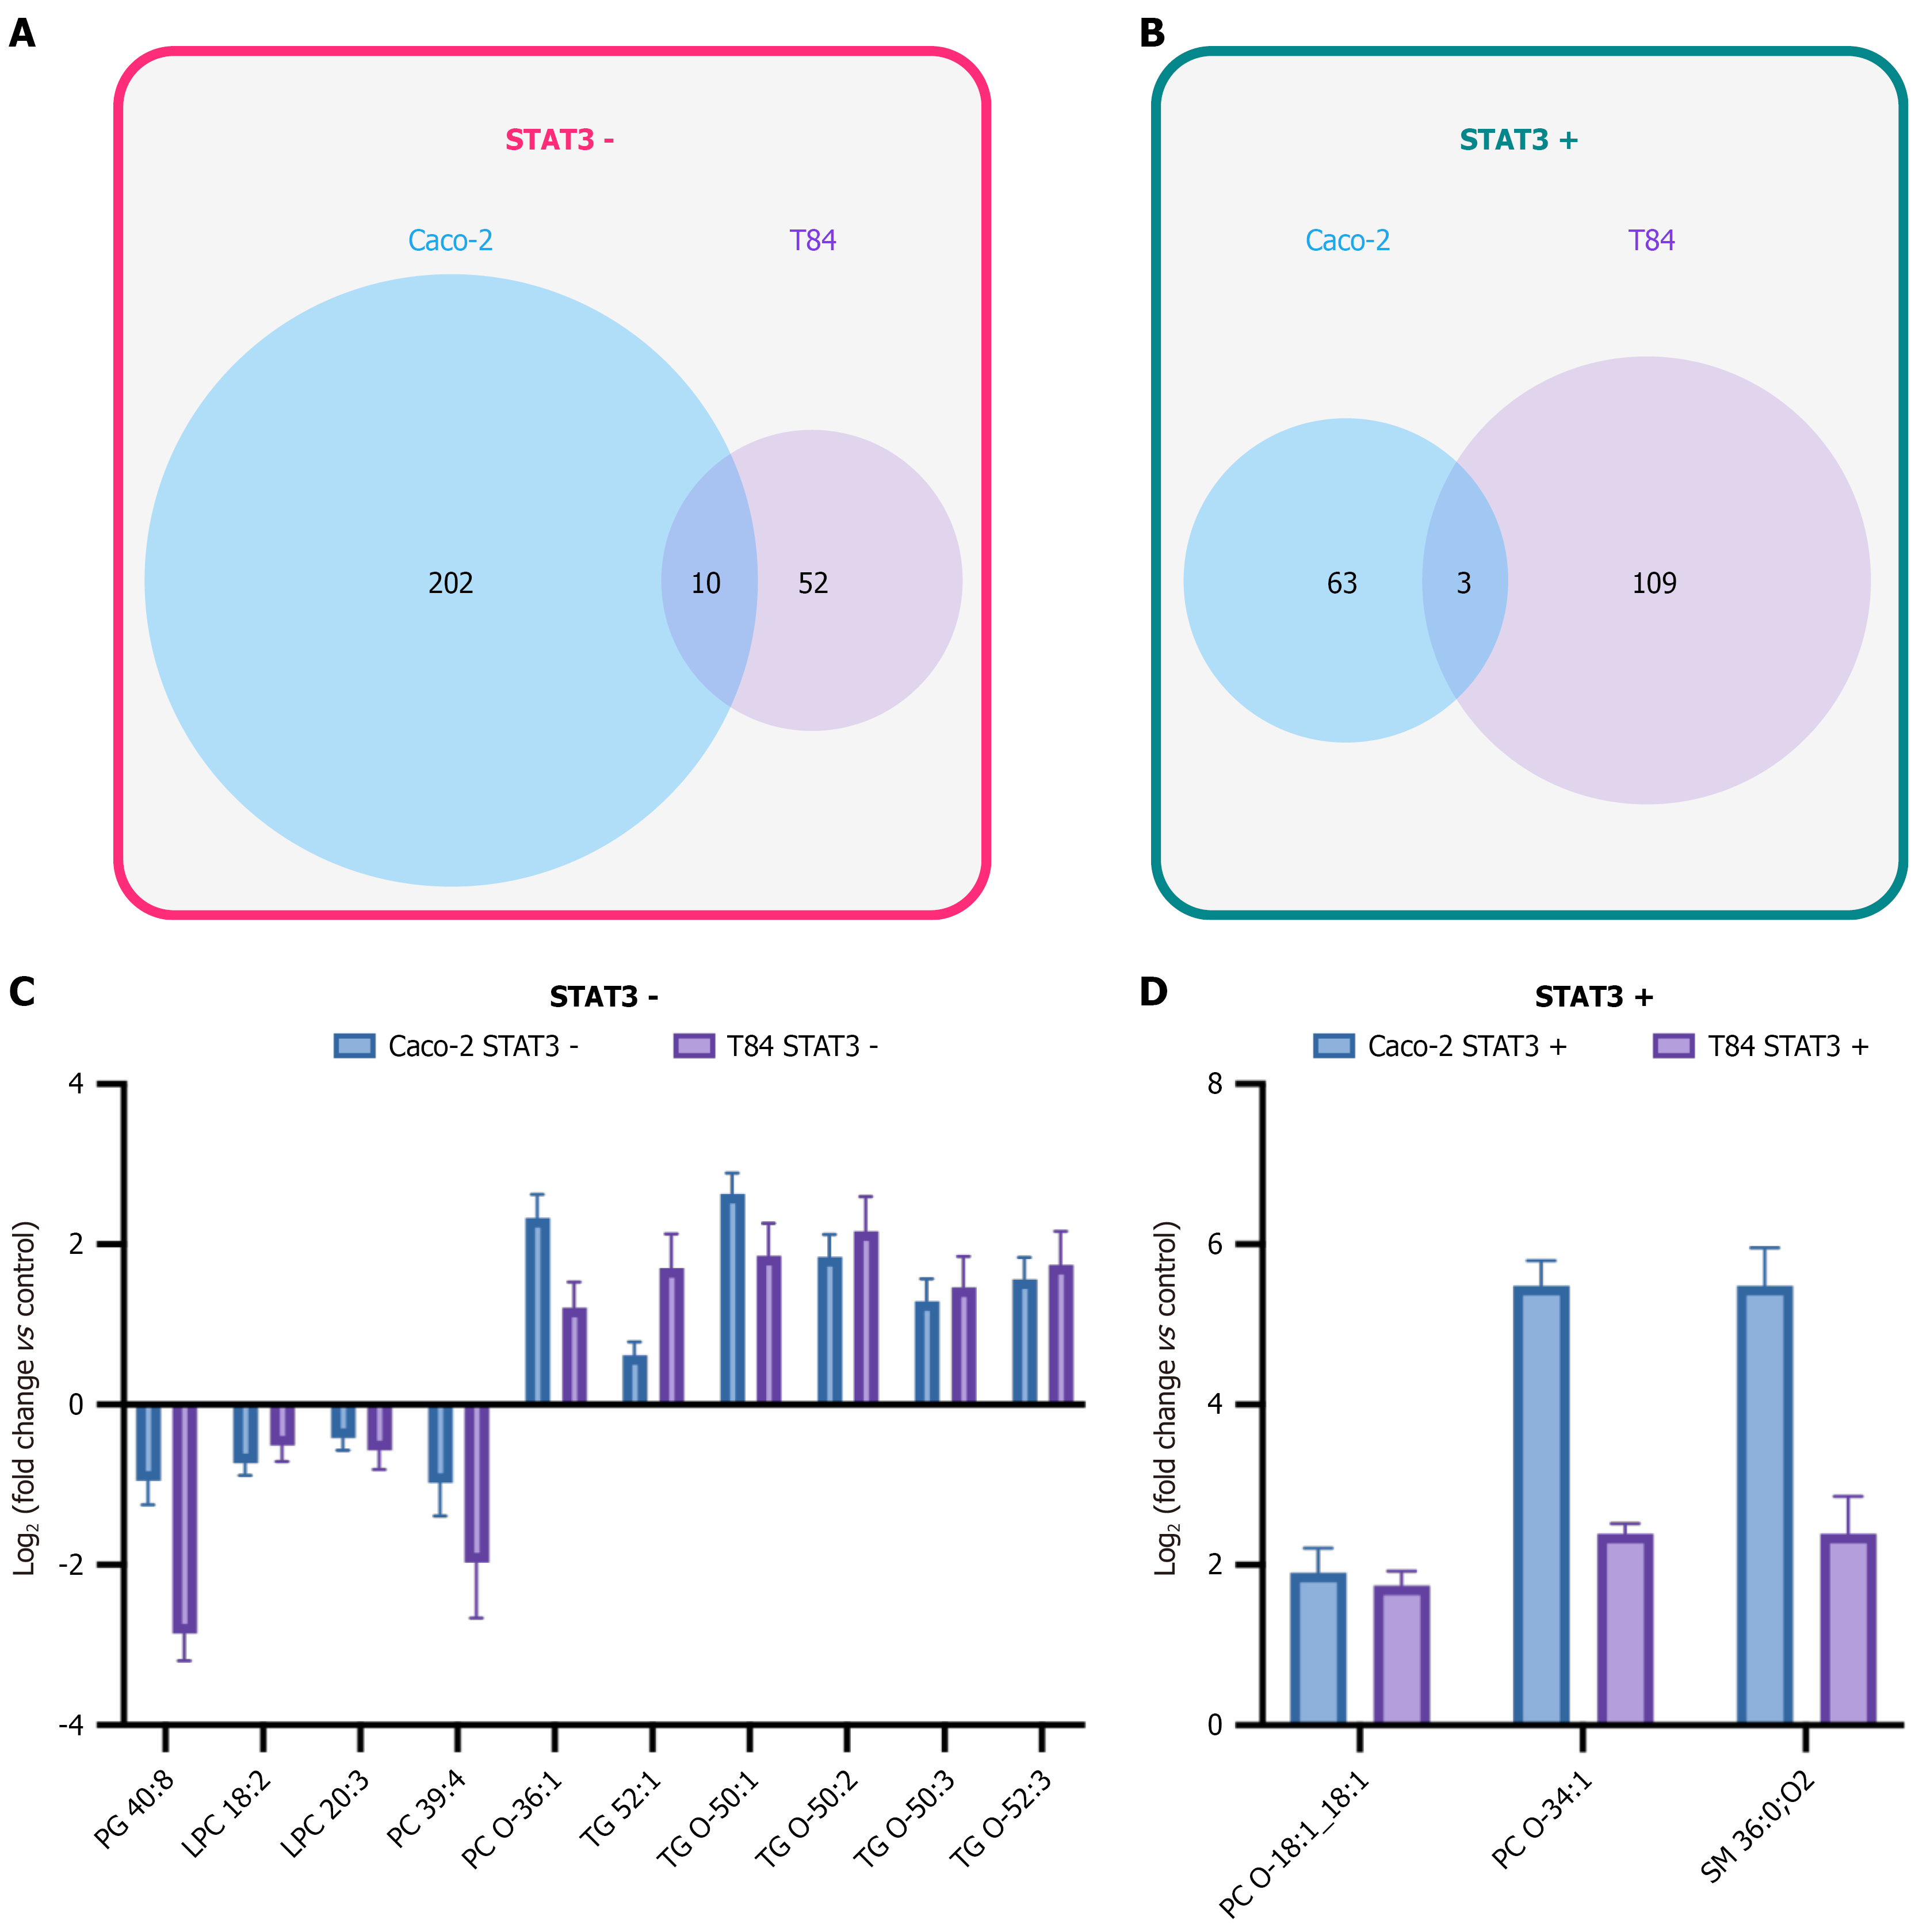
Figure 6 Identification of signal transducer and activator of transcription 3-dependent differences of lipid species by liquid chromatography high-resolution mass spectrometry analysis.
Caco-2 and T84 cell monolayers were generated over a period of 28 days. Thereafter, cells were harvested and lipidomic analysis was performed. A and B: Venn diagrams illustrate the number of significantly altered lipid species in decreased signal transducer and activator of transcription 3 (STAT3) (STAT3 -) and enhanced STAT3 (STAT3 +) expressing Caco-2 and T84 cell monolayers compared to the controls. The overlapping area represents lipids significantly regulated in both epithelial models, indicating STAT3-dependent lipid remodeling; C and D: Bars show all lipid species that were significantly changed in Caco-2 as well as T84 monolayers (see also A and B), respectively. Bars represent mean log2 fold change ± SEM. Cross-validation across two independent intestinal epithelial models ensures robustness and minimizes false-positive discovery. P < 0.05, two-sided Welch’s t-test (n = 5). STAT3: Signal transducer and activator of transcription 3; PG: Phosphatidylglycerol; LPC: Lysophosphatidylcholines; PC: Phosphatidylcholine; TG: Triacylglycerol; SM: Sphingomyelin; PC O: Ether-linked phosphatidylcholine; TG O: Ether-linked triacylglycerol.
- Citation: Leinz N, Beyer S, Yoganathan-Kugarajan B, Kraus N, Ortiz C, Hahnefeld L, Gurke R, Başoğlu M, Plotz G, Eimer S, Zeuzem S, Trebicka J, Welsch C, Brieger A. Dysregulated signal transducer and activator of transcription 3 drives intestinal permeability and may contribute to acute-on-chronic liver failure. World J Gastroenterol 2026; 32(30): 119465
- URL: https://www.wjgnet.com/1007-9327/full/v32/i30/119465.htm
- DOI: https://dx.doi.org/10.3748/wjg.v32.i30.119465