
















Copyright: ©Author(s) 2026.
World J Gastroenterol. Aug 14, 2026; 32(30): 118301
Published online Aug 14, 2026. doi: 10.3748/wjg.118301
Published online Aug 14, 2026. doi: 10.3748/wjg.118301
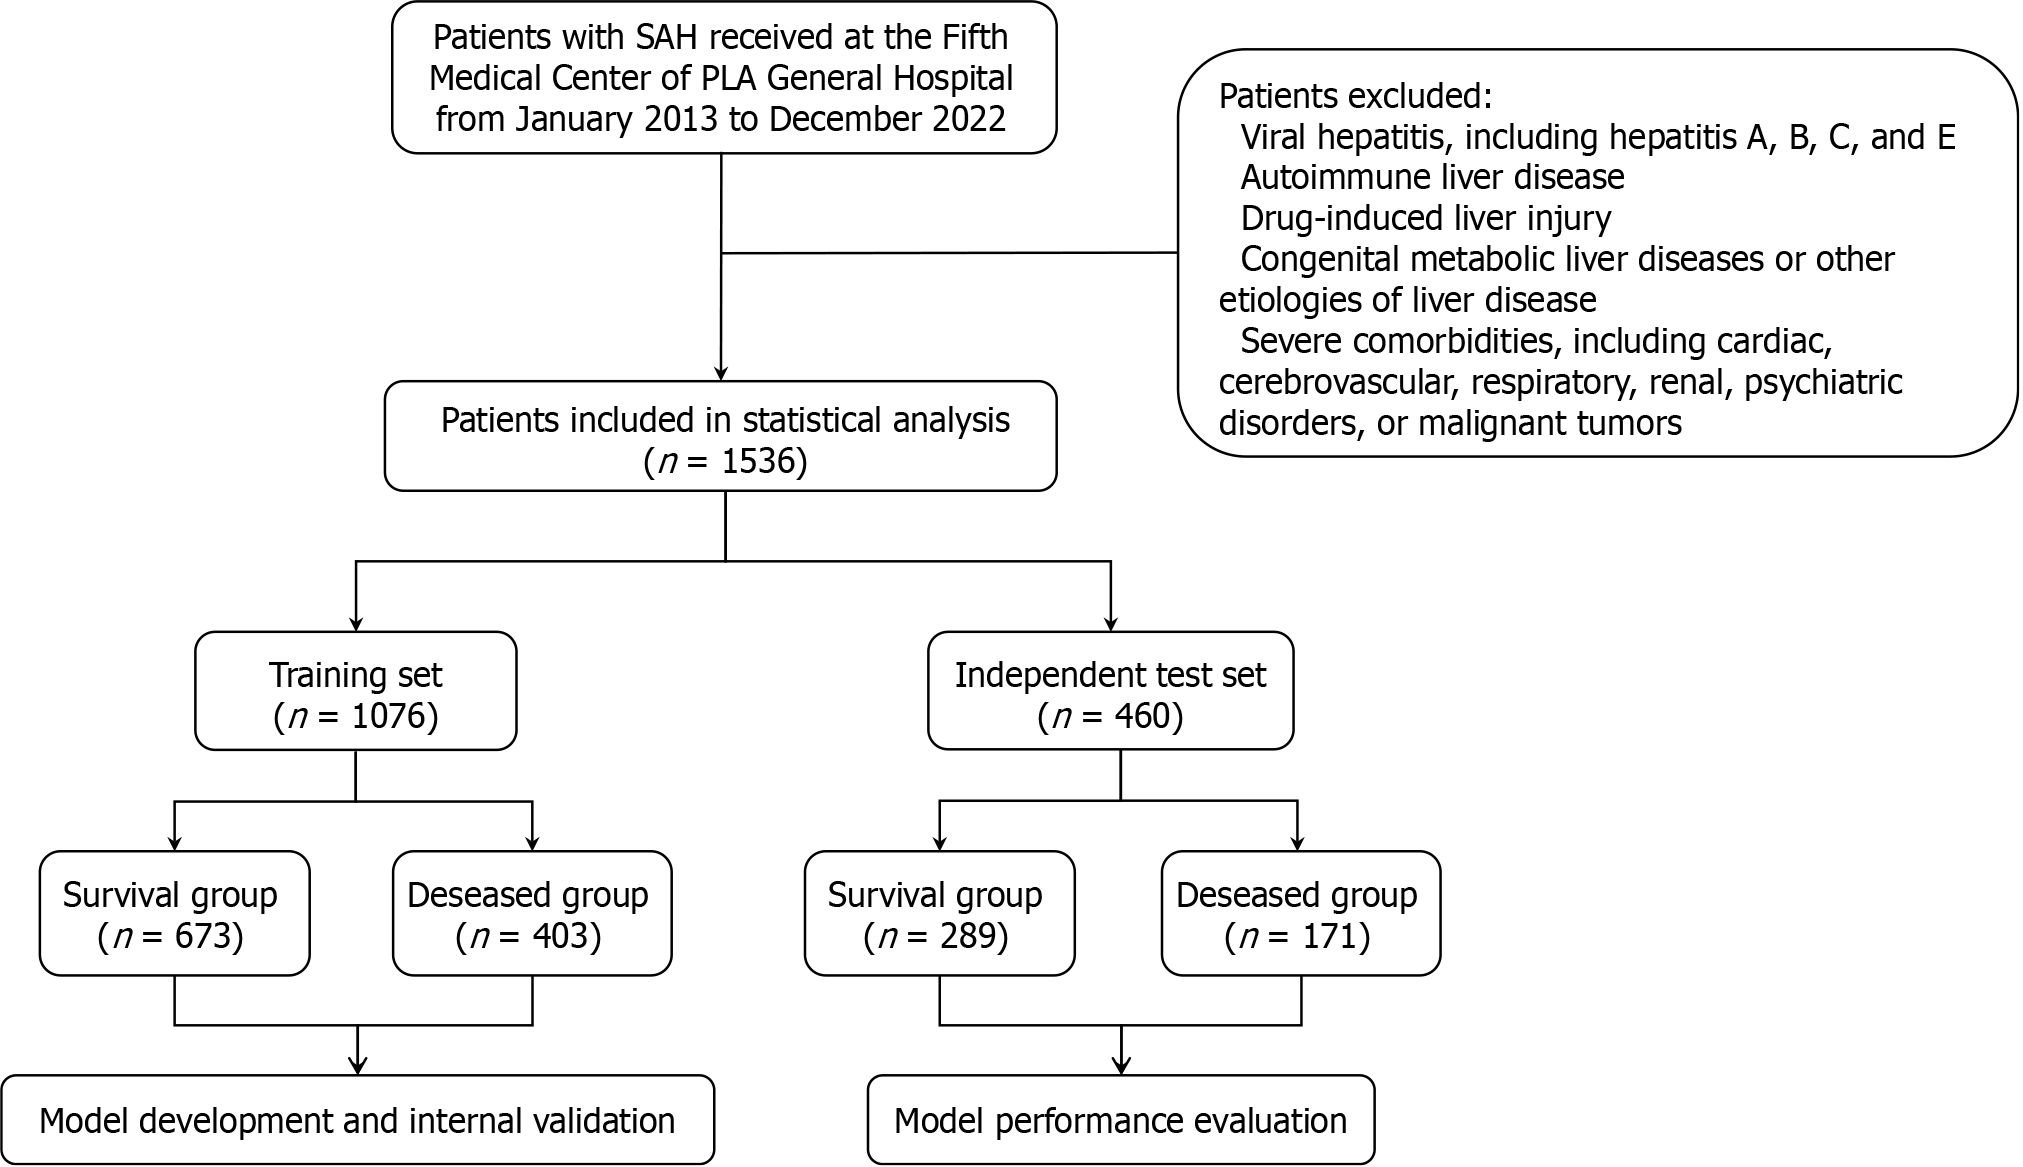
Figure 1 Flowchart of patient selection and model development.
A total of 1536 patients with severe alcoholic hepatitis were included based on the predefined inclusion and exclusion criteria. The cohort was randomly split into a training set (n = 1076) for model development and internal validation, and an independent test set (n = 460) for the final evaluation of model performance. The number of survivors and non-survivors in each set is also detailed. SAH: Severe alcoholic hepatitis.
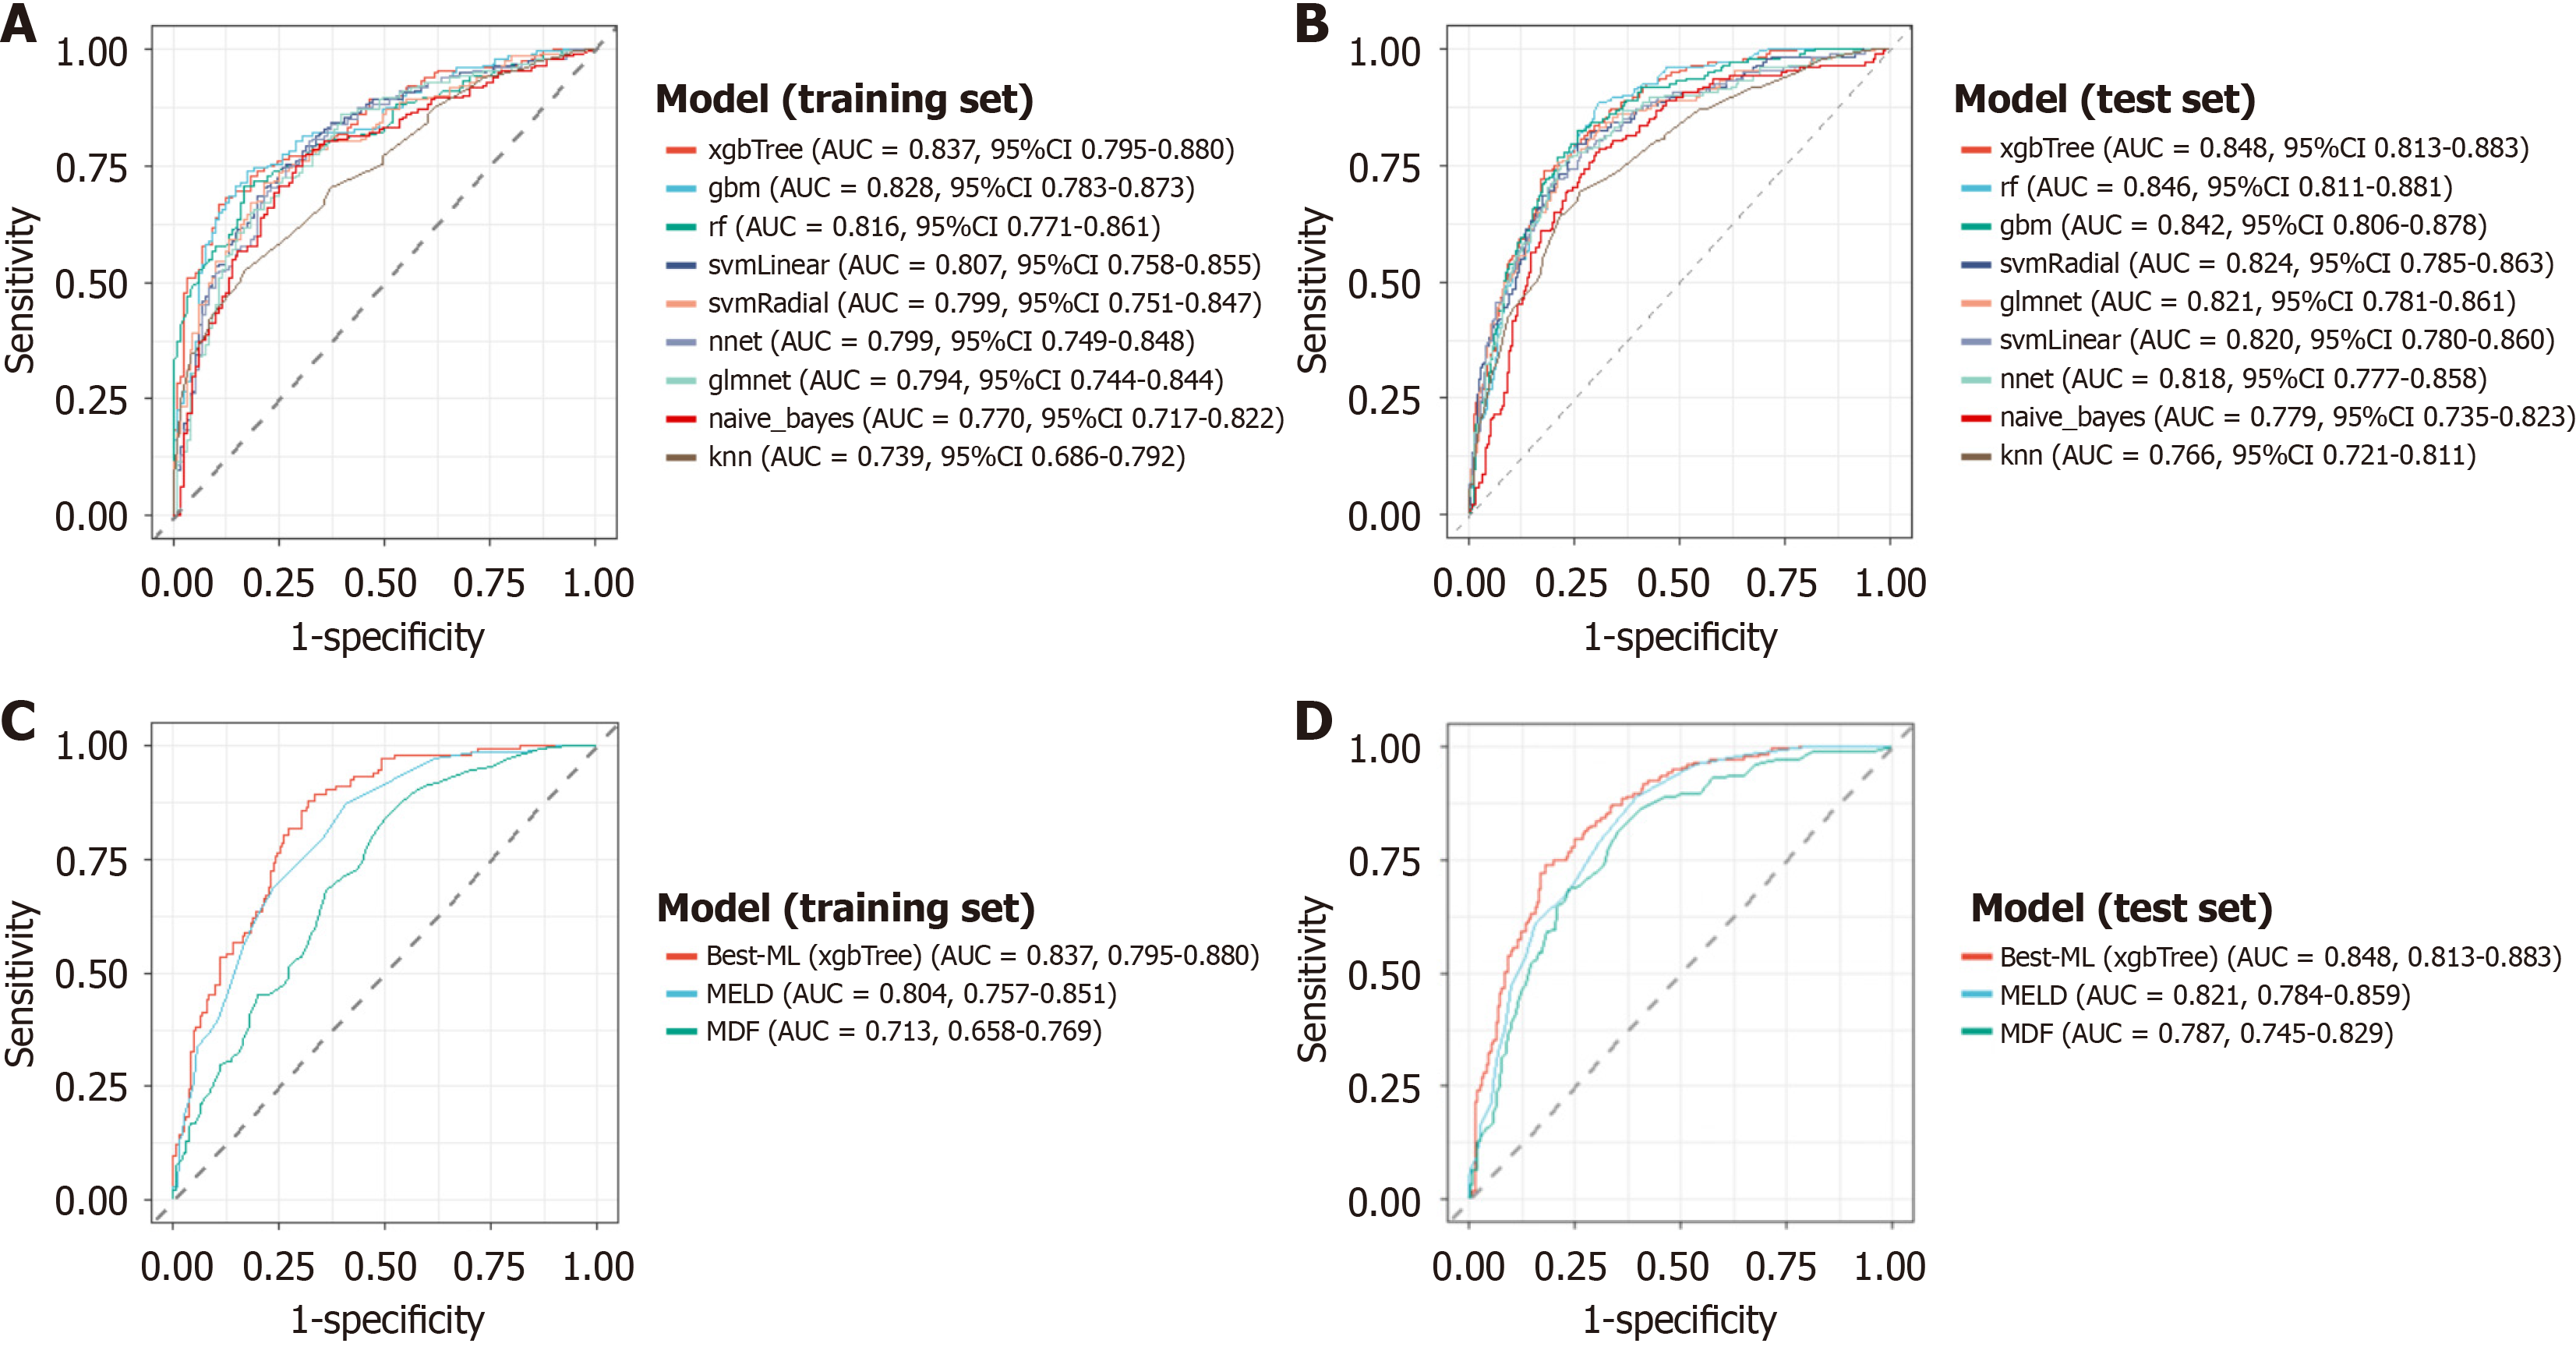
Figure 2 Machine learning model performance and comparison.
A: Receiver operating characteristic (ROC) curves of nine machine learning models in the training set (internal validation); B: ROC curves of the nine models in the independent test set; C: ROC curve comparison between the best-performing model (XGBoost) and traditional scores (model for end-stage liver disease and Maddrey discriminant function) in the training set; D: ROC curve comparison between the XGBoost model and traditional scores in the independent test set. AUC: Area under the curve; ML: Machine learning; MELD: Model for end-stage liver disease; MDF: Maddrey discriminant function.
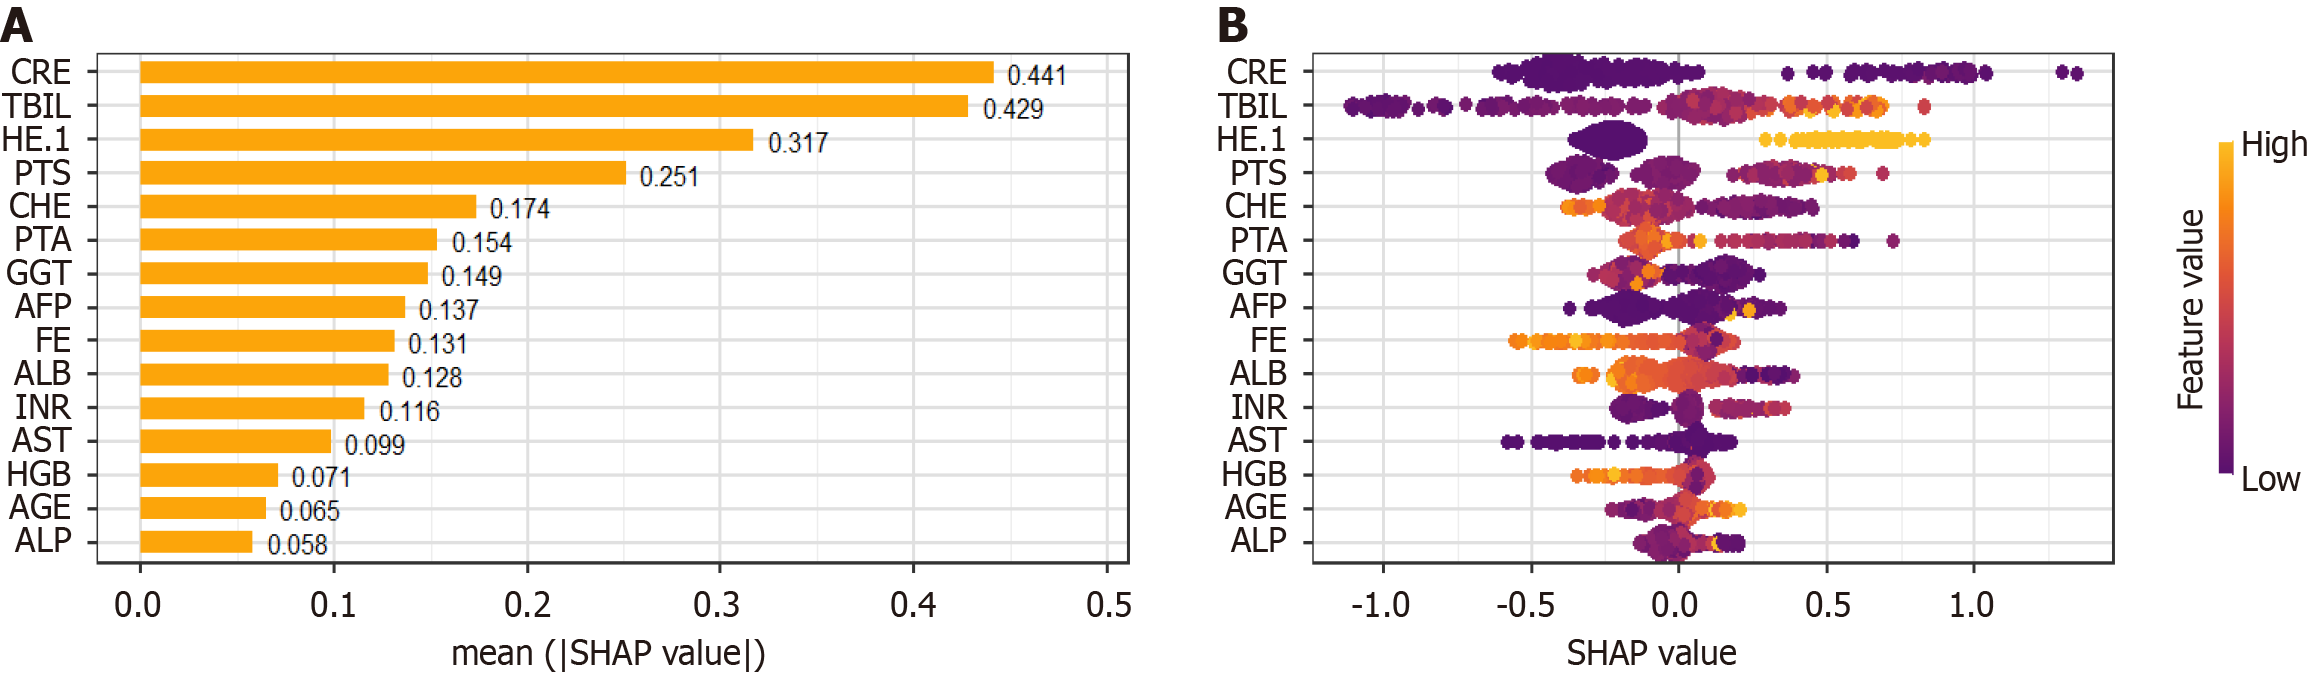
Figure 3 Interpretation of the XGBoost model using Shapley Additive exPlanations analysis on the training set.
A: Shapley Additive exPlanations (SHAP) summary plot illustrating the global importance and impact of the top 20 predictors. Each point represents a patient for a given feature, with the color indicating the feature's value (red for high, blue for low); B: SHAP beeswarm plot providing a detailed distribution of each feature's impact on the model output. CRE: Creatinine; TBIL: Total bilirubin; HE: Hepatic encephalopathy; PTS: Prothrombin time seconds; CHE: Cholinesterase; PTA: Prothrombin activity; GGT: Gamma-glutamyl transferase; AFP: Alpha-fetoprotein; FE: Iron; ALB: Albumin; INR: International normalized ratio; AST: Aspartate aminotransferase; HGB: Hemoglobin; ALP: Alkaline phosphatase; SHAP: Shapley Additive exPlanations.
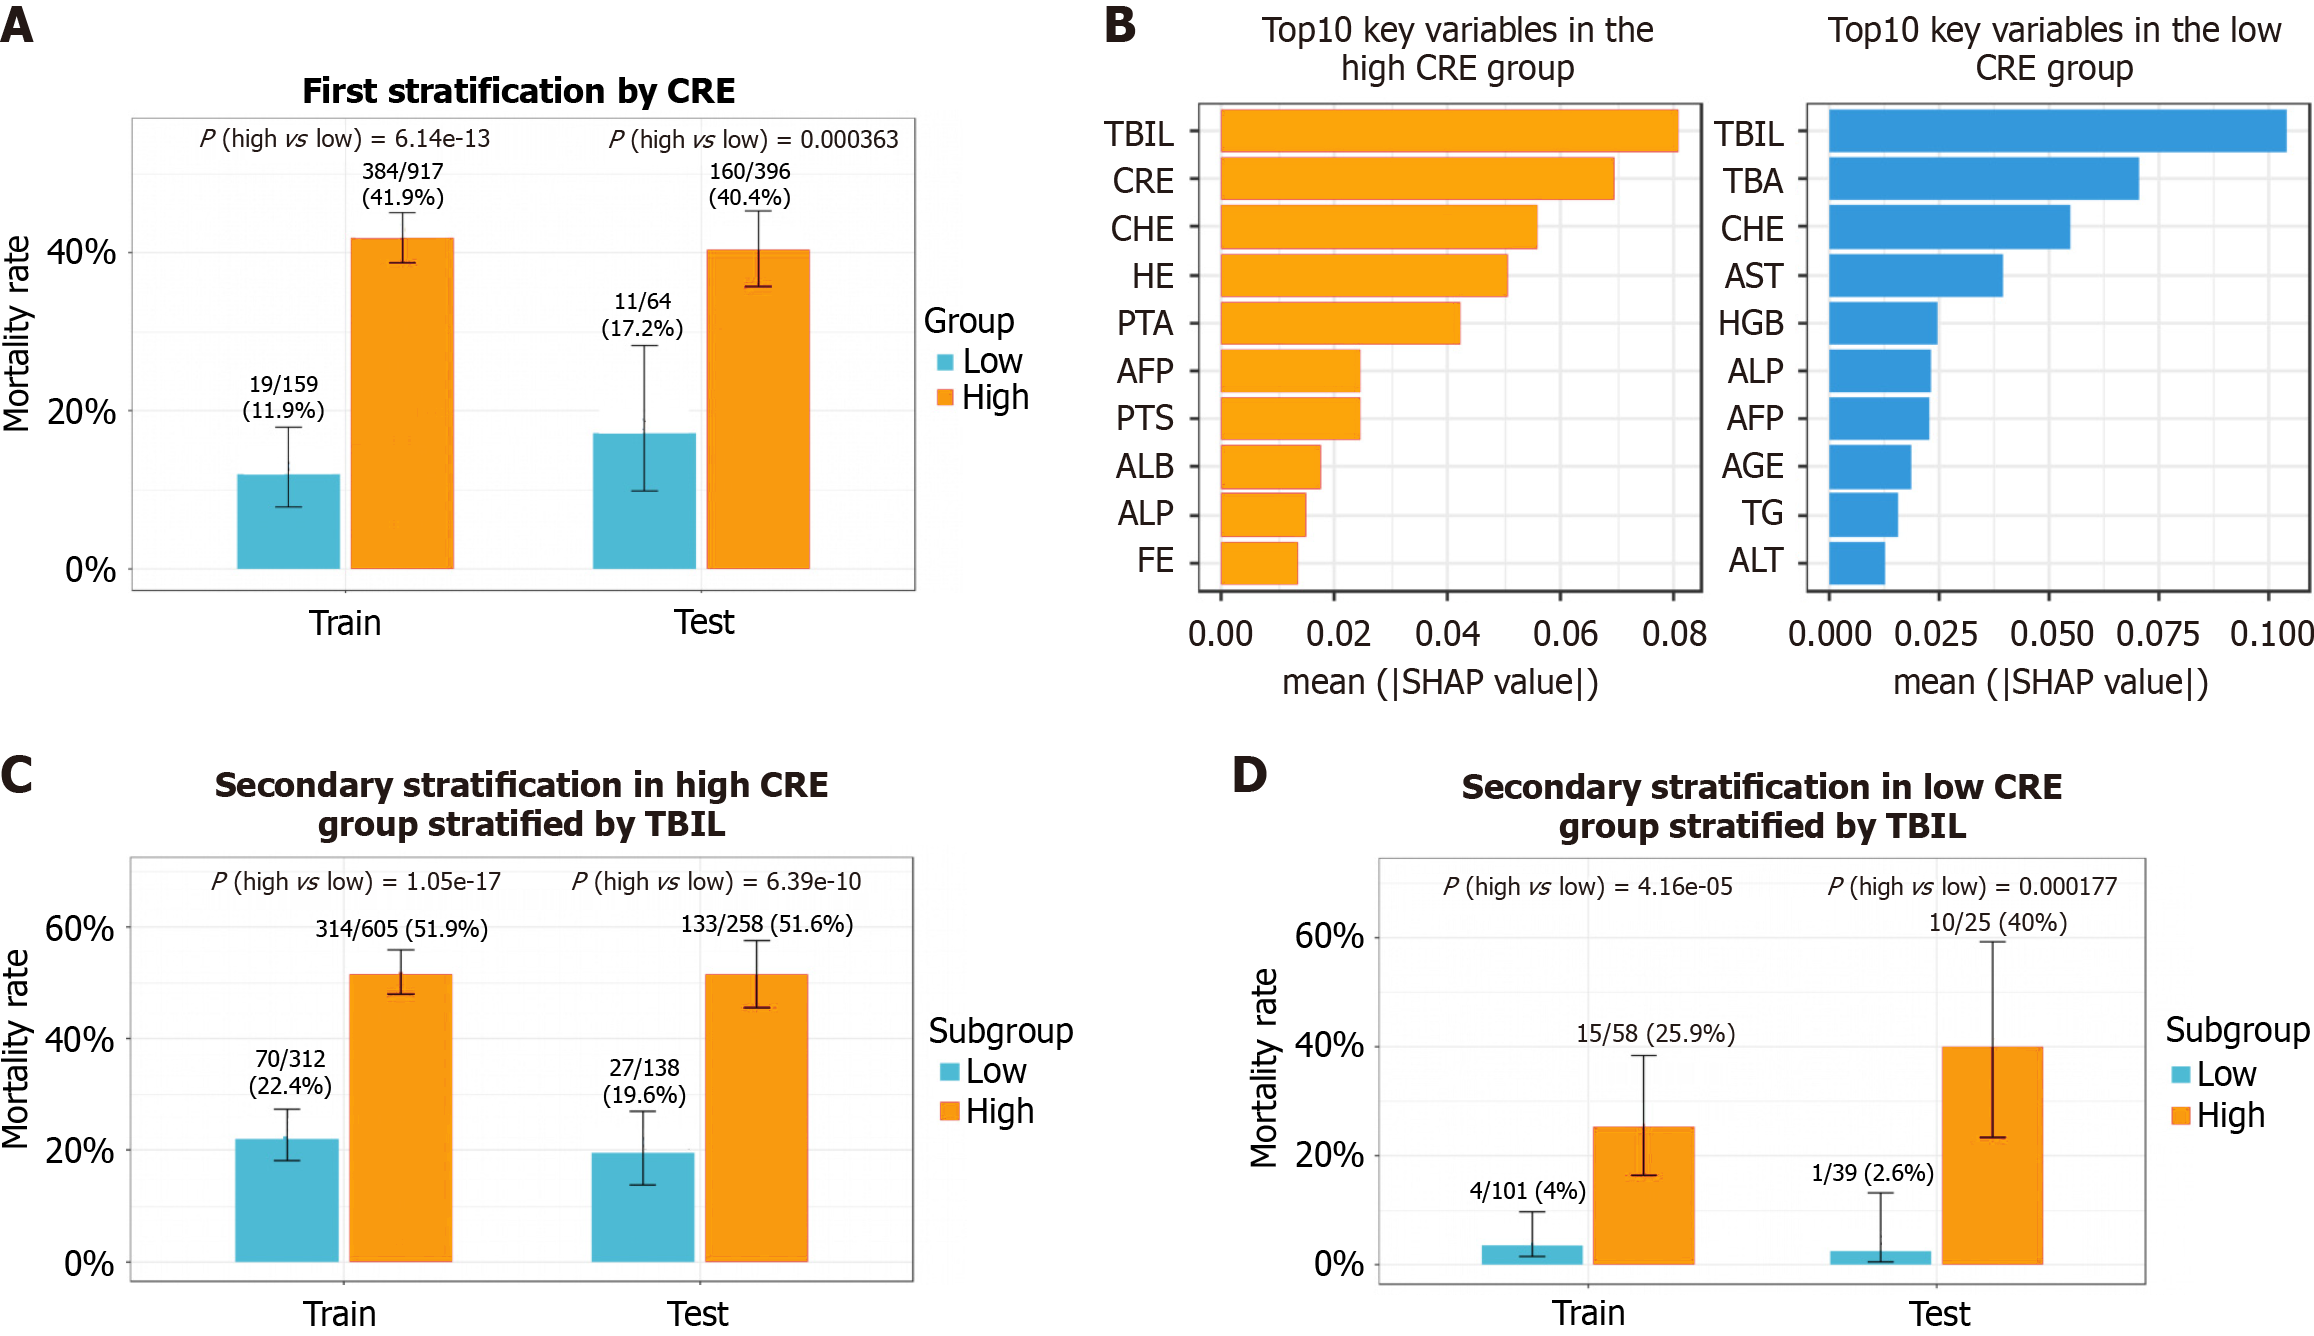
Figure 4 Development of the two-step hierarchical stratification strategy.
A: Mortality rates for the primary stratification based on serum creatinine (CRE) level in the training and test sets; B: Shapley Additive exPlanations feature importance plots for the high-CRE and low-CRE subgroups, both identifying total bilirubin (TBIL) level as the top predictor; C: Mortality rates for the secondary stratification by TBIL level within the high-CRE subgroup; D: Mortality rates for the secondary stratification by TBIL level within the low-CRE subgroup. CRE: Creatinine; TBIL: Total bilirubin.
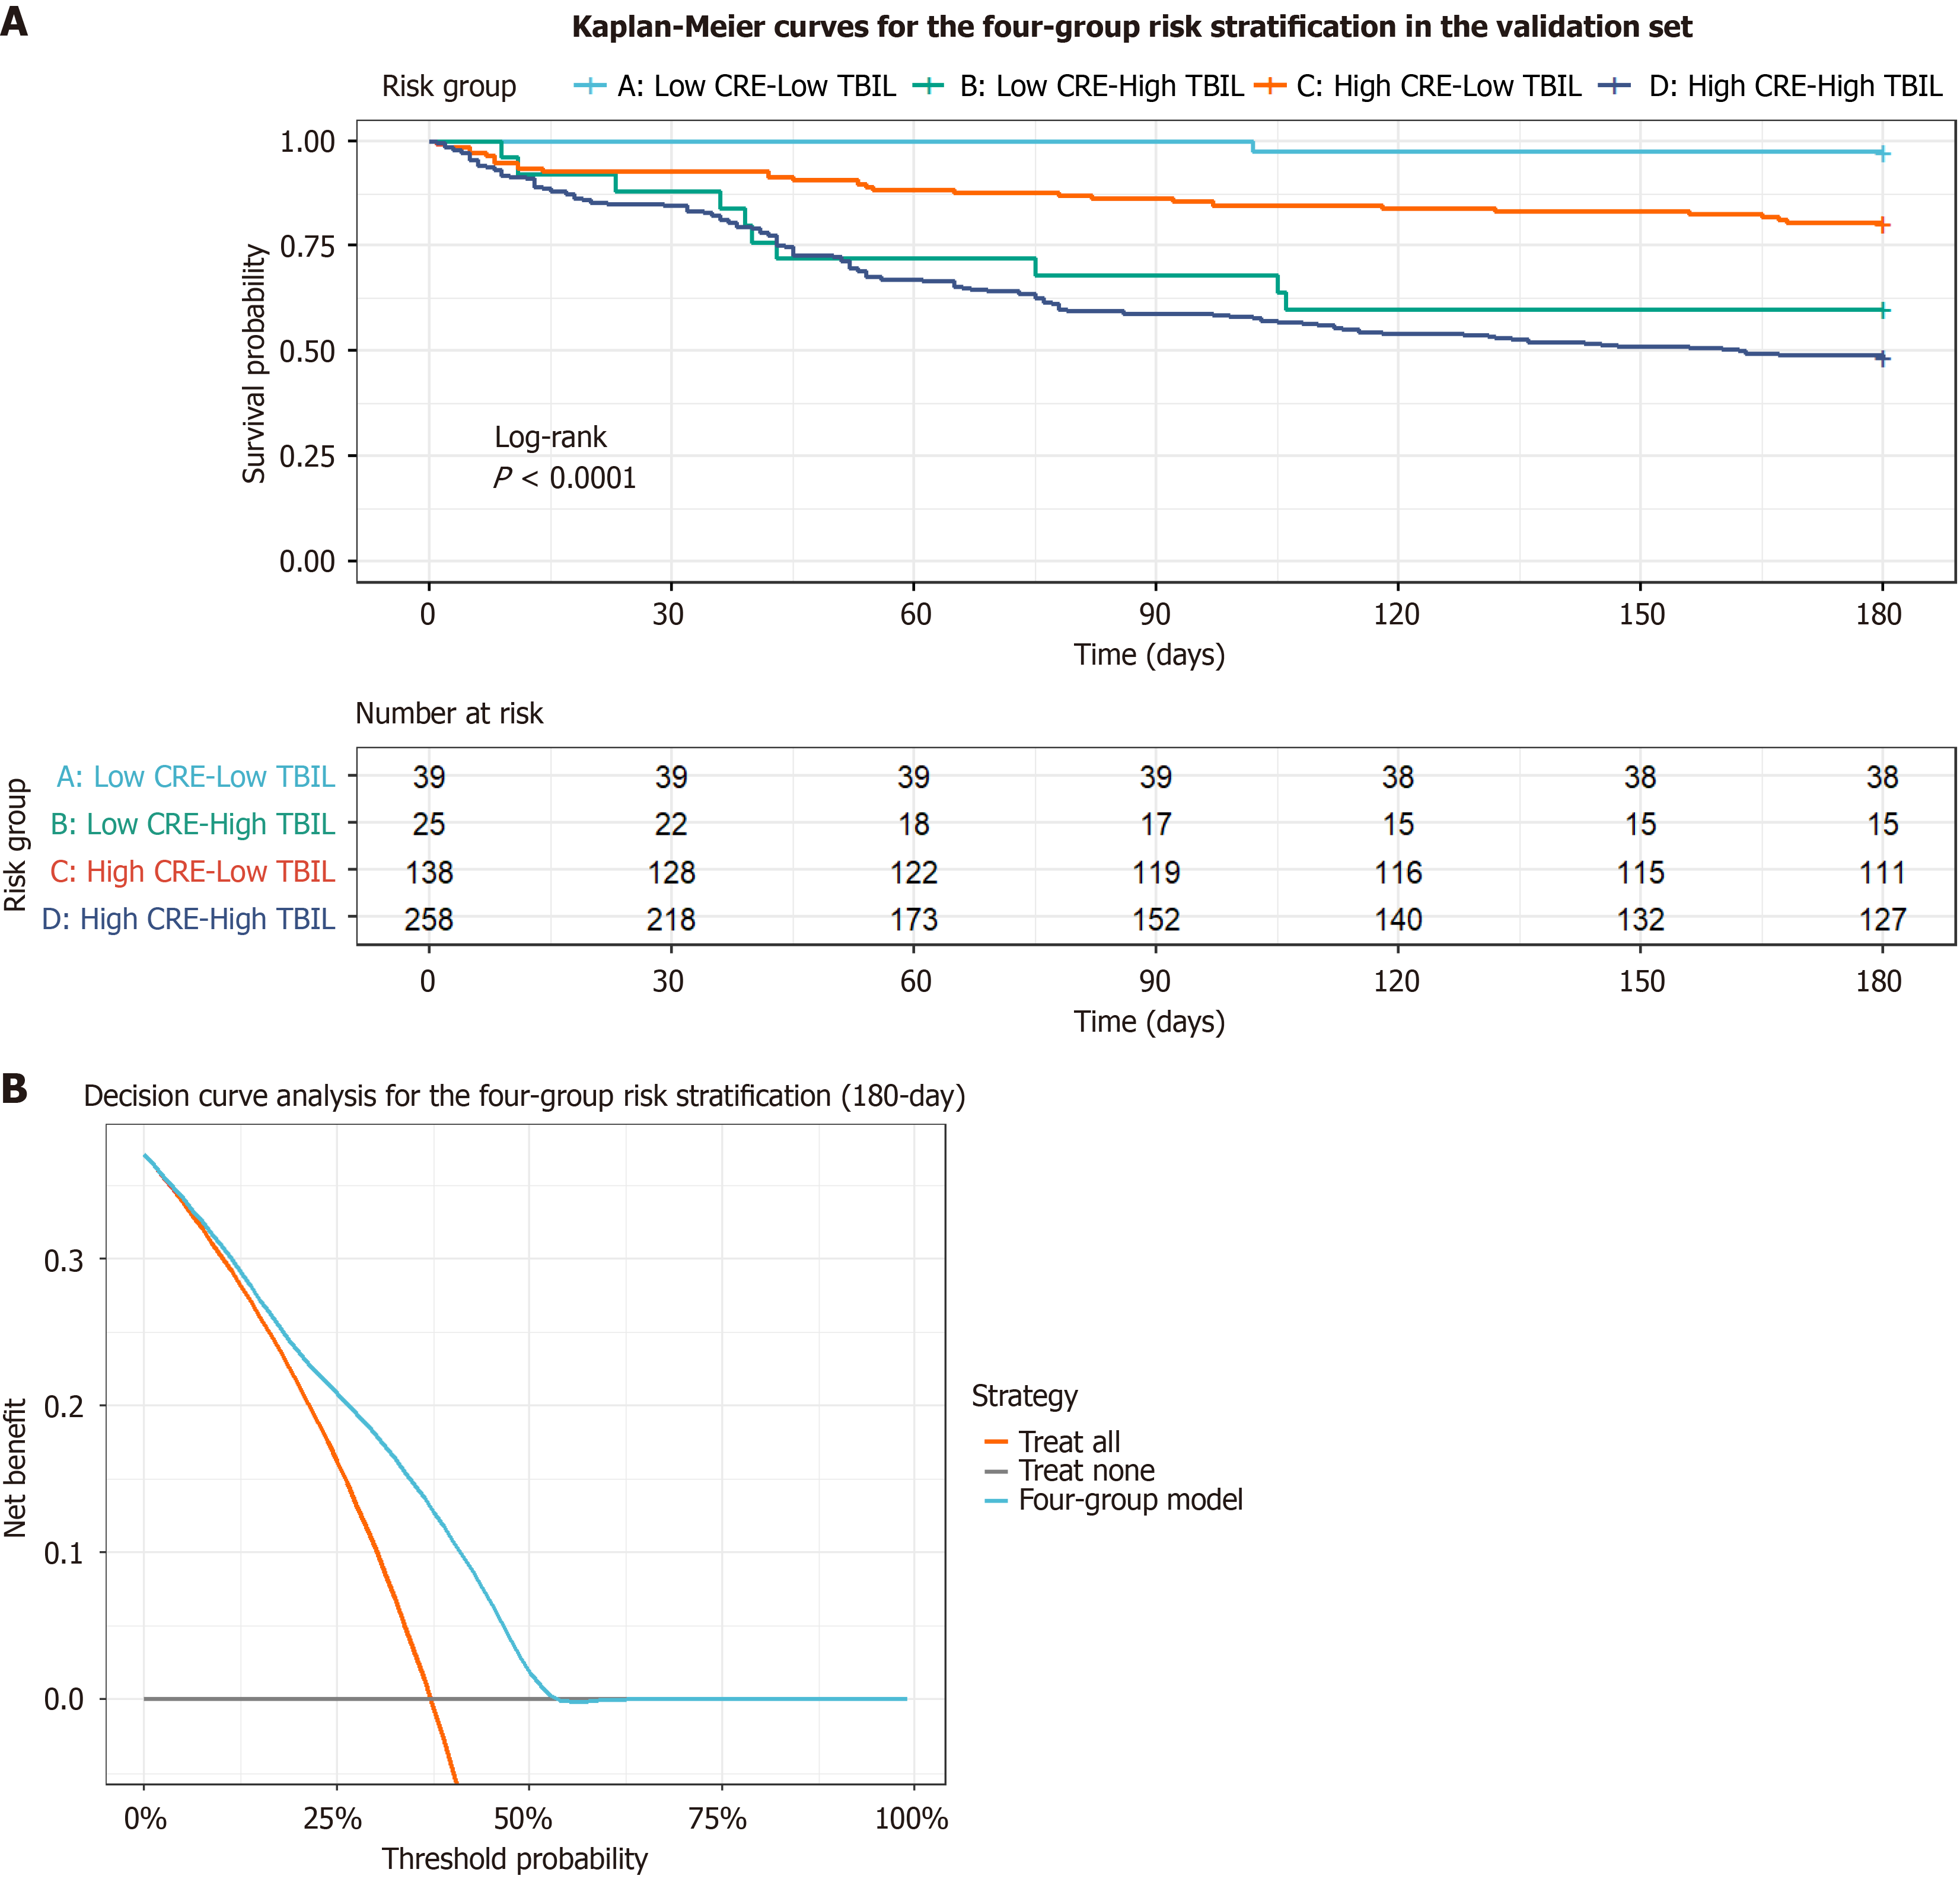
Figure 5 Validation of the four-group risk stratification.
A: Kaplan-Meier survival curves for the four distinct risk groups. The P value was calculated using the log-rank test; B: Decision curve analysis demonstrating the clinical net benefit of the four-group stratification model across a range of threshold probabilities. CRE: Creatinine; TBIL: Total bilirubin.
- Citation: Xv YW, Ling J, Hao XG, Xu TJ, Tian H, Lv S, You SL, Zhu B. Risk-stratified assessment of 180-day mortality in severe alcoholic hepatitis. World J Gastroenterol 2026; 32(30): 118301
- URL: https://www.wjgnet.com/1007-9327/full/v32/i30/118301.htm
- DOI: https://dx.doi.org/10.3748/wjg.118301