
















Copyright: ©Author(s) 2026.
World J Gastroenterol. Aug 7, 2026; 32(29): 119920
Published online Aug 7, 2026. doi: 10.3748/wjg.119920
Published online Aug 7, 2026. doi: 10.3748/wjg.119920
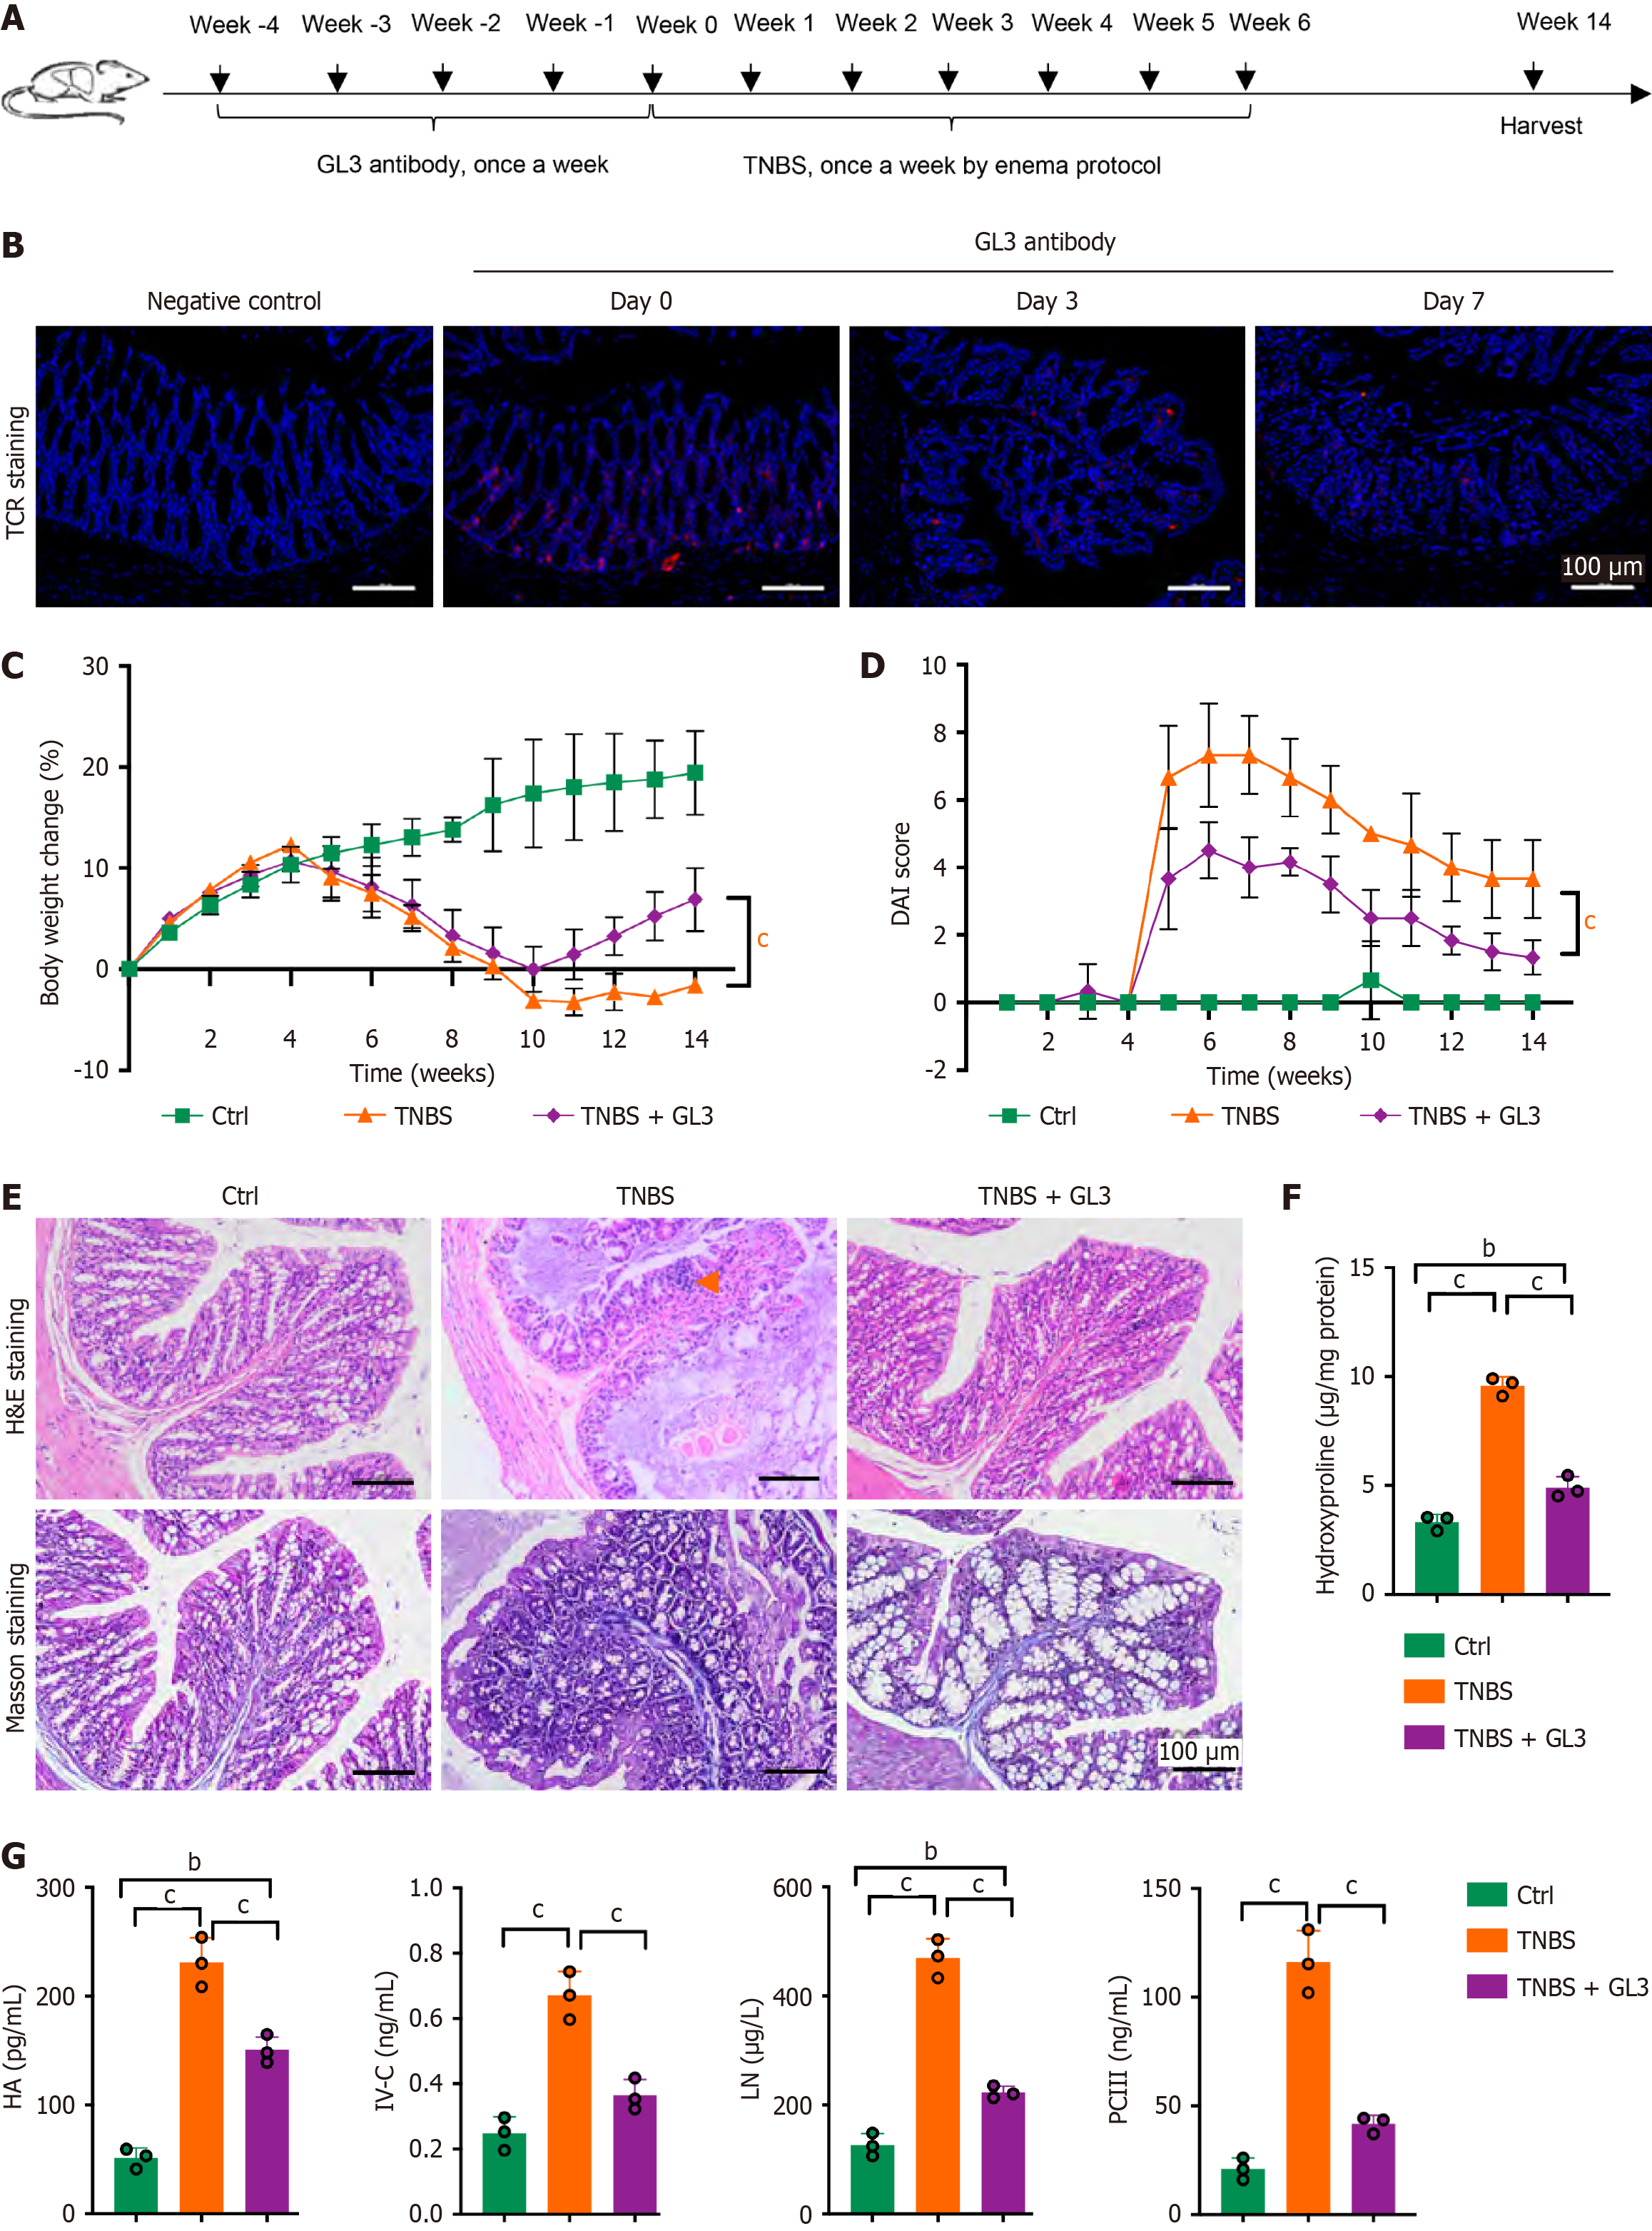
Figure 1 Depletion of γδ T cells prevented intestinal fibrosis.
A: Experimental scheme of 2,4,6-trinitrobenzenesulfonic acid (TNBS)-induced intestinal fibrosis model. γδ T cells were depleted using GL3 antibody before TNBS administration; B: TCR staining of the colon tissues after GL3 antibody administration; C: Body weight changes in the mice administrated with TNBS or TNBS + GL3 during the whole experimental period (n = 5); D: Disease activity index score evaluated in the mice administrated with TNBS or TNBS + GL3 (n = 5); E: The representative image for hematoxylin and eosin and Masson staining of colon in each group. Orange arrow indicated areas of immune cell infiltration. Scale bars: 100 μm; F: The concentrations of hydroxyproline levels in the serum of each group at week 14 (n = 3); G: The levels of hyaluronic acid, type IV collagen, laminin, and procollagen III in each group at week 14 (n = 3). Data were presented as mean ± SD. bP < 0.01, cP < 0.001. TNBS: 2,4,6-trinitrobenzenesulfonic acid; DAI: Disease activity index; H&E: Hematoxylin and eosin; HA: Hyaluronic acid; IV-C: Type IV collagen; LN: Laminin; PCIII: Procollagen III.
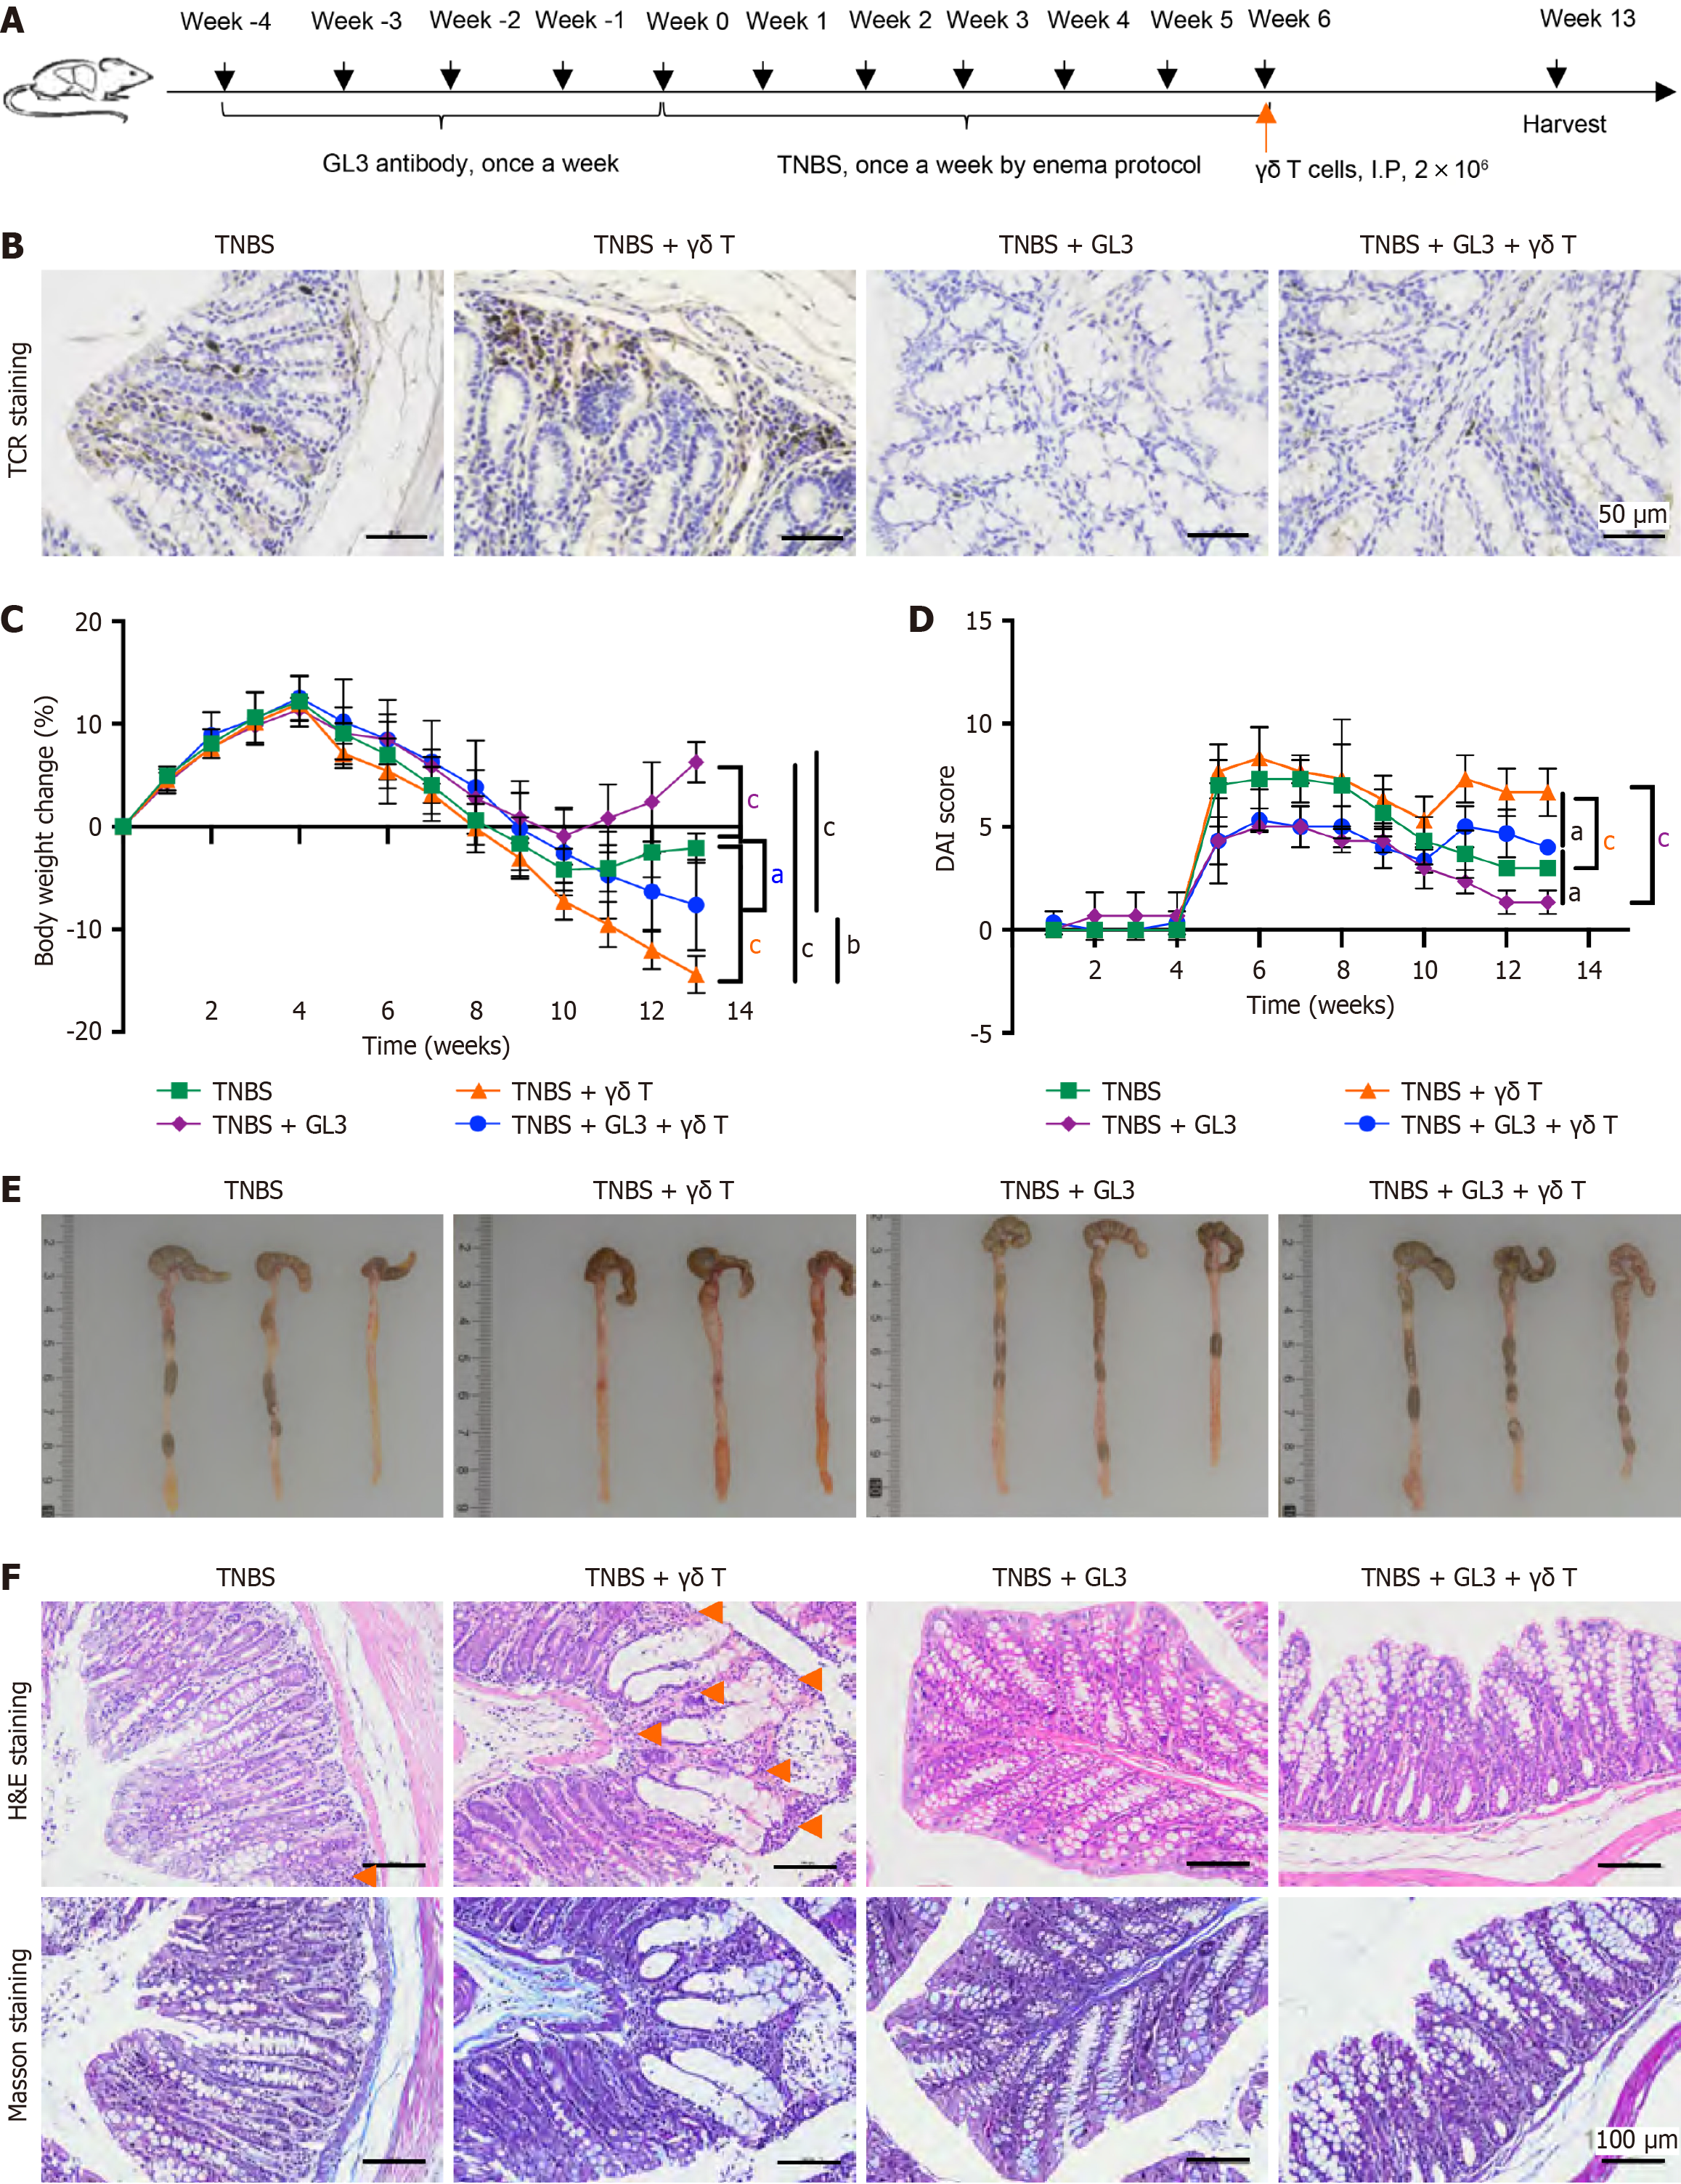
Figure 2 Reinfusion of γδ T cells aggravated intestinal fibrosis.
A: Experimental scheme of 2,4,6-trinitrobenzenesulfonic acid (TNBS)-induced intestinal fibrosis model. γδ T cells were depleted using GL3 antibody before TNBS administration. For reinfusion experiment, γδ T cells were reinfused via intraperitoneally injection after TNBS administration; B: TCR staining of the colon tissues following TNBS treatment in each group at week 14. Scale bars: 50 μm; C: Body weight changes in the mice in each group during the experimental period (n = 5); D: Disease activity index score evaluated in the intestinal fibrosis treated with GL3 antibody administration or γδ T cells reinfusion (n = 5); E: Colon morphologies in each group at the end of week 14; F: The representative image for hematoxylin and eosin and Masson staining of colon in each group. Orange arrow indicated areas of immune cell infiltration. Scale bars: 100 μm. Data were presented as mean ± SD. aP < 0.05, bP < 0.01, cP < 0.001. TNBS: 2,4,6-trinitrobenzenesulfonic acid; DAI: Disease activity index; H&E: Hematoxylin and eosin.
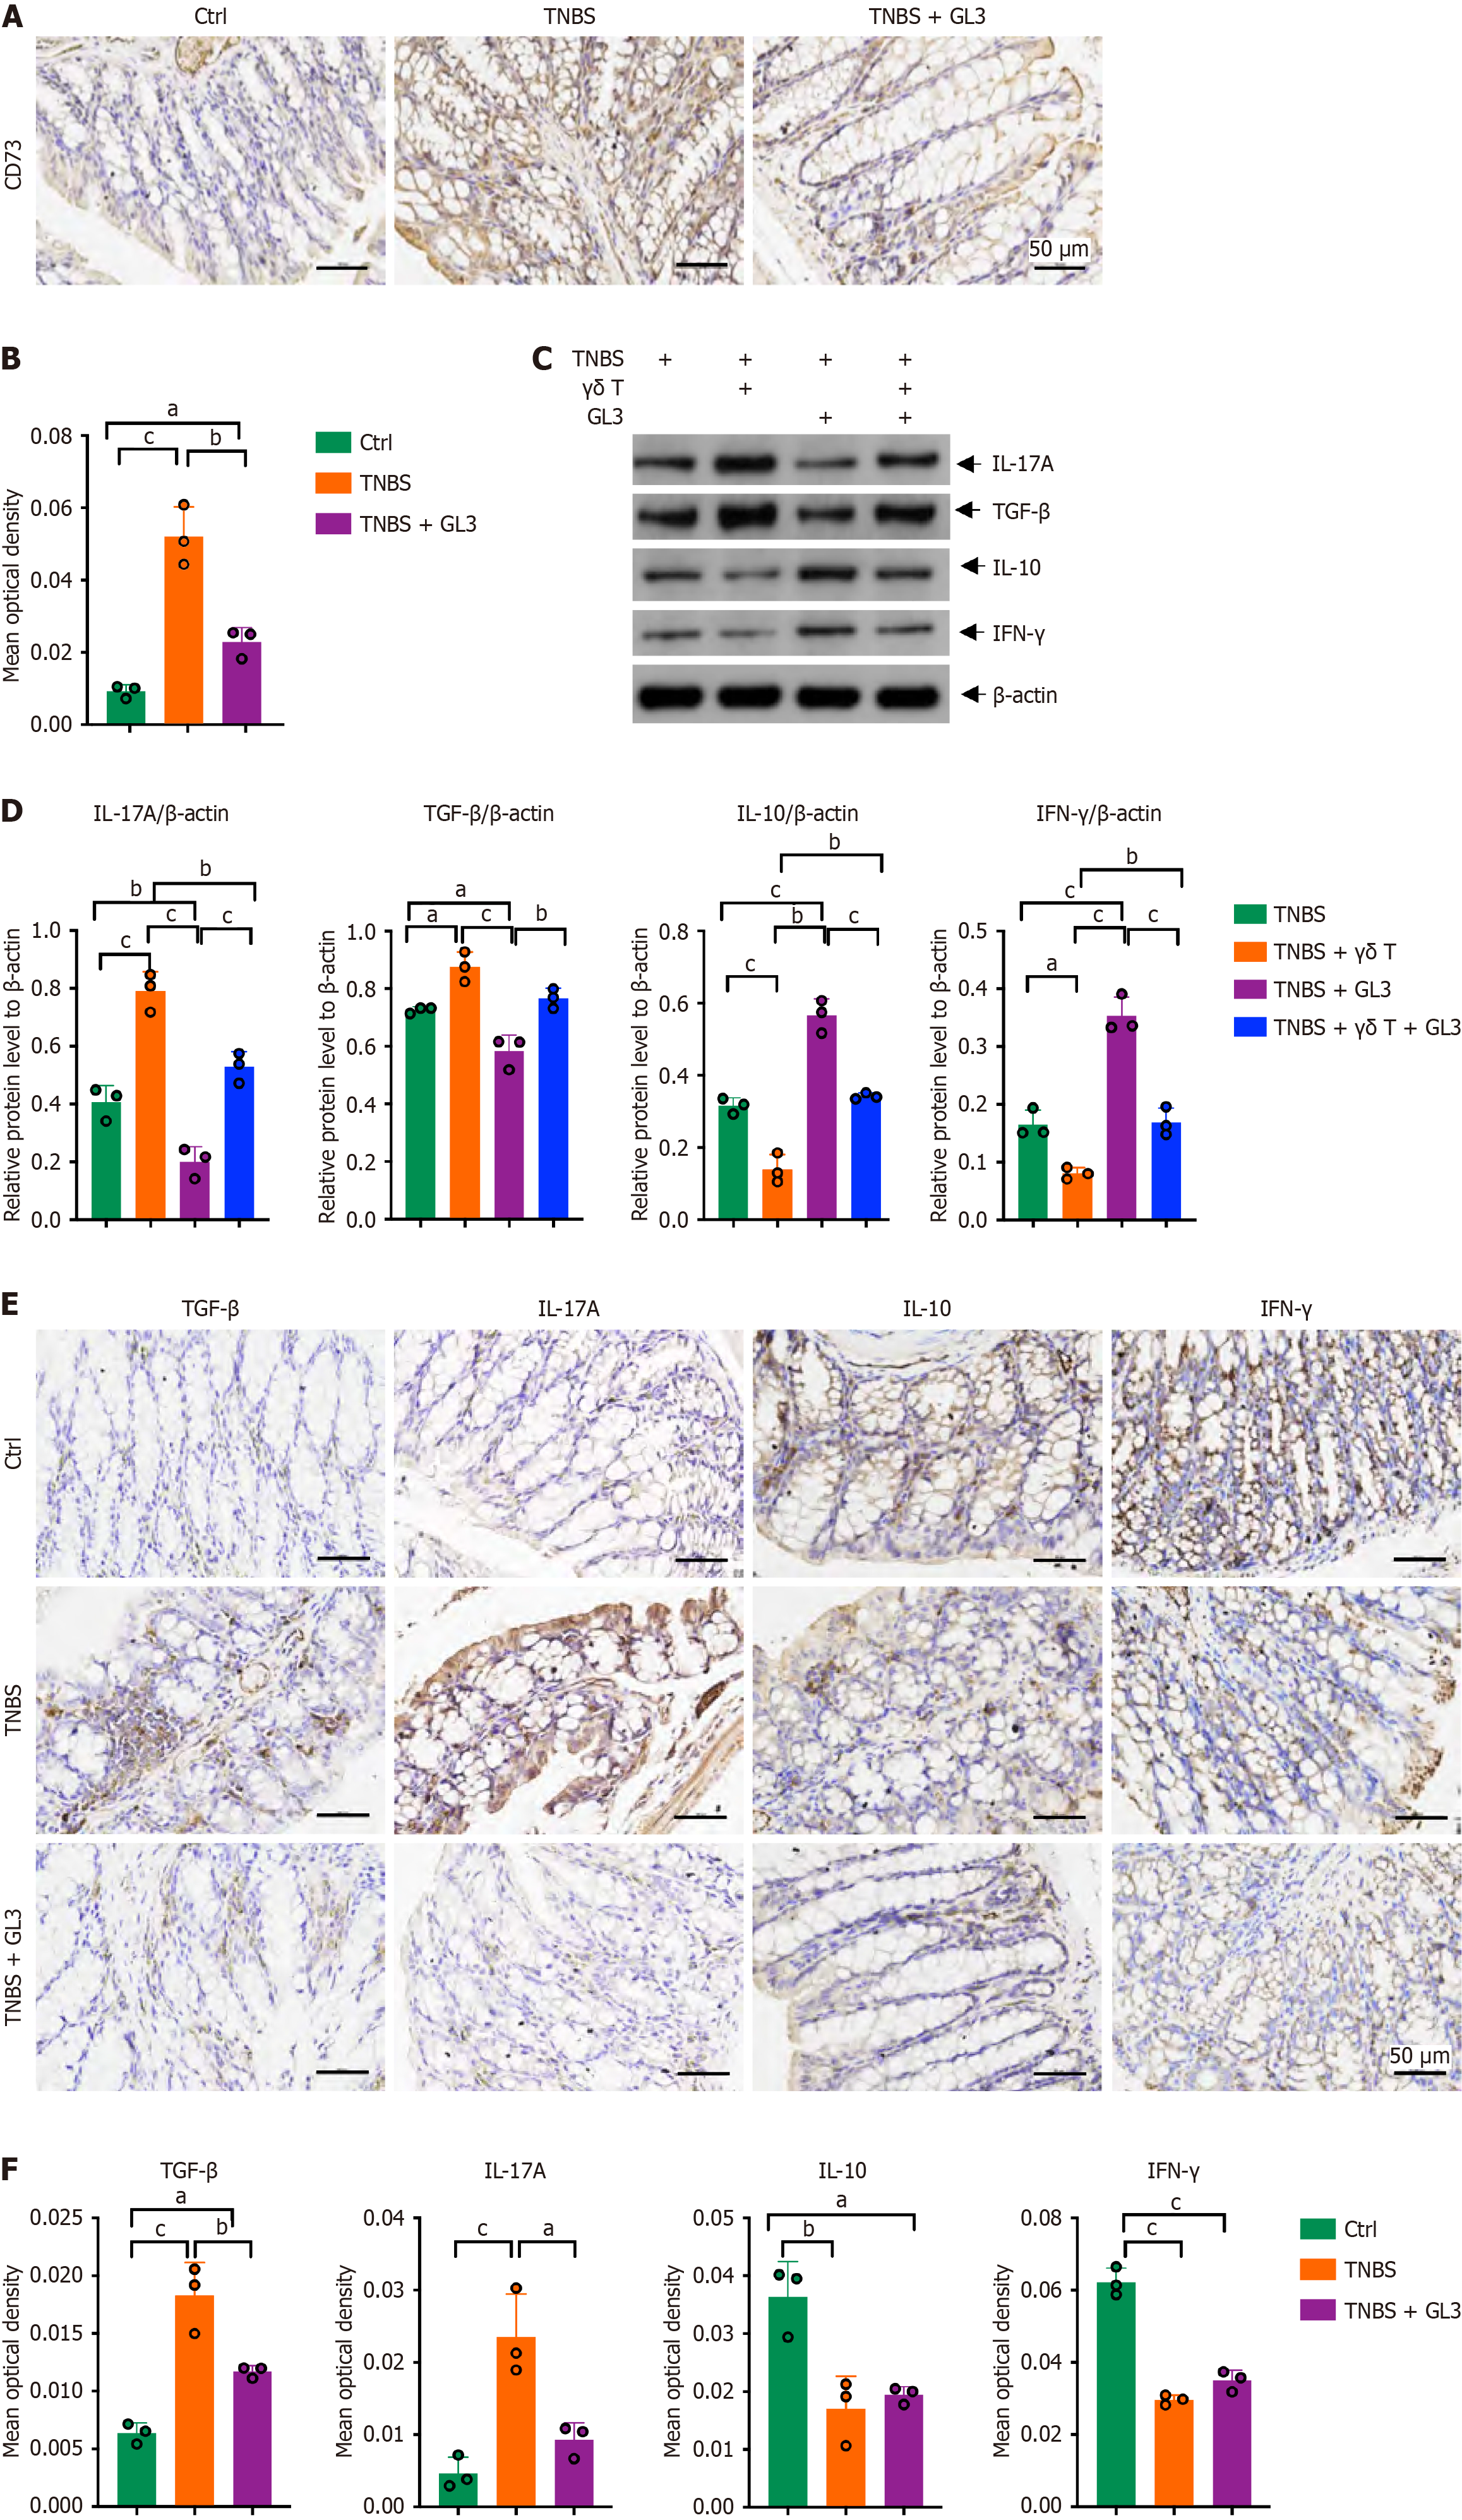
Figure 3 CD73 was downregulated after γδ T cells depletion in mice with intestinal fibrosis.
A and B: Immunohistochemistry (IHC) staining of CD73 and the quantification of average optical density (OD) of CD73 in the colon tissues. Quantification of IHC staining expressed as mean OD. Scale bars: 50 μm; C and D: Western blot and the quantification result of the expression levels of interleukin (IL)-17A, transforming growth factor-beta, interferon γ and IL10 using colon tissues in each group (n = 3); E and F: IHC staining of IL-17A, transforming growth factor-beta, interferon γ and IL10 and the quantification of average OD of these proteins in the colon tissues. Quantification of IHC staining expressed as mean OD. Scale bars: 50 μm. Data were presented as mean ± SD. aP < 0.05, bP < 0.01, cP < 0.001. TNBS: 2,4,6-trinitrobenzenesulfonic acid; IL: Interleukin; TGF: Transforming growth factor; IFN: Interferon.
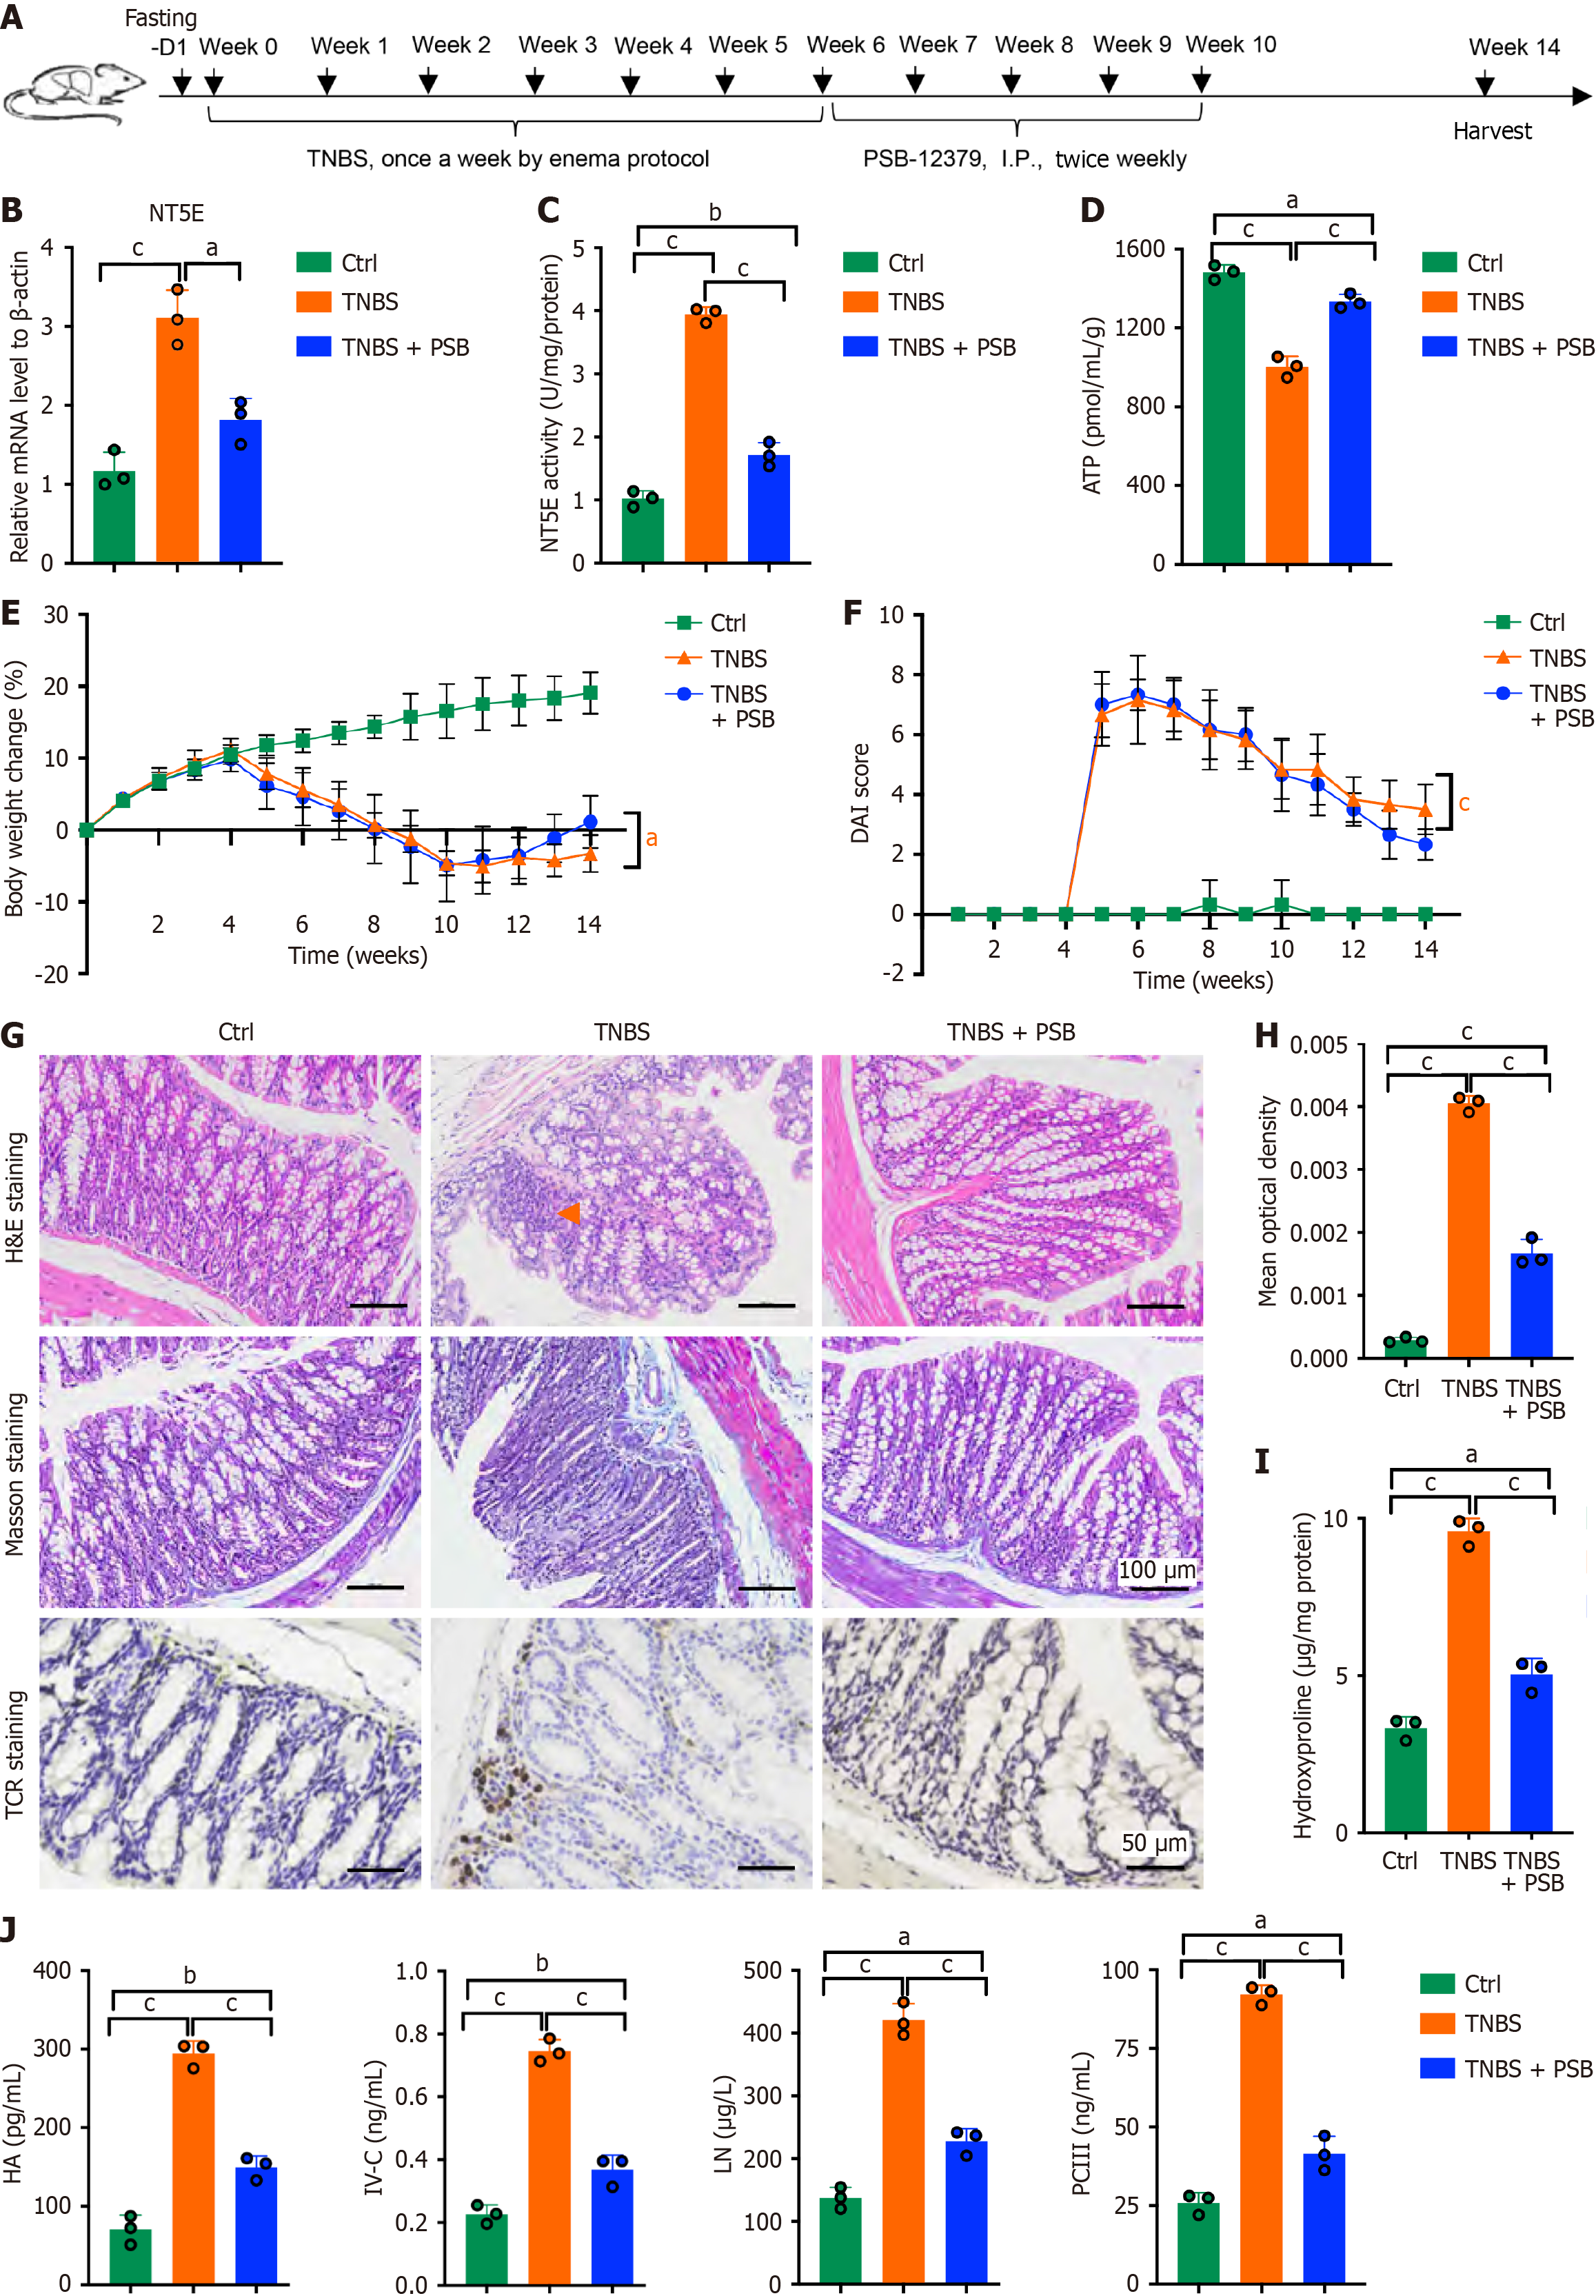
Figure 4 Inhibition of CD73 attenuated intestinal fibrosis.
A: Experimental scheme of 2,4,6-trinitrobenzenesulfonic acid (TNBS)-induced intestinal fibrosis model. PSB-12379 were intraperitoneally injected after TNBS administration; B: Quantitative polymerase chain reaction analysis of the expression of CD73 gene in mice treated with TNBS and TNBS + PSB-12379 injection. Normal colon tissues were used as the control (n = 3 in each group). Data are presented as relative mRNA levels normalized to β-actin; C: The 5’-nucleotidase activity of CD73 in each group, normal colon tissues were used as the control (n = 3); D: The concentrations of ATP in the colon tissues; E: Body weight changes in the mice administrated with TNBS or TNBS + PSB-12379 during the experimental period (n = 5); F: Disease activity index score evaluated in the mice treated with TNBS or TNBS + PSB-12379 (n = 5); G: The representative image for hematoxylin and eosin, Masson staining and immunohistochemistry staining of TCR in the colon tissues in the mice treated with TNBS or TNBS + PSB-12379. Orange arrow indicated areas of immune cell infiltration. Scale bars: 100 μm or 50 μm; H: Quantification of immunohistochemistry staining (Figure 4G), described as mean optical density; I: The concentrations of hydroxyproline levels in the serum at week 14 (n = 3); J: The levels of hyaluronic acid, type IV collagen, laminin, and procollagen III in the serum at week 14 (n = 3). Data were presented as mean ± SD. aP < 0.05, bP < 0.01, cP < 0.001. TNBS: 2,4,6-trinitrobenzenesulfonic acid; NT5E: 5’-nucleotidase; DAI: Disease activity index; H&E: Hematoxylin and eosin; HA: Hyaluronic acid; IV-C: Type IV collagen; LN: Laminin; PCIII: Procollagen III.
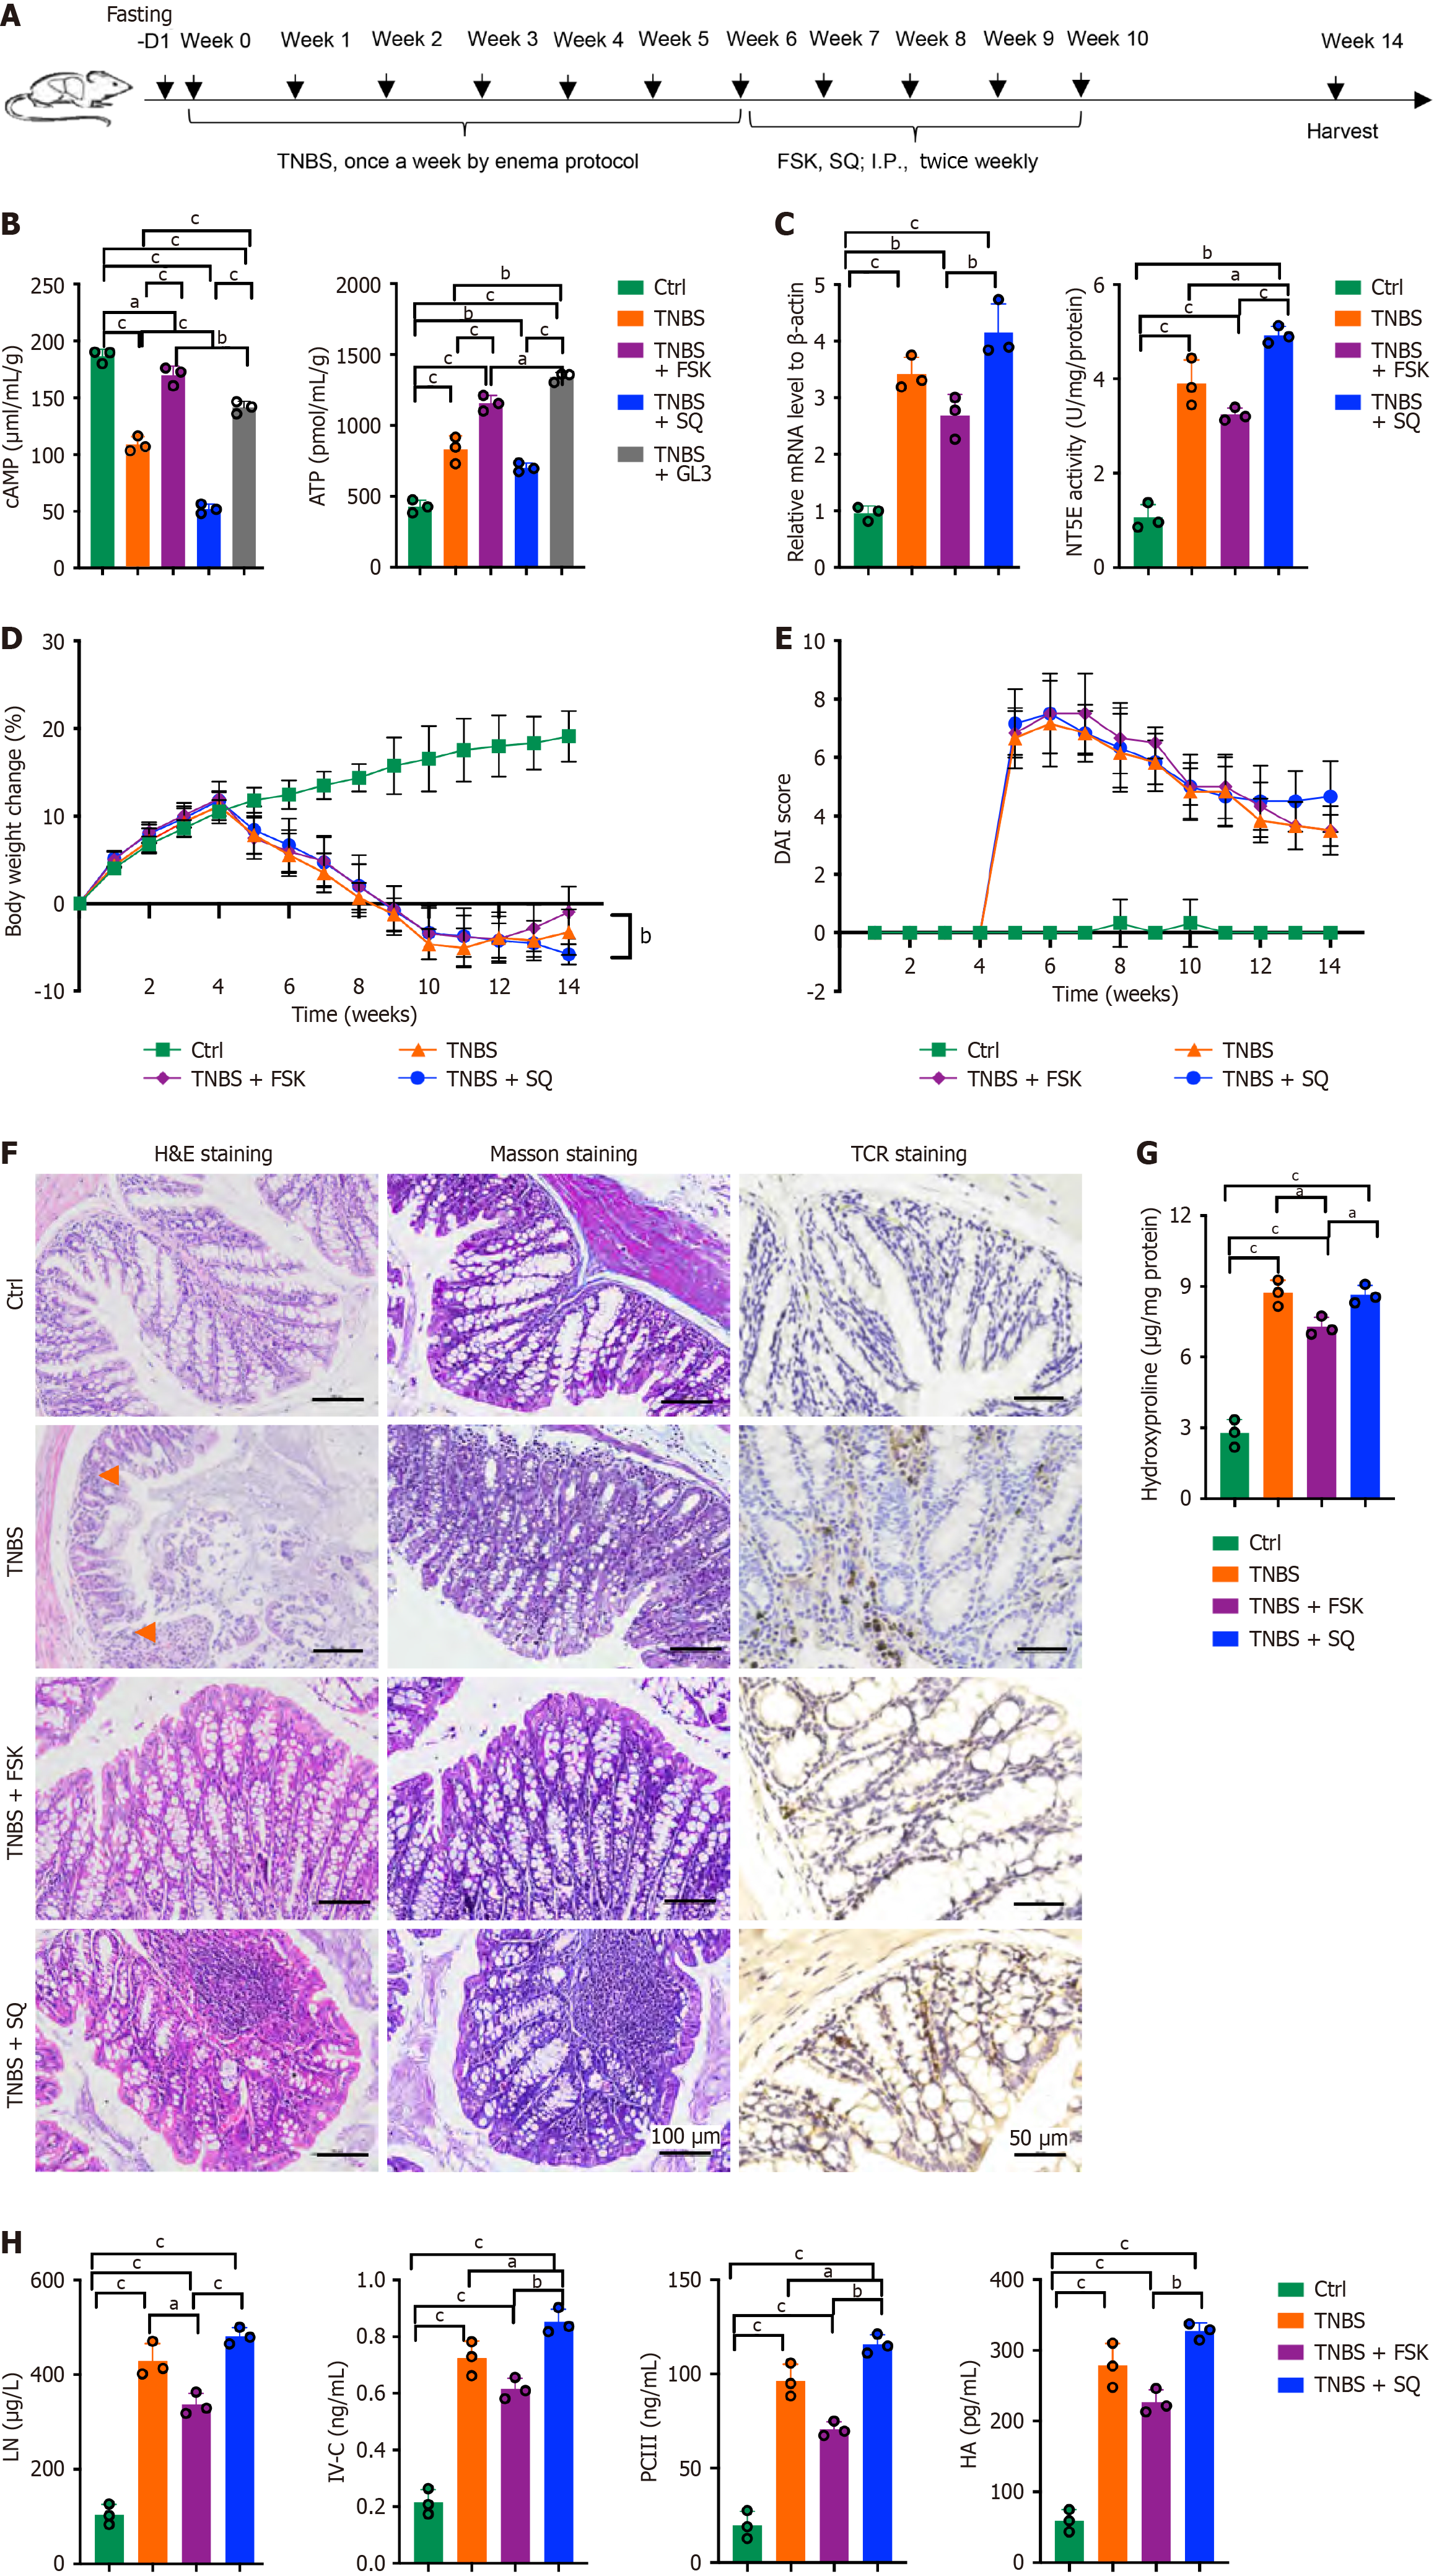
Figure 5 Increased cyclic AMP levels prevented intestinal fibrosis.
A: Experimental scheme of 2,4,6-trinitrobenzenesulfonic acid (TNBS)-induced intestinal fibrosis model. Forskolin and SQ22536 were intraperitoneally injected twice weekly for 4 weeks after TNBS administration; B: The concentrations of cyclic AMP and ATP in the colon tissues. Normal colon tissues were used as the control (n = 3 in each group); C: Quantitative polymerase chain reaction analysis of the expression of CD73 gene and the 5’-nucleotidase activity of CD73 in each group. Normal colon tissues were used as the control (n = 3 in each group); D: Body weight changes in the mice treated with TNBS or TNBS + forskolin or TNBS + SQ22536 during the experimental period (n = 5); E: Disease activity index score evaluated in the mice treated with TNBS or TNBS + forskolin or TNBS + SQ22536 (n = 5); F: The representative image for hematoxylin and eosin, Masson staining and immunohistochemistry staining of TCR within colon tissues in the mice treated with TNBS or TNBS + forskolin or TNBS + SQ22536. Orange arrow indicated areas of immune cell infiltration. Scale bars: 100 μm or 50 μm; G: The concentrations of hydroxyproline levels in the serum in the mice treated with TNBS or TNBS + forskolin or TNBS + SQ22536 at week 14 (n = 3); H: The levels of hyaluronic acid, type IV collagen, laminin, and procollagen III in the serum at week 14 (n = 3). Data were presented as mean ± SD. aP < 0.05, bP < 0.01, cP < 0.001. TNBS: 2,4,6-trinitrobenzenesulfonic acid; FSK: Forskolin; cAMP: Cyclic AMP; NT5E: 5’-nucleotidase; DAI: Disease activity index; H&E: Hematoxylin and eosin; LN: Laminin; IV-C: Type IV collagen; PCIII: Procollagen III; HA: Hyaluronic acid.
- Citation: Dong LW, Ma ZC, Fu J, Huang BL, Liu FJ, Liang DC, Sun DM, Lan C. γδ T cells exacerbate intestinal fibrosis in mice with experimental colitis via activation of the CD73-adenosine receptor-cyclic AMP signaling pathway. World J Gastroenterol 2026; 32(29): 119920
- URL: https://www.wjgnet.com/1007-9327/full/v32/i29/119920.htm
- DOI: https://dx.doi.org/10.3748/wjg.119920