
















Copyright: ©Author(s) 2026.
World J Gastroenterol. Aug 7, 2026; 32(29): 118090
Published online Aug 7, 2026. doi: 10.3748/wjg.118090
Published online Aug 7, 2026. doi: 10.3748/wjg.118090
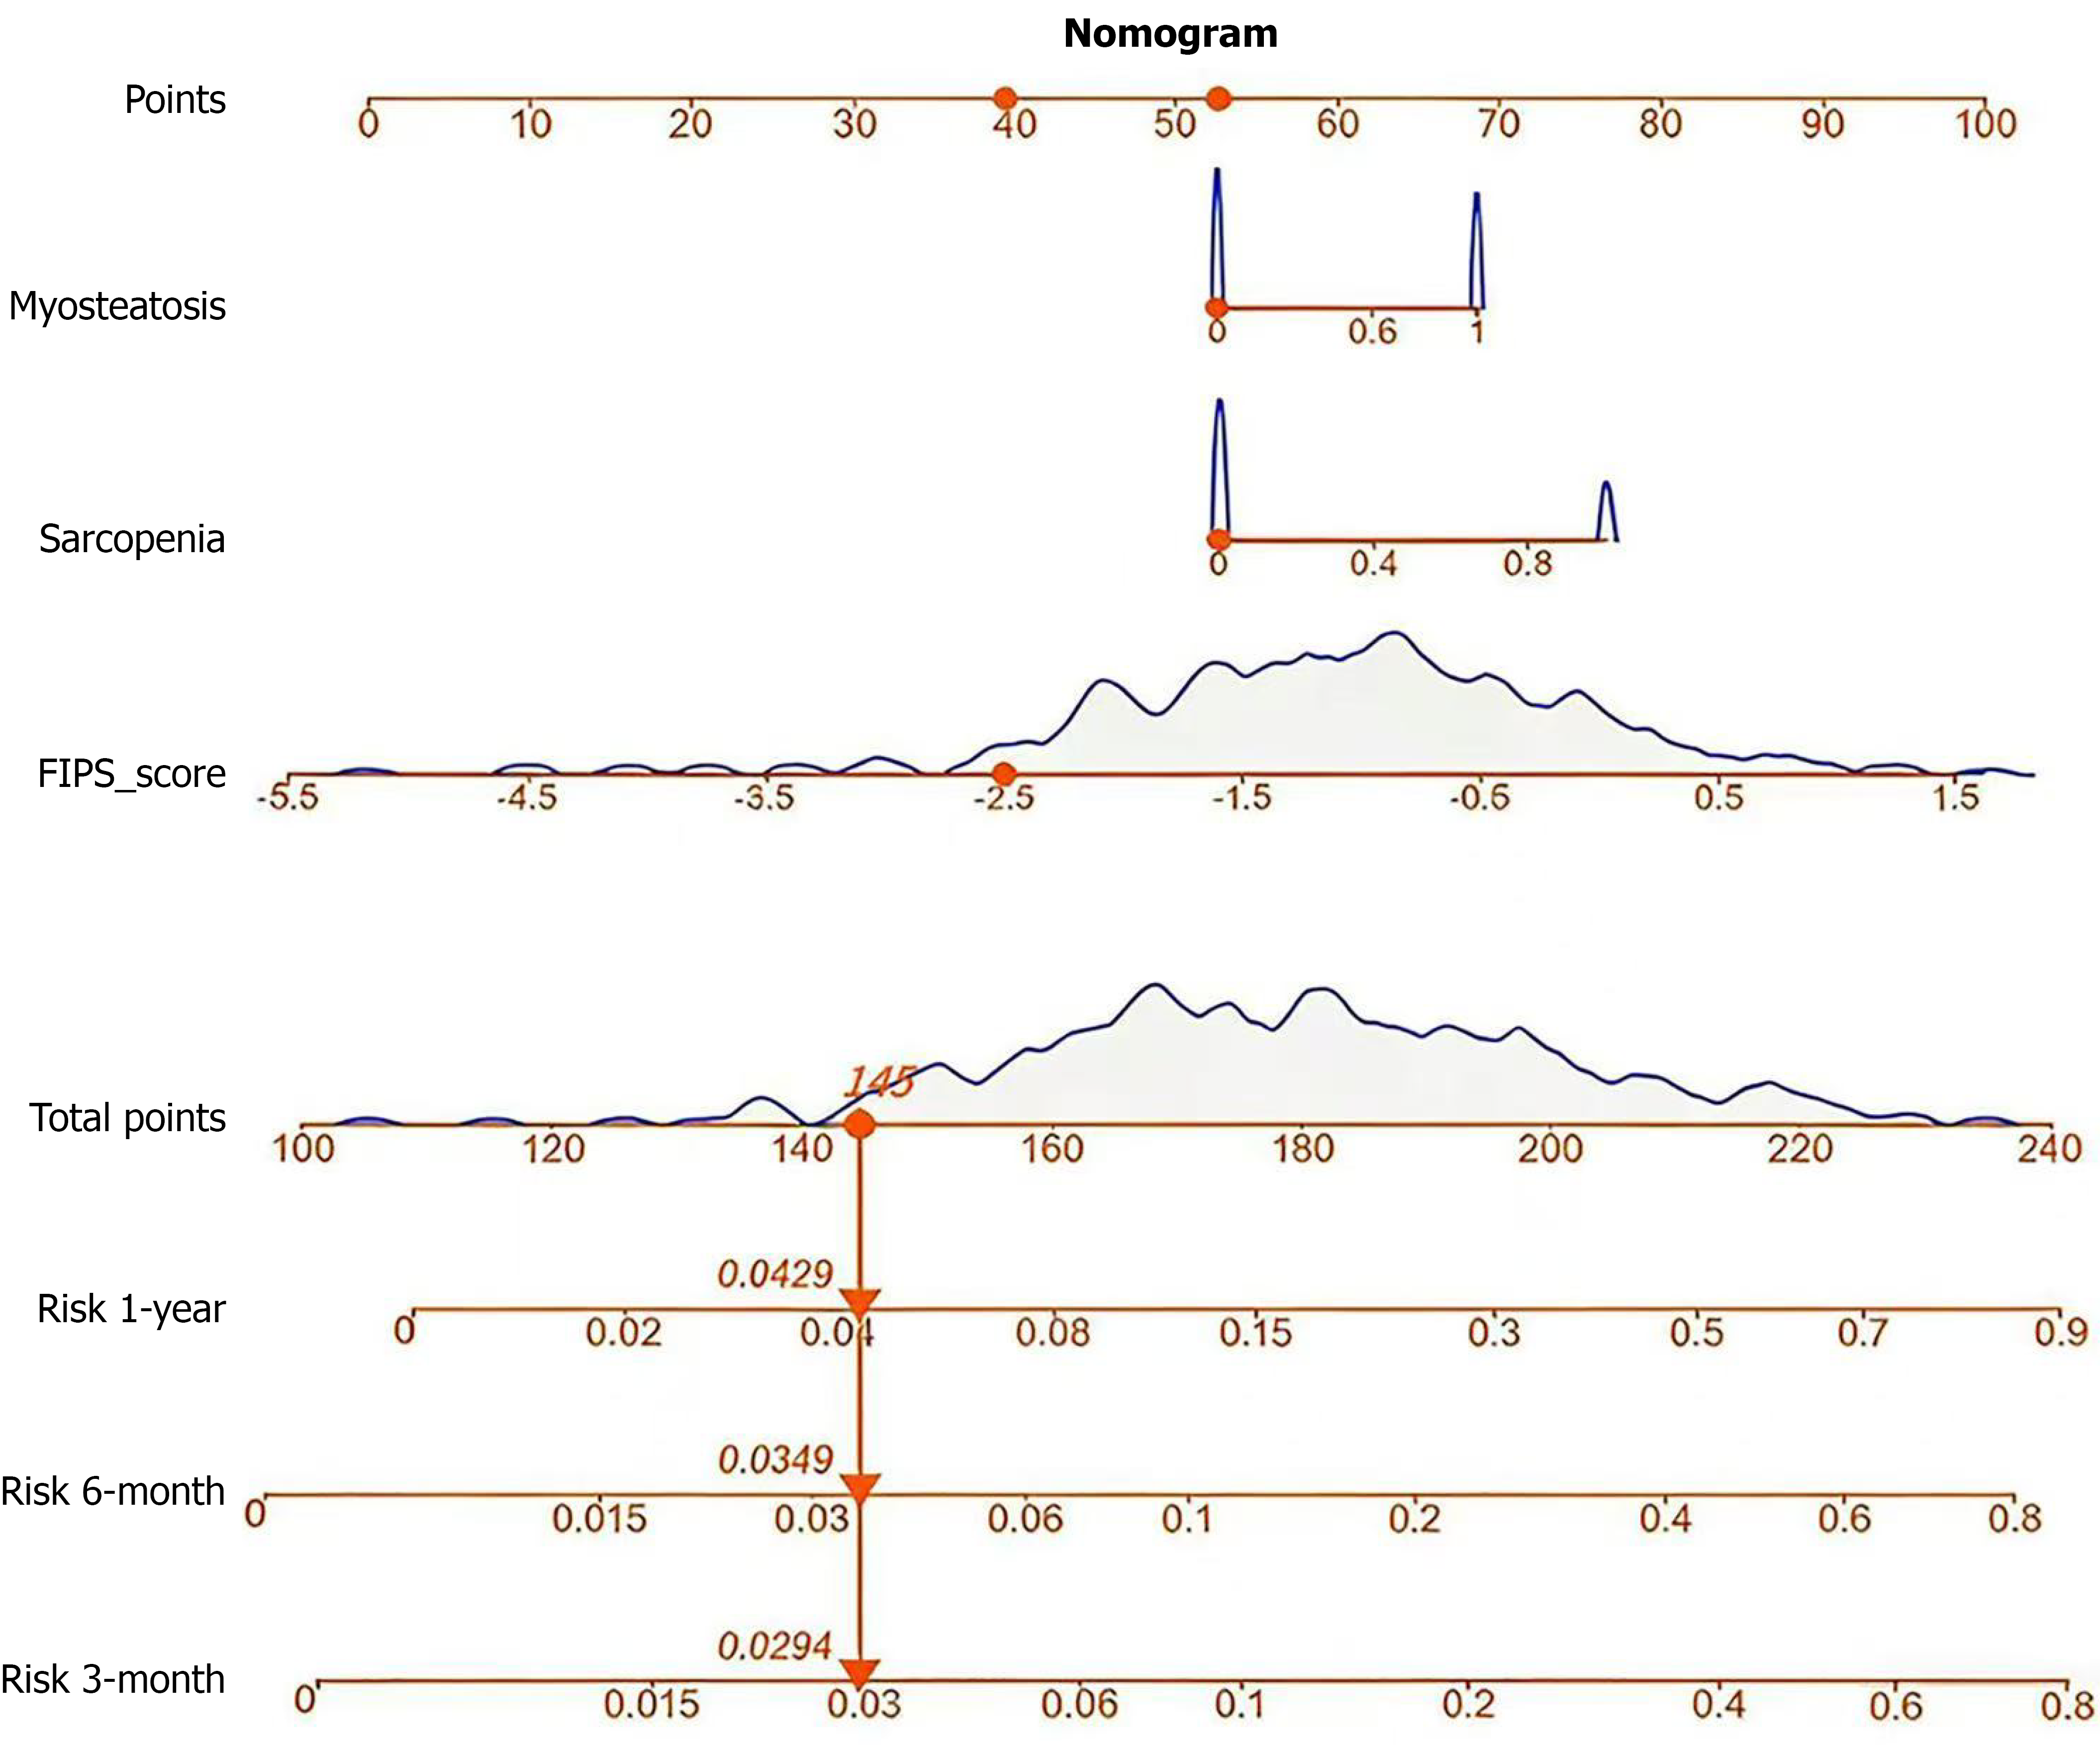
Figure 1 A visually intuitive nomogram model was constructed based on three significant independent variables: Freiburg index of post-transjugular intrahepatic portosystemic shunt survival score, sarcopenia, and myosteatosis.
Each variable was assigned a corresponding score. The total score was calculated by summing these values to predict the risk of post-transjugular intrahepatic portosystemic shunt (TIPS) severe hepatic encephalopathy in patients with cirrhosis. The nomogram is based on the following log-hazard equation: Log-hazard = (β1 × Freiburg index of post-TIPS survival score) + (β2 × sarcopenia) + (β3 × myosteatosis), where β1 = 0.598, β2 = 0.965, and β3 = 0.659. In addition, the baseline hazard function h0 (t) = 0.177, where t = 12. For example, a patient without sarcopenia and myosteatosis, with a Freiburg index of post-TIPS survival score of -2.5, would have a total score of 53 + 53 + 39 = 145. This corresponds to a 2.94% risk of developing severe hepatic encephalopathy at 3 months post-TIPS, a 3.49% risk at 6 months, and a 4.29% risk at 1 year. FIPS: Freiburg index of post-transjugular intrahepatic portosystemic shunt survival.
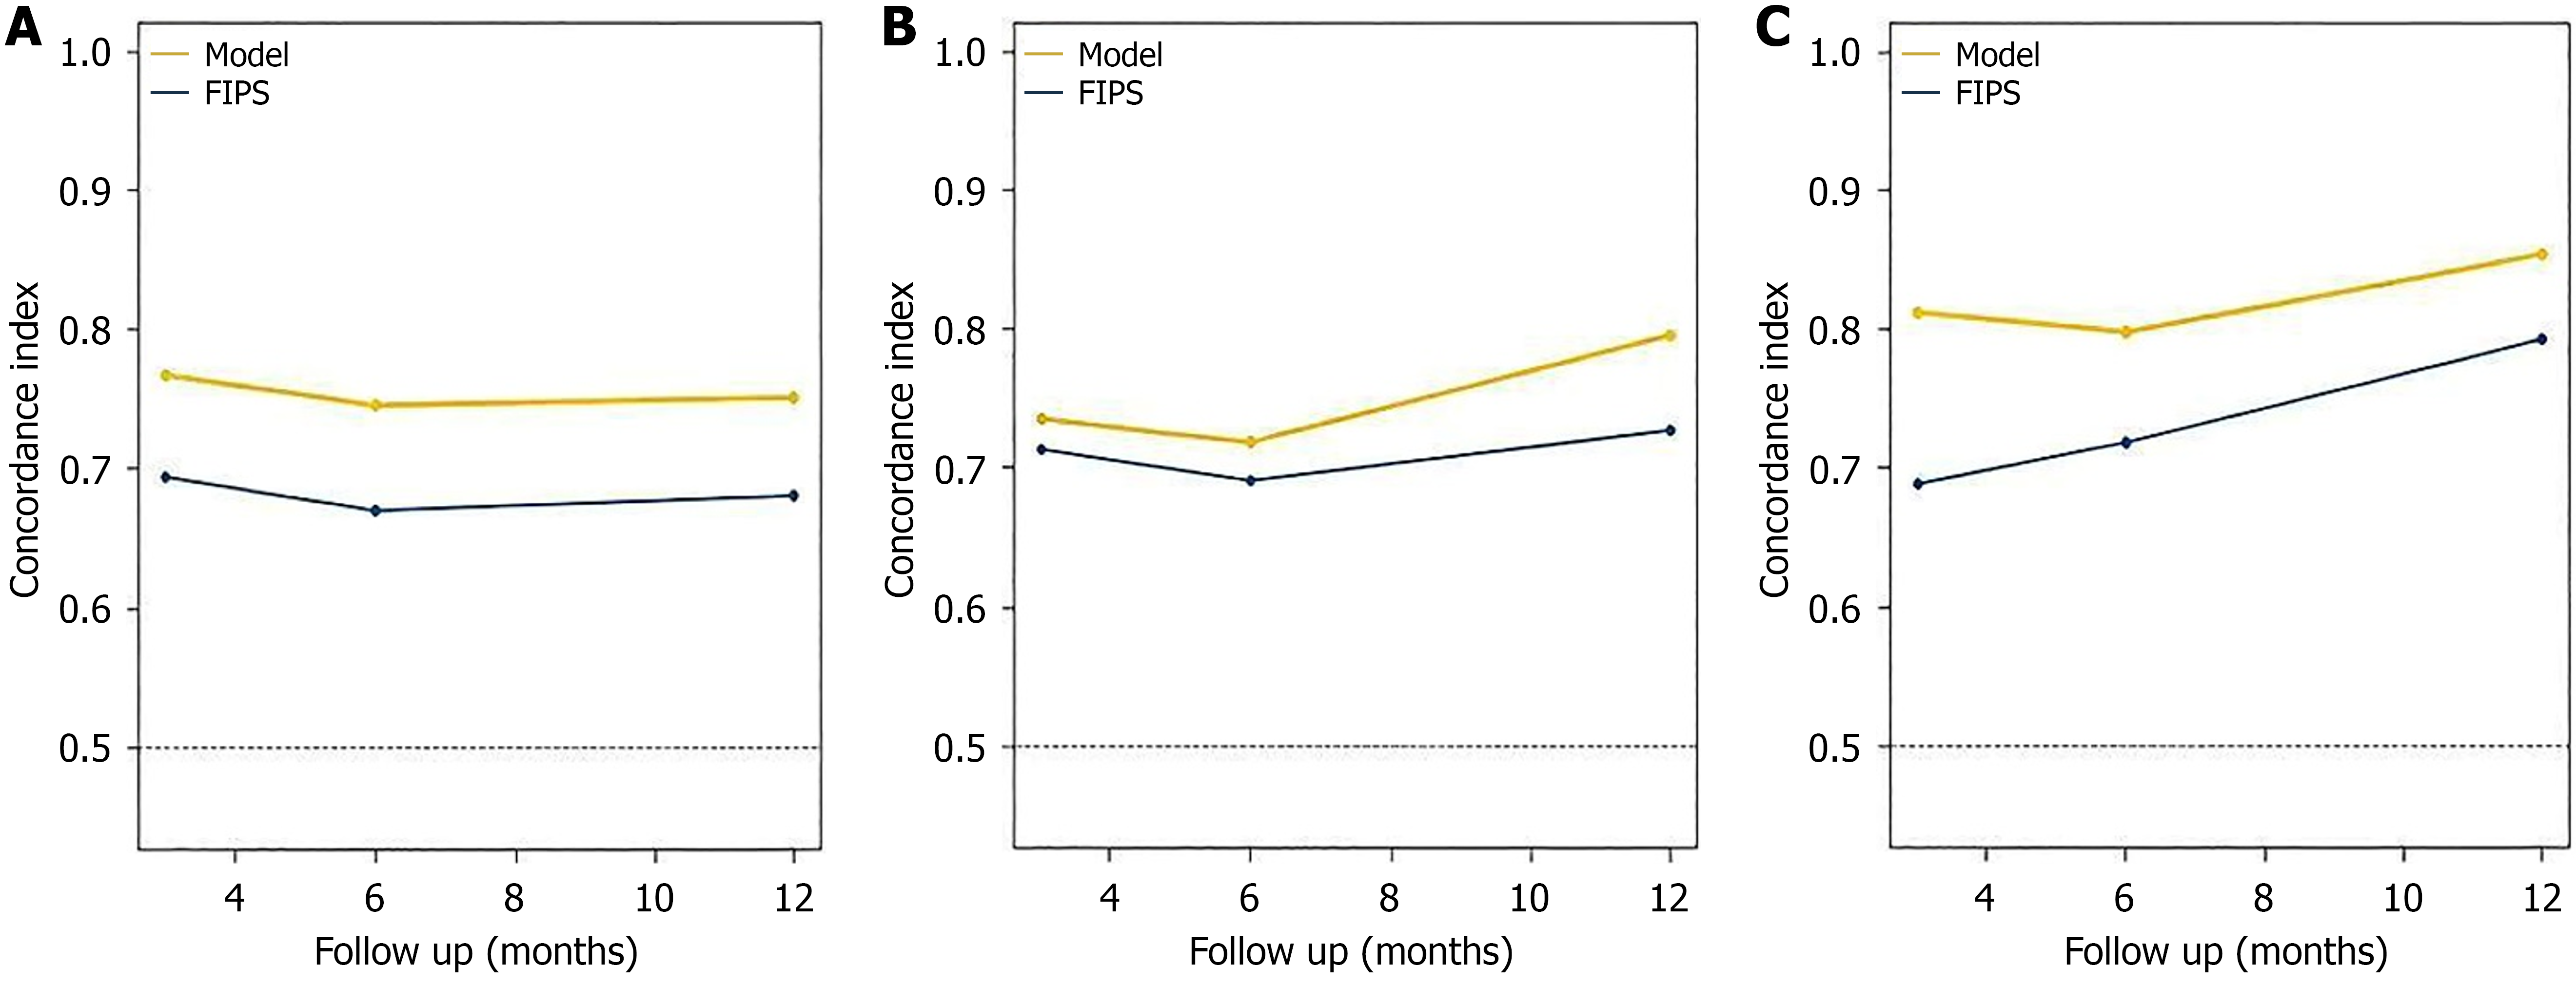
Figure 2 Time-dependent concordance index curves of the nomogram and Freiburg index of post-transjugular intrahepatic porto
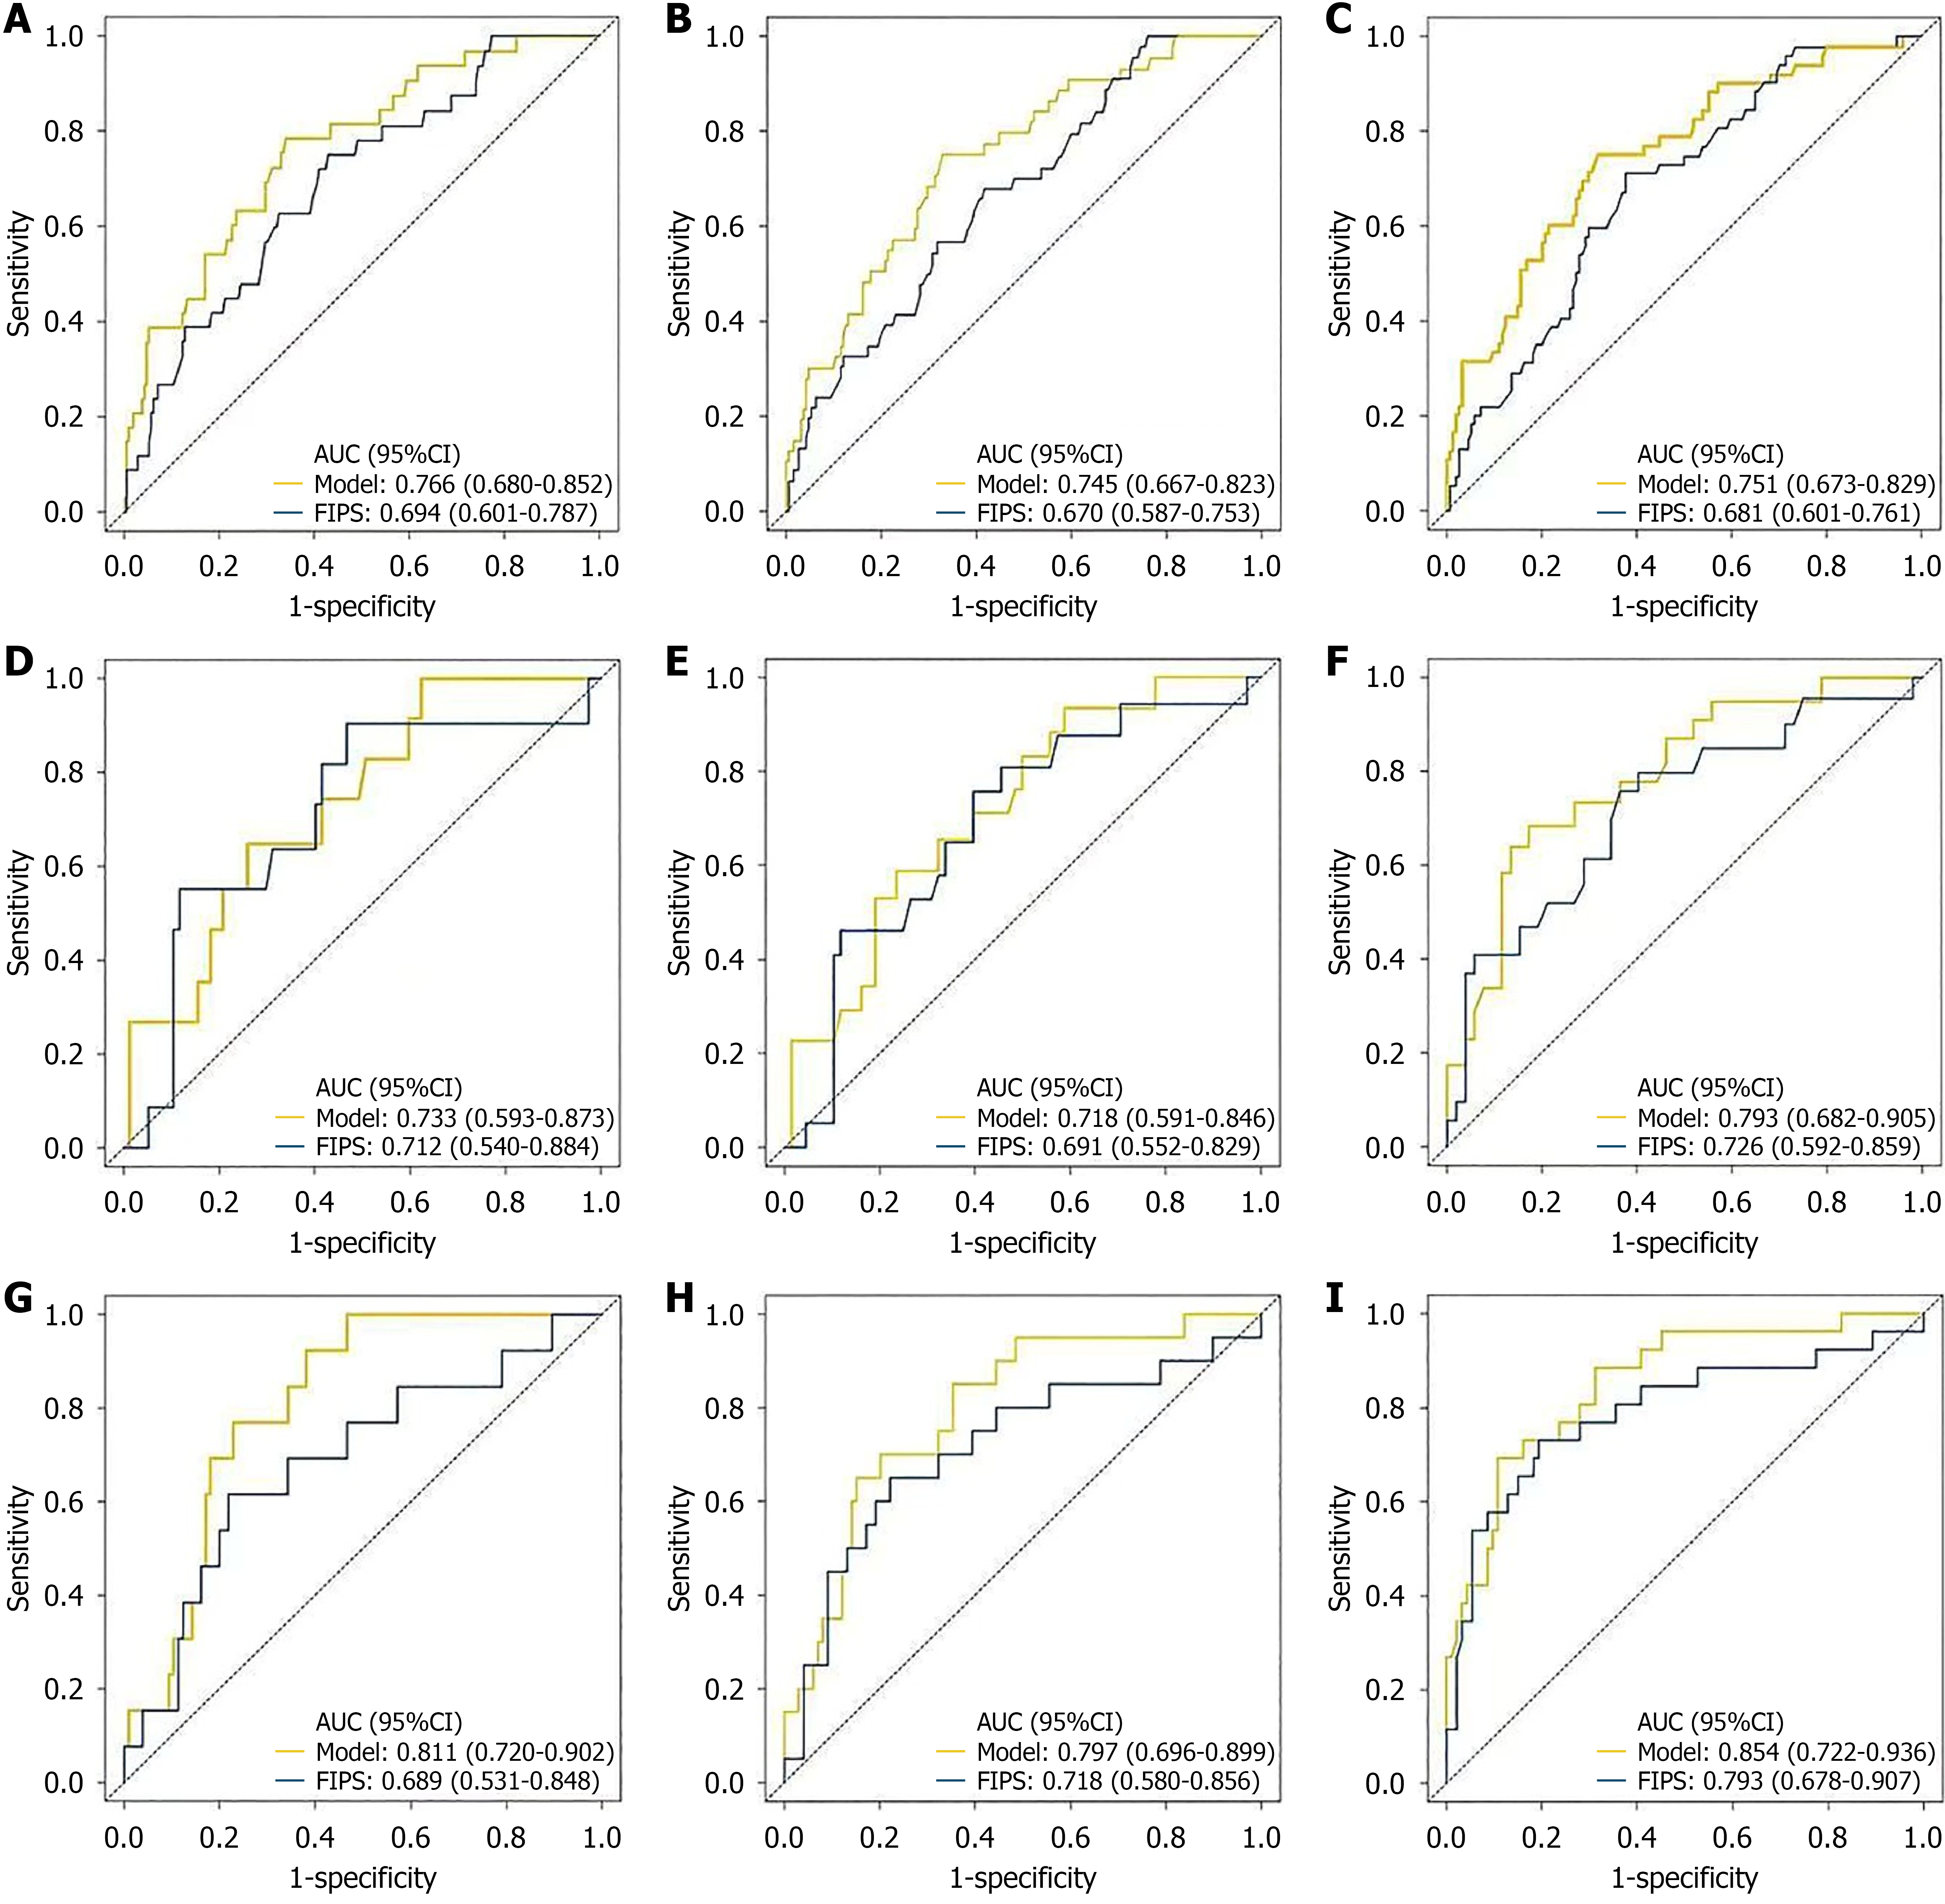
Figure 3 Receiver operating characteristic curve of the nomogram and Freiburg index of post-transjugular intrahepatic portosystemic shunt survival score predicting post-transjugular intrahepatic portosystemic shunt severe hepatic encephalopathy at 3-month, 6-month, and 1-year.
A-C: Training cohort; D-F: Internal validation cohort; G-I: External validation cohort. The modified model exhibited better performance than the Freiburg index of post-transjugular intrahepatic portosystemic shunt survival scoring system in predicting post-transjugular intrahepatic portosystemic shunt severe hepatic encephalopathy at all time points across all study cohorts. AUC: Area under the receiver operating characteristic curve; FIPS: Freiburg index of post-transjugular intrahepatic portosystemic shunt survival.
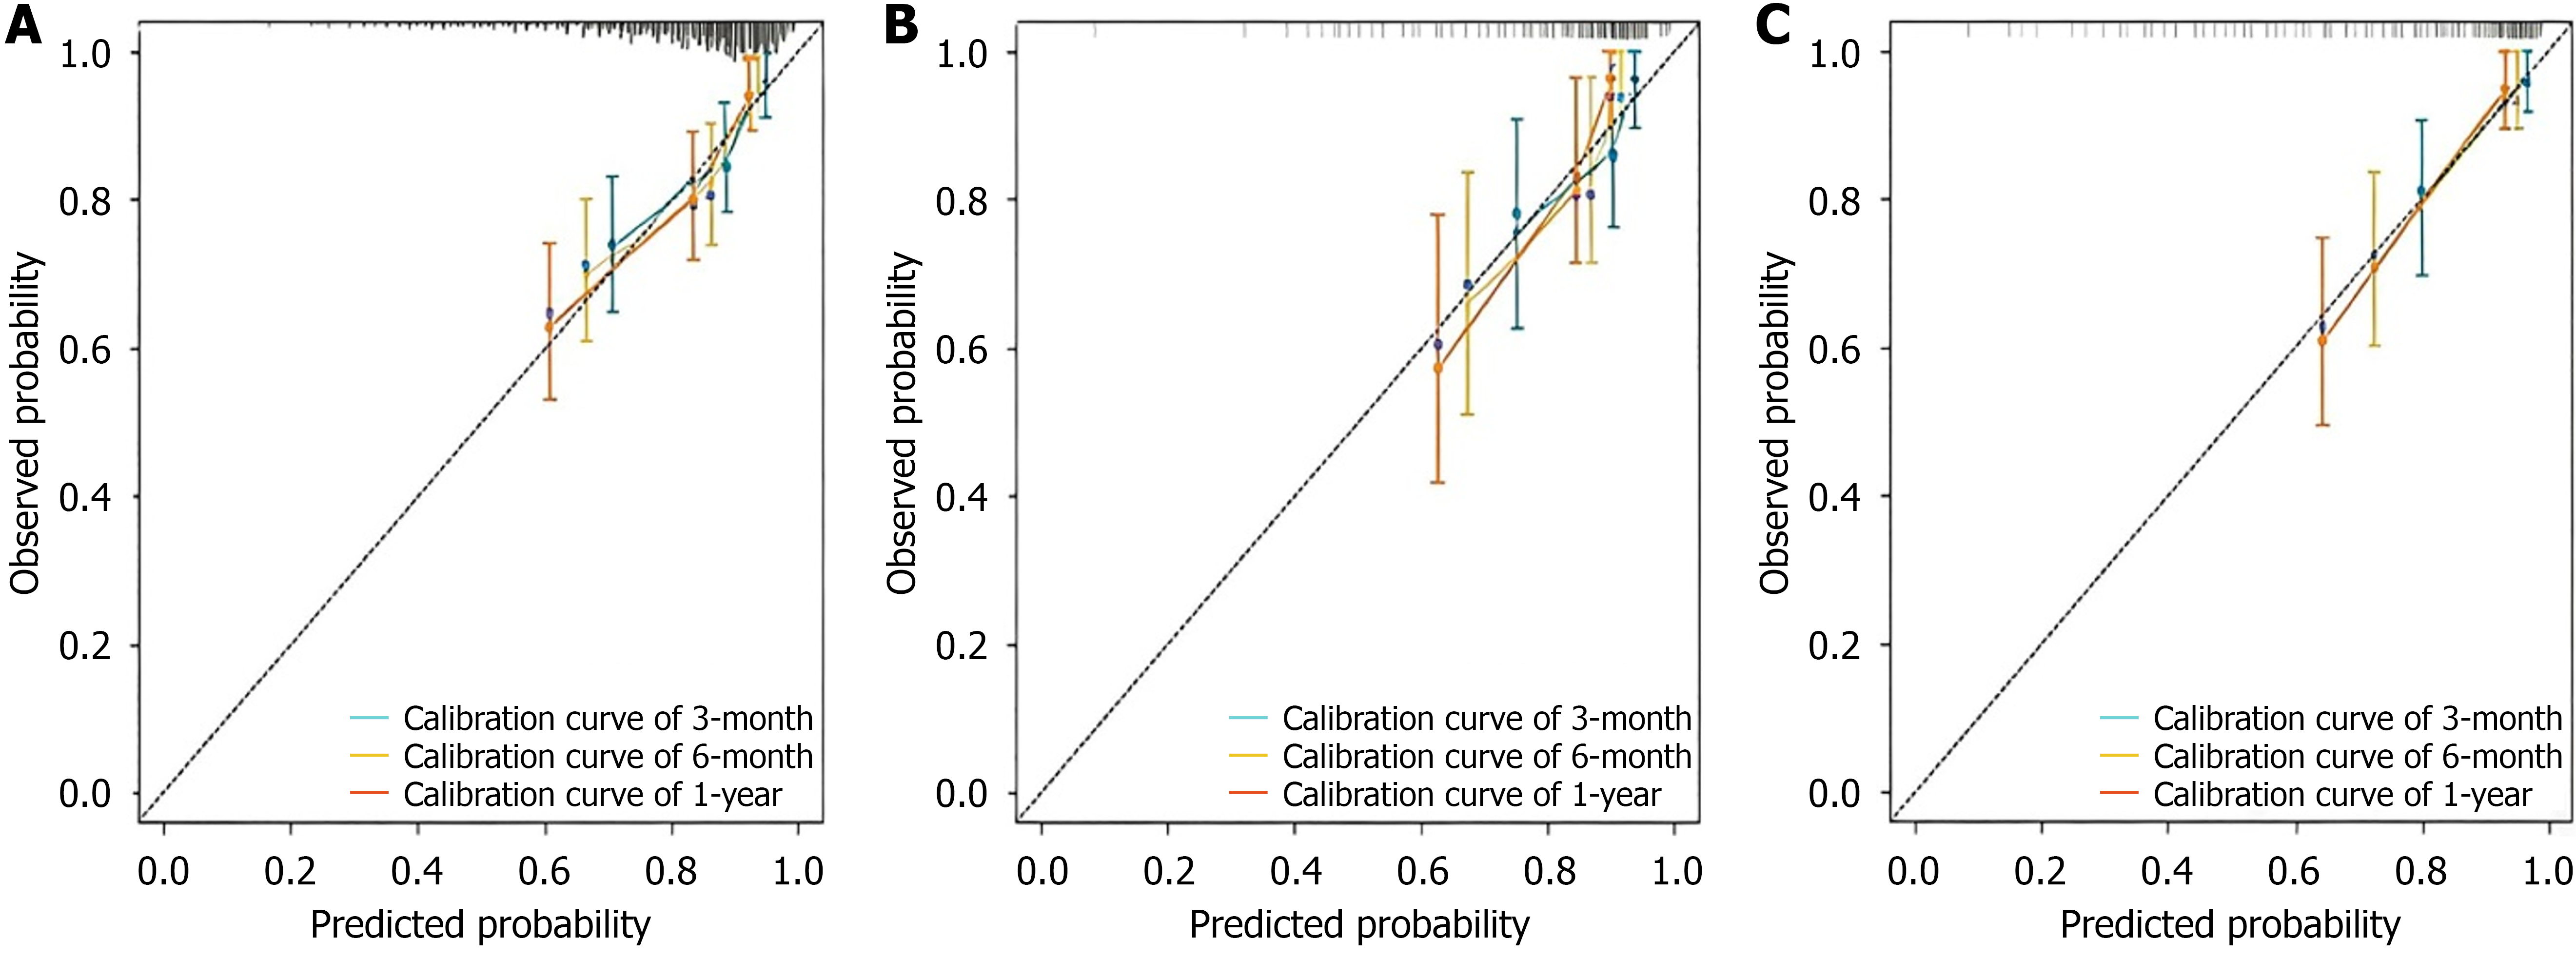
Figure 4 Calibration curves of the nomogram showing the 3-month, 6-month, and 1-year prediction accuracy for post-transjugular intrahepatic portosystemic shunt severe hepatic encephalopathy.
A: Training cohort; B: Internal validation cohort; C: External validation cohort. The nomogram predictions closely aligned with the observed outcomes in all cohorts, demonstrating excellent calibration.
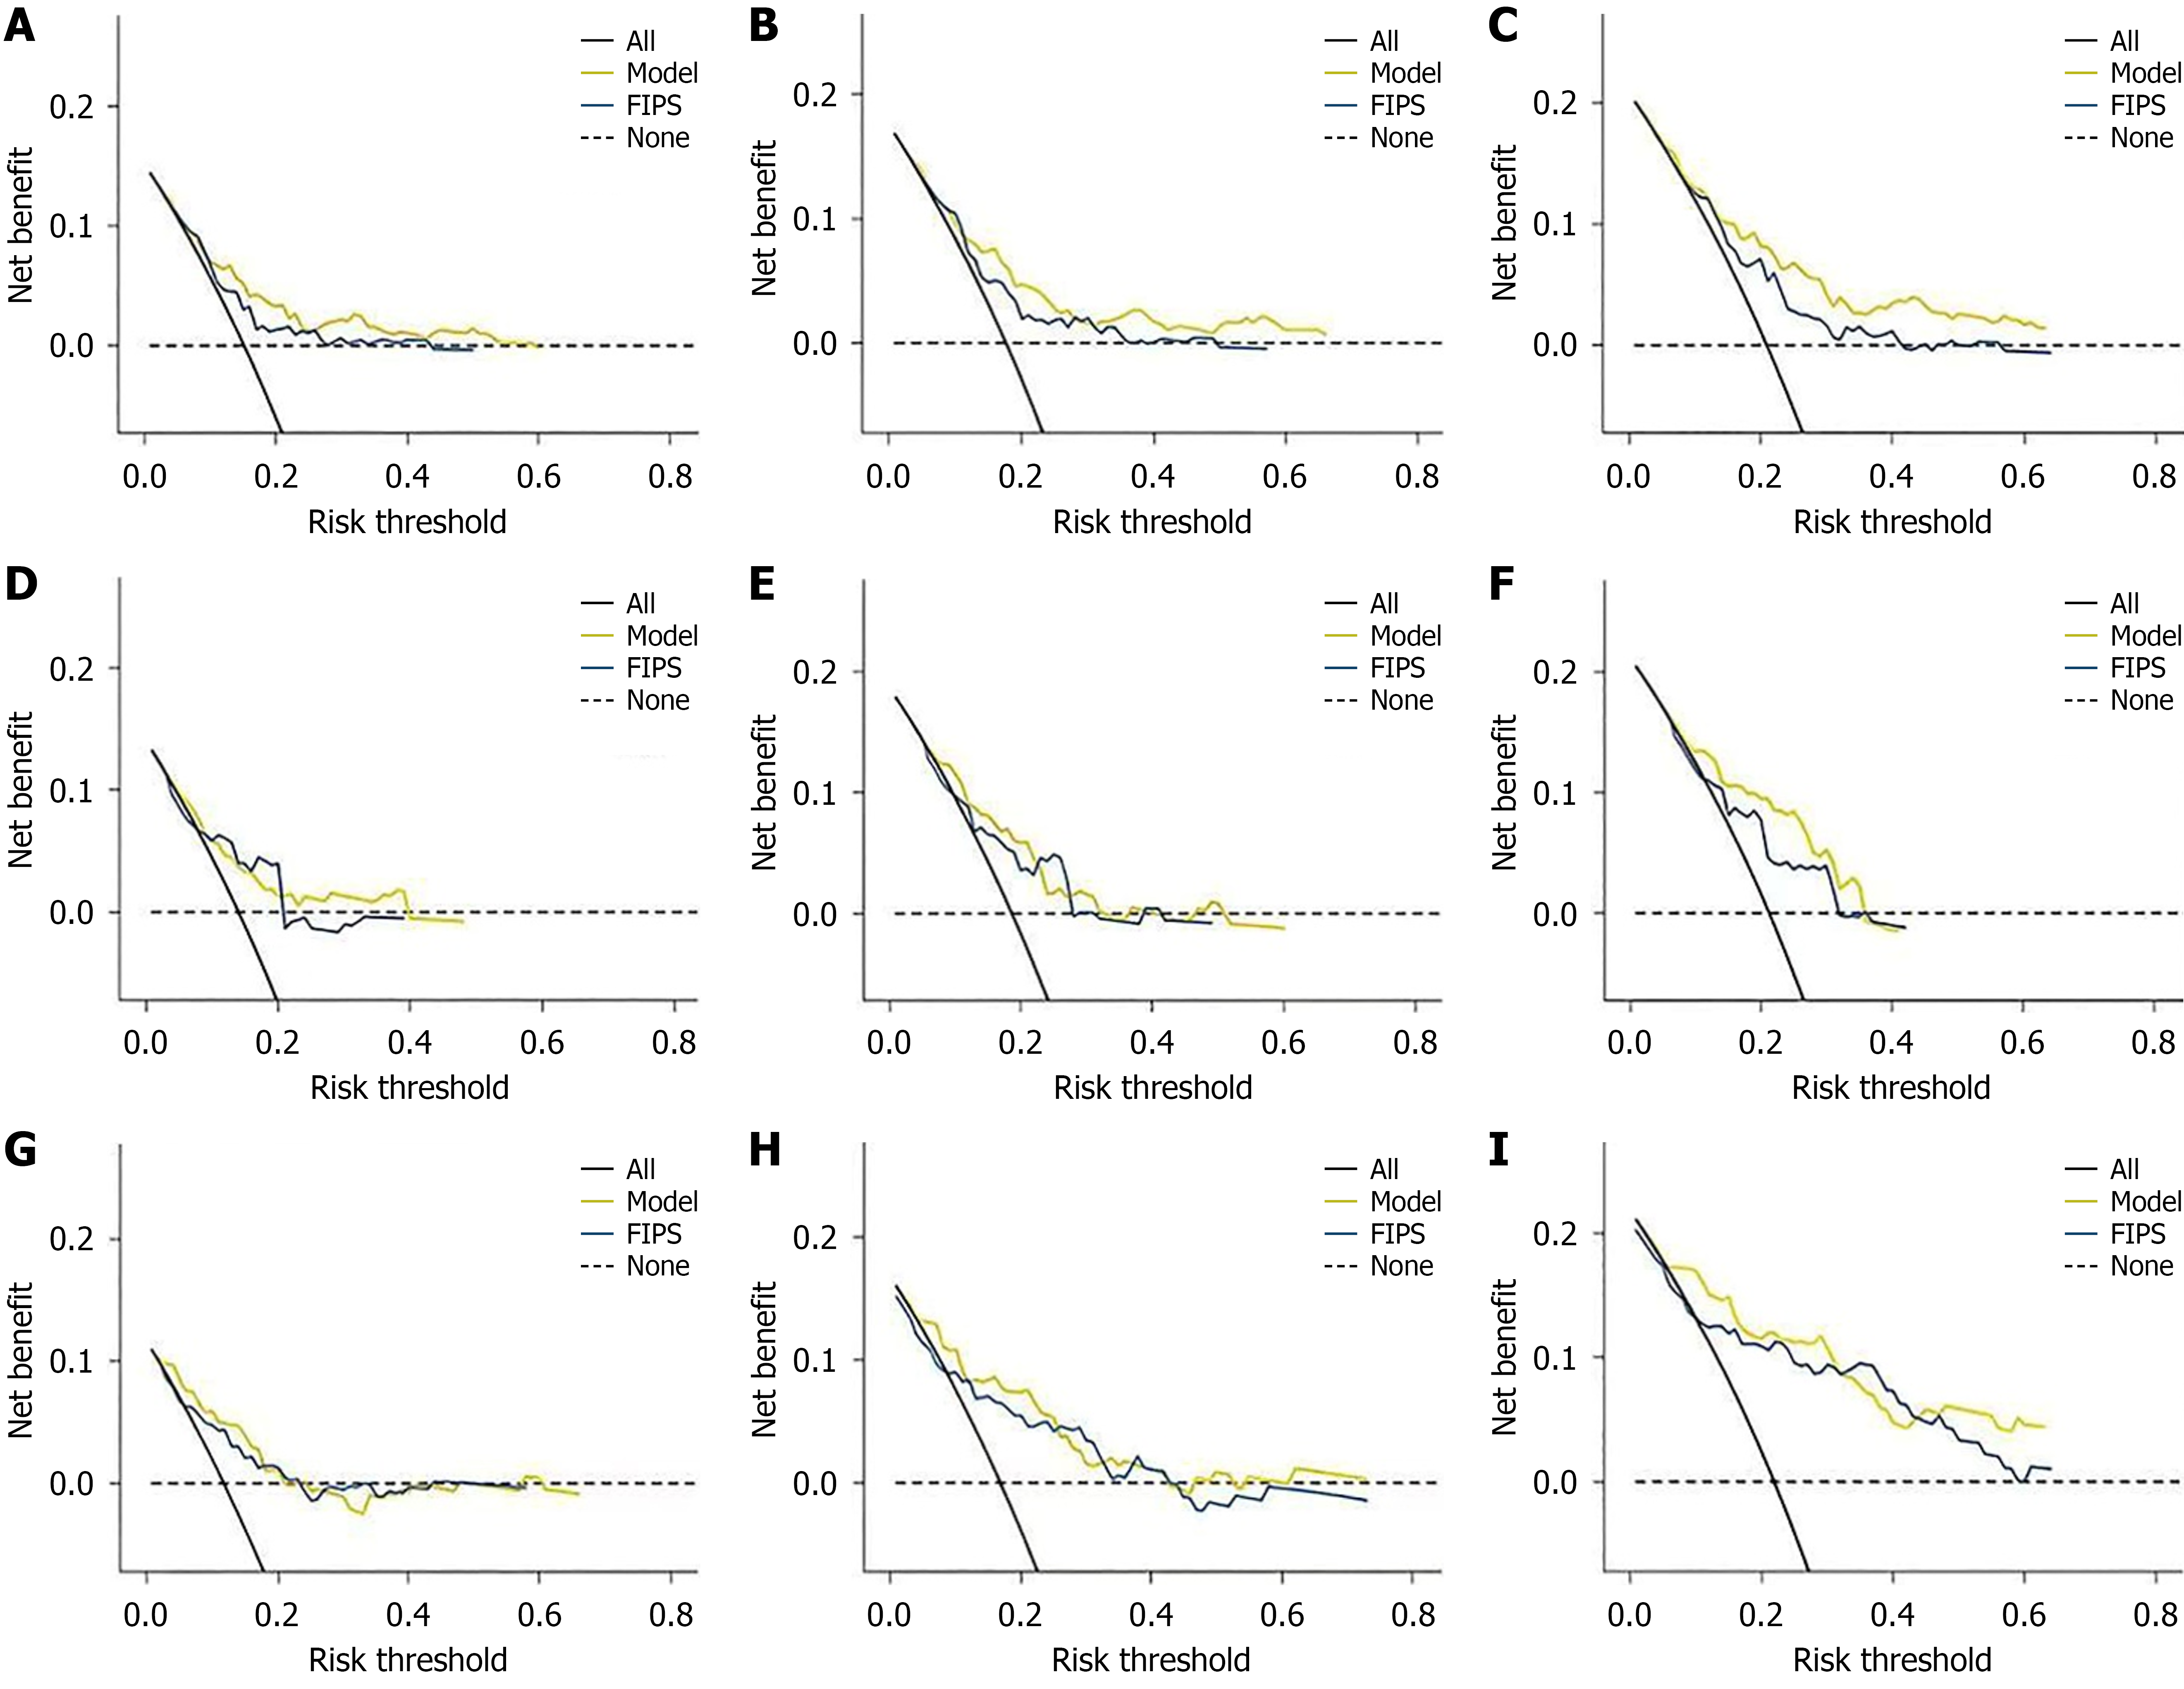
Figure 5 Decision curve analysis of the nomogram and Freiburg index of post-transjugular intrahepatic portosystemic shunt survival score evaluating 3-month, 6-month and 1-year net benefit.
A-C: Training cohort; D-F: Internal validation cohort; G-I: External validation cohort. Across all cohorts, the nomogram consistently achieved higher net benefits than the Freiburg index of post-transjugular intrahepatic portosystemic shunt survival scoring system over a wide range of clinical decision thresholds. FIPS: Freiburg index of post-transjugular intrahepatic portosystemic shunt survival.
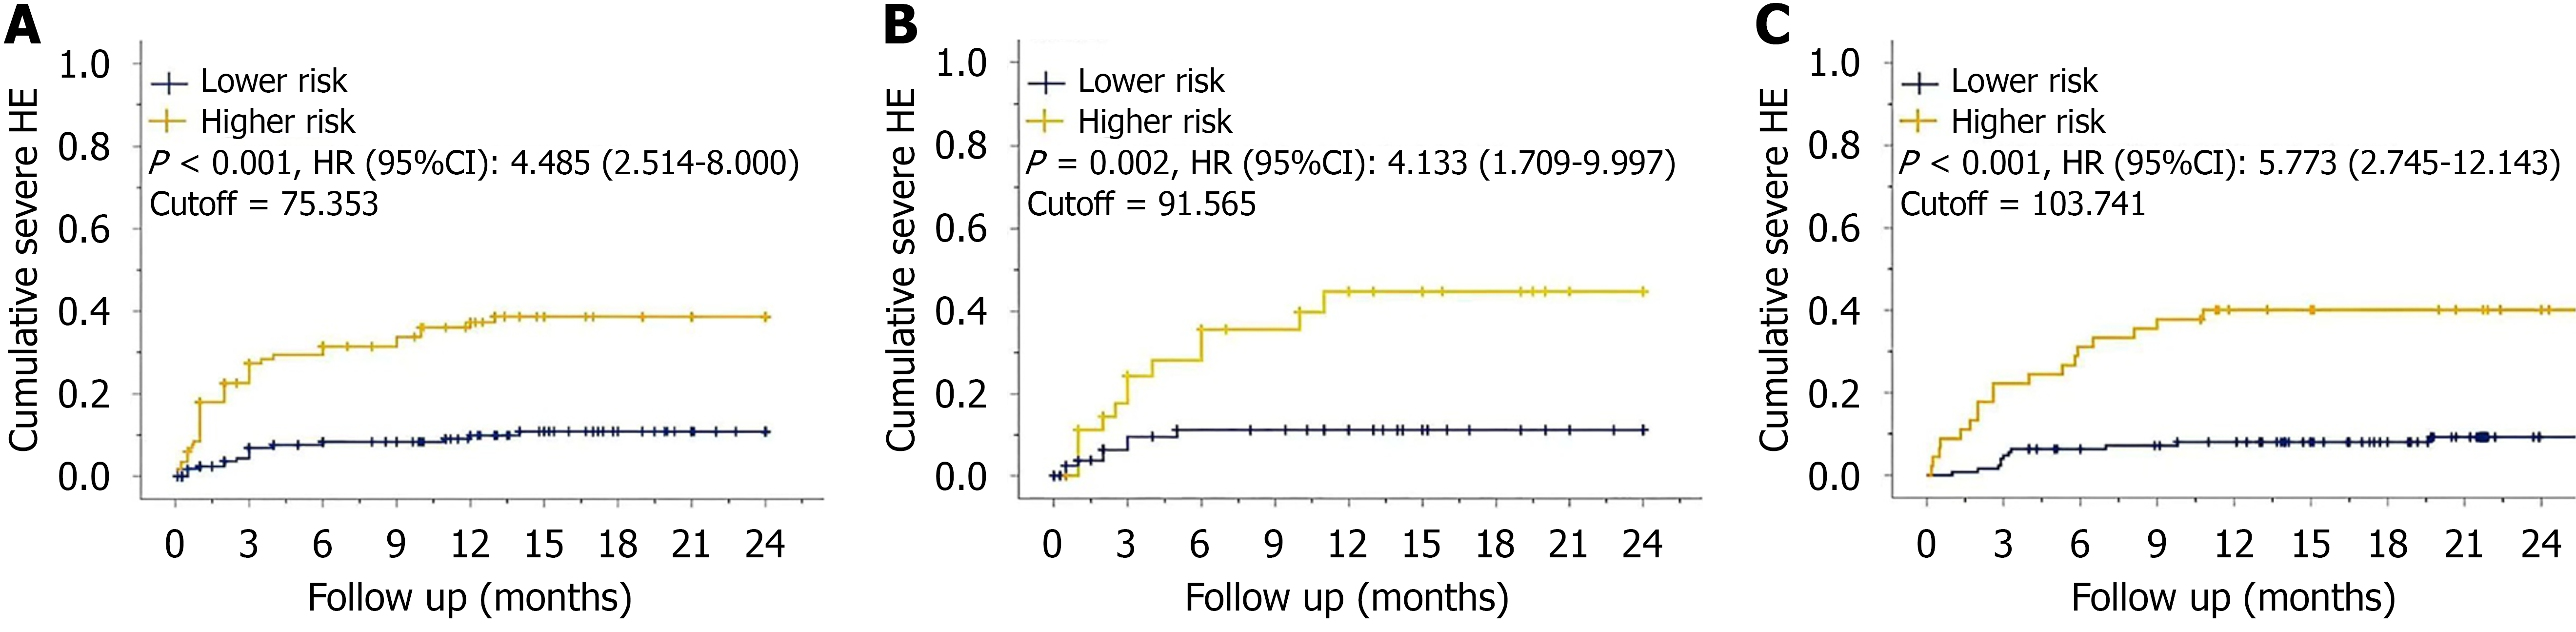
Figure 6 Comparison of the cumulative incidence rates of post-transjugular intrahepatic portosystemic shunt severe hepatic ence
- Citation: Zhang JQ, Yin L, Zhu YJ, Dong L, Hou CL, Tian SJ, Chen P, Huang XZ, Xu H, Chen ZY, Xu XJ, Zhou CZ, Cheng DL. Modified model incorporating sarcopenia and myosteatosis for predicting severe hepatic encephalopathy after transjugular intrahepatic portosystemic shunt: Multicenter study. World J Gastroenterol 2026; 32(29): 118090
- URL: https://www.wjgnet.com/1007-9327/full/v32/i29/118090.htm
- DOI: https://dx.doi.org/10.3748/wjg.118090