
















Copyright: ©Author(s) 2026.
World J Gastroenterol. Jul 28, 2026; 32(28): 119442
Published online Jul 28, 2026. doi: 10.3748/wjg.119442
Published online Jul 28, 2026. doi: 10.3748/wjg.119442
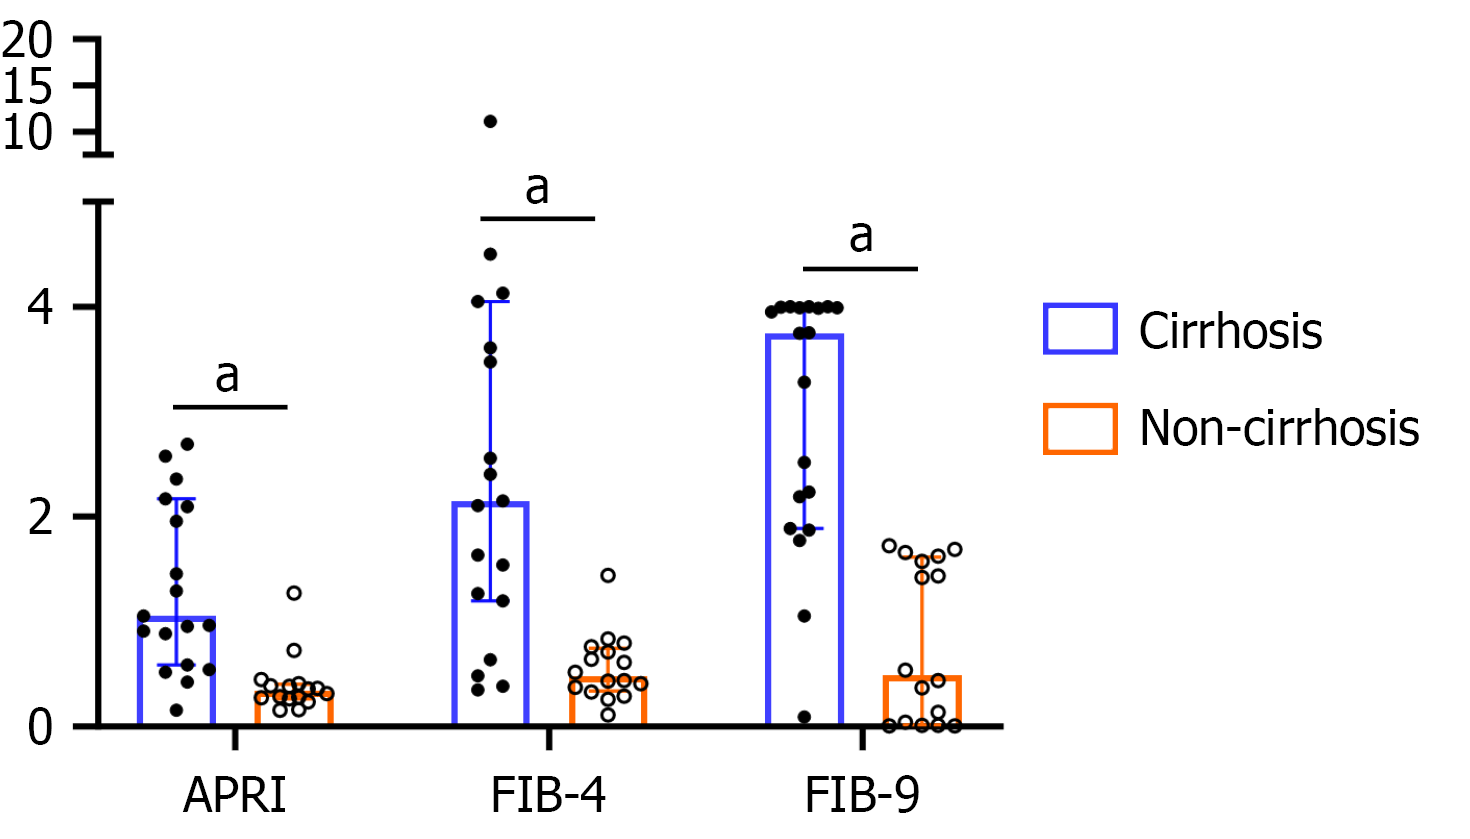
Figure 1 Comparison of non-invasive fibrosis indices between patients with and without cirrhosis.
Bar charts show the first quartile (Q1) and third quartile (Q3) of aspartate aminotransferase-to-platelet ratio index, fibrosis-4, and fibrosis-9 scores, with the median indicated by the line within the bar. All three indices were significantly higher in the cirrhosis group (n = 19) than in the non-cirrhosis group (n = 16). aP < 0.001 vs non-cirrhosis group. APRI: Aspartate aminotransferase-to-platelet ratio index; FIB-4: Fibrosis-4 index; FIB-9: Fibrosis-9.
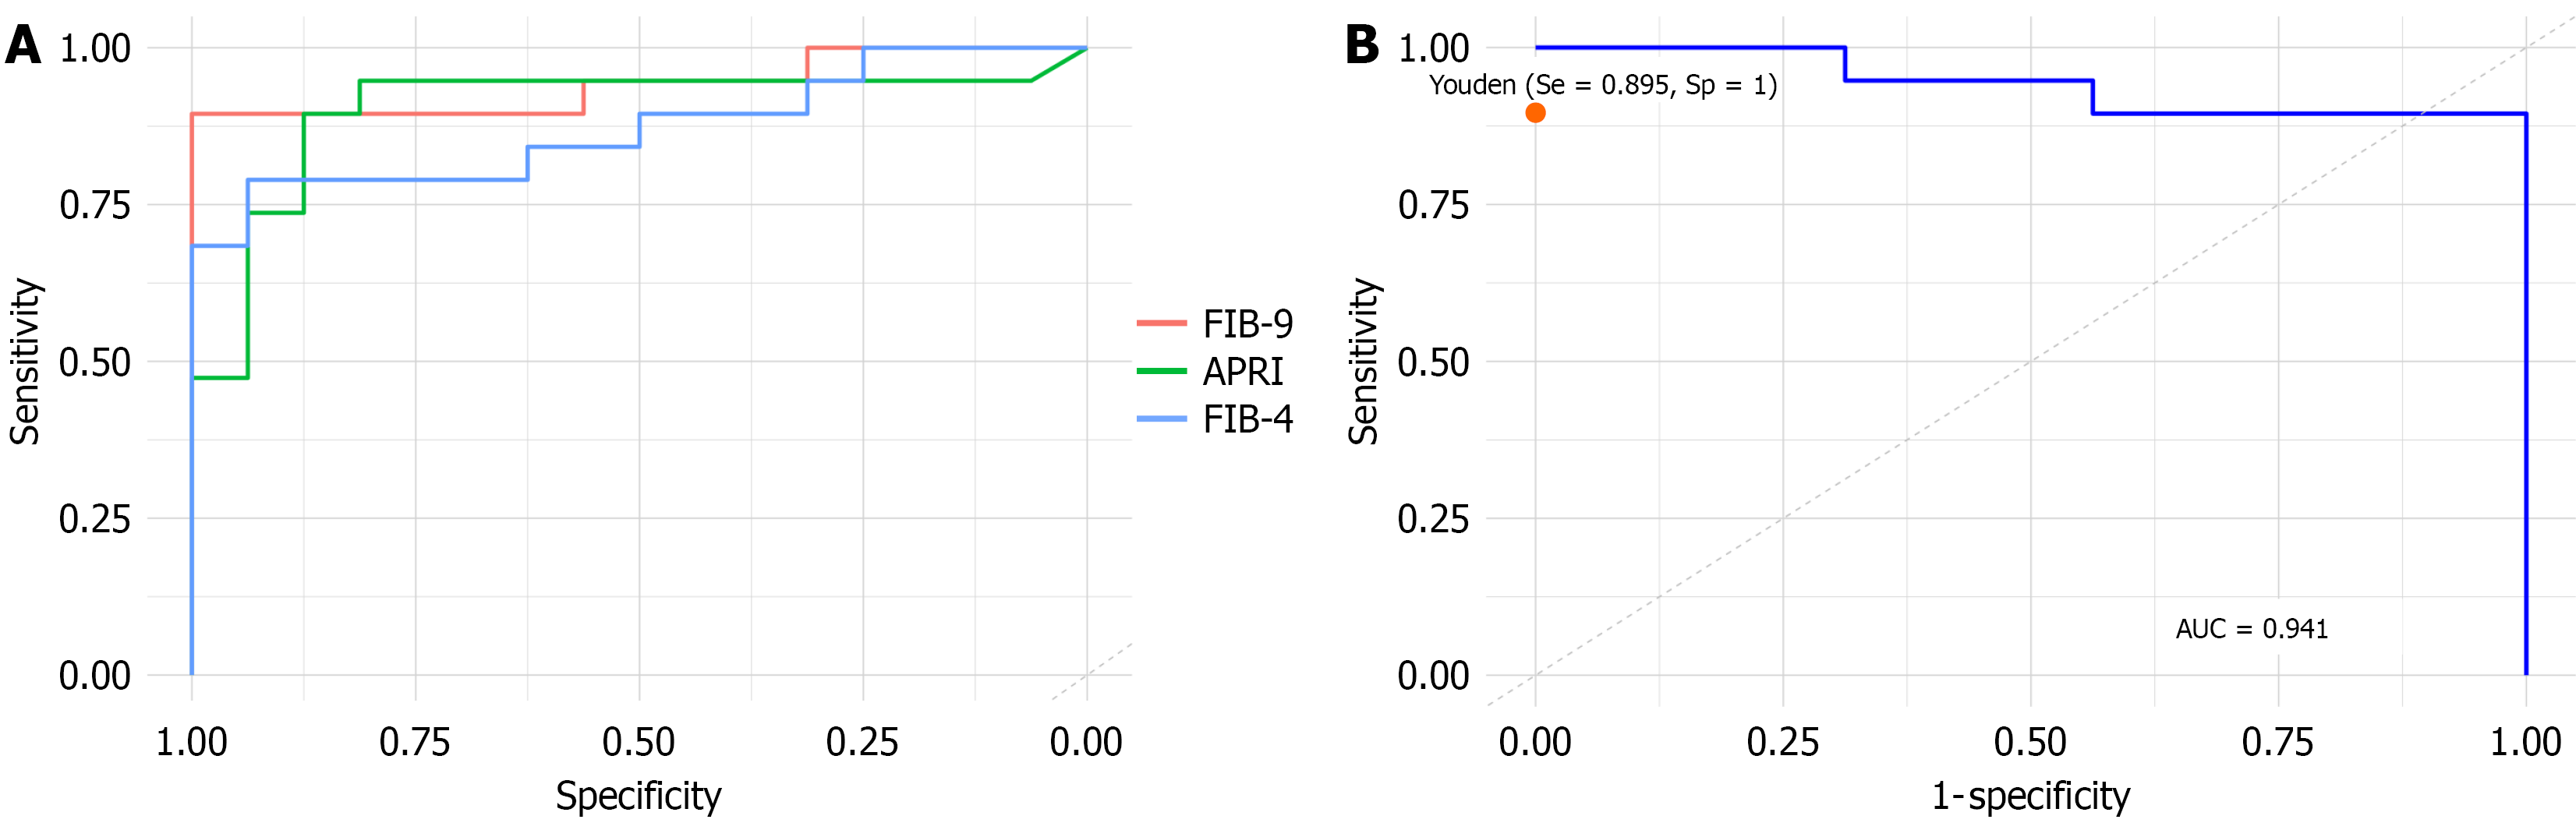
Figure 2 Receiver operating characteristic curves in identifying cirrhosis among patients with hypopituitarism.
A: Receiver operating characteristic (ROC) curves for aspartate aminotransferase-to-platelet ratio index (APRI), fibrosis-4 (FIB-4), and fibrosis-9 (FIB-9) in identifying cirrhosis among patients with hypopituitarism. The area under the ROC curve (AUC) was highest for FIB-9 (AUC = 0.941), followed by APRI (AUC = 0.903) and FIB-4 (AUC = 0.872), indicating superior diagnostic accuracy of FIB-9 for detecting cirrhosis; B: ROC curve for FIB-9 in diagnosing cirrhosis among patients with hypopituitarism. The AUC was 0.941. Based on the maximum Youden index, the optimal cutoff value was 1.748, yielding a sensitivity of 89.5% and specificity of 100%. The diagonal dashed line represents the reference line of no discrimination (AUC = 0.5). APRI: Aspartate aminotransferase-to-platelet ratio index; FIB-4: Fibrosis-4 index; FIB-9: Fibrosis-9; AUC: Area under the receiver operating characteristic curve.
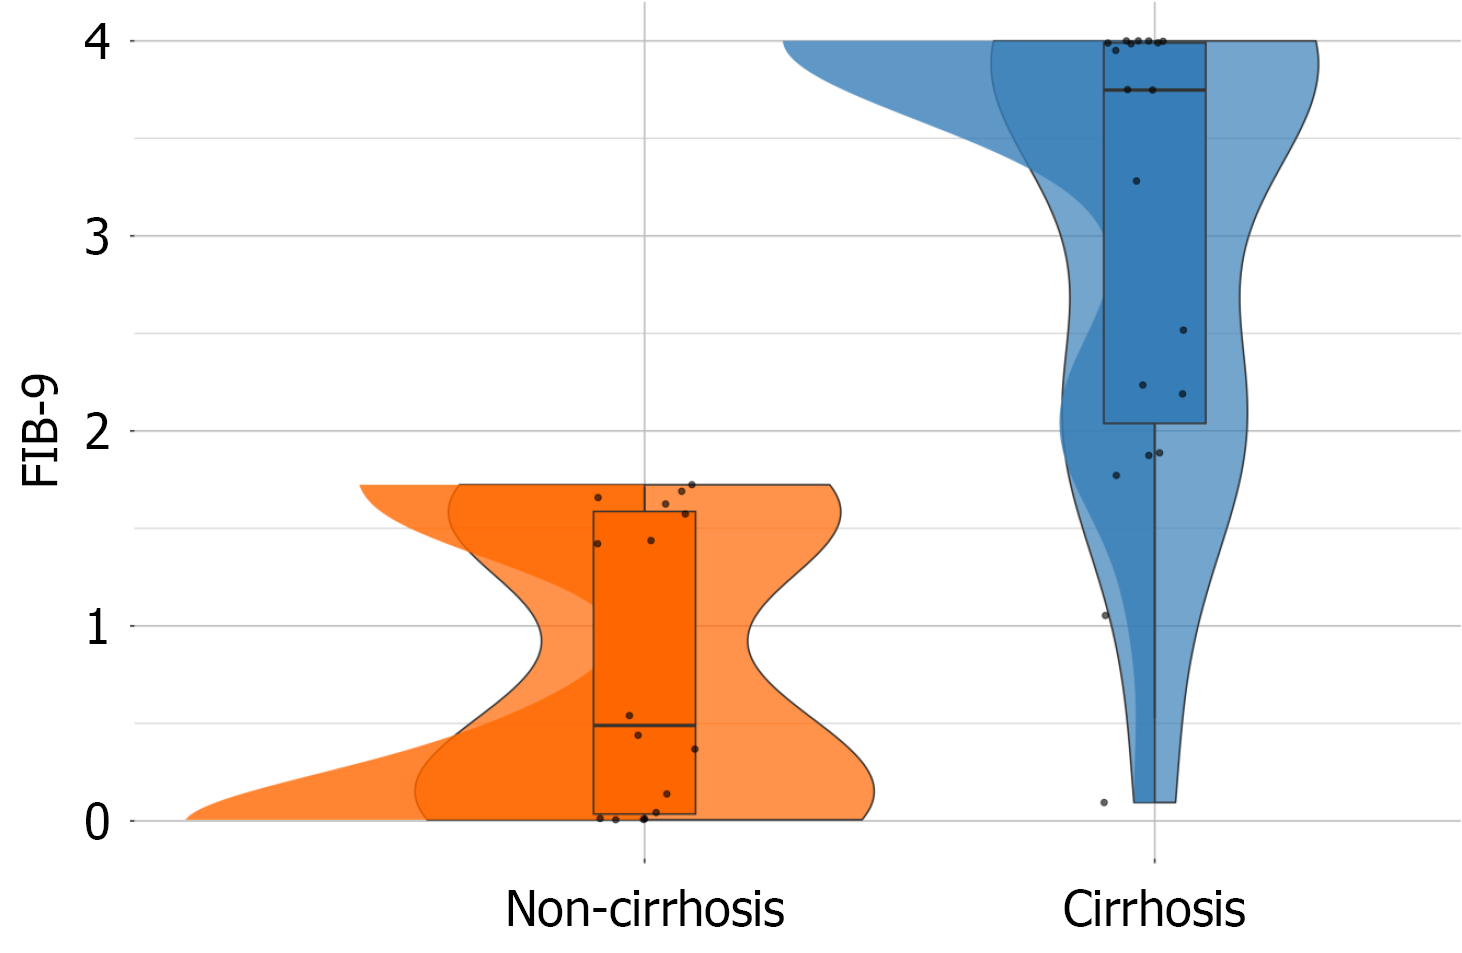
Figure 3 Distribution of fibrosis-9 scores in patients with hypopituitarism, stratified by cirrhosis status.
Raincloud plots depict the distribution of fibrosis-9 values for patients with (n = 19; blue) and without cirrhosis (n = 16; orange). The width of the violins indicates data density at each value, while boxplots show median (central line), interquartile range (box boundaries), and range (whiskers). FIB-9: Fibrosis-9.
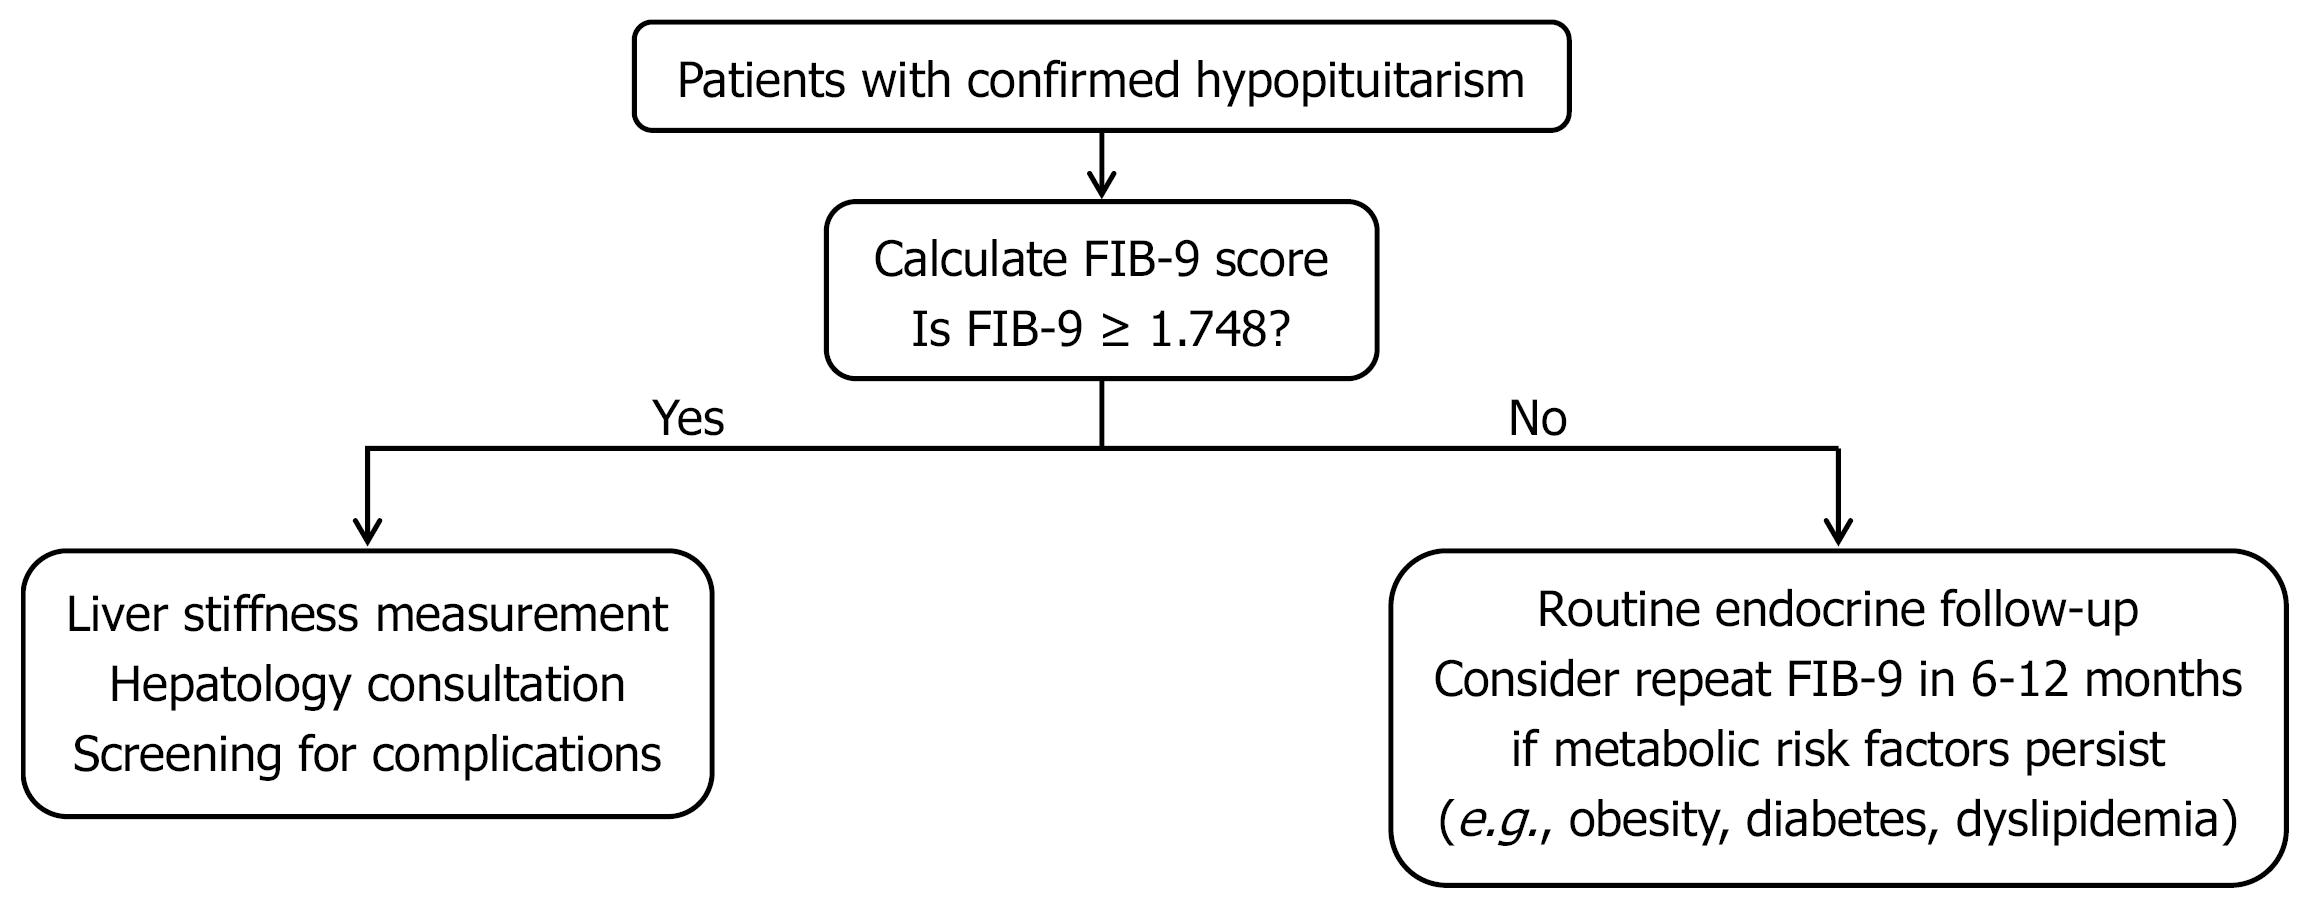
Figure 4 Proposed fibrosis-9-guided screening algorithm for cirrhosis in patients with hypopituitarism.
Patients with confirmed hypopituitarism should undergo calculation of the fibrosis-9 (FIB-9) score to assess liver fibrosis risk. If the FIB-9 score is ≥ 1.748, further evaluation is recommended, including liver stiffness measurement, hepatology consultation, and screening for complications. If the FIB-9 score is < 1.748, routine endocrine follow-up is advised, with consideration of repeat FIB-9 testing in 6-12 months if metabolic risk factors persist (e.g., obesity, diabetes mellitus, dyslipidemia). FIB-9: Fibrosis-9.
- Citation: Li T, Wang X, Nie M, Han Q, Wu XY, Mao JF. Fibrosis index nine superiority for cirrhosis in hypopituitarism: Clinical validation of endocrine liver triage tool. World J Gastroenterol 2026; 32(28): 119442
- URL: https://www.wjgnet.com/1007-9327/full/v32/i28/119442.htm
- DOI: https://dx.doi.org/10.3748/wjg.119442