
















Copyright: ©Author(s) 2026.
World J Gastroenterol. Jul 28, 2026; 32(28): 118458
Published online Jul 28, 2026. doi: 10.3748/wjg.118458
Published online Jul 28, 2026. doi: 10.3748/wjg.118458
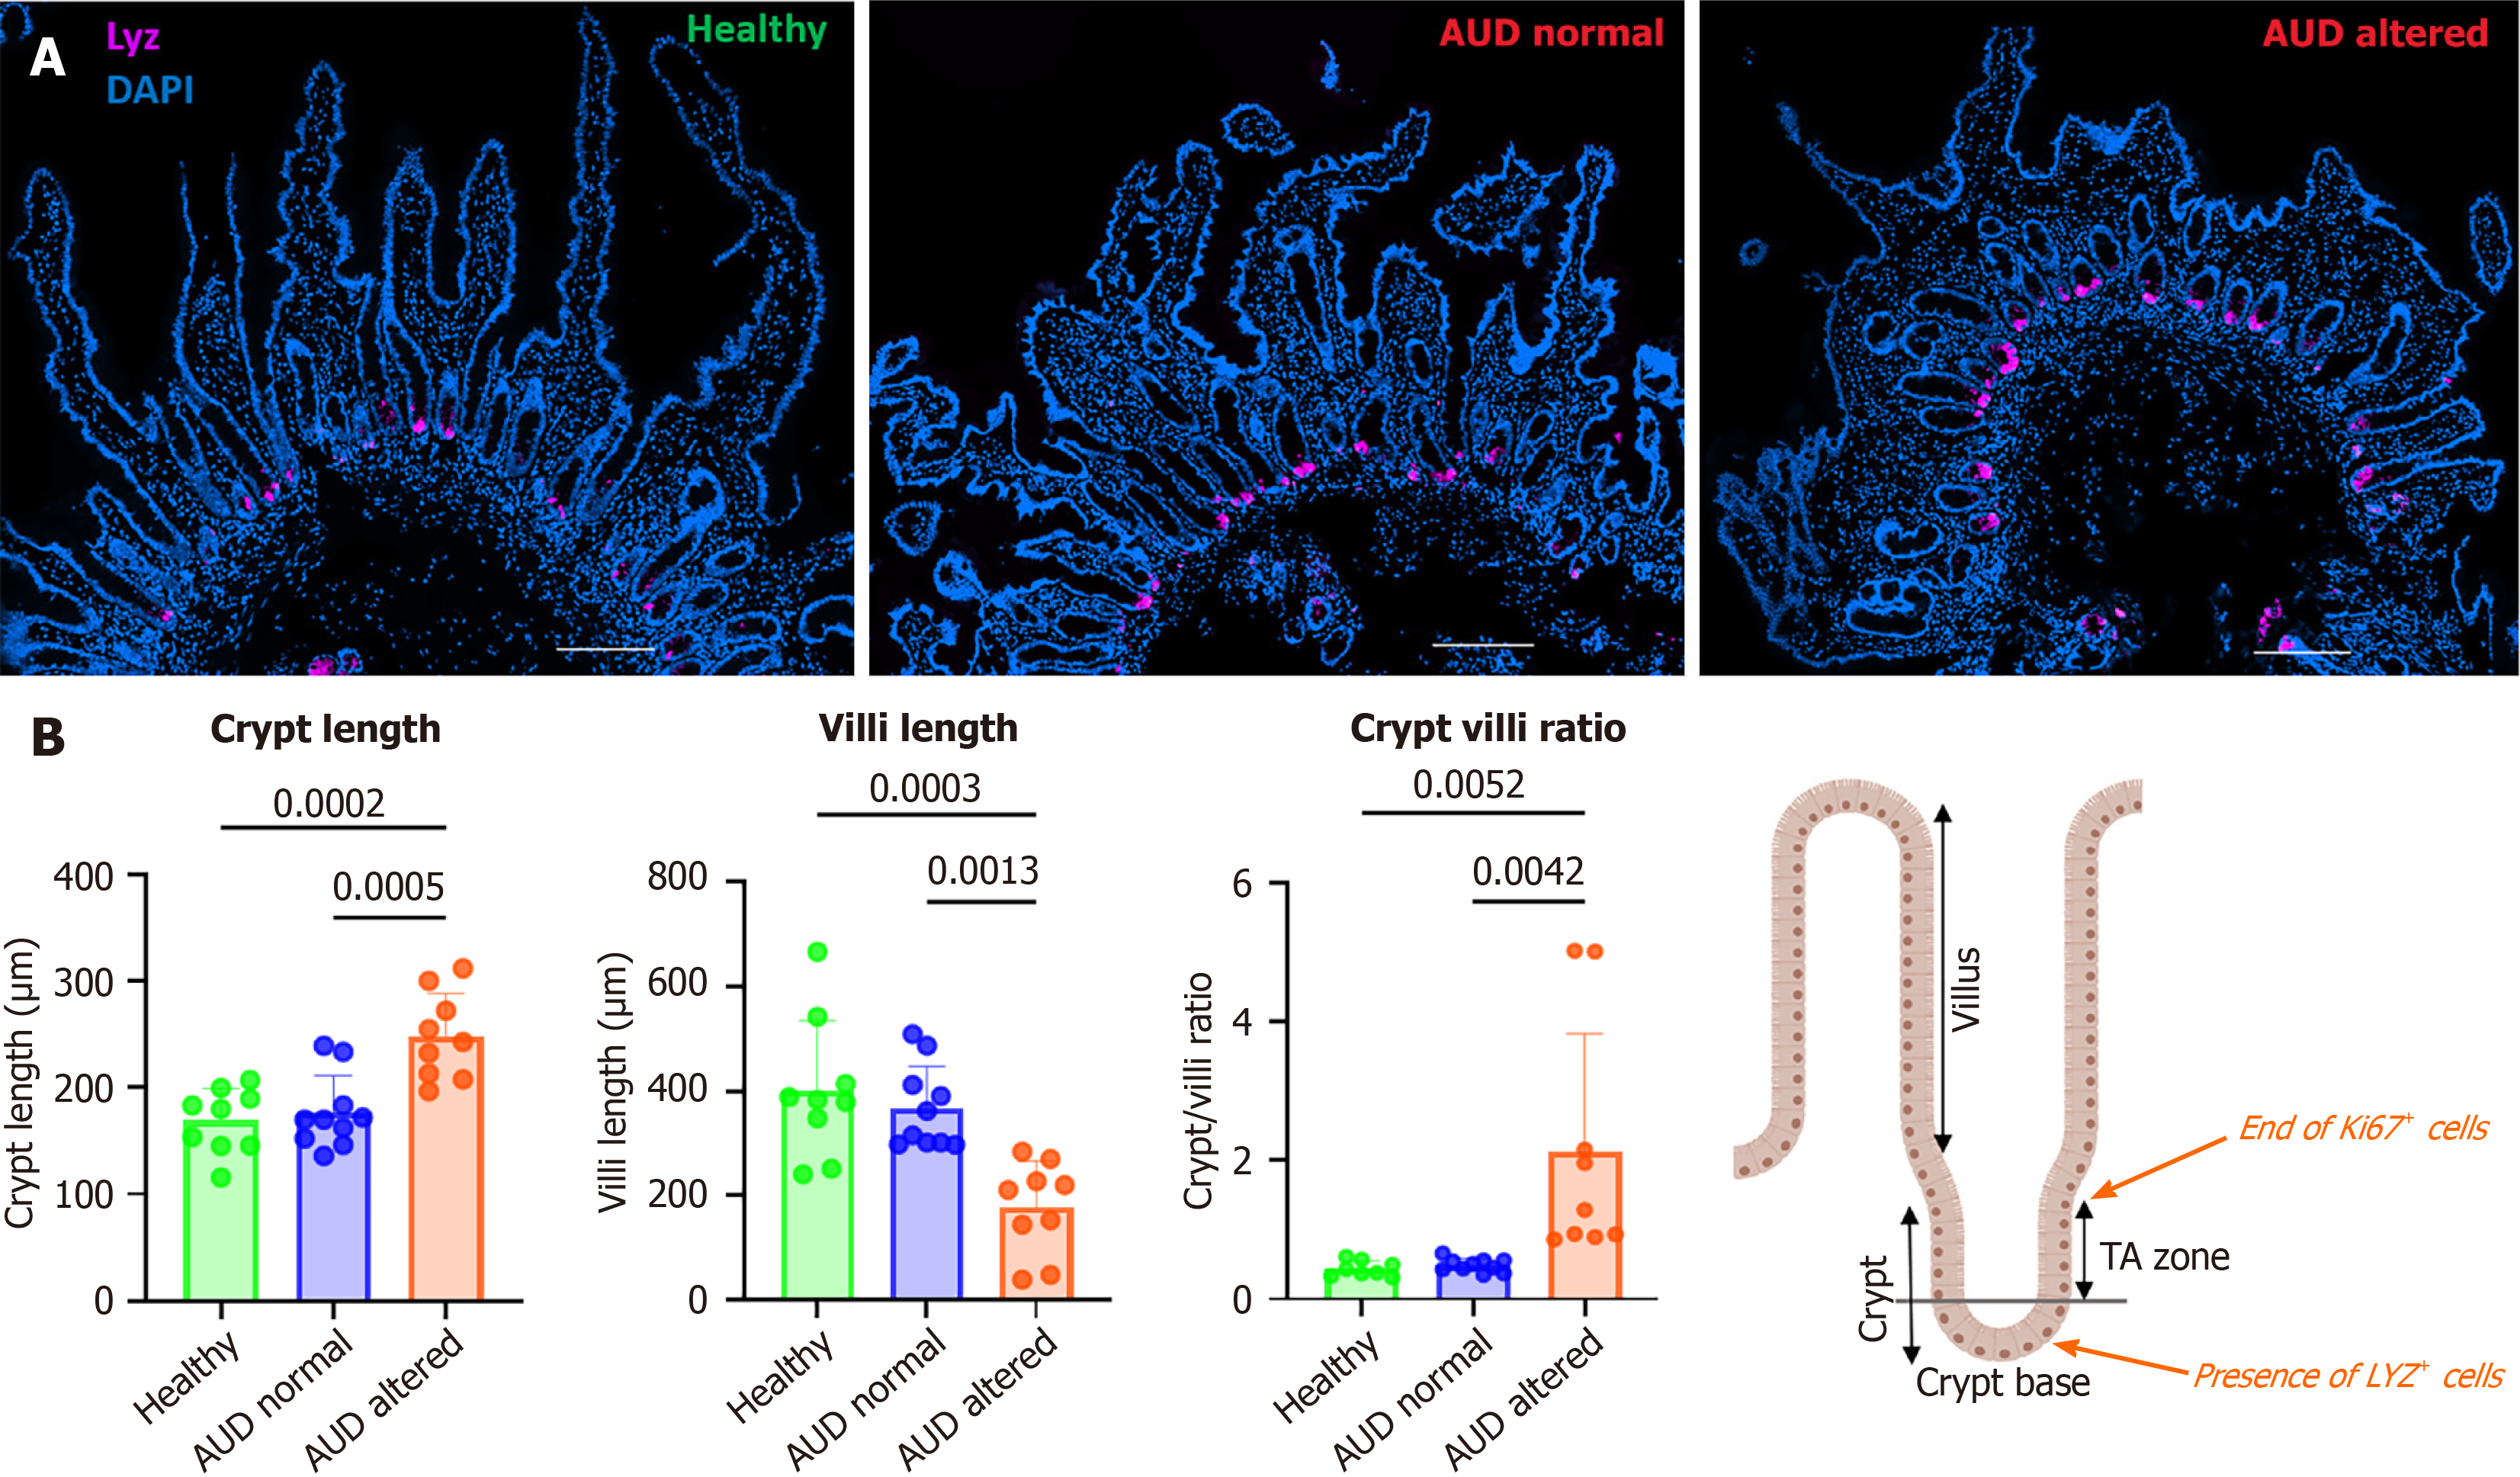
Figure 1 Crypt/villus morphology in alcohol use disorder patients.
A: Representative immunofluorescence staining of duodenal biopsies showing morphology alterations in a subset of alcohol use disorder (AUD) patients (AUD altered) compared to healthy subjects and AUD patients with normal morphology (AUD normal). Lysozyme in purple stains Paneth cells to identify the crypt base. DAPI (blue) is used as counterstaining to show the nucleus; B: Quantification of the crypt (μm) and villi length (μm). Five to ten crypts/villi were measured per patient. Data are presented as mean ± SD. Crypt and villus length are significantly modified in the AUD altered group resulting in a higher crypt to villi ratio in these patients. The schematic illustration shows the boundaries of the crypt, the transit-amplifying zone, and the villus that defined the limits for the measurements. Healthy (n = 9); AUD normal (n = 10); AUD altered (n = 9). AUD: Alcohol use disorder.
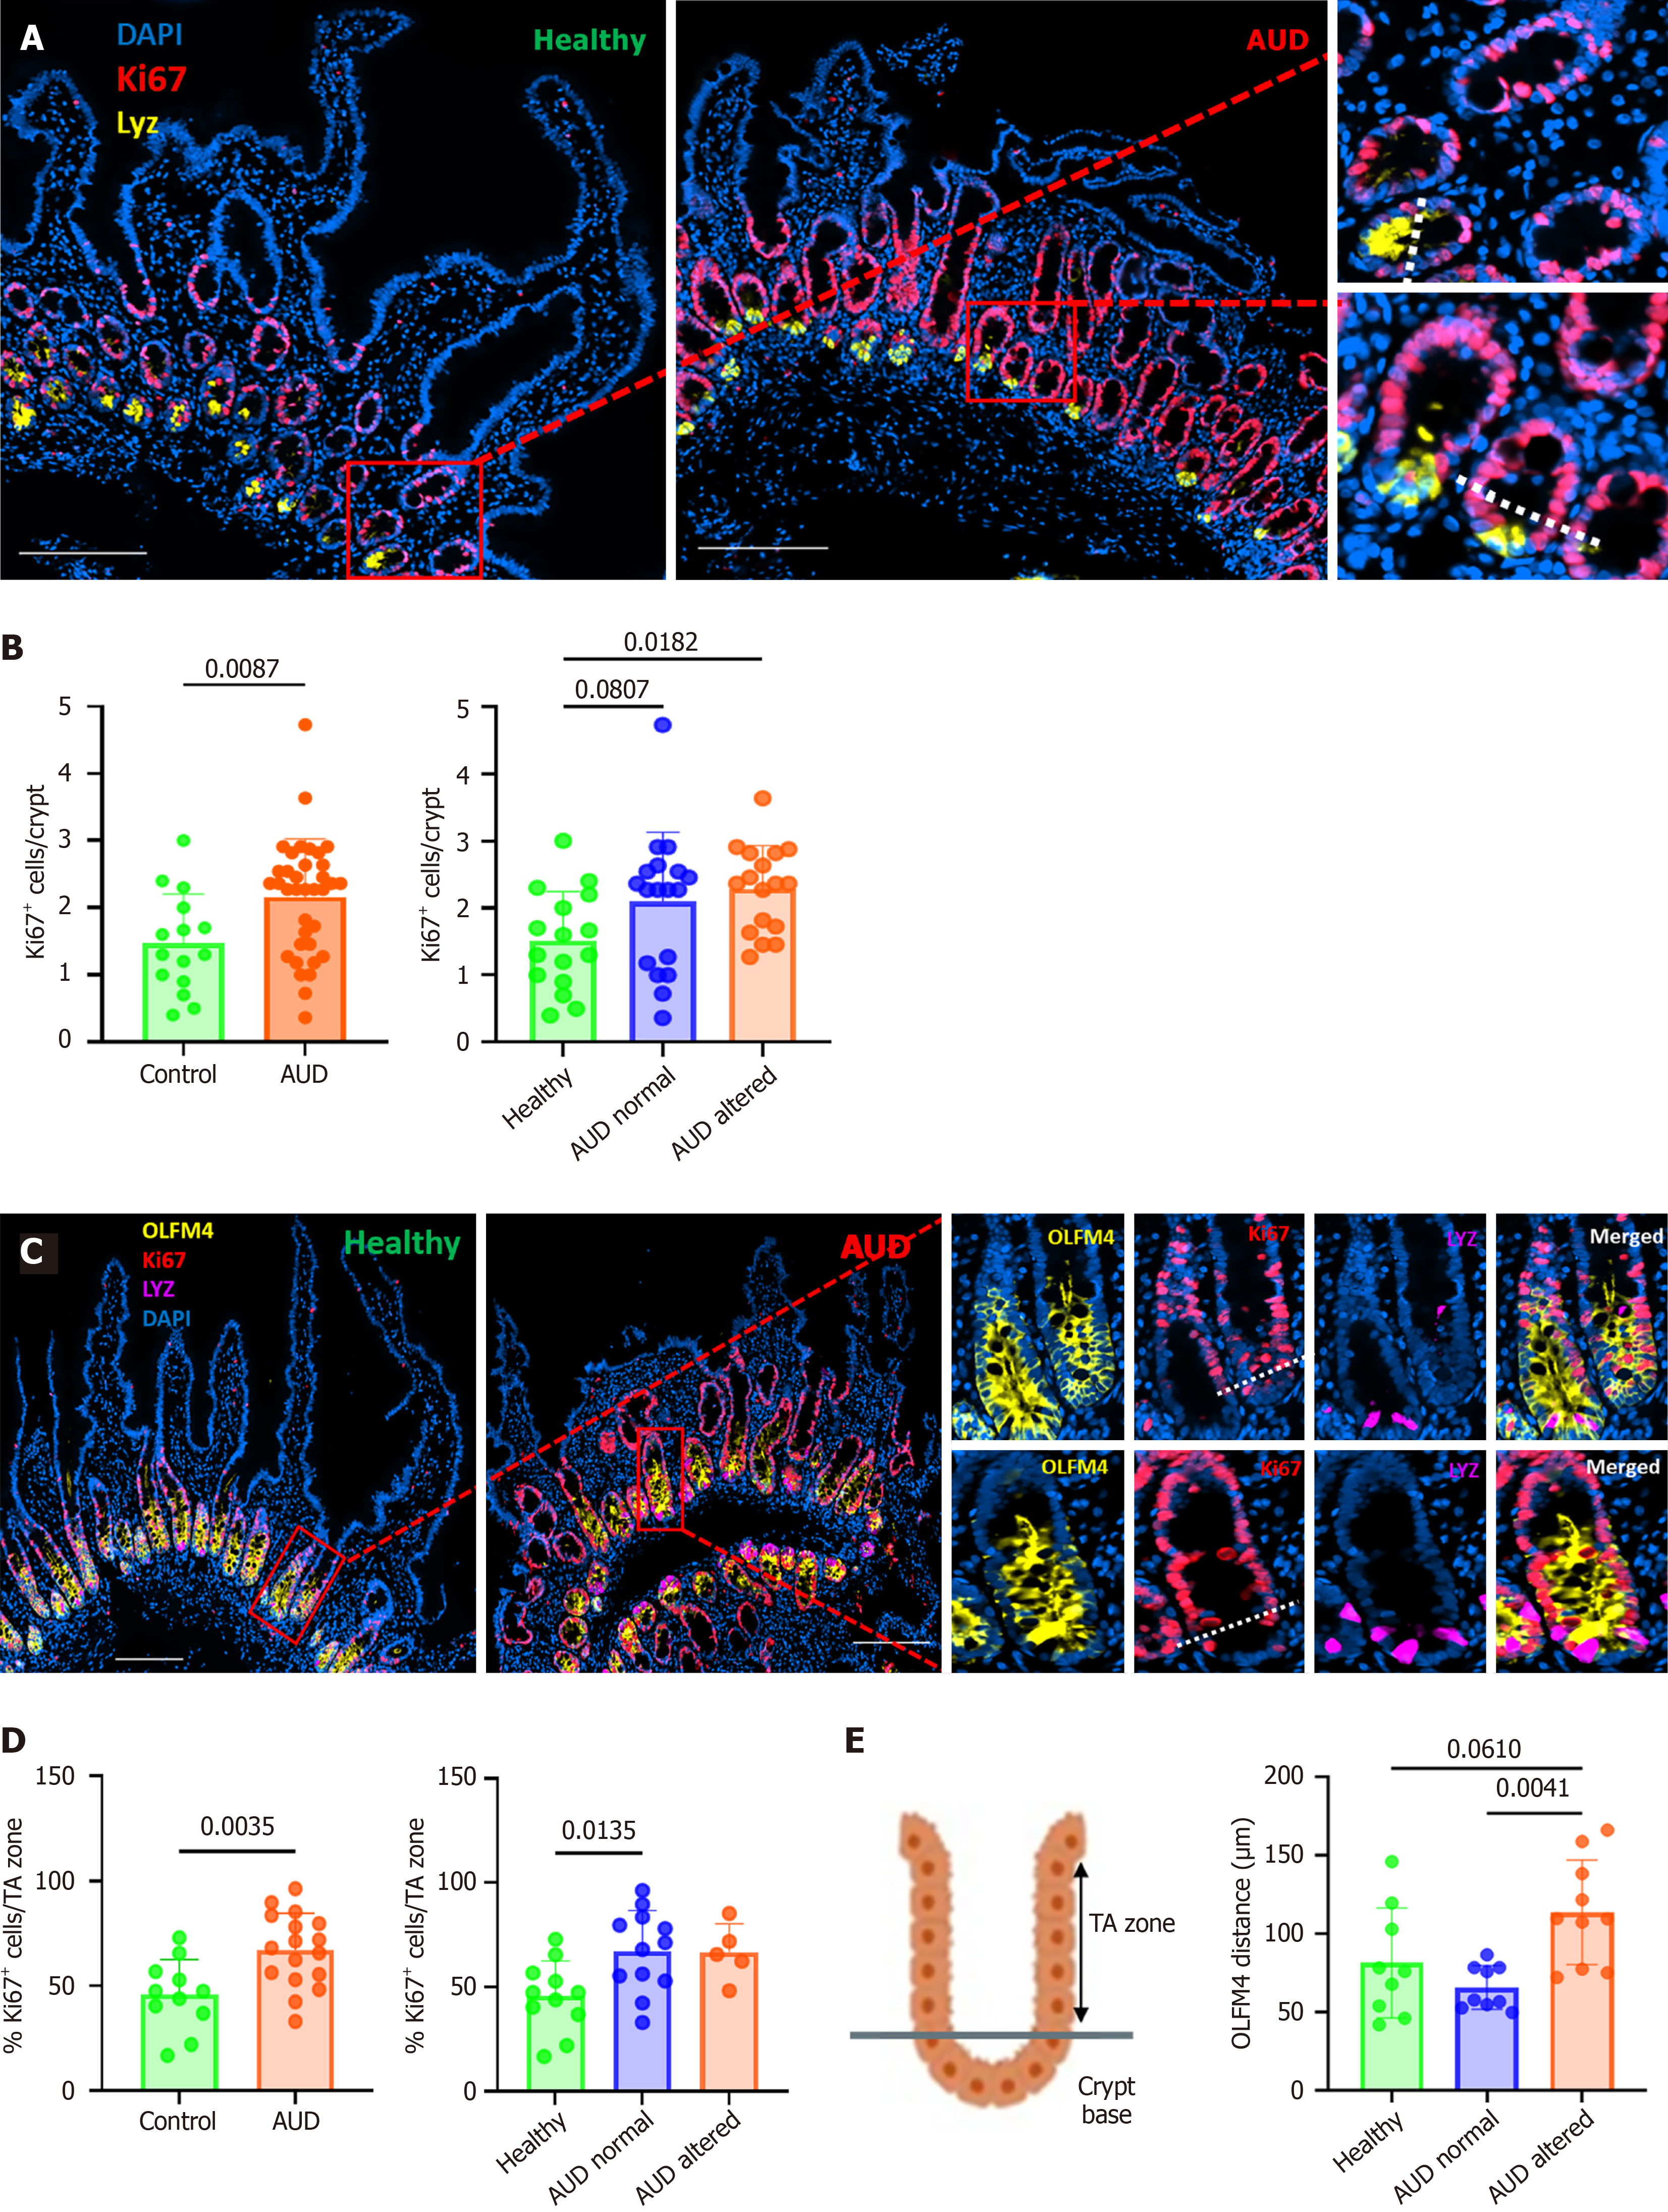
Figure 2 Cell proliferation in the crypt base and the transit amplifying zone.
A: Immunohistofluorescence staining of duodenal biopsies showing Ki67+ proliferating cells (red), lysozyme+ Paneth cells (yellow) to identify the crypt base, and DAPI (blue) for the nuclei; B: Ki67+ cells were counted in 5-10 crypts per patient. Alcohol use disorder (AUD) patients exhibited a significant increase in proliferating cells within the crypt base. However, when split into 2 subgroups, only AUD-altered patients showed consistently higher proliferation within the crypt base. Healthy (n = 16); AUD normal (n = 18); AUD altered (n = 17); C: Multiplex immunofluorescence for OLFM4 (stem and stem-like cells), Ki67 (red), lysozyme (purple), and DAPI (blue). As indicated in the scheme, the transit amplifying (TA) zone begins at the end of the crypt base and extends to the upper limit of Ki67 staining; D: Ki67+ cell numbers in the TA zone were significantly increased in AUD patients, with no significant differences between AUD subgroups. Healthy (n = 11); AUD normal (n = 12); AUD altered (n = 5); E: Quantification of OLFM4+ cell distribution along the crypt axis to assess the spatial extension of stem-like cells. OLFM4+ distance is significantly increased in AUD altered patients in favor of an extension of stem-like cells into the TA zone. Data are presented as mean ± SD. Healthy (n = 9); AUD normal (n = 9); AUD altered (n = 10). AUD: Alcohol use disorder.
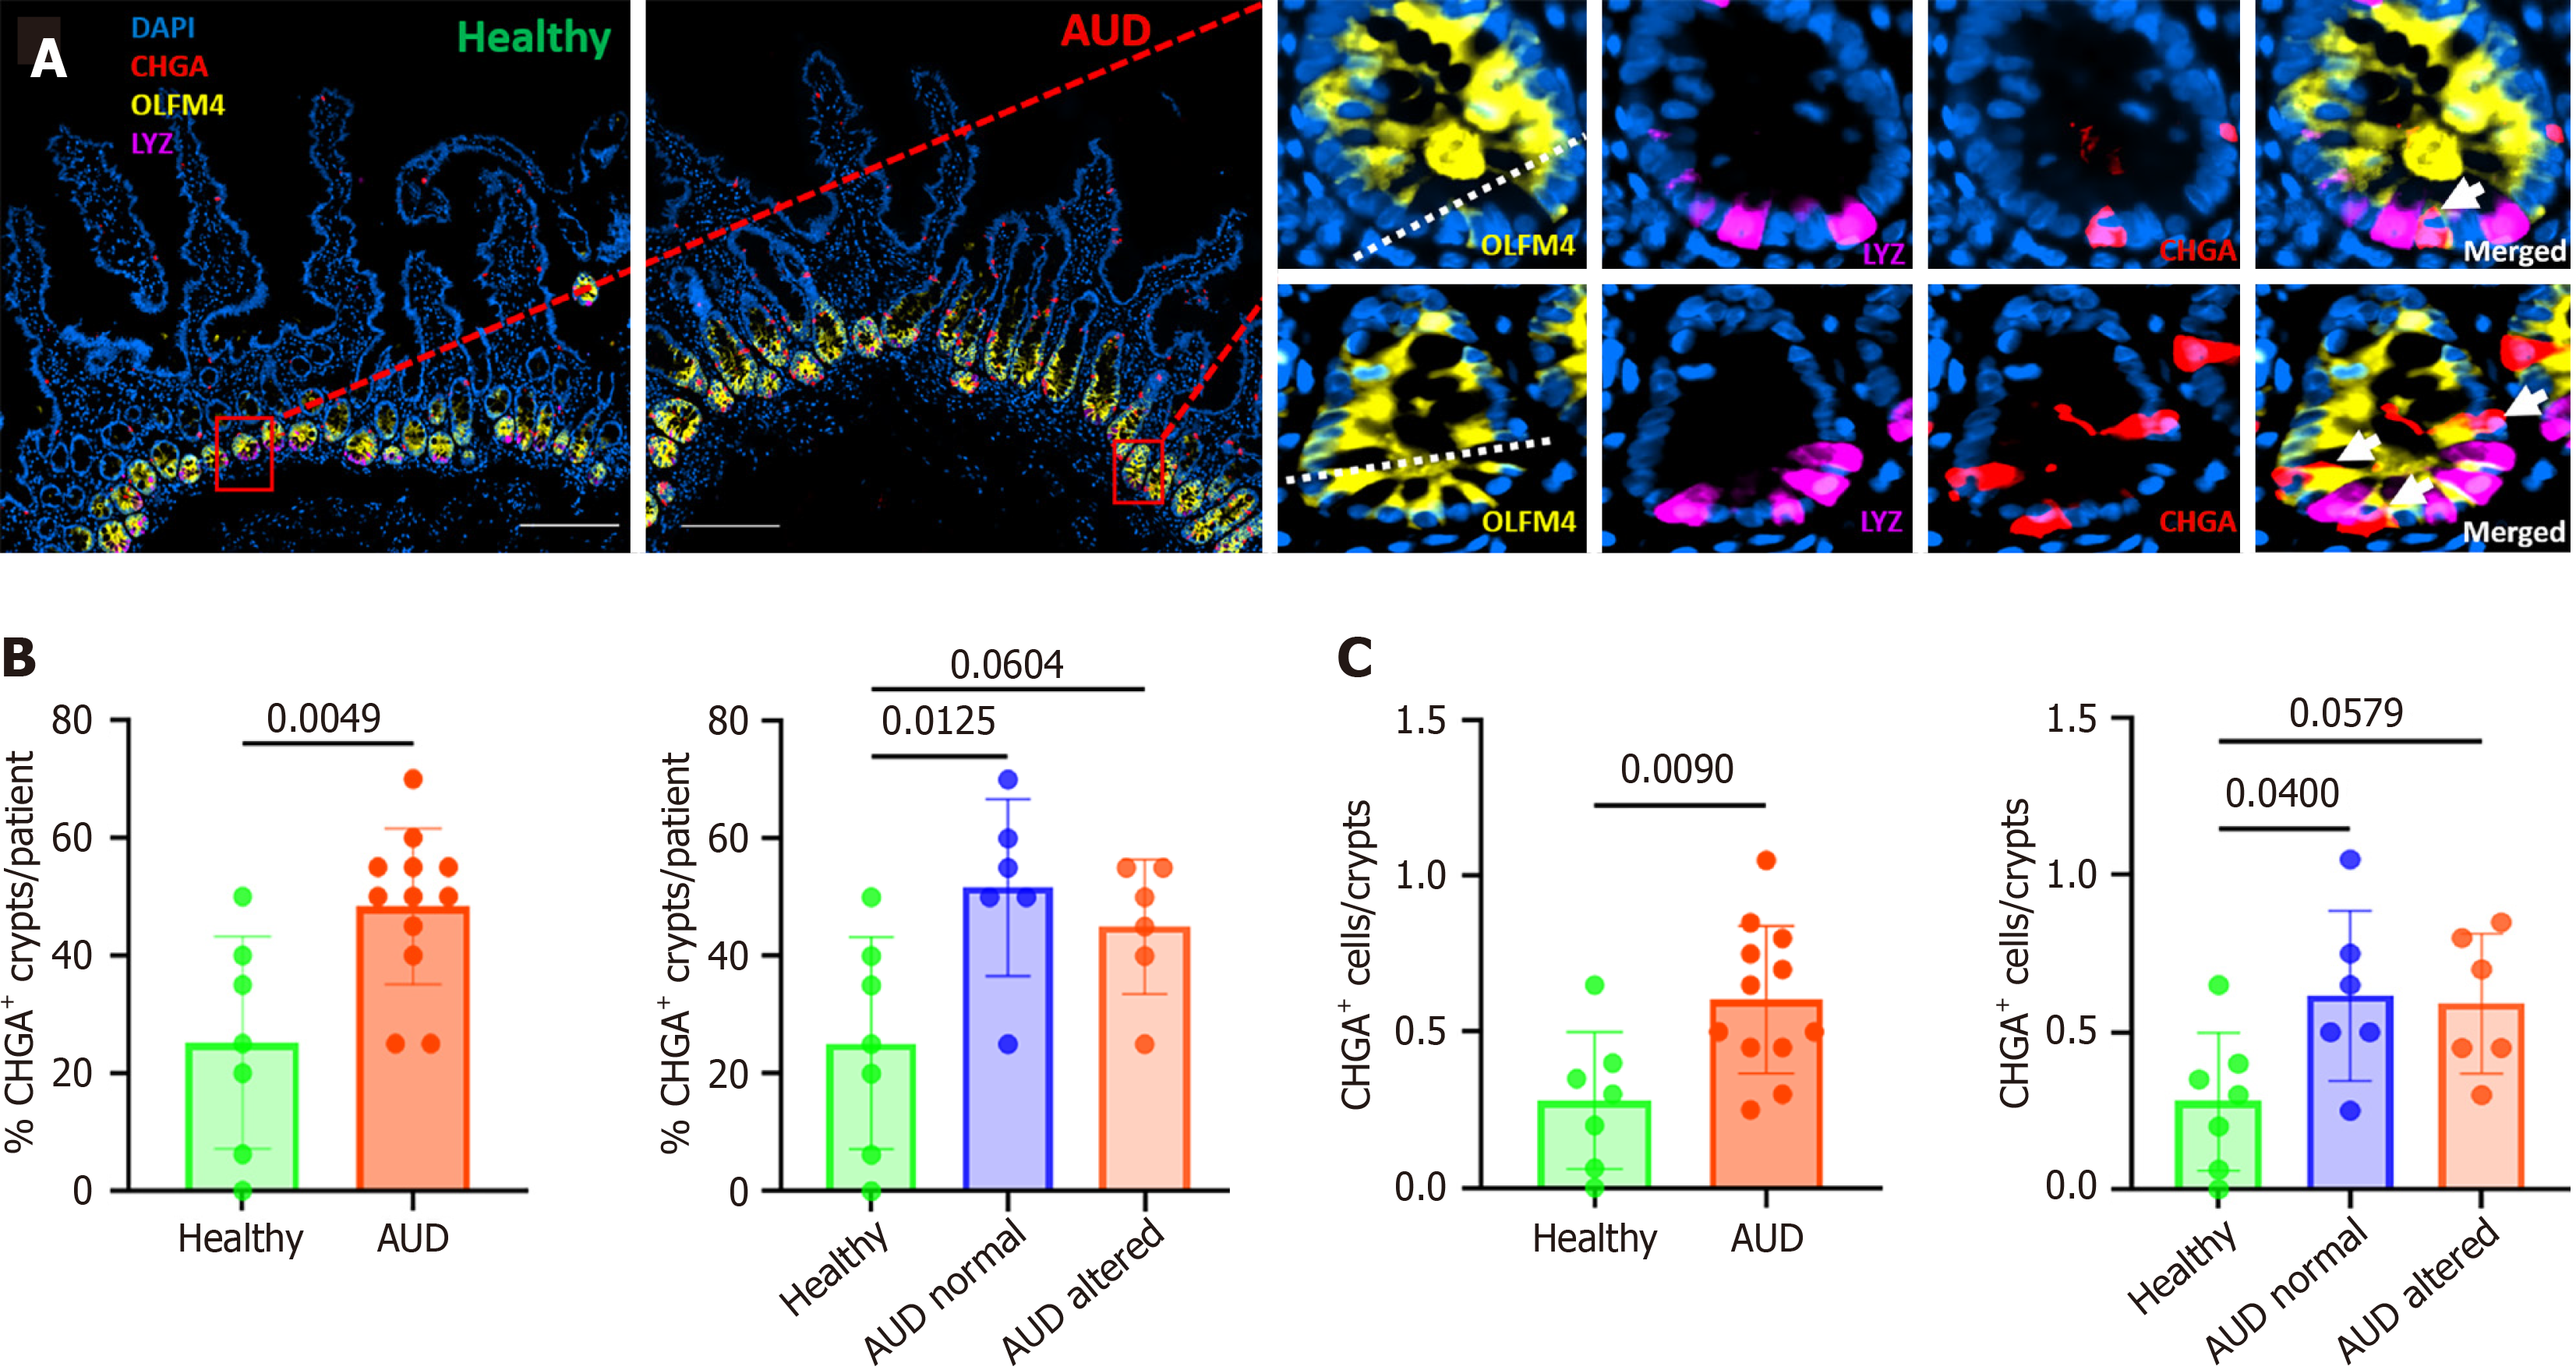
Figure 3 Cell composition of the crypts.
A: Multiplex immunofluorescence of duodenal biopsy from healthy and alcohol use disorder (AUD) patients. OLFM4 (yellow) marks stem and stem-like cells, CHGA (red) labels enteroendocrine cells, lysozyme (purple) identifies Paneth cells, DAPI (blue) marks nuclei; B: Quantification of the number of crypts containing at least one CHGA+ cell. The percentage of CHGA+ crypts was increased in both AUD subgroups compared with healthy controls. For each patient, 5-10 crypts were analyzed; C: Quantification of CHGA+ in each crypt. The number of CHGA+ cells per crypt was significantly higher in both AUD normal and AUD altered patients. Data are presented as mean ± SD. Each dot on the bar graphs represents one patient. Scale bar (200 μm). Healthy (n = 6); AUD normal (n = 6); AUD altered (n = 6). AUD: Alcohol use disorder.
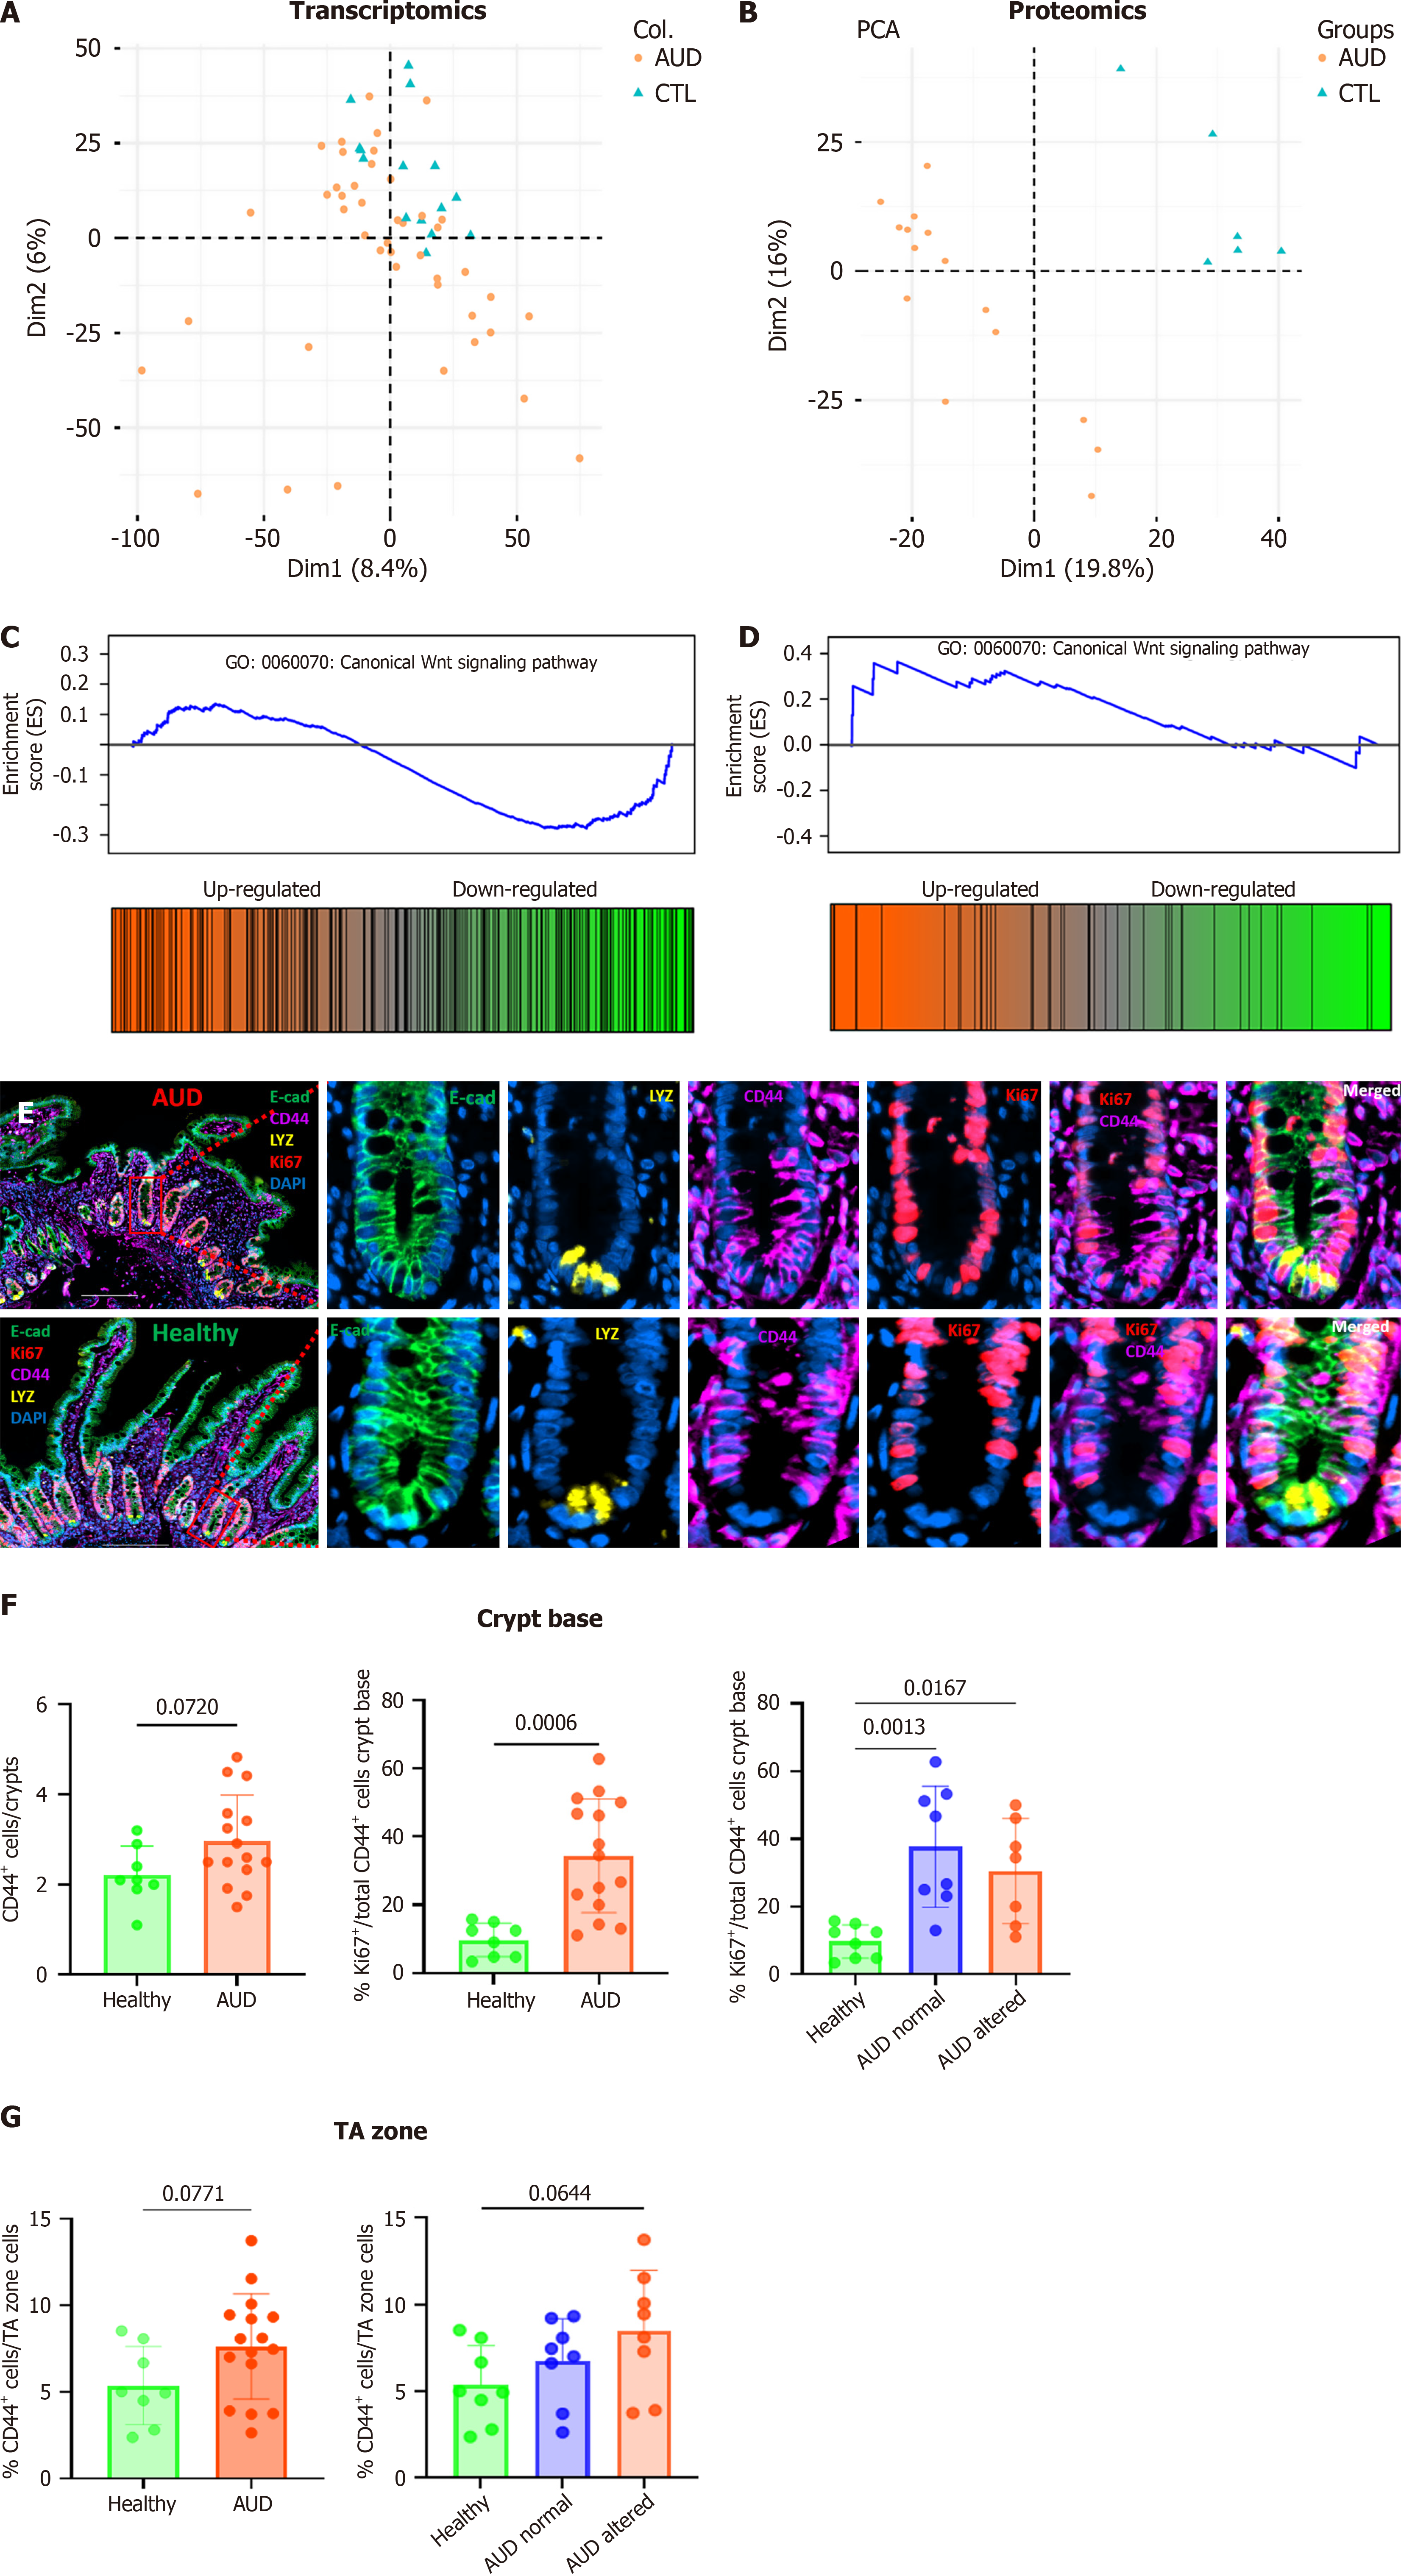
Figure 4 Dysregulation of the Wnt pathway in alcohol use disorder through CD44.
A-D: Principal component analysis of bulk transcriptomic and proteomic data. At transcriptional level, a subset of alcohol use disorder (AUD) patients clusters closely with healthy subjects (A), whereas proteomic data (B) reveal a clear separation between both groups. Gene ontology dysregulation of the canonical Wnt signaling pathway on the transcriptomic (C) and protein (D) level. Transcriptomics, controls/healthy (n = 15); AUD (n = 43). Proteomics, controls/healthy (n = 7); AUD (n = 15); E: Multiplex immunofluorescence staining of duodenal biopsies using E-cadherin (green) for epithelium, Ki67 (red) for proliferating cells, CD44 (purple) as a Wnt/β-catenin target gene, lysozyme (yellow) for Paneth cells, and DAPI (blue) for nuclei; F: Quantification of the number of CD44+ cells at the crypt base. Overall CD44 expression increased in AUD patients, with proliferating, CD44+/Ki67+ double-positive cells, being significantly elevated in both AUD subgroups; G: Quantification of CD44+ cells in the transit amplifying zone. Only a very low number of cells (less than 10%) stained positive for CD44 with numbers tending to be slightly higher in AUD patients with an altered morphology (AUD altered). Data are presented as mean ± SD. Scale bar (200 μm). Healthy (n = 8); AUD normal (n = 8); AUD altered (n = 7). AUD: Alcohol use disorder.
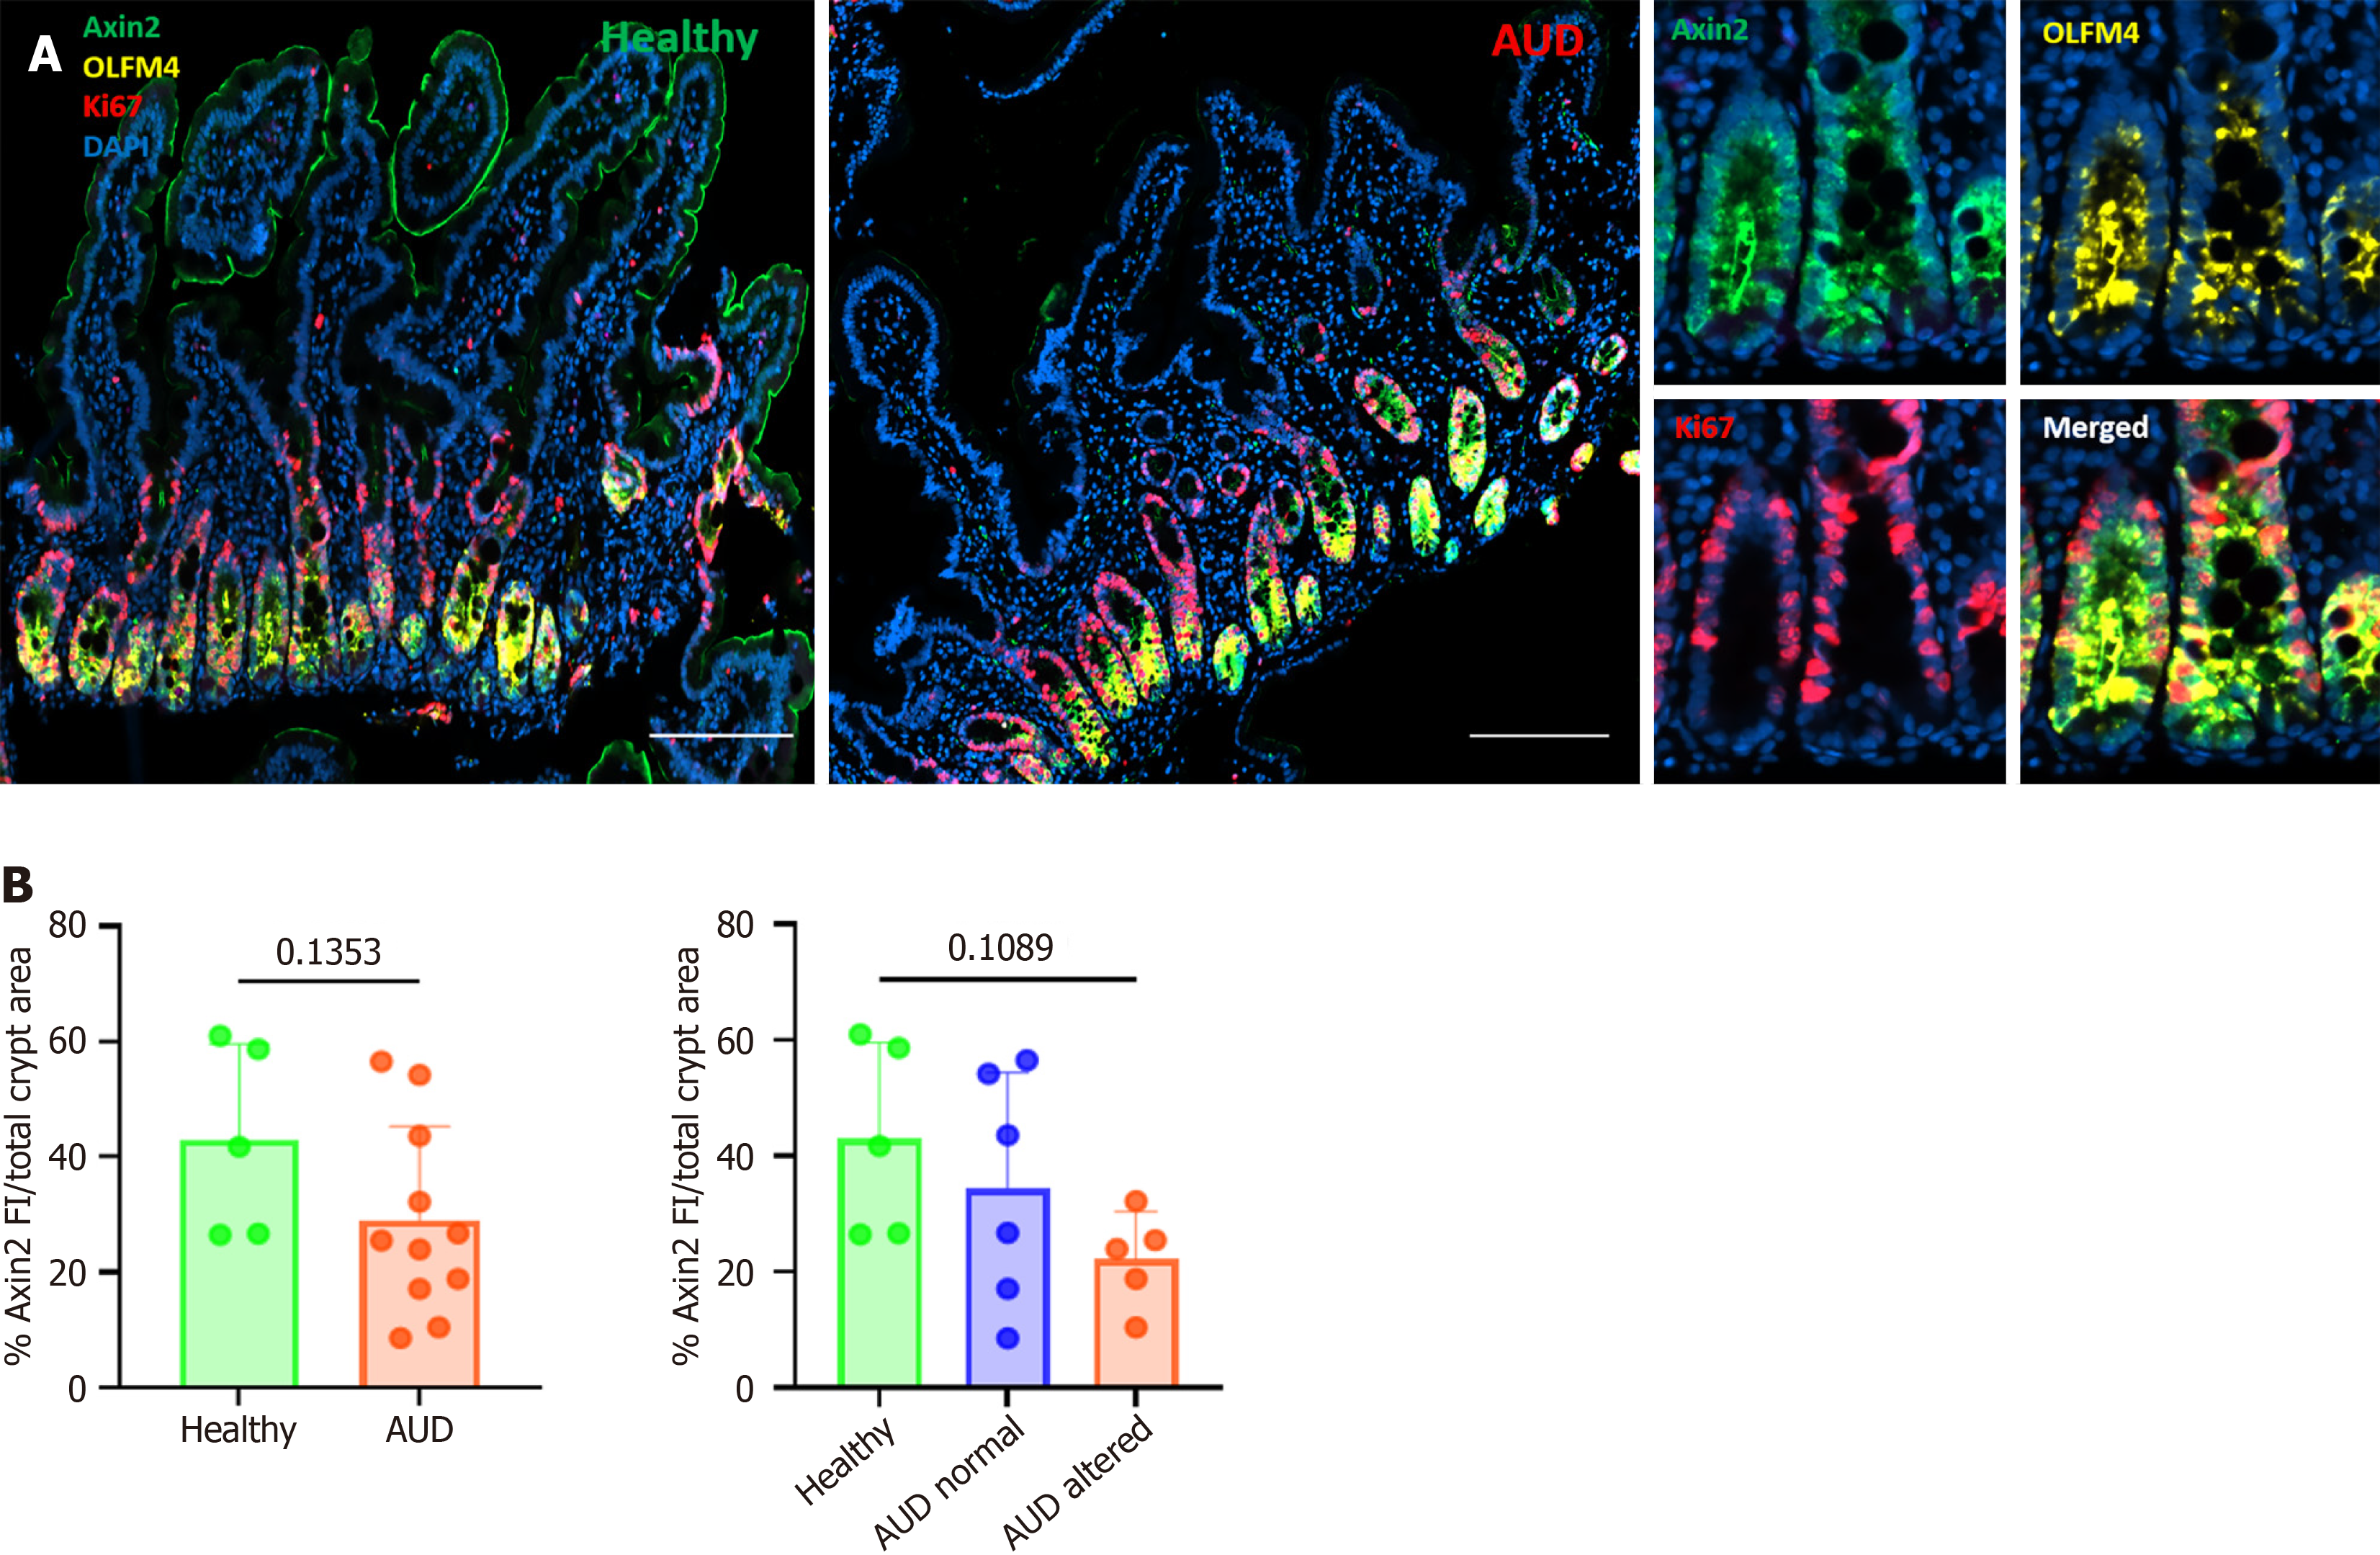
Figure 5 Wnt target gene Axin2 is not implicated in hyperproliferation in alcohol use disorder.
A: Multiplex immunofluorescence staining of duodenal biopsies showing Axin2 (green), a Wnt target gene; Ki67 (red) for proliferating cells; OLFM4 (yellow) for stem and stem-like cells; and DAPI (blue) for nuclei; B: Quantification of Axin2 fluorescence intensity, normalized to the total crypt area and expressed as a percentage showing a non-significant trend towards decreased Axin2 fluorescence intensity in particularly in alcohol use disorder (AUD)-altered patients. Data are presented as mean ± SD. Scale bar (200 μm). Healthy (n = 5); AUD normal (n = 6); AUD altered (n = 5). AUD: Alcohol use disorder.
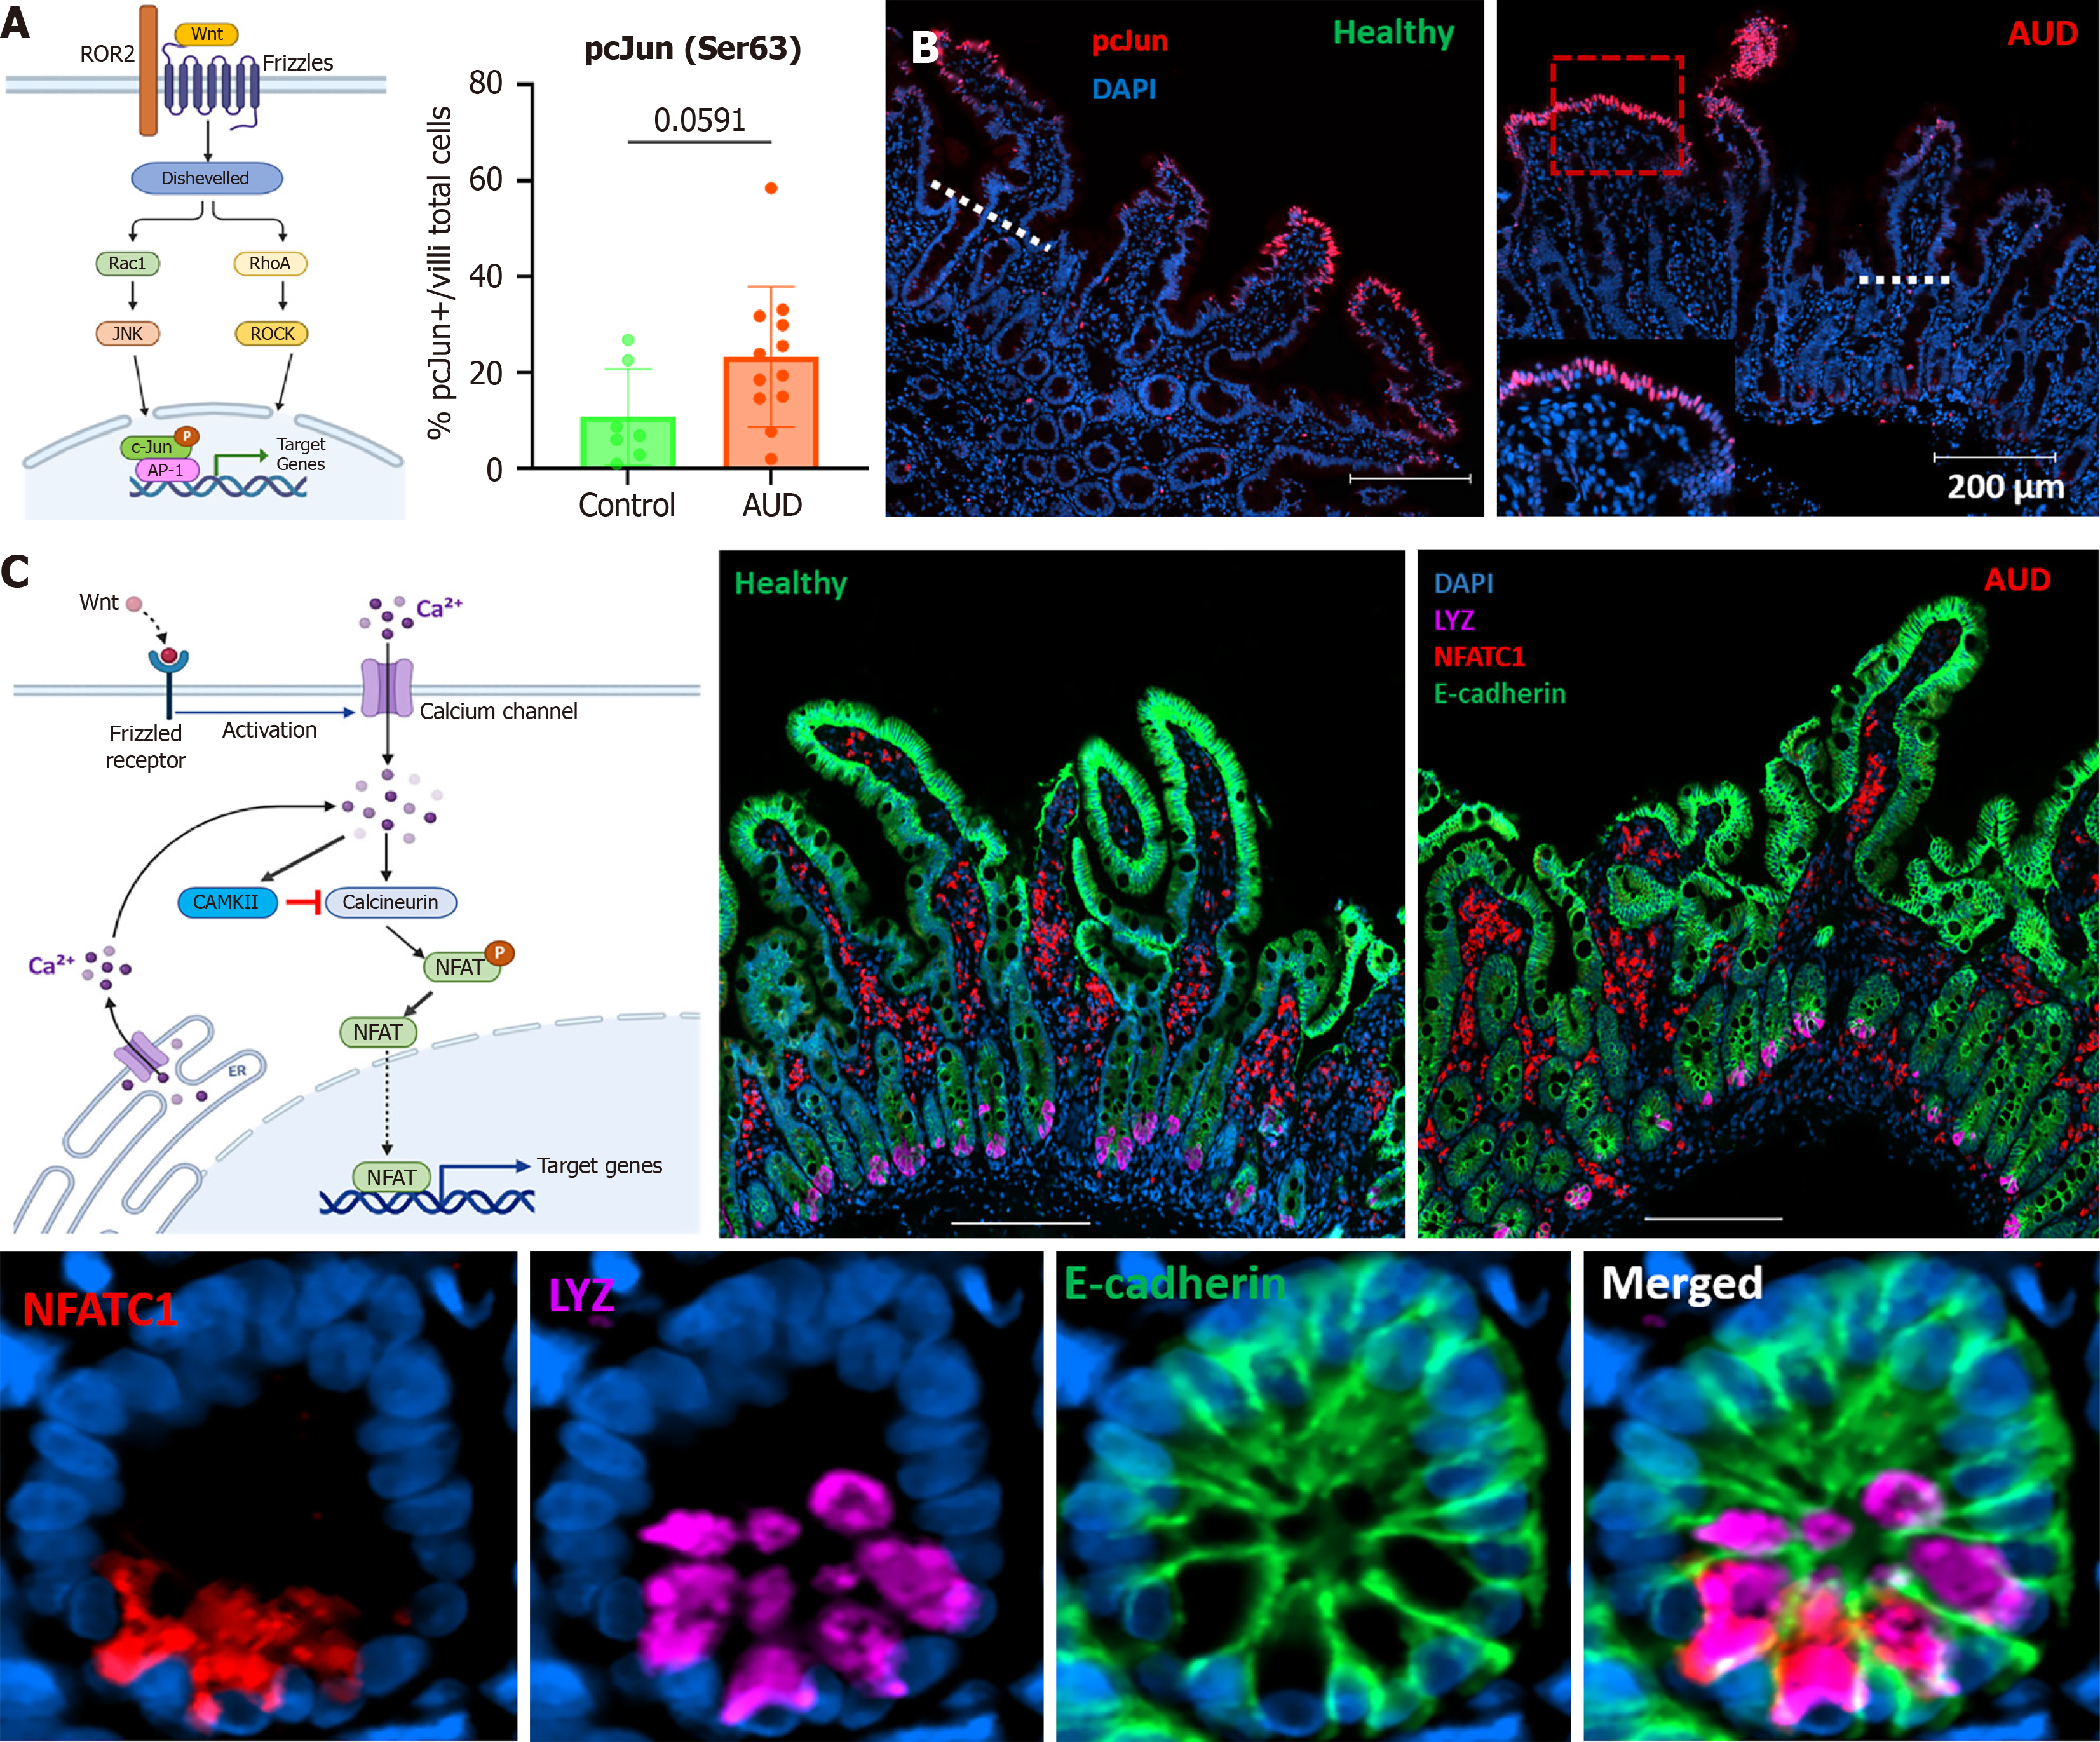
Figure 6 Wnt non-canonical pathways are not involved in hyperproliferation of the crypts in alcohol use disorder.
A: Schematic representation of the non-canonical Wnt/PCP pathway. Binding of Wnt ligands to frizzled receptors leads to downstream c-Jun phosphorylation and gene transactivation; B: Immunohistofluorescence showing phospho-c-Jun (Ser63) (red) localized at the villus tip. Quantification of pc-Jun (Ser63)+ cells normalized to total villus cells indicating increased phospho c-Jun expression in alcohol use disorder patients; C: Schematic of the Wnt/Ca2+ pathway, in which activation triggers NFAT dephosphorylation and nuclear translocation. Immunostaining of NFATC1+ (red) shows co-localization with Paneth cells (purple) stained by lysozyme within the epithelium marked by E-cadherin (green). Scale bar (200 μm). Healthy (n = 5); alcohol use disorder (n = 12). AUD: Alcohol use disorder; LYZ: Lysozyme.
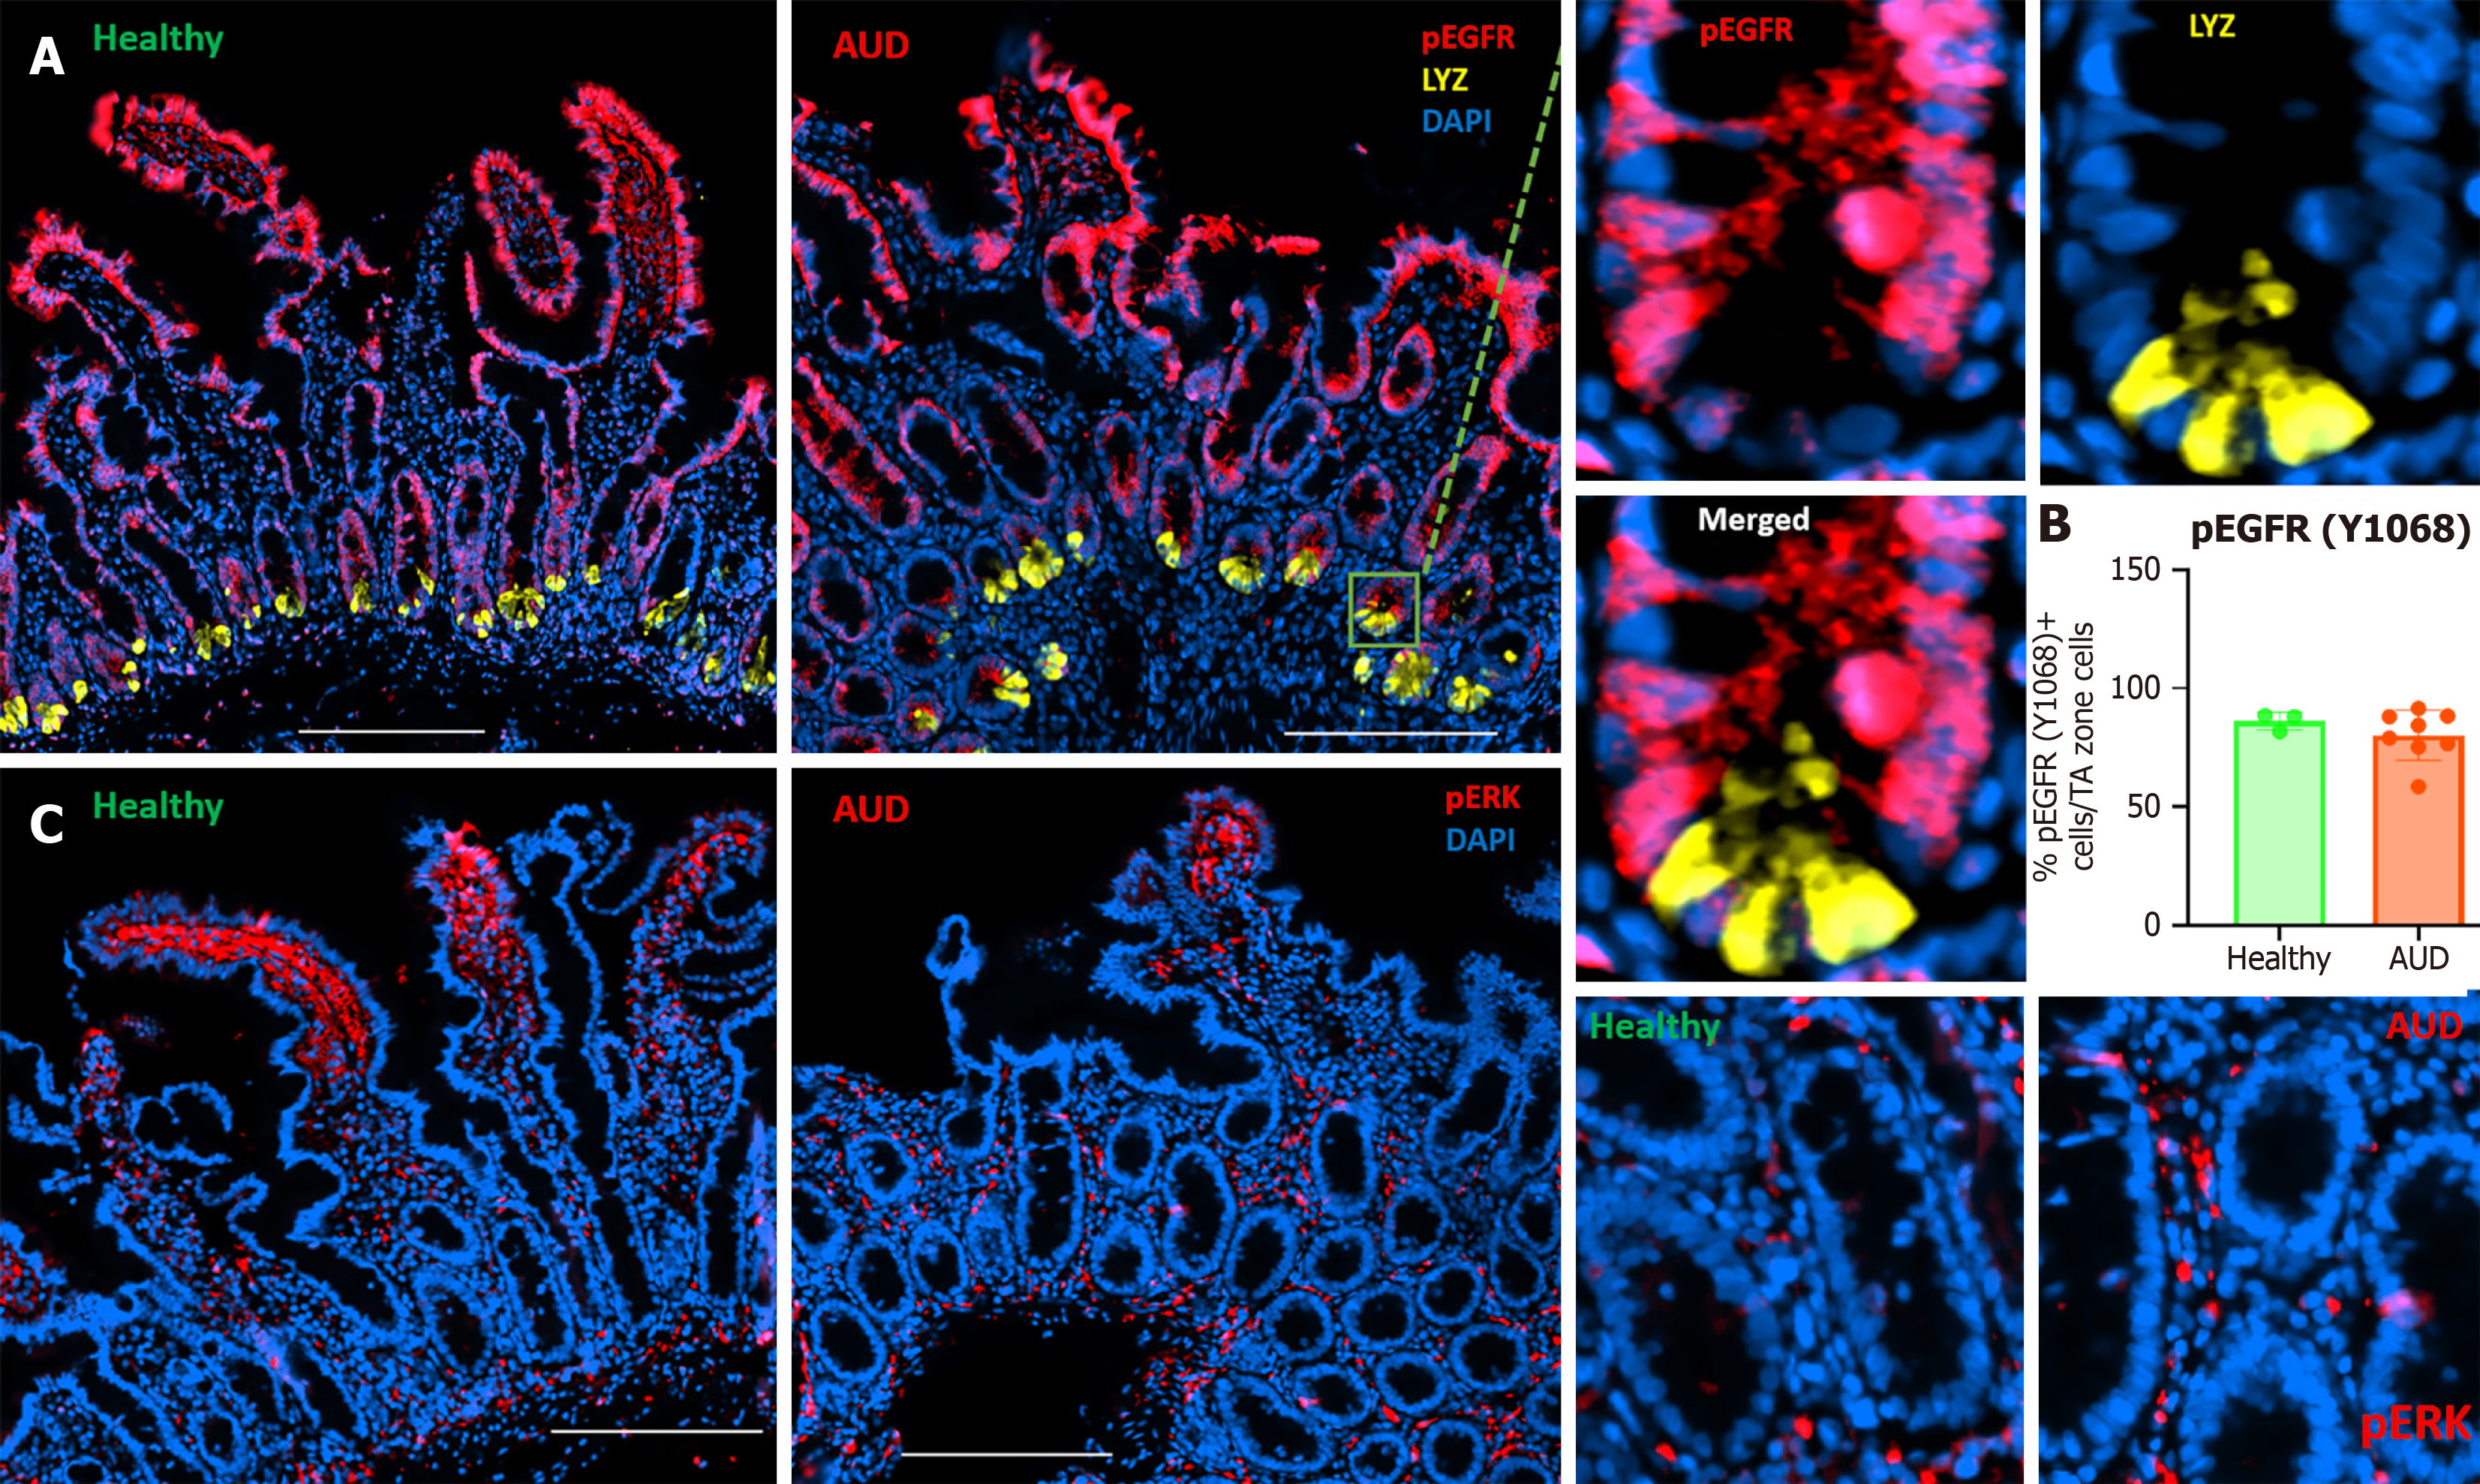
Figure 7 Epidermal growth factor receptor-mitogen-activated protein kinase signaling in duodenal biopsies.
A: Immuhistofluorescence staining of pEGFR (red) which located in the crypt and villus in alcohol use disorder (AUD) and healthy subjects; B: Quantification of pEGFR+ cells in the transit-amplifying zone, normalized to the total number of transit-amplifying-zone cells, shows no significant difference between AUD patients and healthy subjects; C: Immunofluorescence staining of pERK, a downstream effector of the epidermal growth factor receptor-mitogen-activated protein kinase signaling pathway, reveals predominant expression in the lamina propria with only a very few pERK+ cells detected within the crypts. Scale bar (200 μm). Healthy (n = 3); AUD (n = 8). AUD: Alcohol use disorder; LYZ: Lysozyme; TA: Transit-amplifying.
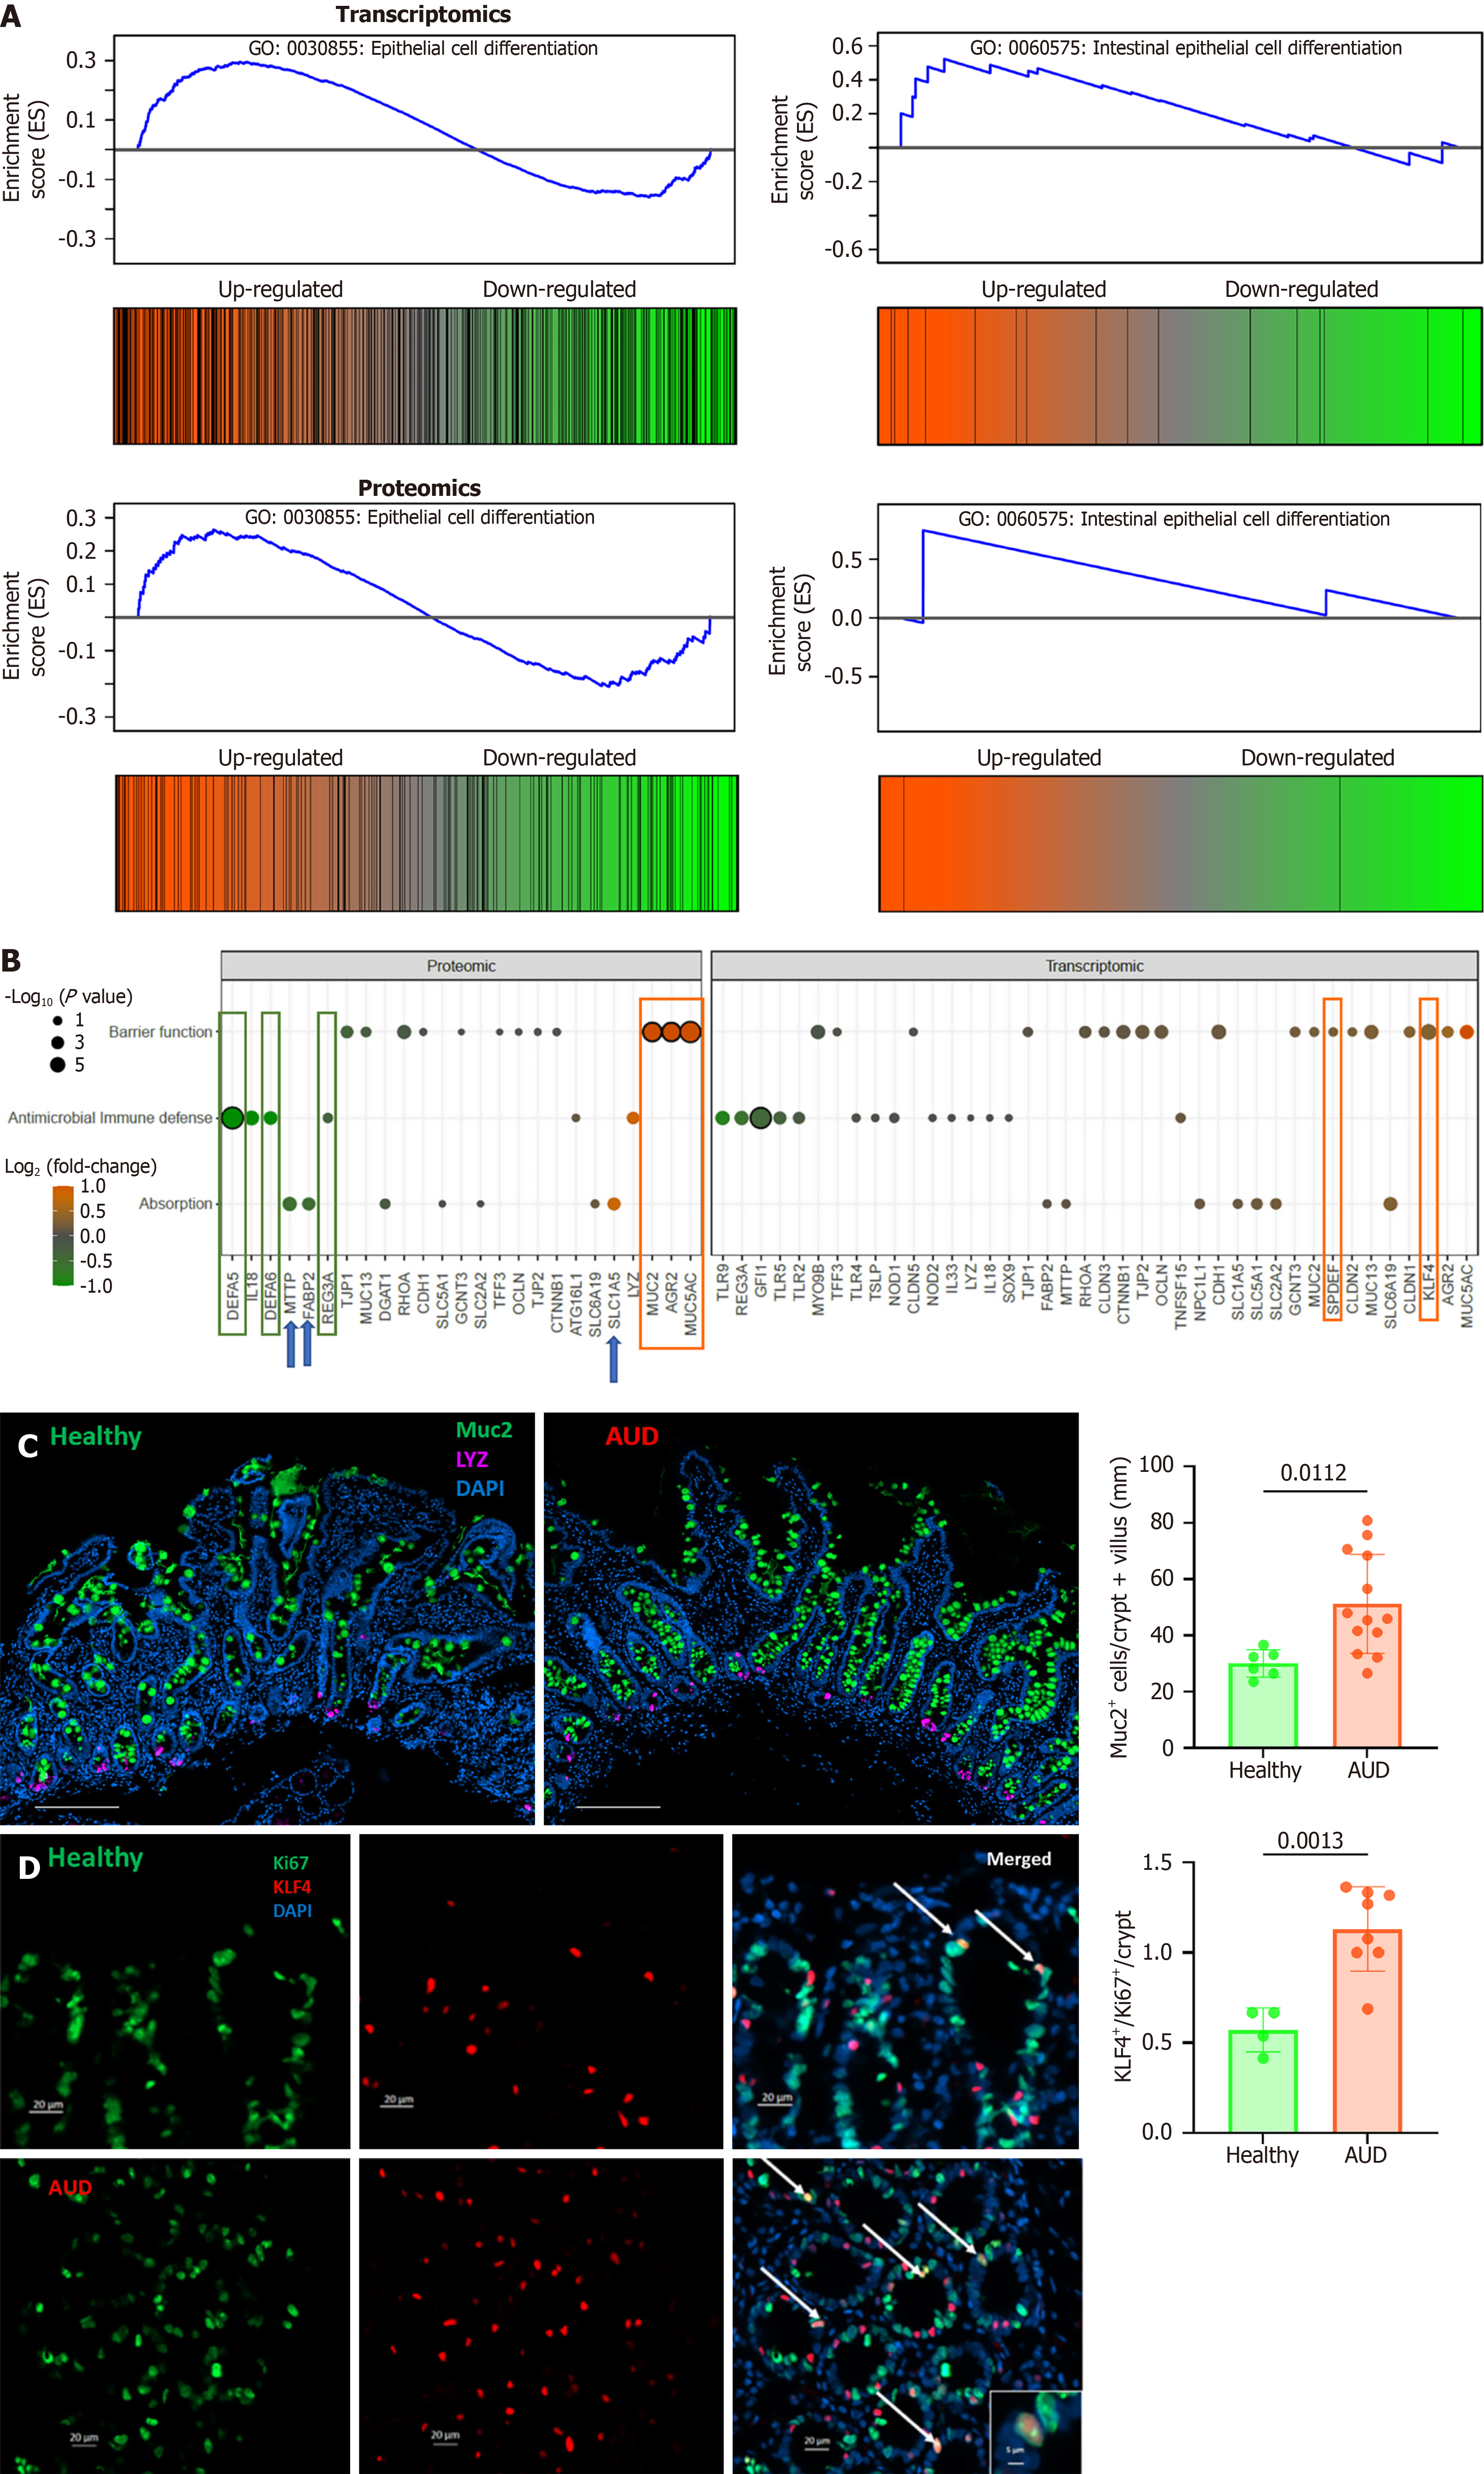
Figure 8 Transcriptomics and proteomics of factors associated with epithelium differentiation and function.
A: Gene Ontology enrichment analysis showing dysregulation of pathways related to epithelial differentiation and intestinal epithelial cell differentiation in alcohol use disorder (AUD) patients; B: Proteomic data show that AUD patients exhibited significantly increased levels of the mucins MUC2 and MUC5AC, as well as AGR2, which supports MUC2 biosynthesis (orange boxes). Proteins involved in antimicrobial immune defense and barrier protection were impaired, with decreased production of Paneth cell-derived defensins DEFA5, DEFA6, and REG3A (green boxes). Dysregulation of absorption was reflected by reduced MTTP and FABP2 protein levels and increased expression of the amino acid transporter SLC1A5 (blue arrows). Finally, transcriptomics also reveals upregulation of genes implicated in terminal differentiation of goblet cells, including SPDEF and Kruppel-like factor 4 (KLF4) (red boxes). Transcriptomics, healthy (n = 15); AUD (n = 43). Proteomics, healthy (n = 7); AUD (n = 15); C: Immunofluorescence staining showing MUC2+ goblet cells (green), lysozyme+ Paneth cells (purple), and DAPI (blue). Quantification of MUC2+ cells reveals an increased number of goblet cells in both crypts and villi of AUD patients. Healthy (n = 6); AUD (n = 13); D: Immunofluorescence staining and quantification of Ki67 (green) for proliferating cells and KLF4 (red), a transcription factor involved in terminal differentiation of goblet cells. DAPI marks nuclei (blue). A significant increased number of Ki67+/KLF4+ double positive cells per crypt in AUD indicating a preferential commitment of cells towards the secretory goblet cells lineage. Scale bar (200 μm). Healthy (n = 4); AUD (n = 8). AUD: Alcohol use disorder; KLF4: Kruppel-like factor 4.
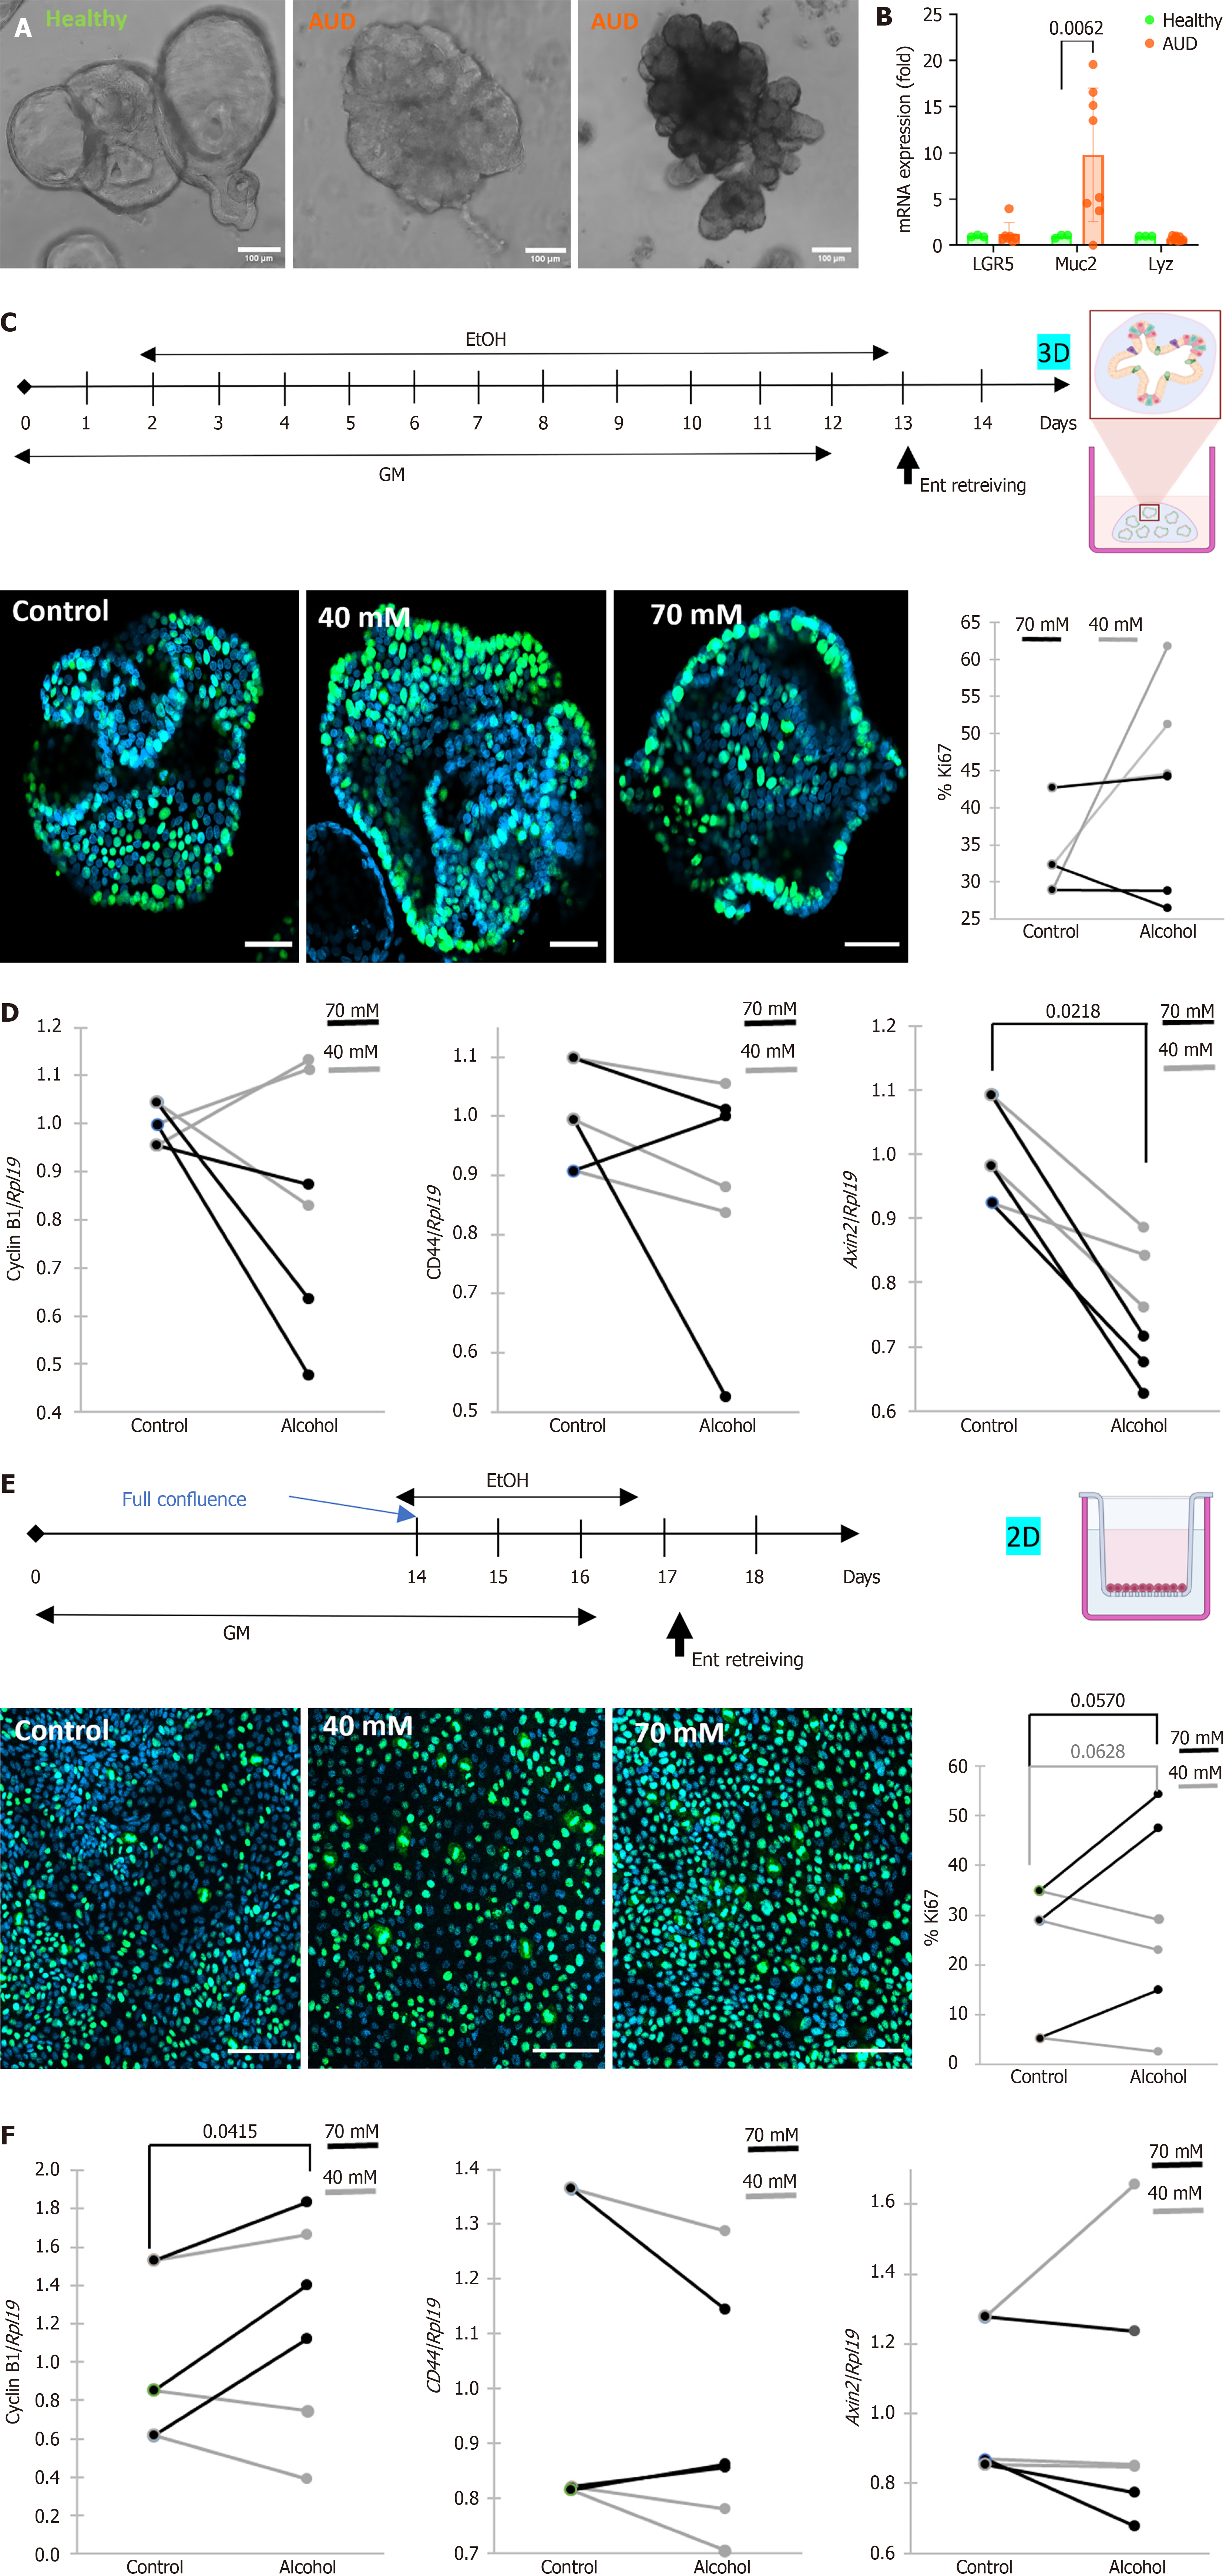
Figure 9 Generation and alcohol stimulation of intestinal enteroids from healthy subjects and alcohol use disorder patients.
A: Alcohol use disorder (AUD)-derived enteroids retained the morphological impairments observed in their host. A subset of AUD enteroids lacked budding structures, whereas another subset showed excessive budding. Images were acquired by optical microscopy at 10 × magnification; B: Gene expression analysis showing unchanged levels of LGR5 (stem cells) and lysozyme (Paneth cells) in AUD-derived enteroids, with a significant upregulation of MUC2, indicating increased goblet cell differentiation. Healthy (n = 3); AUD (n = 8); C: Experimental design of three-dimensional enteroids cultured in Matrigel and treated with 40 mmol/L or 70 mmol/L ethanol from day 2 after passage until full differentiation at day 13. Ethanol-containing medium was refreshed daily; D: Confocal microscopy of fixed and stained three-dimensional enteroids shows no significant differences in Ki67+ proliferating cells (green) across ethanol treatments (black: 70 mmol/L; gray: 40 mmol/L) as well as in the expression of cyclinB1 and Wnt target genes CD44 and Axin2; E: Experimental design of two-dimensional enteroids treated for three days after full monolayer confluence two-dimensional enteroids exposed to 70 mmol/L ethanol exhibited significantly increased proliferation; F: Further supported by upregulation of cyclin B1 mRNA. Expression of Wnt target genes (CD44, Axin2) was not changed upon ethanol exposure. Scale bar (50 μm). Healthy (n = 3). AUD: Alcohol use disorder; 3D: Three-dimensional; 2D: Two-dimensional.
- Citation: Toulehohoun AG, Ambroise J, Illiyas B, Maccioni L, Lupianez J, Manco R, Clerbaux LA, Bouzin C, Schnabl B, Stärkel P. Impairment of the intestinal epithelium barrier through alteration of proliferation and differentiation balance in alcohol use disorder. World J Gastroenterol 2026; 32(28): 118458
- URL: https://www.wjgnet.com/1007-9327/full/v32/i28/118458.htm
- DOI: https://dx.doi.org/10.3748/wjg.118458