
















Copyright: ©Author(s) 2026.
World J Gastroenterol. Jul 7, 2026; 32(25): 119588
Published online Jul 7, 2026. doi: 10.3748/wjg.119588
Published online Jul 7, 2026. doi: 10.3748/wjg.119588
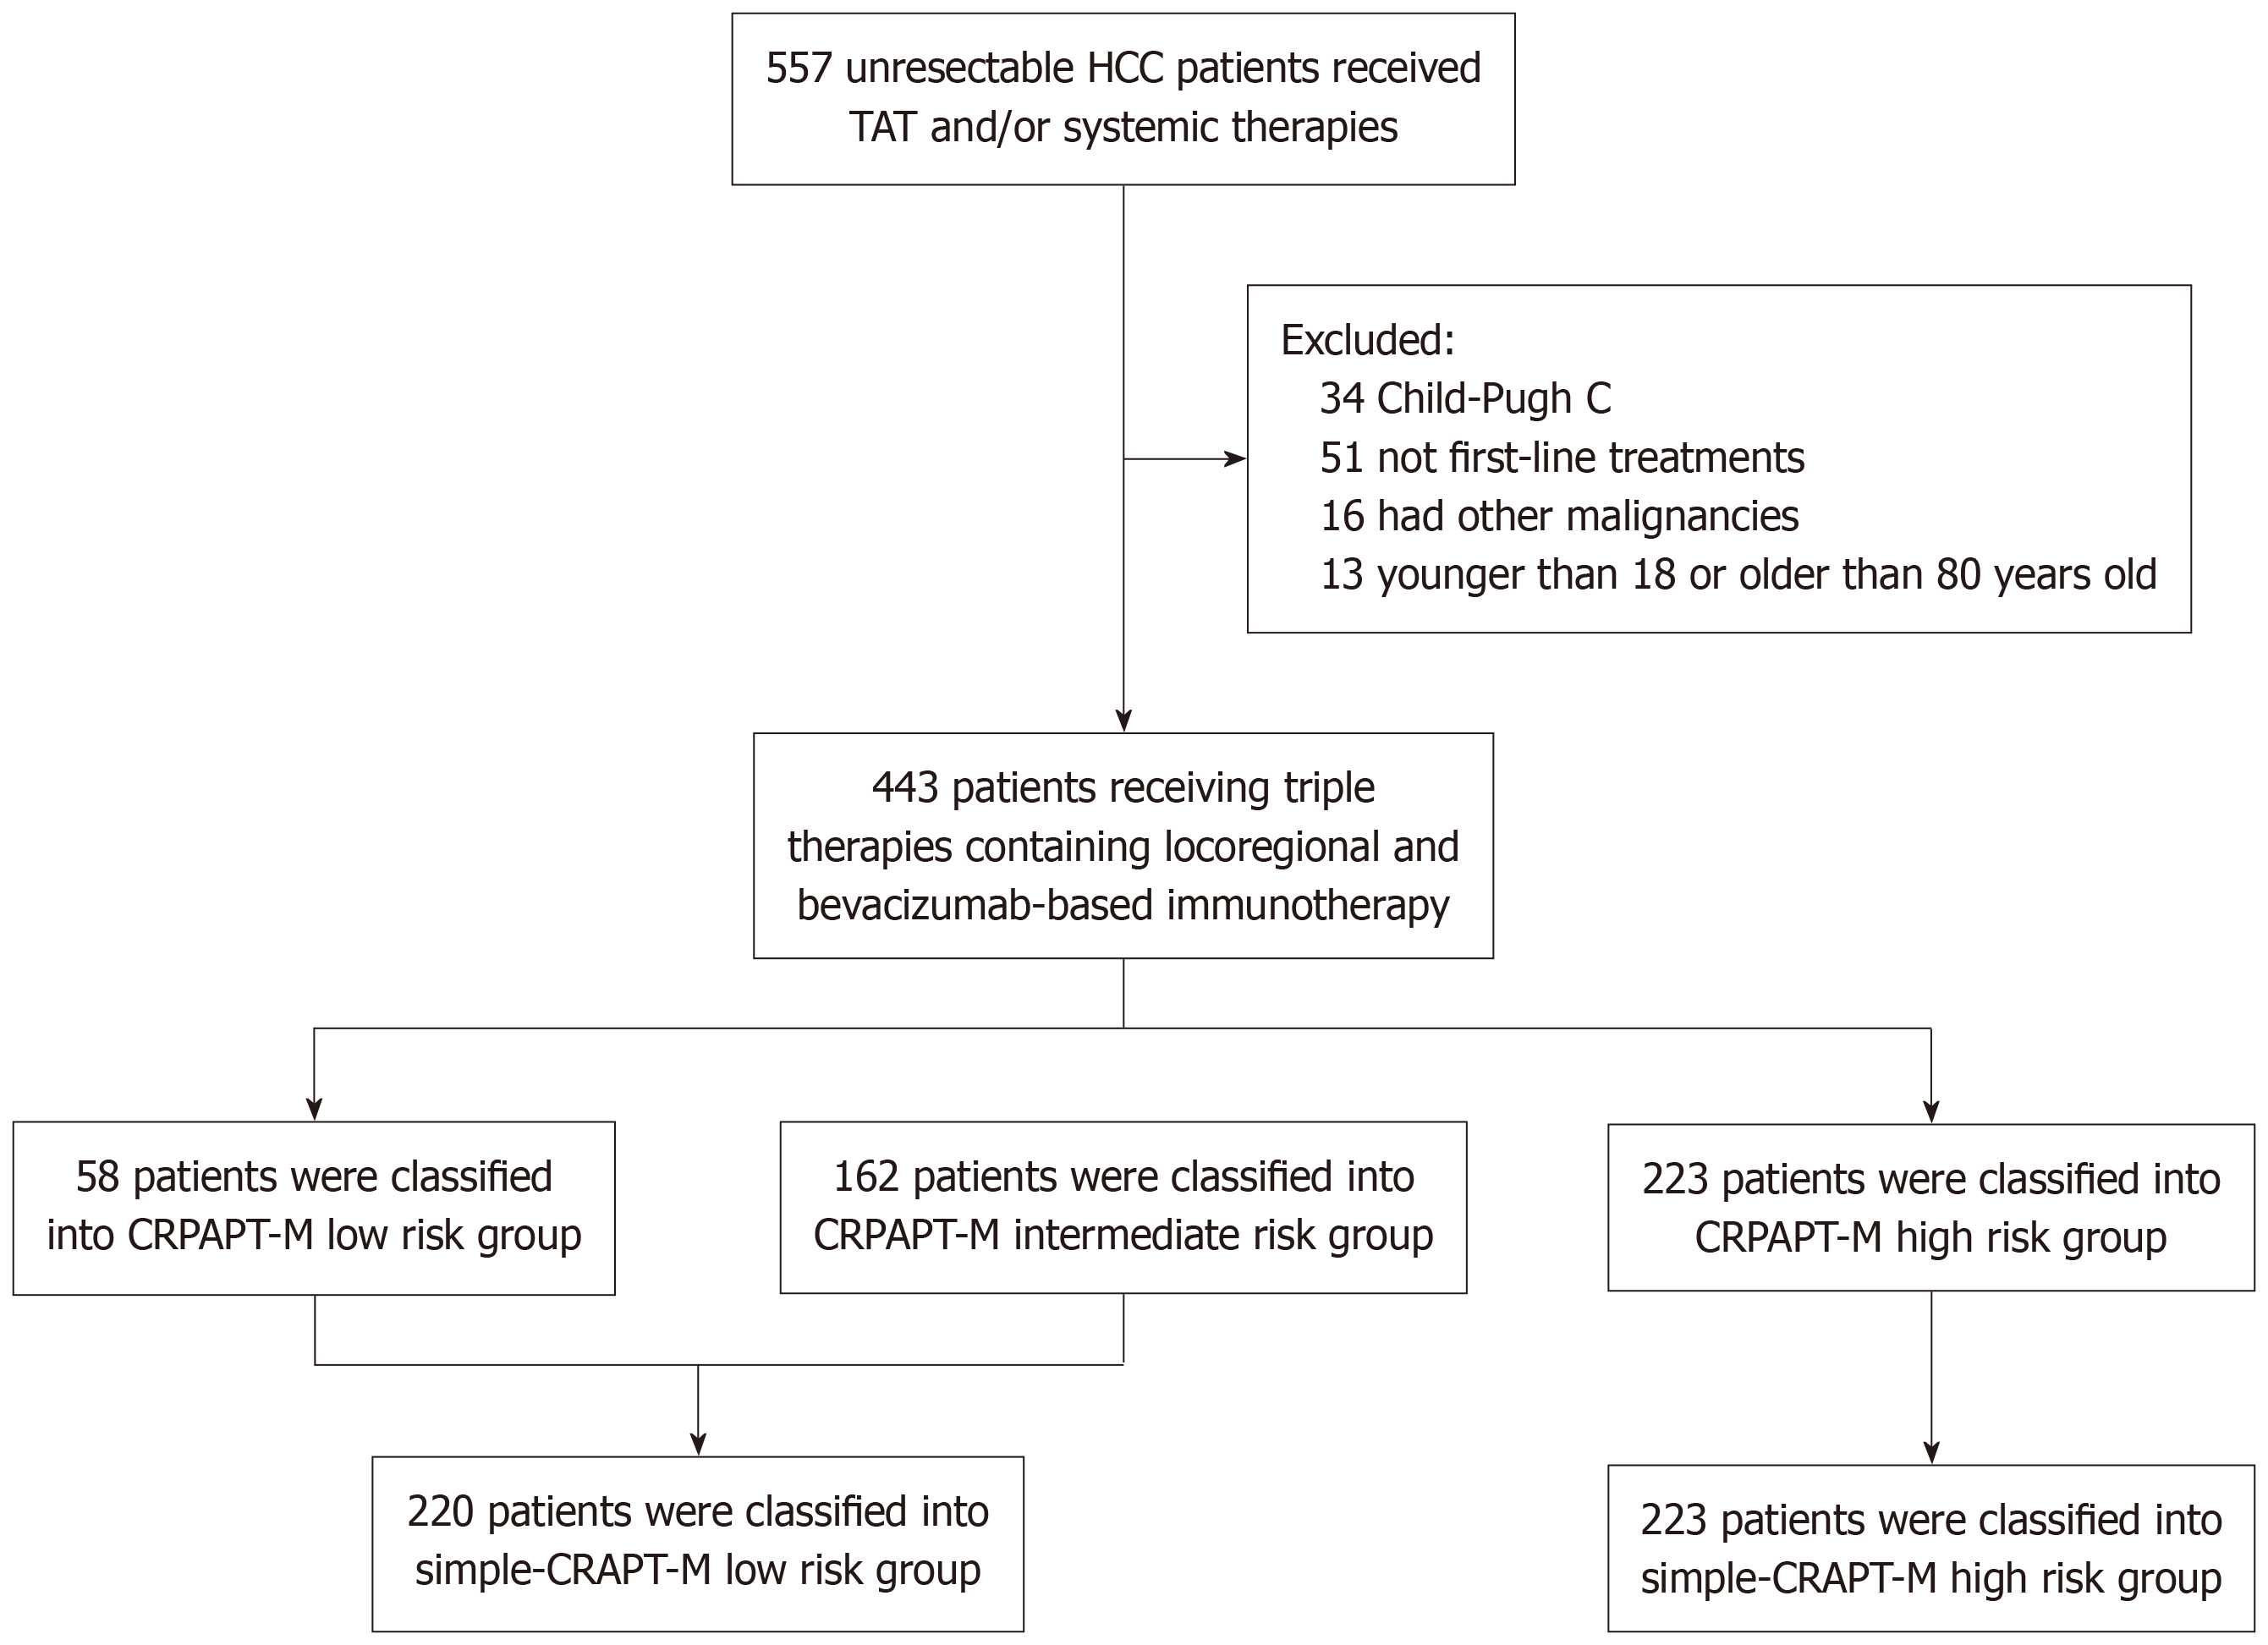
Figure 1 Flow diagram of hepatocellular carcinoma patients treated with locoregional-bevacizumab-immunotherapy.
HCC: Hepatocellular carcinoma; TAT: Transarterial therapy.
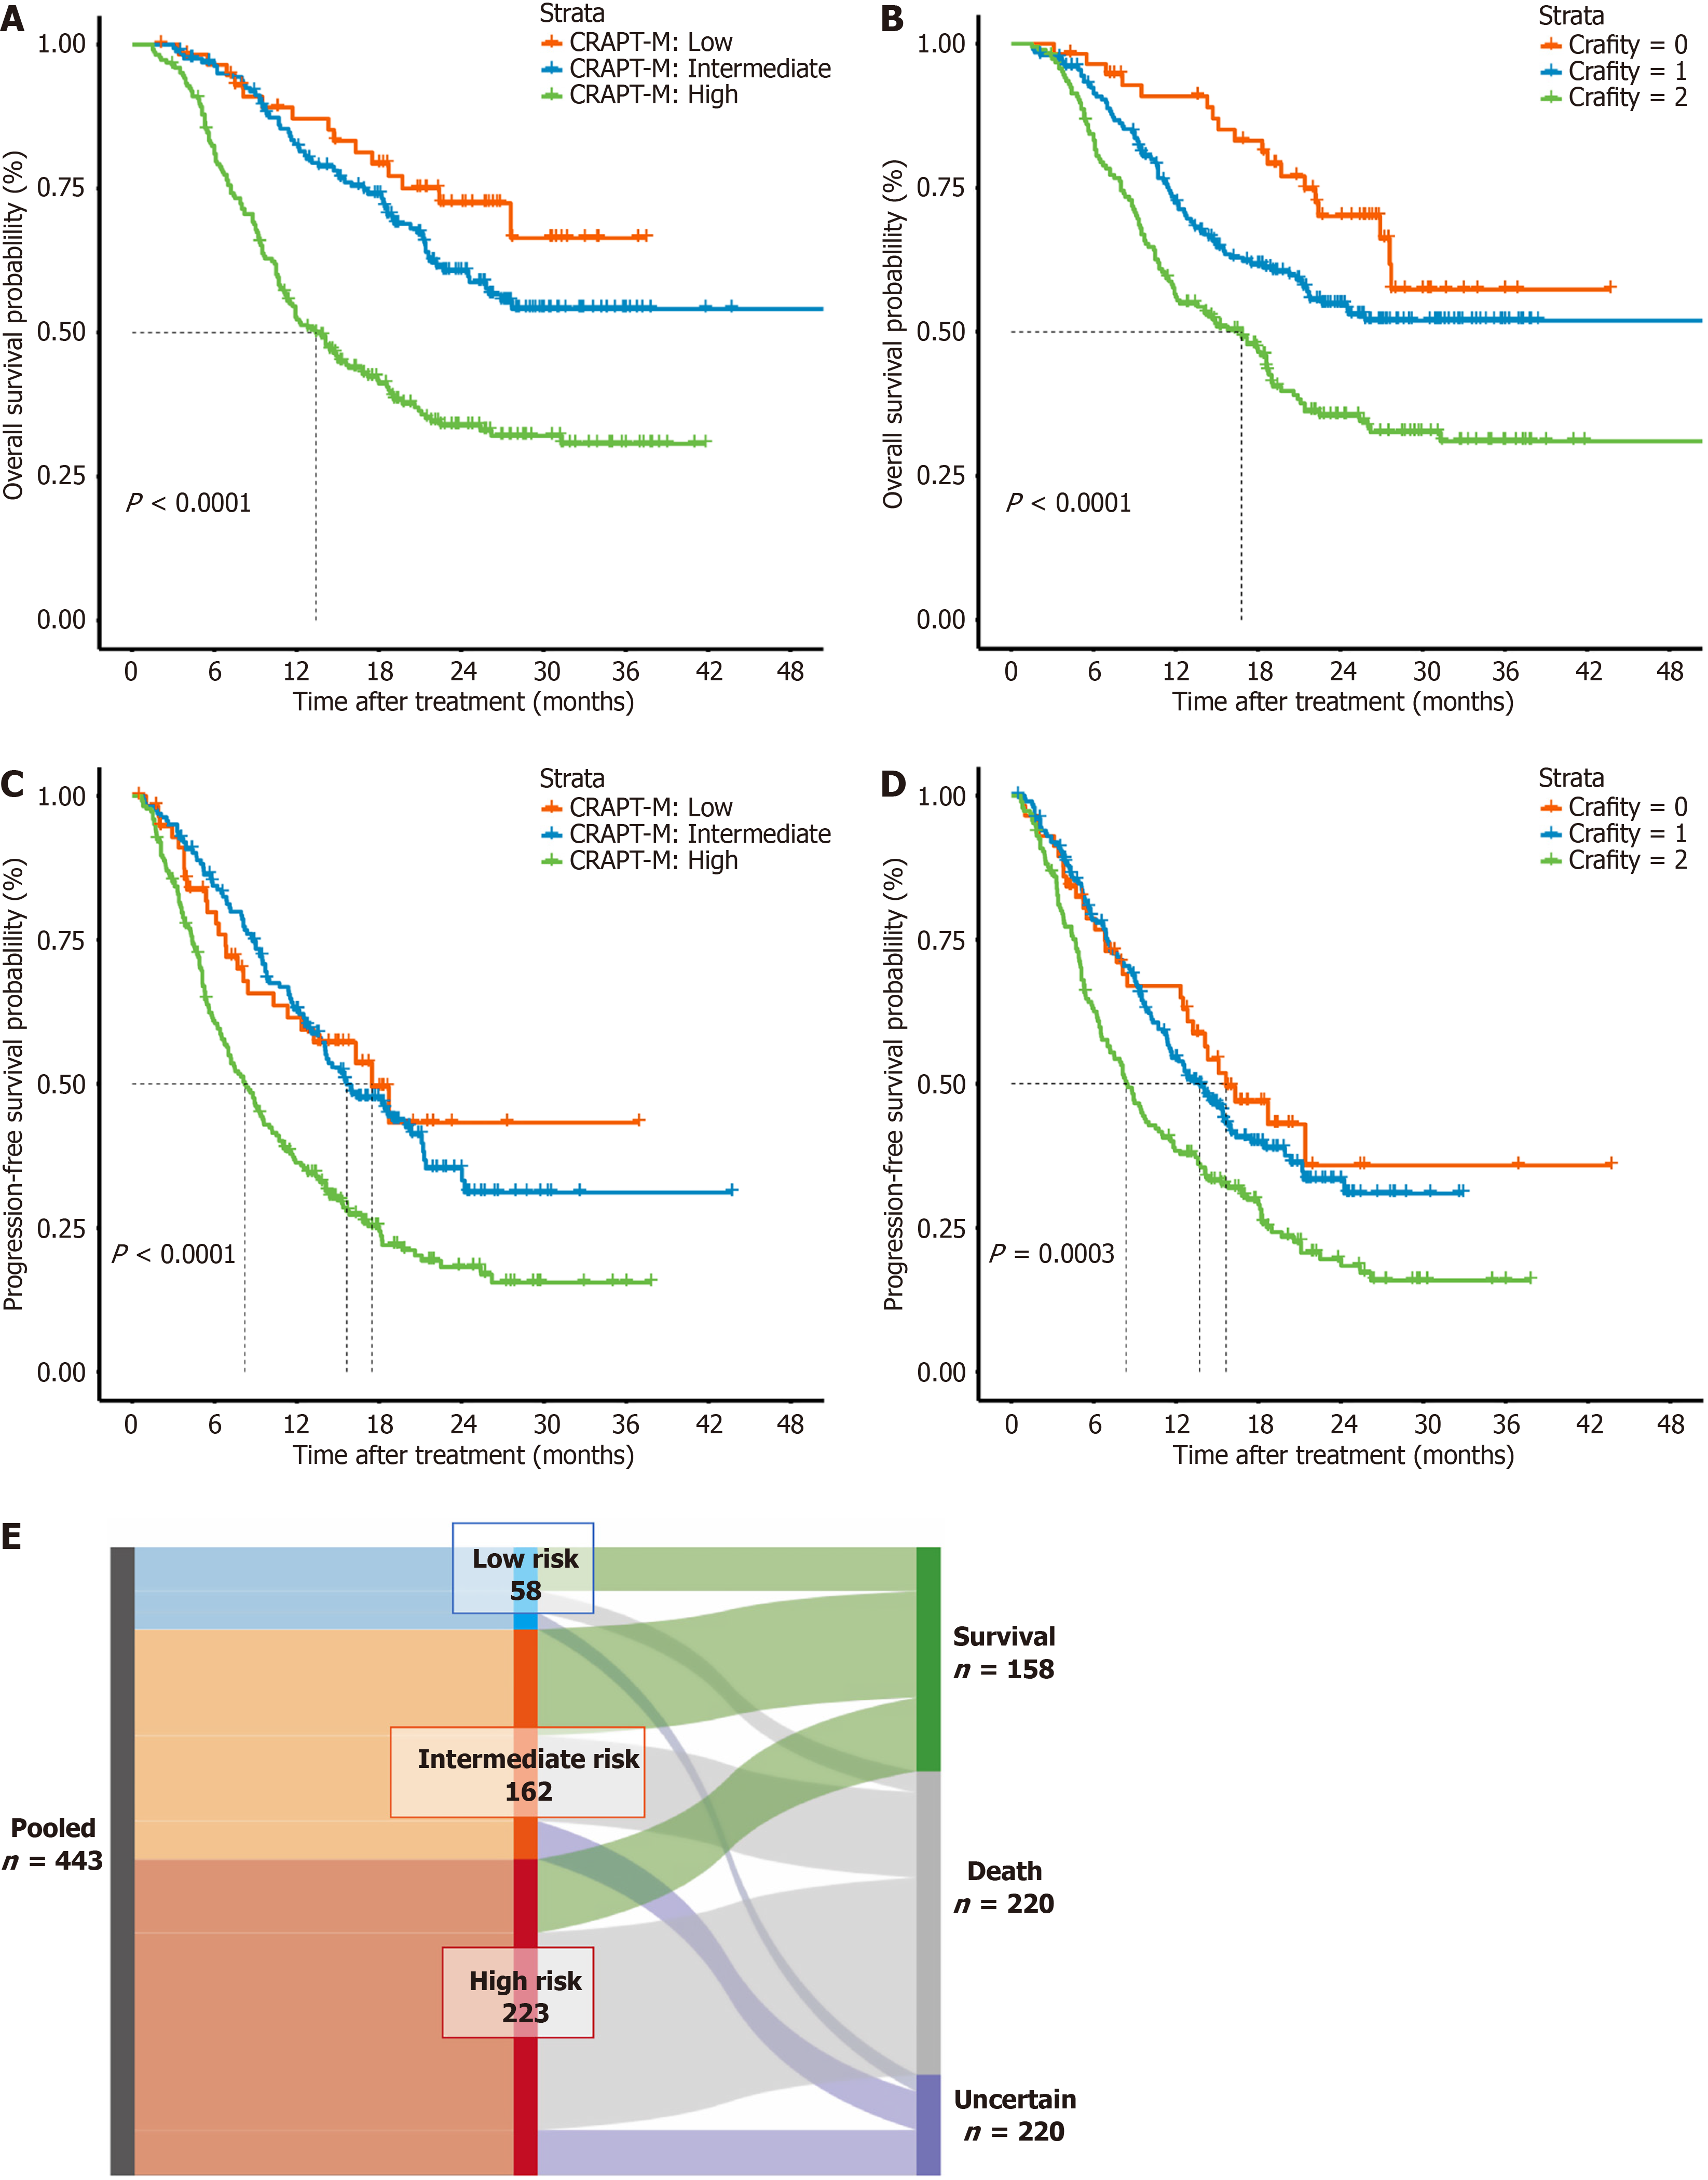
Figure 2 Kaplan-Meier curves for overall survival and progression-free survival of patients treated with locoregional-bevacizumab-immunotherapy.
A-D: Overall survival (A and C) and progression-free survival (B and D) in patients stratified into different groups according to CRAPT-M model (A and B) and CRAFITY model (C and D); E: Sankey diagram showing clinical outcomes stratified by the CRAPT-M model.
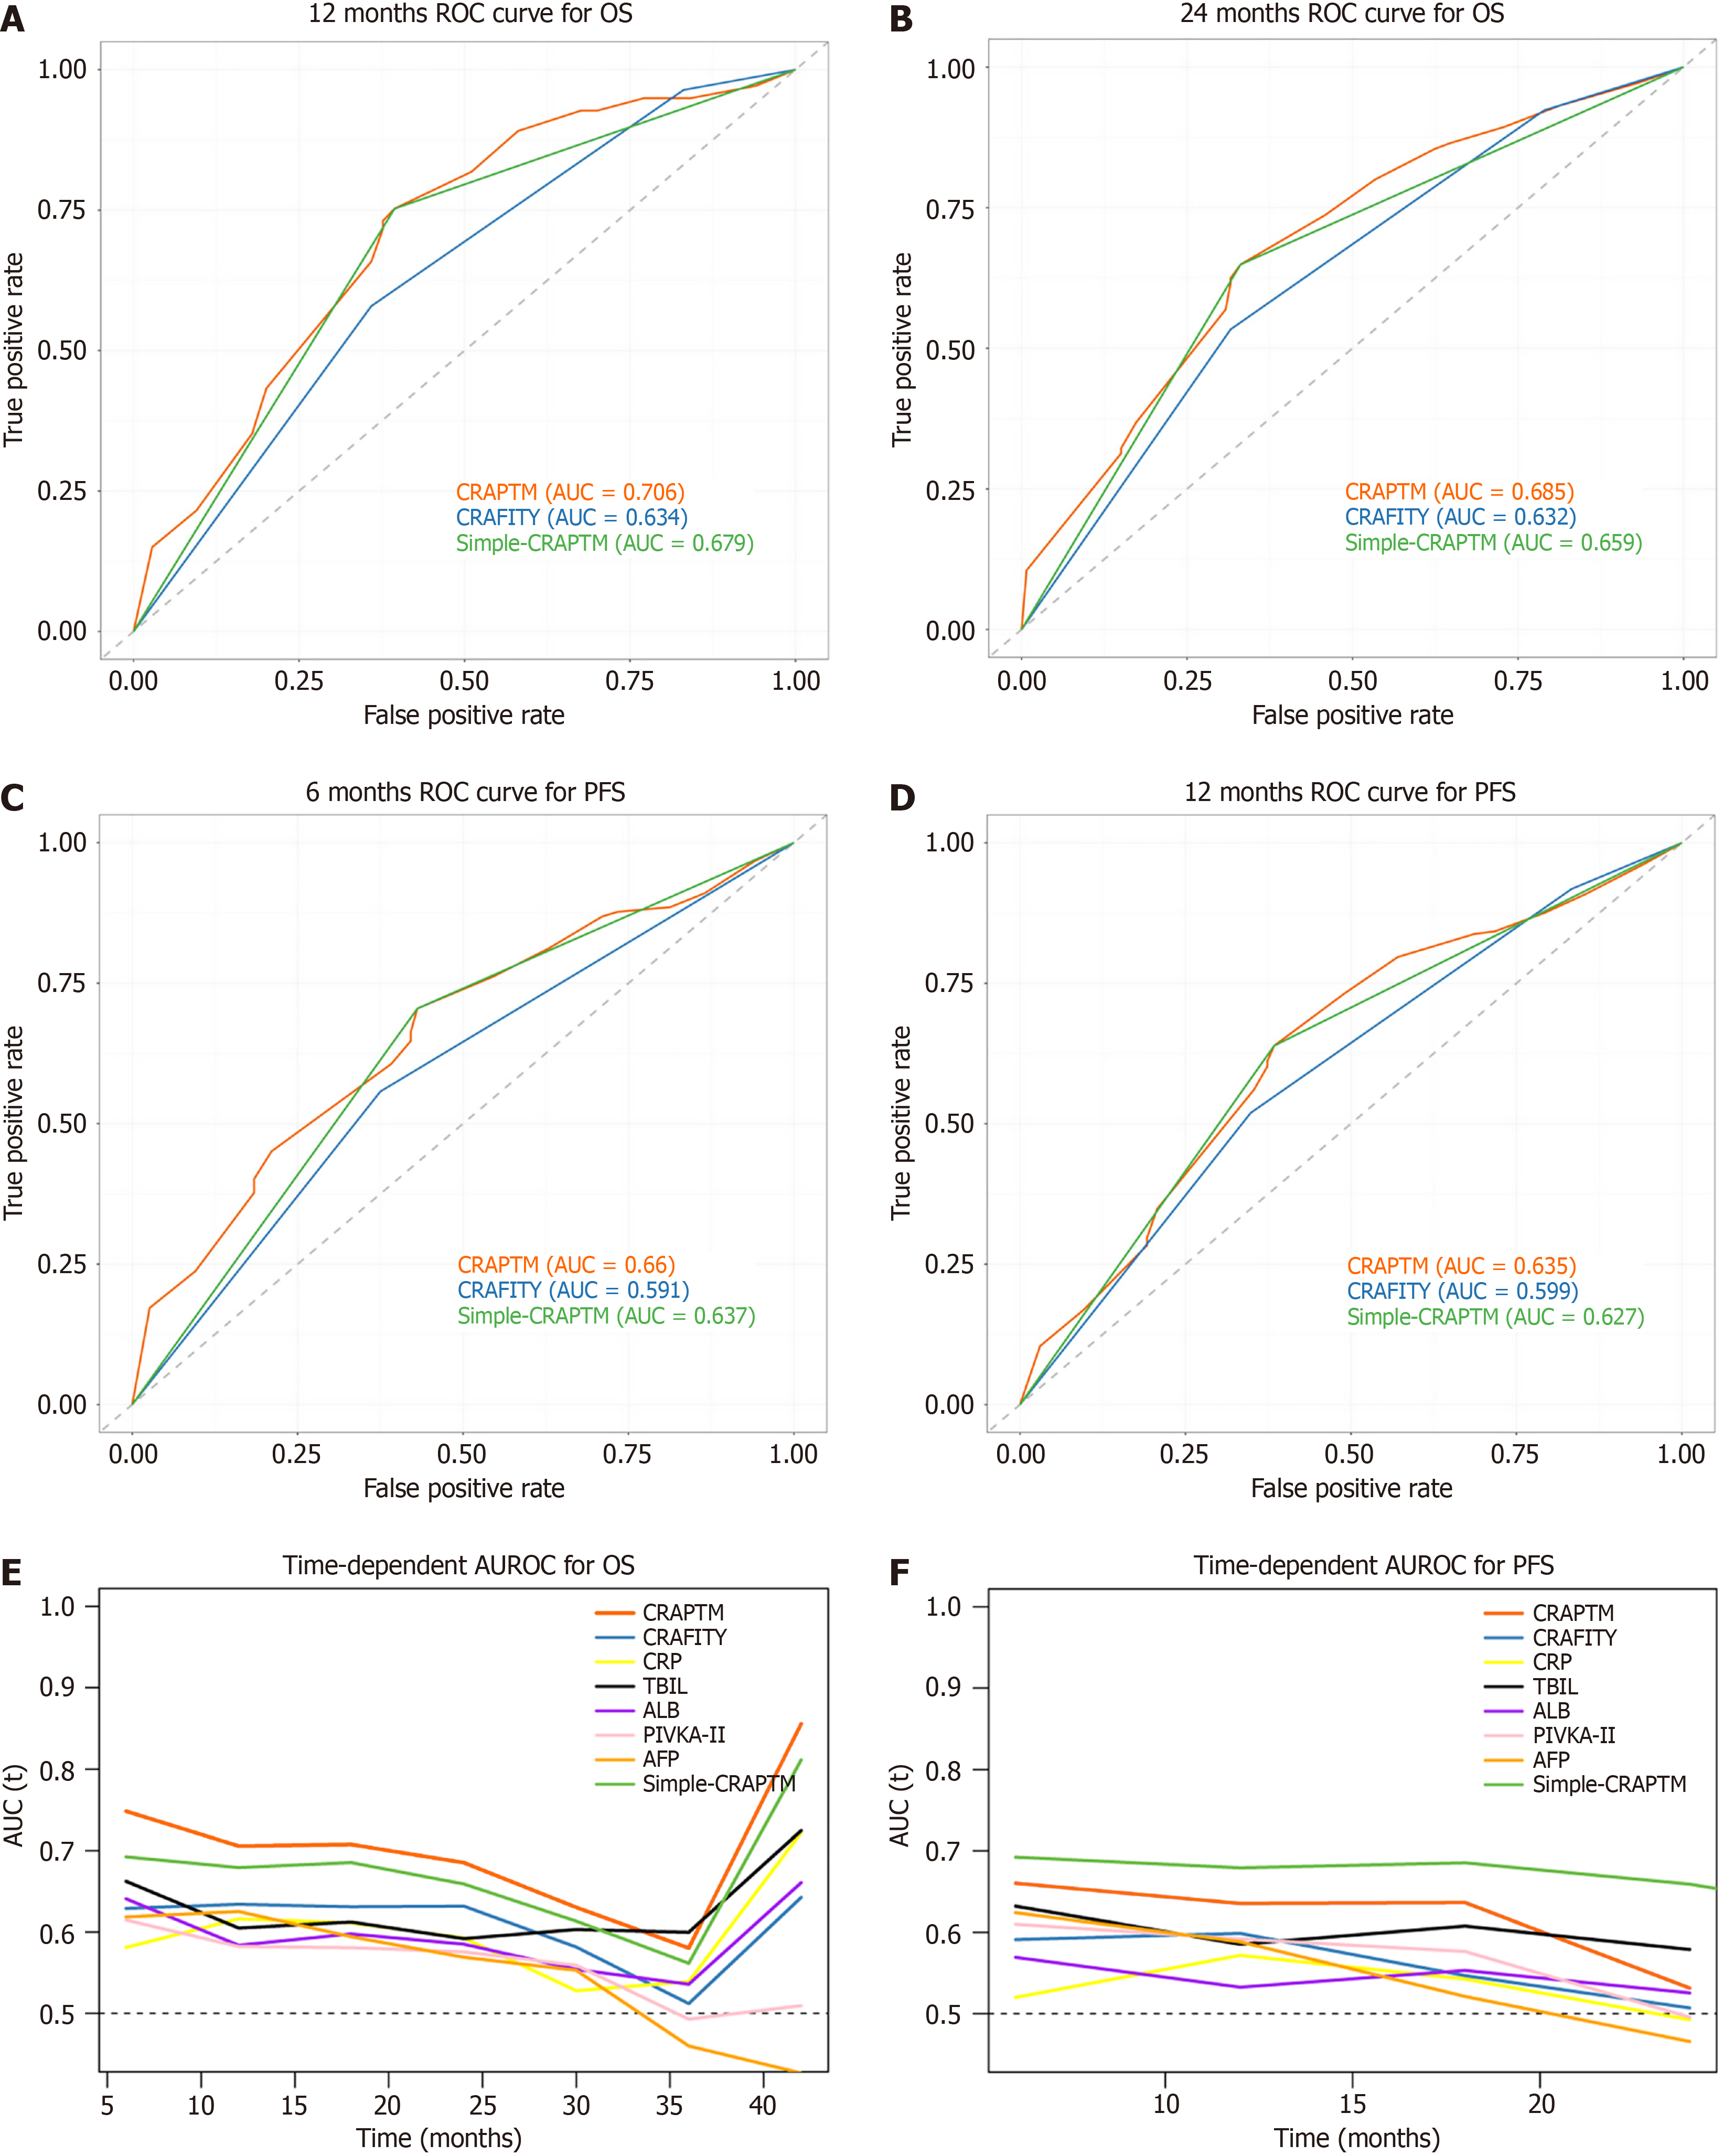
Figure 3 Predictive performance of the CRAPT-M, Simple-CRAPT-M and CRAFITY model in patients treated with locoregional-bevacizumab-immunotherapy.
A and B: Receiver operating characteristic (ROC) curves of the CRAPT-M, Simple-CRAPT-M and CRAFITY model for overall survival (OS) at 12 months (A) and 24 months (B); C and D: ROC curves of the CRAPT-M, Simple-CRAPT-M and CRAFITY model for progression-free survival (PFS) at 6 months (C) and 12 months (D); E and F: Time-dependent ROC analysis of the CRAPT-M, Simple-CRAPT-M, CRAFITY model and other factors for OS (E) and PFS (F) throughout follow-up. The X-axis represents the follow-up time (months) from the initiation of locoregional-bevacizumab-immunotherapy therapy. ROC: Receiver operating characteristic; OS: Overall survival; PFS: Progression-free survival; AUC: Area under the curve; AUROC: Area under the receiver operating characteristic; CRP: C-reactive protein; TBIL: Total bilirubin; ALB: Albumin; PIVKA-II: Protein induced by vitamin K absence or antagonist-II; AFP: Alpha fetoprotein.
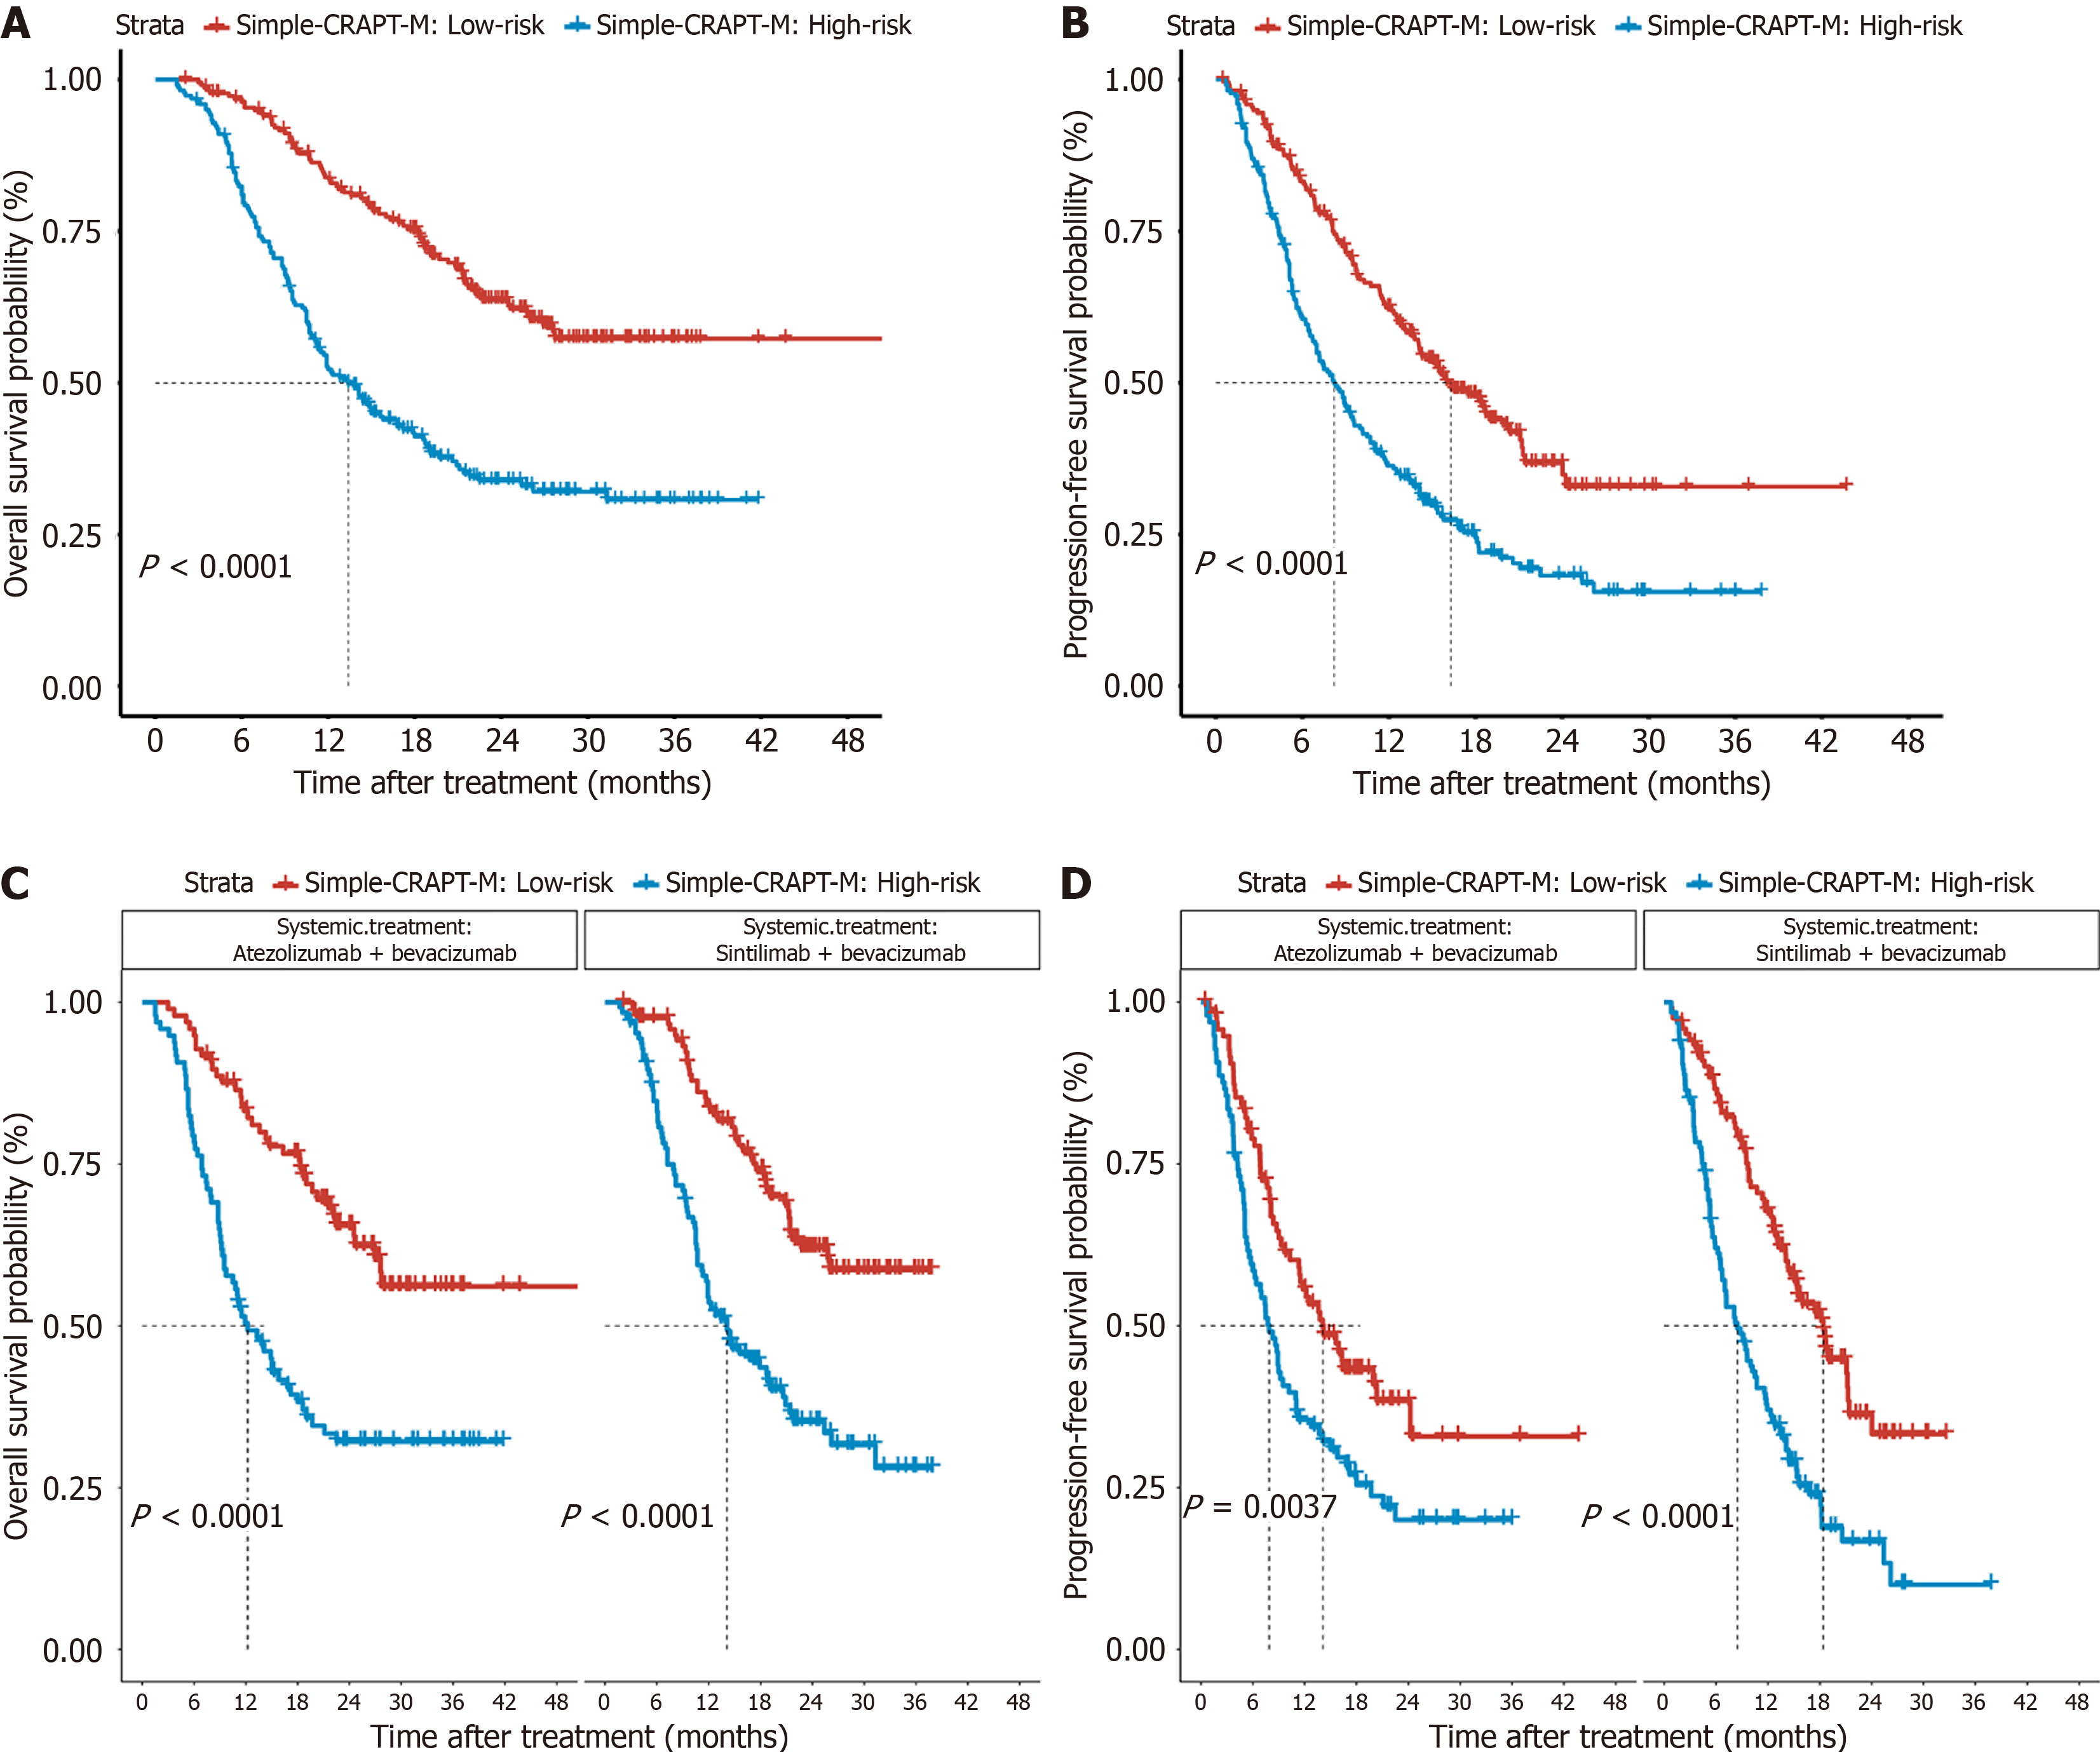
Figure 4 Kaplan-Meier curves for overall survival and progression-free survival of patients treated with locoregional-bevacizumab-immunotherapy.
A and B: Overall survival (OS; A) and progression-free survival (PFS; B) in patients stratified into different groups according to the Simple-CRAPT-M model; C and D: Subgroup analysis showing OS (C) and PFS (D) in patients receiving different bevacizumab-based immune therapies and stratified into different groups according to the Simple-CRAPT-M model.
- Citation: Zheng ZH, Xiao R, Liu N, He BY, Yu W, Wu ZS, Chen MS, Mei J, Hu DD, Guo RP. CRAPT-M: An effective prognostic predictor for hepatocellular carcinoma patients treated with locoregional-bevacizumab-immunotherapy. World J Gastroenterol 2026; 32(25): 119588
- URL: https://www.wjgnet.com/1007-9327/full/v32/i25/119588.htm
- DOI: https://dx.doi.org/10.3748/wjg.119588