
















Copyright: ©Author(s) 2026.
World J Gastroenterol. Jul 7, 2026; 32(25): 119071
Published online Jul 7, 2026. doi: 10.3748/wjg.119071
Published online Jul 7, 2026. doi: 10.3748/wjg.119071
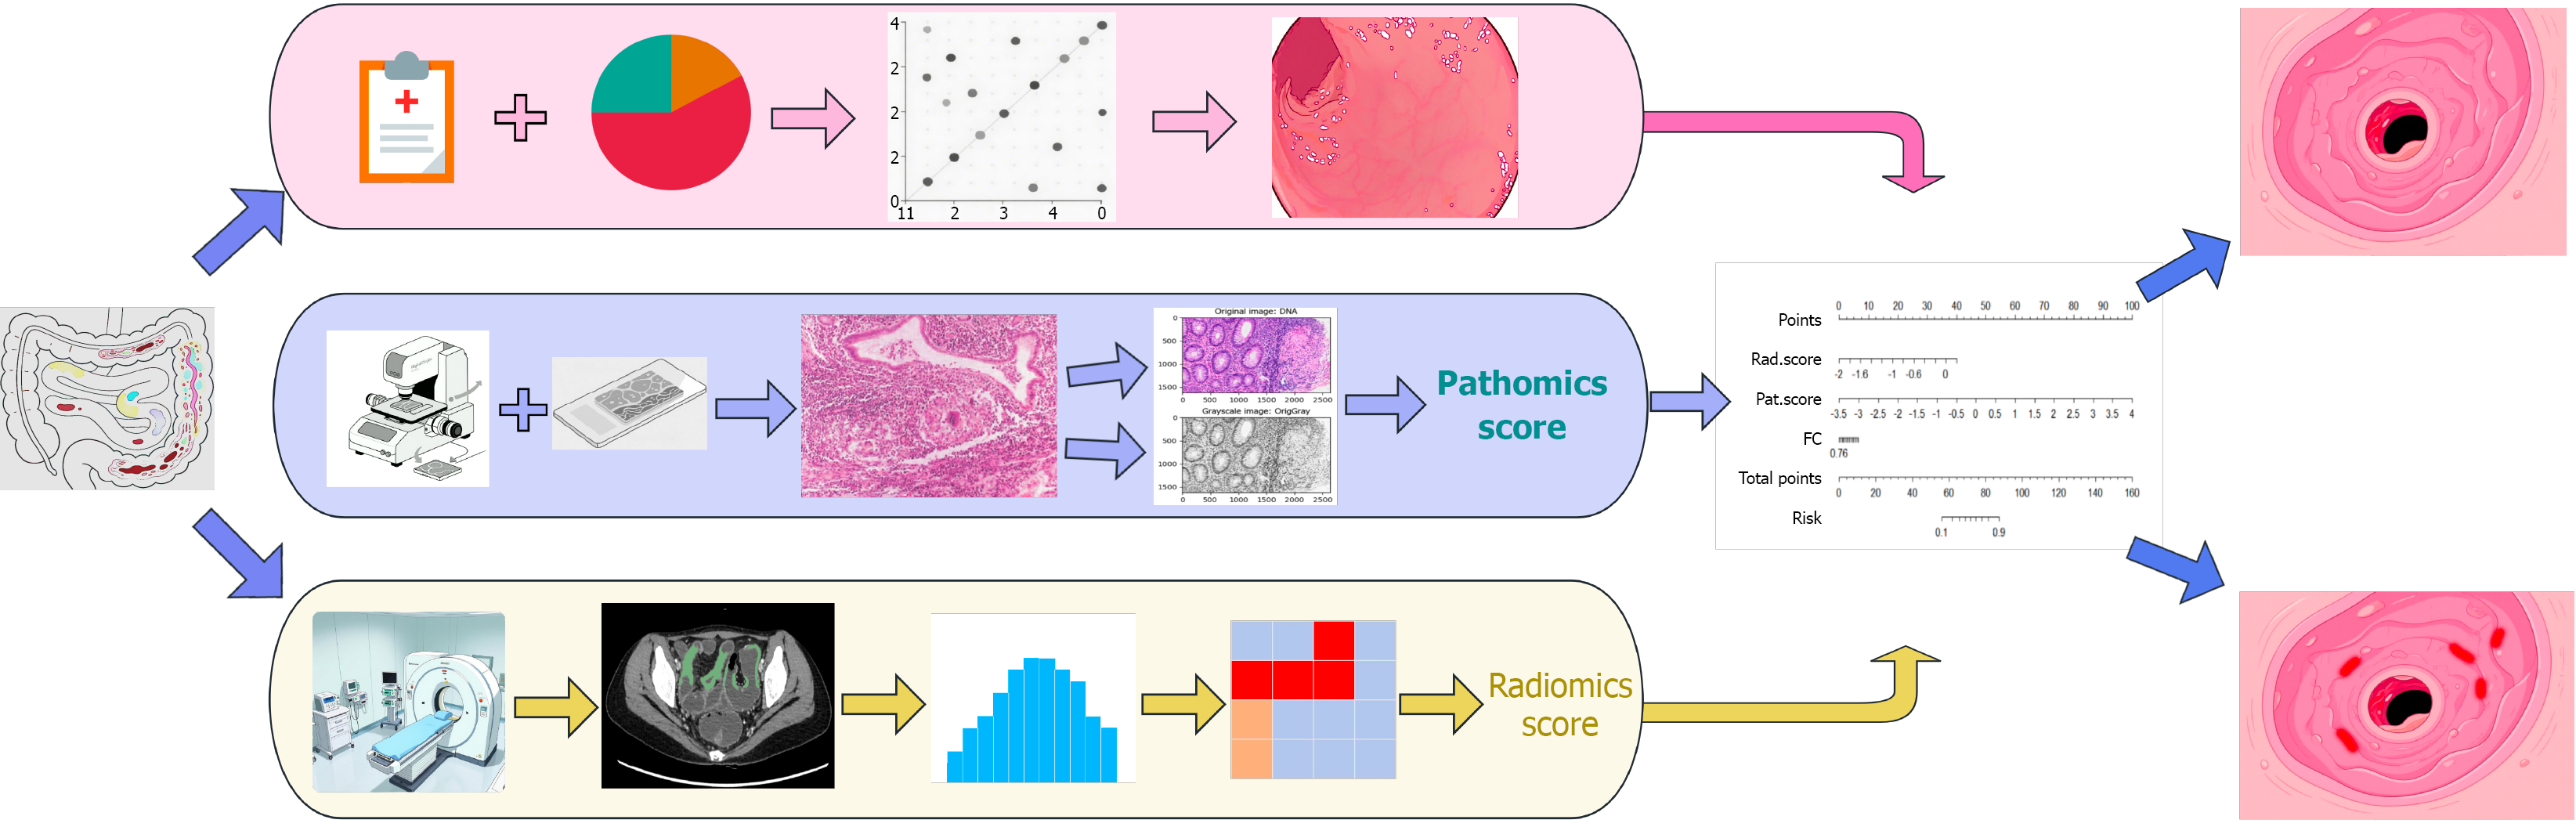
Figure 1 Combined models workflow implemented in this study.
FC: Fecal calprotectin.
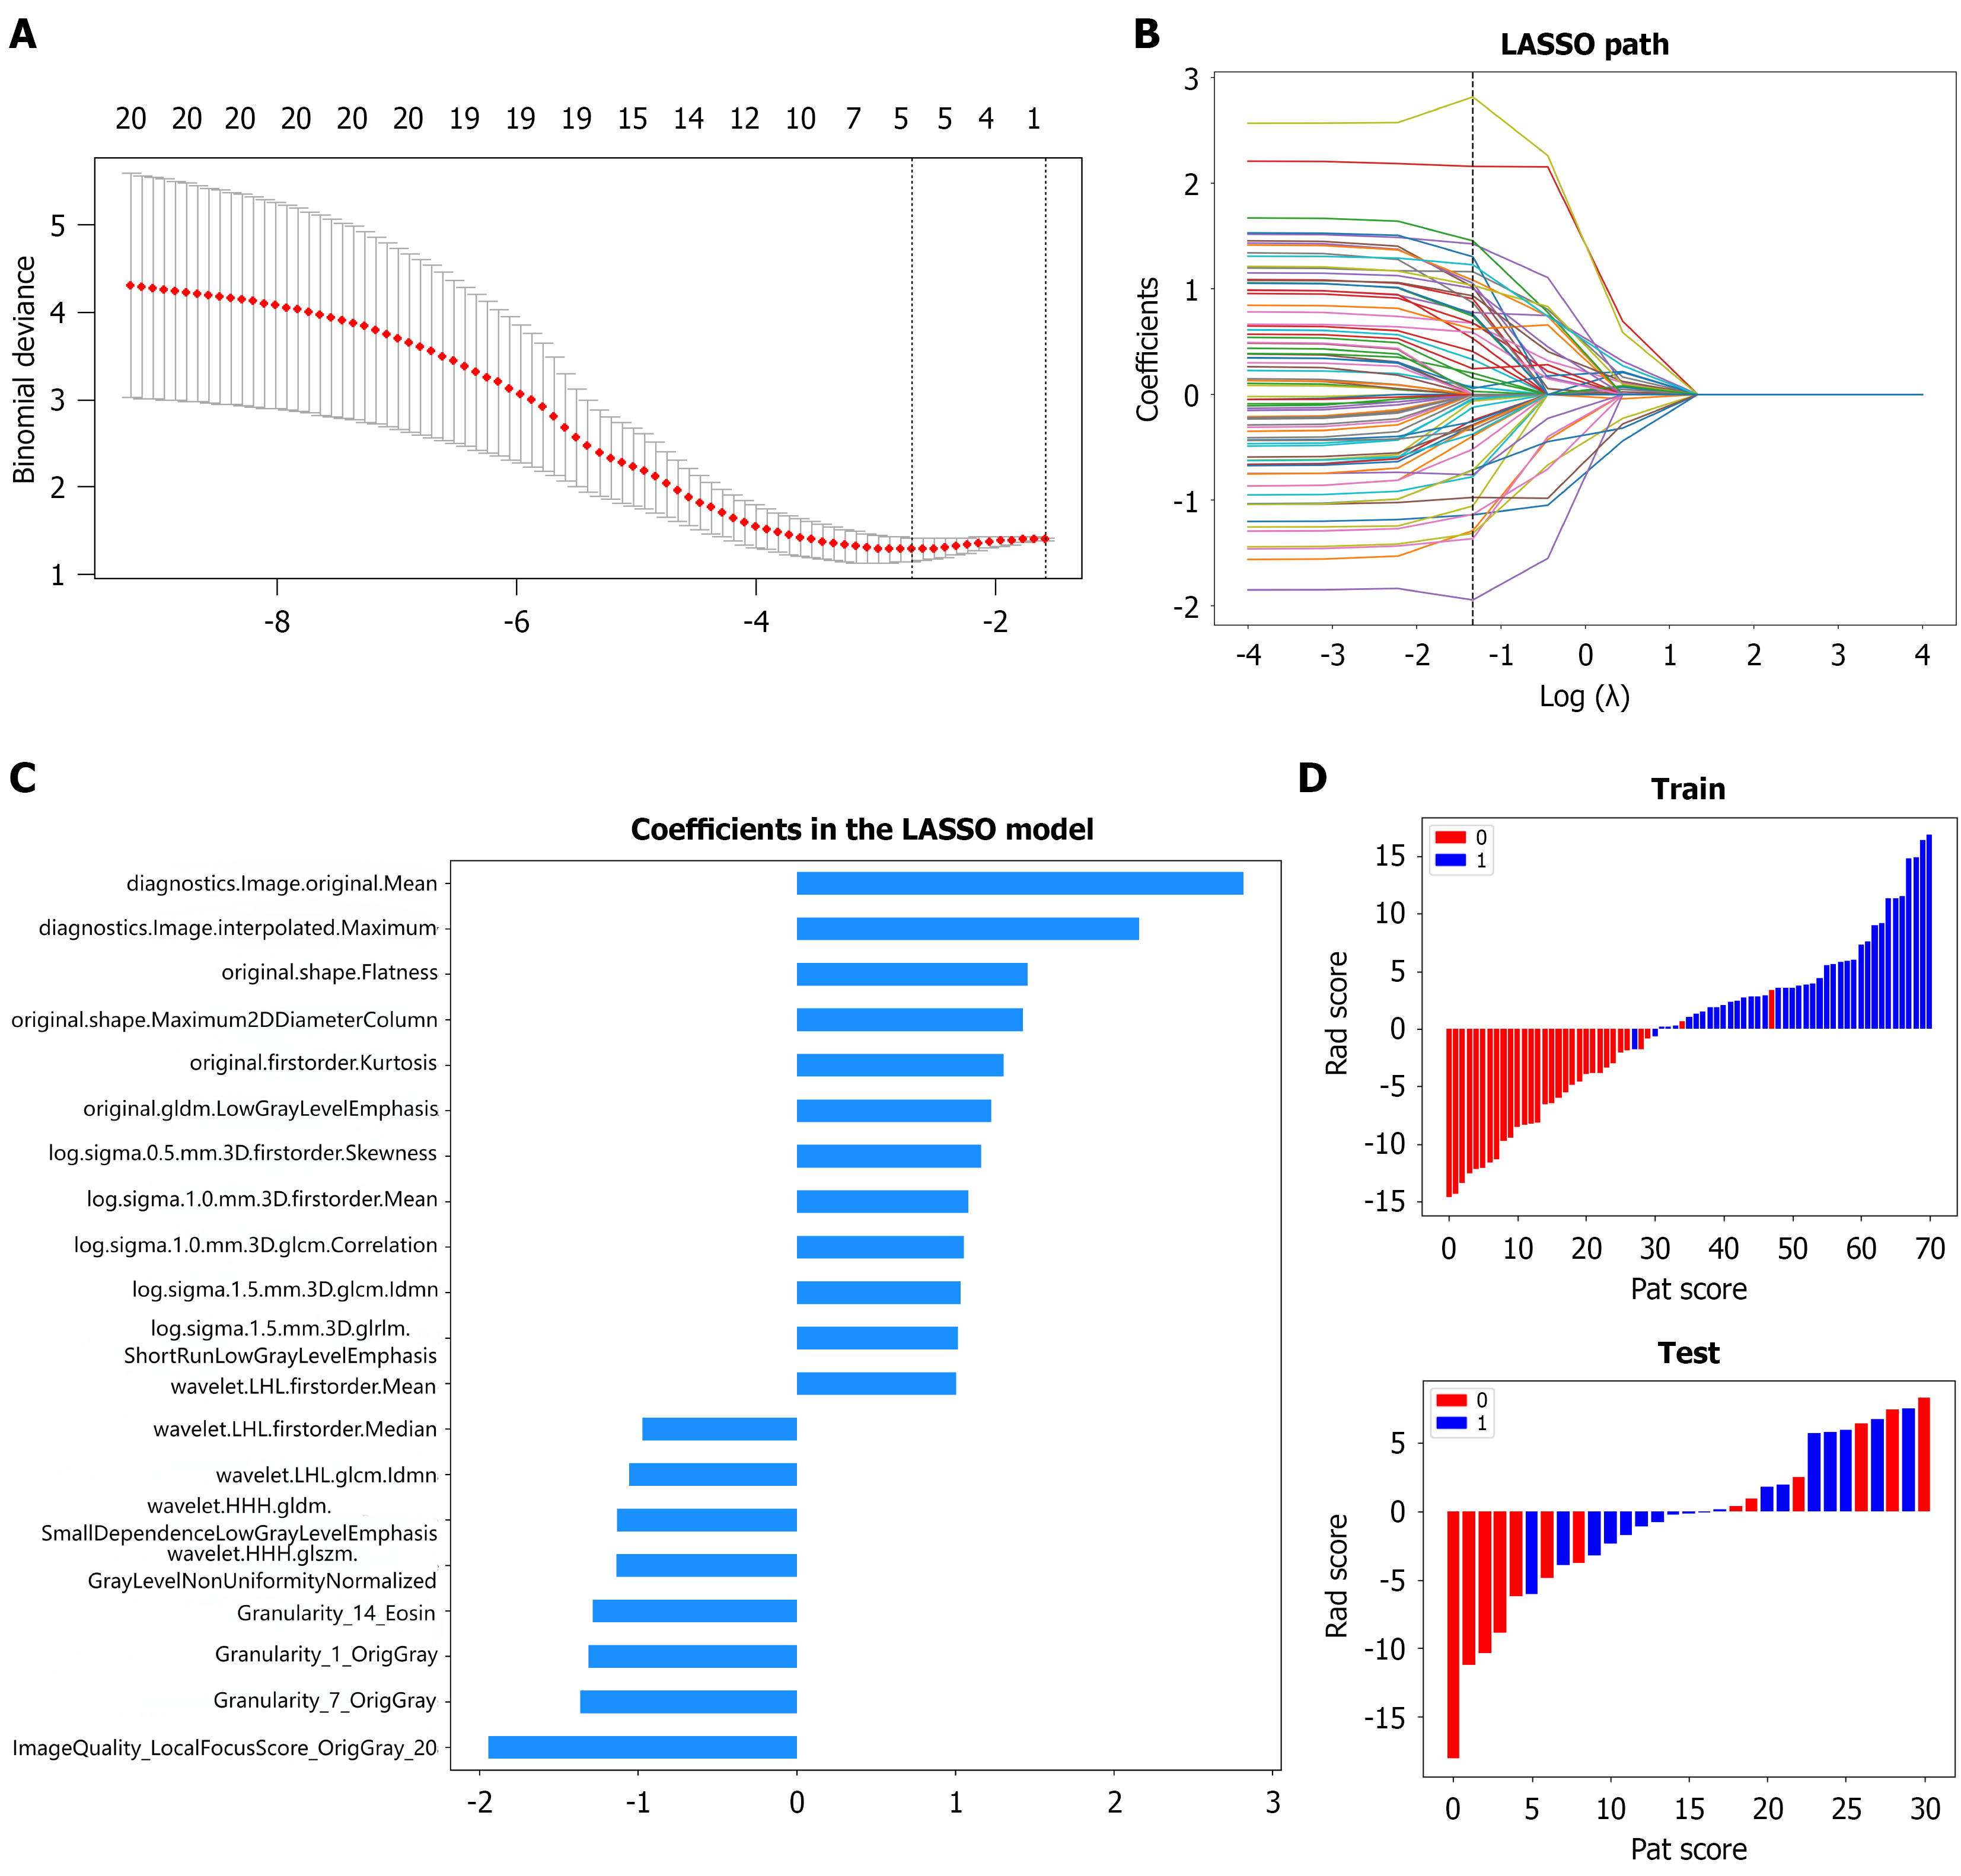
Figure 2 Feature selection and performance evaluation of the radiomics score (rad score) and pathomics score (pat score) in ileal Crohn’s disease via least absolute shrinkage and selection operator logistic regression.
A: Selection of the tuning parameter (λ) in the least absolute shrinkage and selection operator model through 10-fold cross validation based on the minimum criterion. The binomial deviance from cross validation is plotted against the log transformed λ [ln(λ)]; B: Coefficient profiles of all features in relation to ln(λ). Features with non-zero coefficients subsequent to regularization are presented; C: The 20 features with non-zero coefficients and their respective contributions to the rad score and pat score; D: The verified sets of the rad score and pat score. LASSO: Least absolute shrinkage and selection operator.
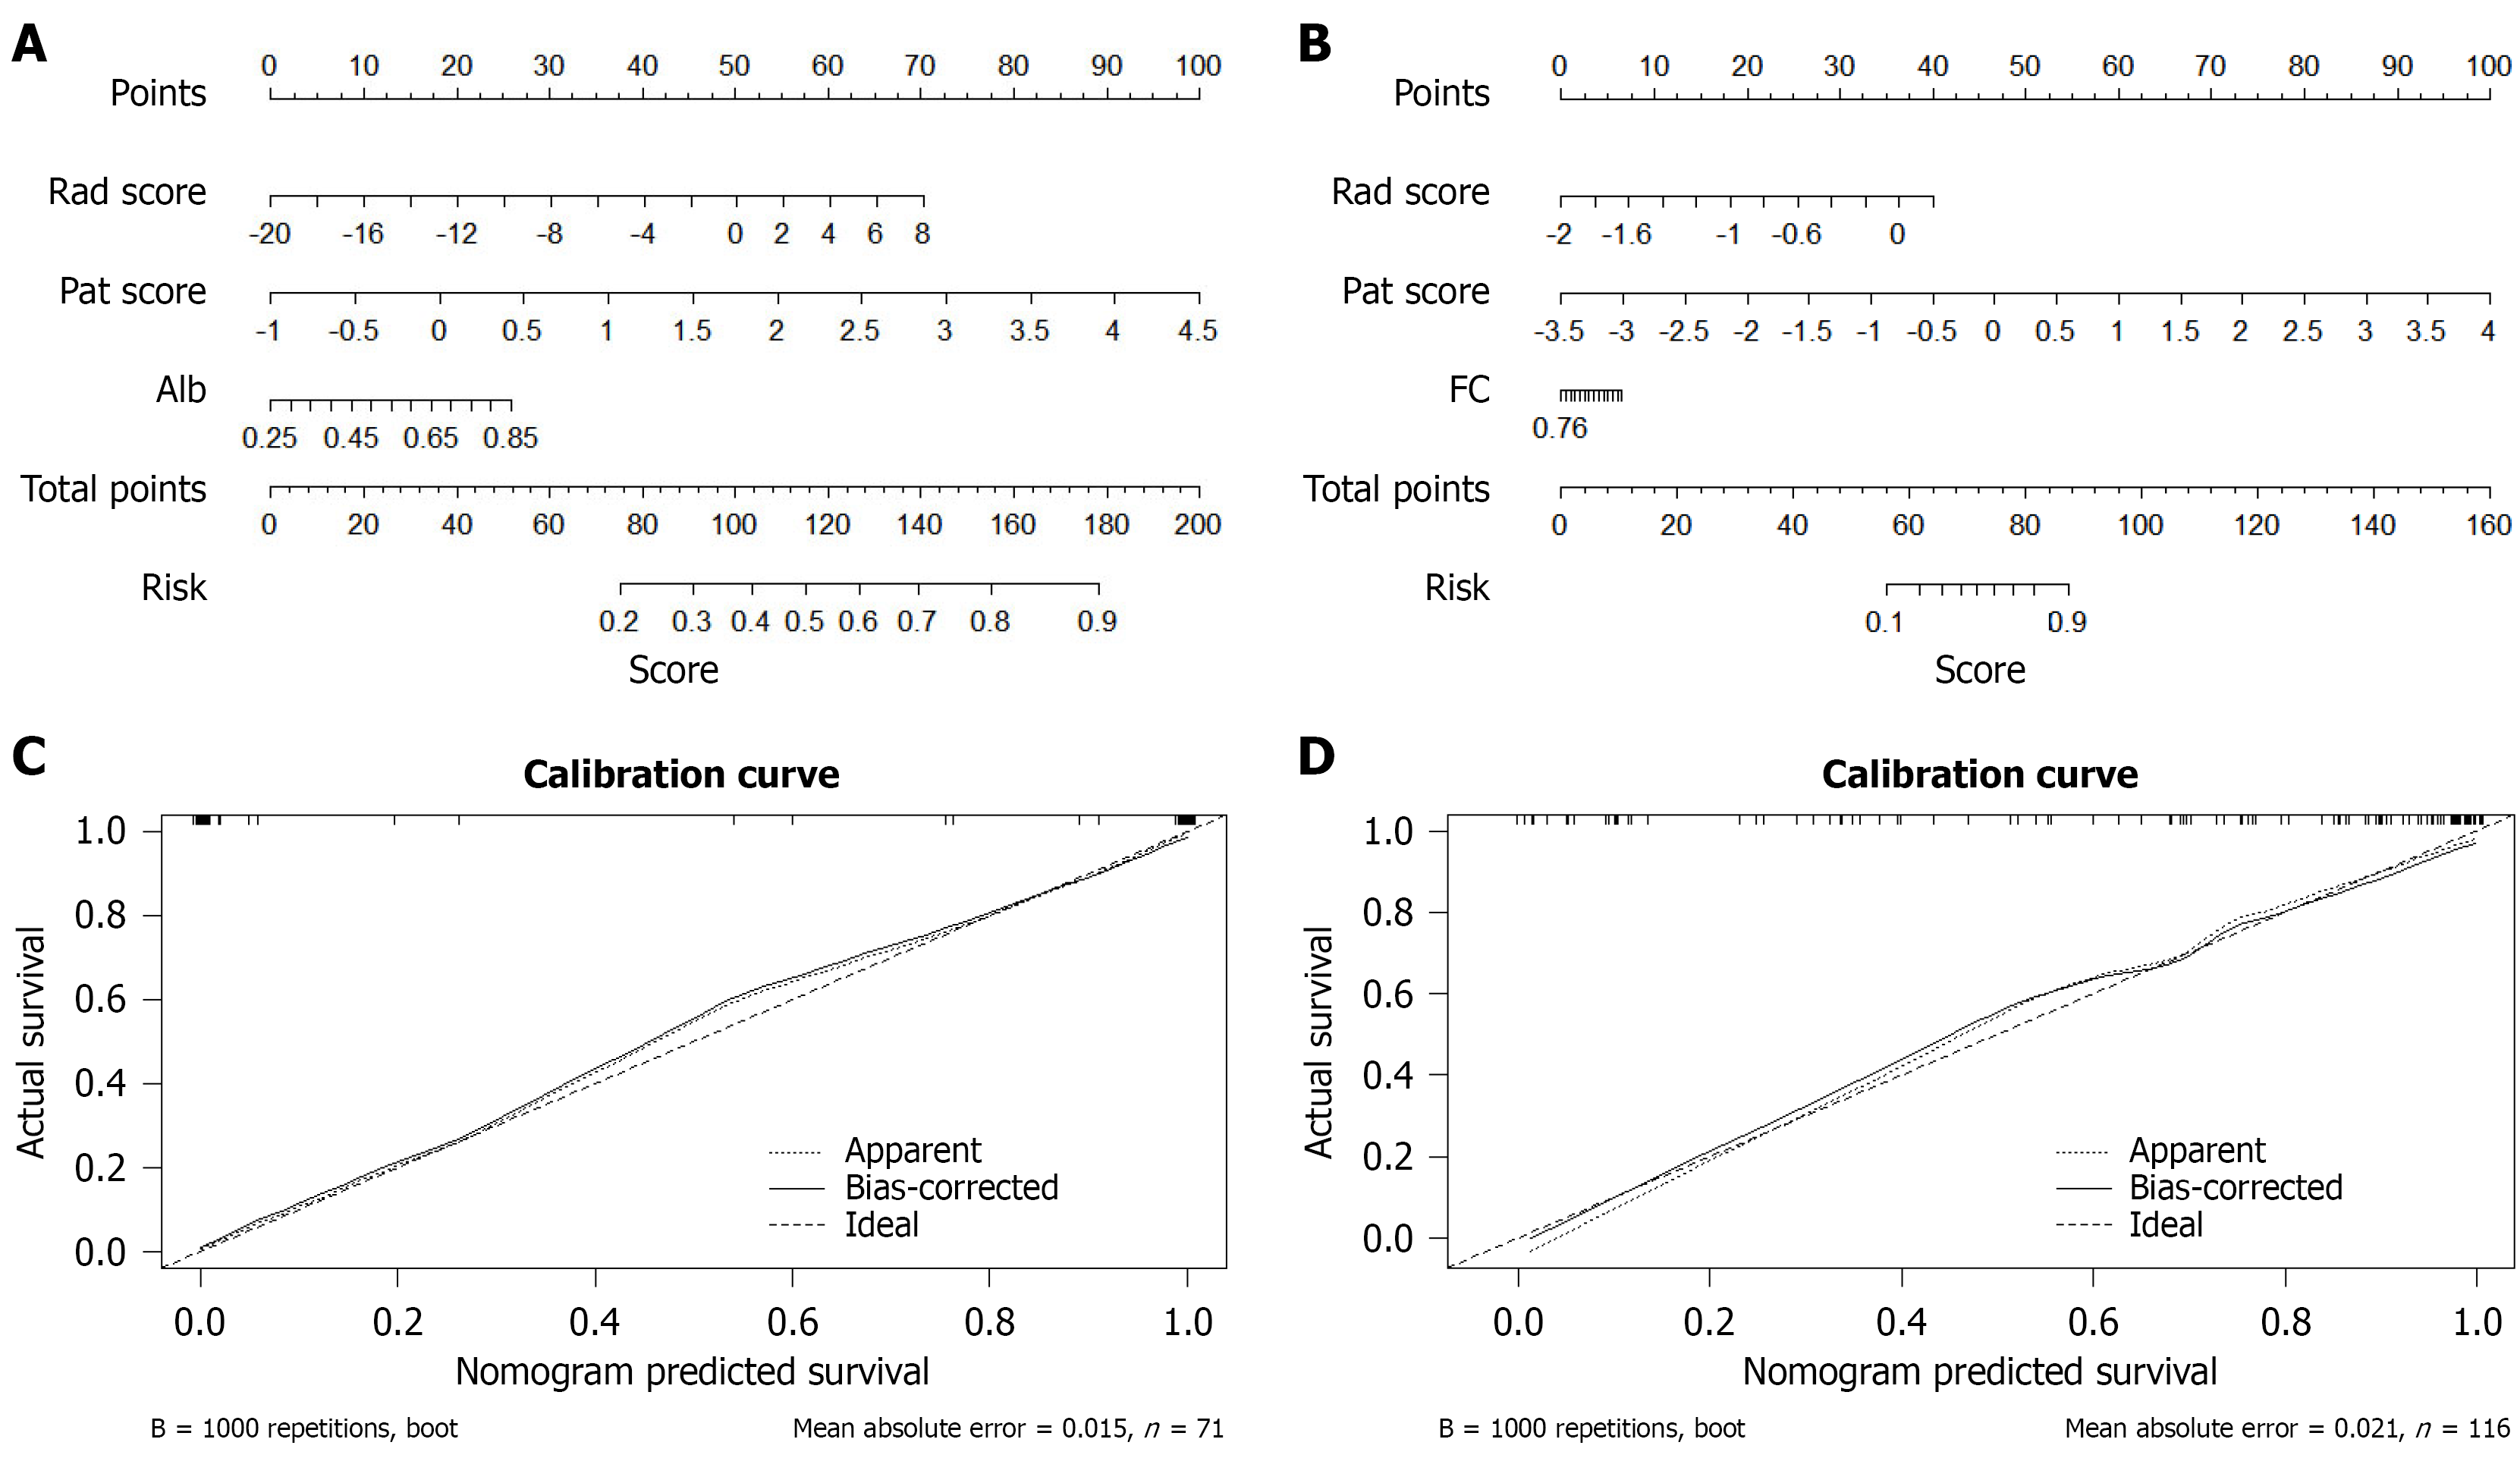
Figure 3 Radiomics and pathomics nomograms and calibration curves.
A and B: Radiomics and pathomics nomograms for predicting Crohn’s disease mucosal healing status in the ileal and ileocolonic region; C and D: In the ileal and ileocolonic region, calibration curves of the combined models in the testing set. Alb: Albumin; FC: Fecal calprotectin.
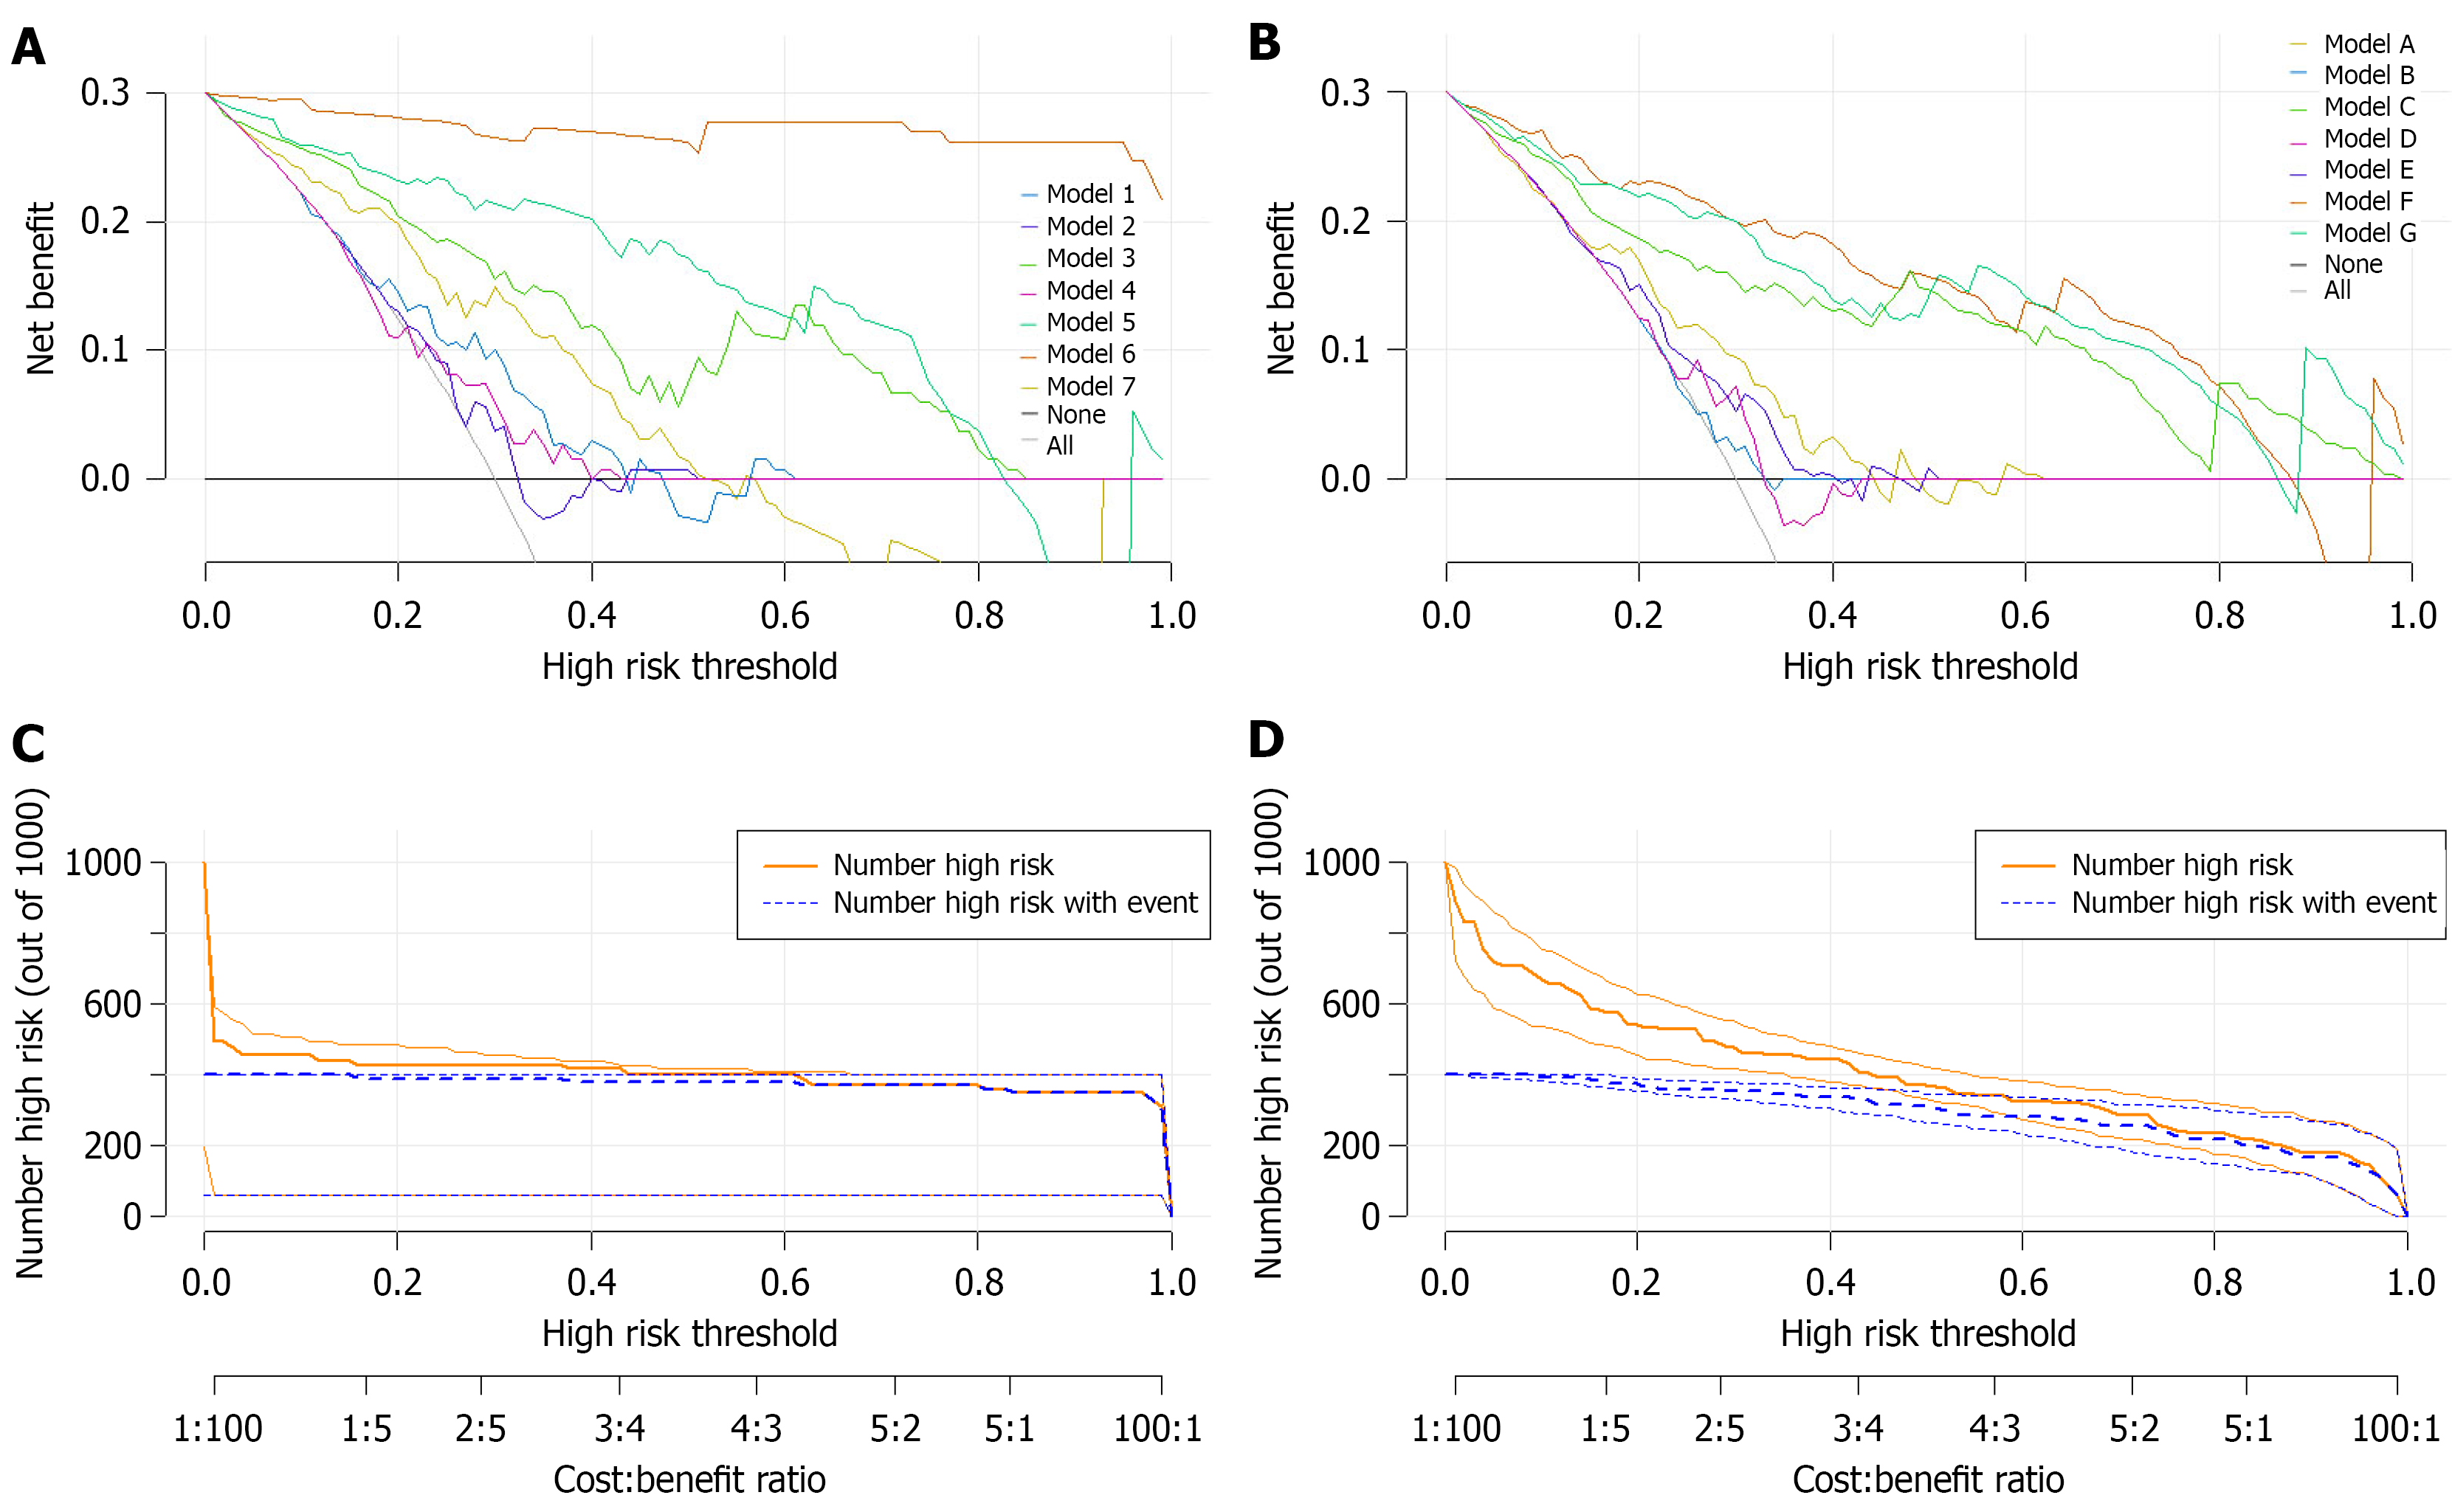
Figure 4 Decision curve analysis and clinical impact curves.
A and B: In the ileal and ileocolonic region, decision curve analysis of all models; C and D: Clinical impact curves of the combined models.
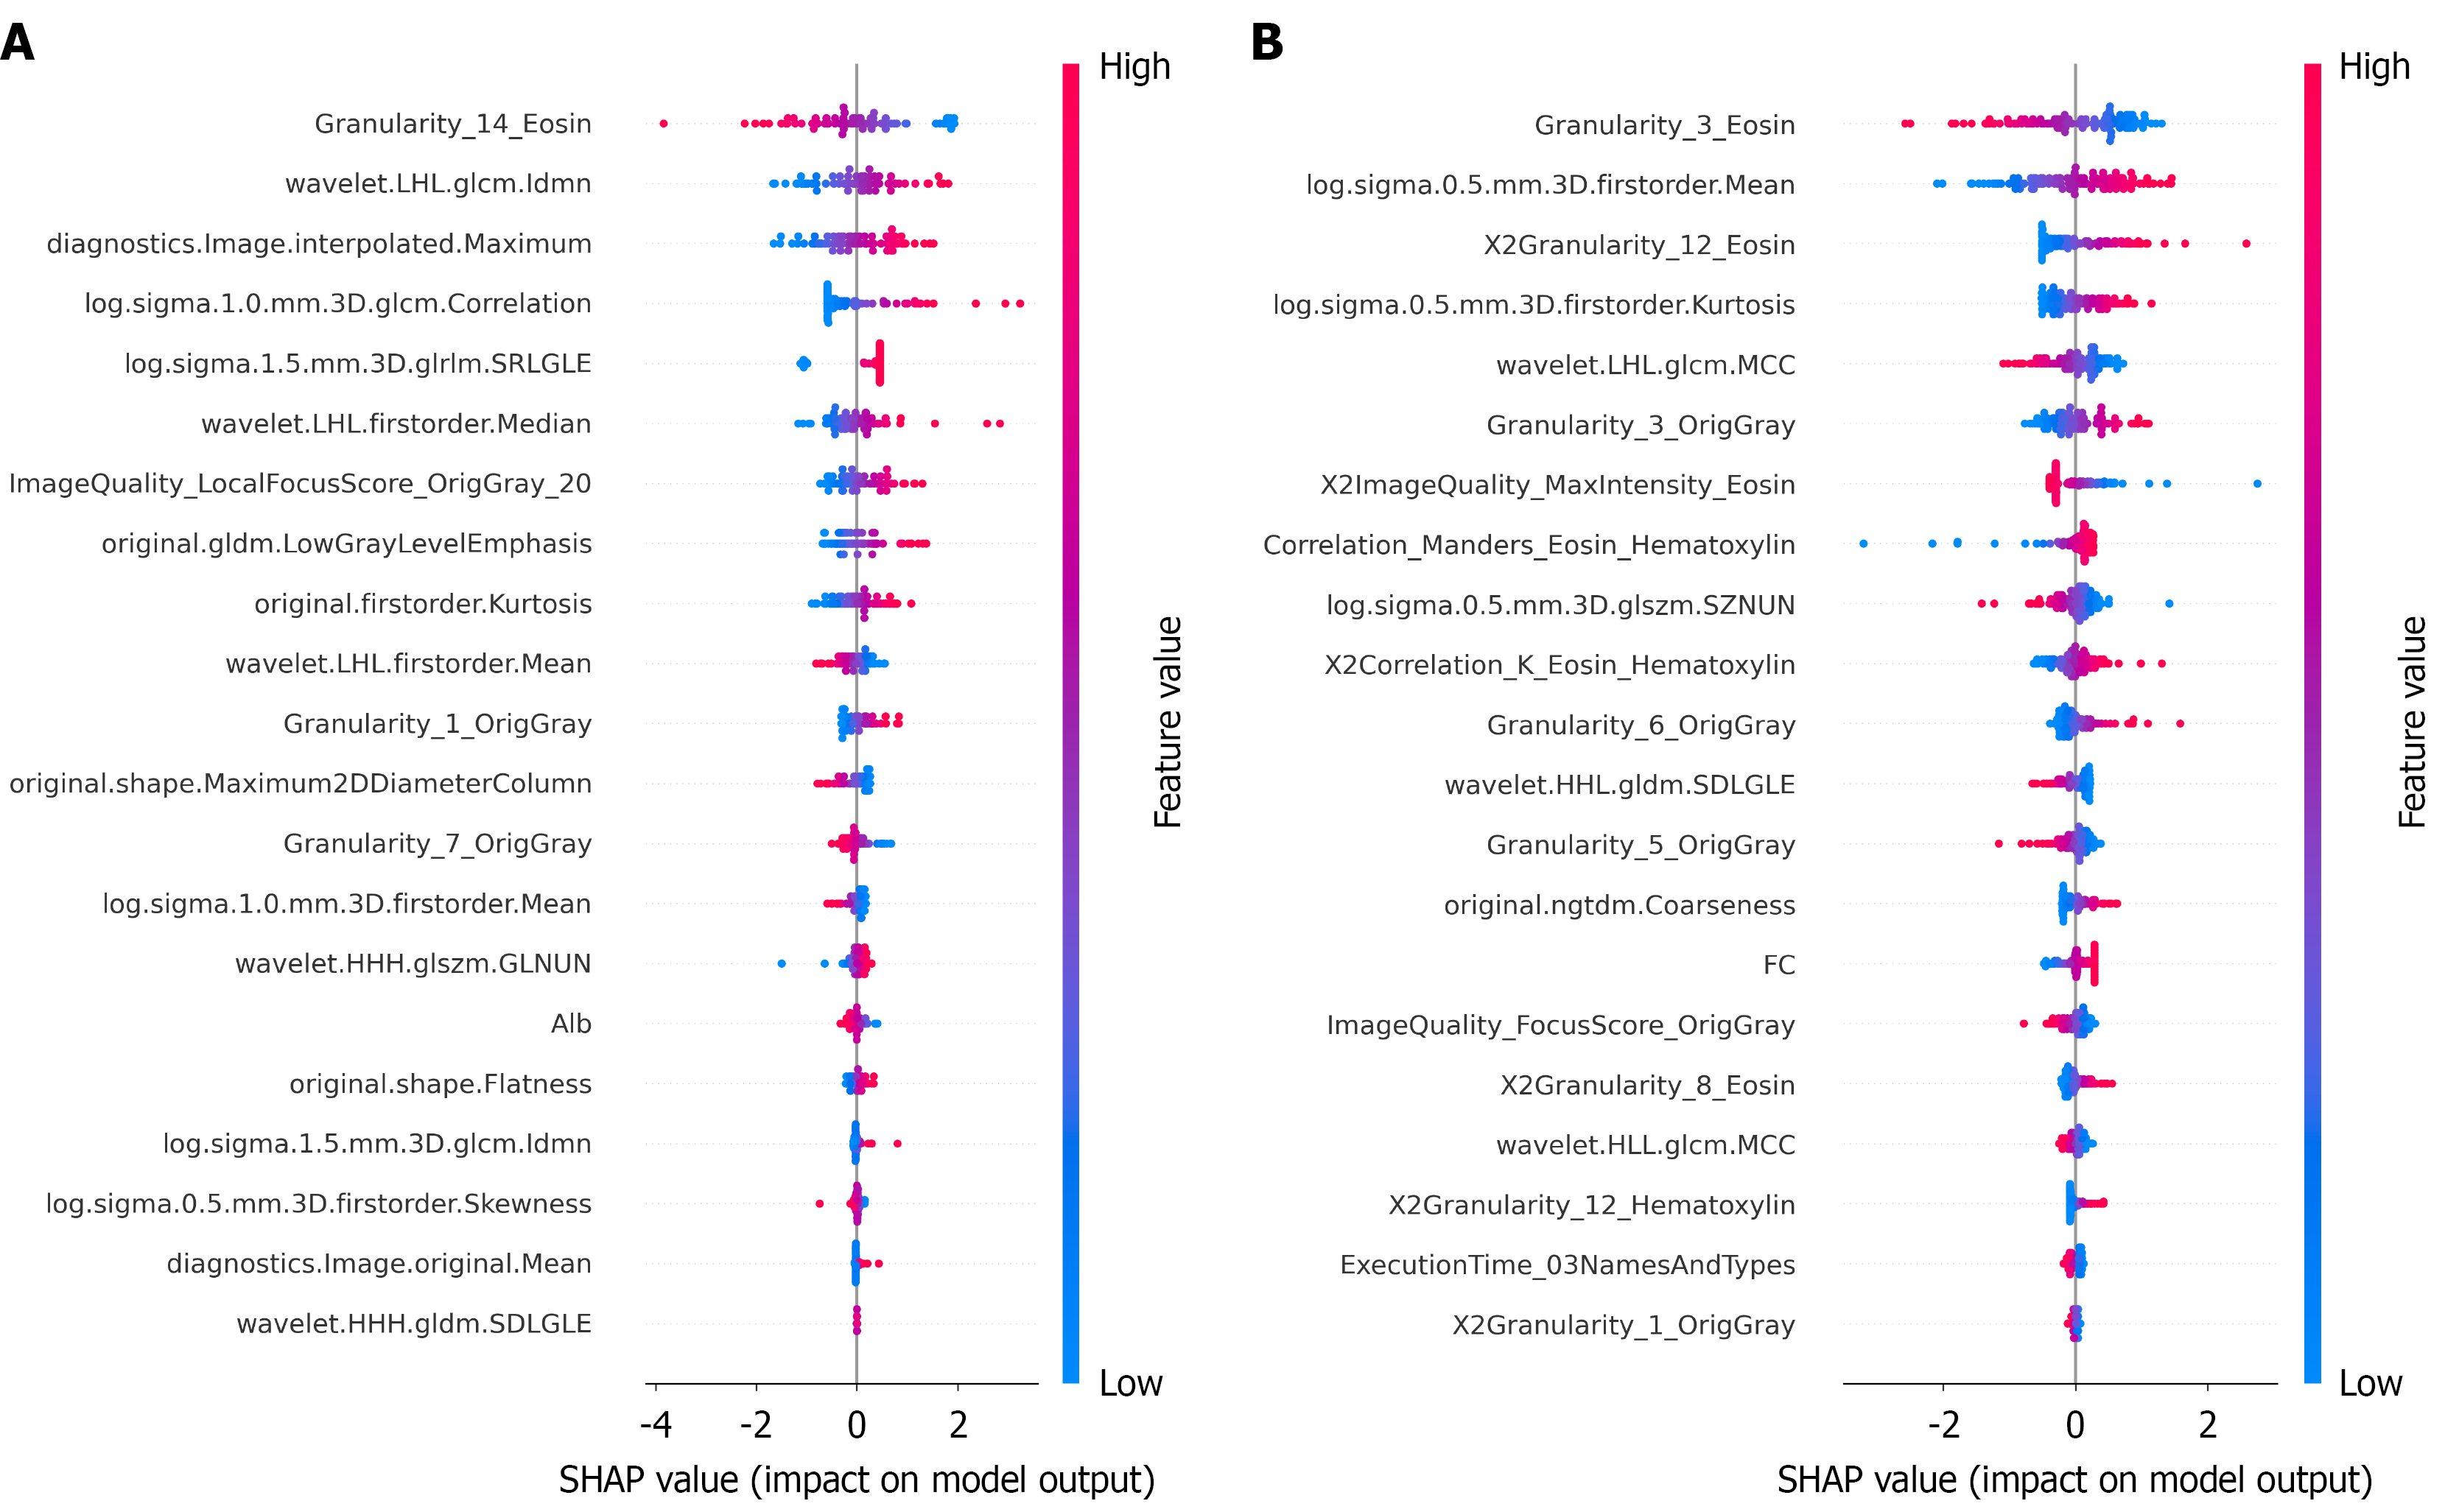
Figure 5 The SHapley Additive exPlanations beeswarm plot provides a comprehensive perspective on feature importance.
Each row represents a single feature, and the horizontal axis indicates the corresponding SHapley Additive exPlanations (SHAP) value. Individual data points represent patient samples; red indicates higher feature values, while blue represents lower values. A positive SHAP value (> 0) is associated with a reduced likelihood of mucosal healing, whereas a negative value (< 0) is correlated with an elevated probability of mucosal healing. A: This plot illustrates 21 key features, including 4 pathomics features, 16 radiomics features, and 1 clinical feature, along with their combined impacts on the prediction probability. The three most influential features are: Granularity 14 Eosin, wavelet.LHL.glcm.ldmn, and diagnostics.lmage.interpolated.Maximum; B: This plot illustrates 21 key features, including 13 pathomics features, 7 radiomics features, and 1 clinical feature, along with their combined impacts on the prediction probability. The three most influential features are: Granularity 3 Eosin, log.sigma.0.5.mm.3D. firstorder. Mean, and X2Granularity 12 Eosin. They play important roles in the interpretability of the model and feature correlation. Alb: Albumin; FC: Fecal calprotectin; SHAP: SHapley Additive exPlanations.
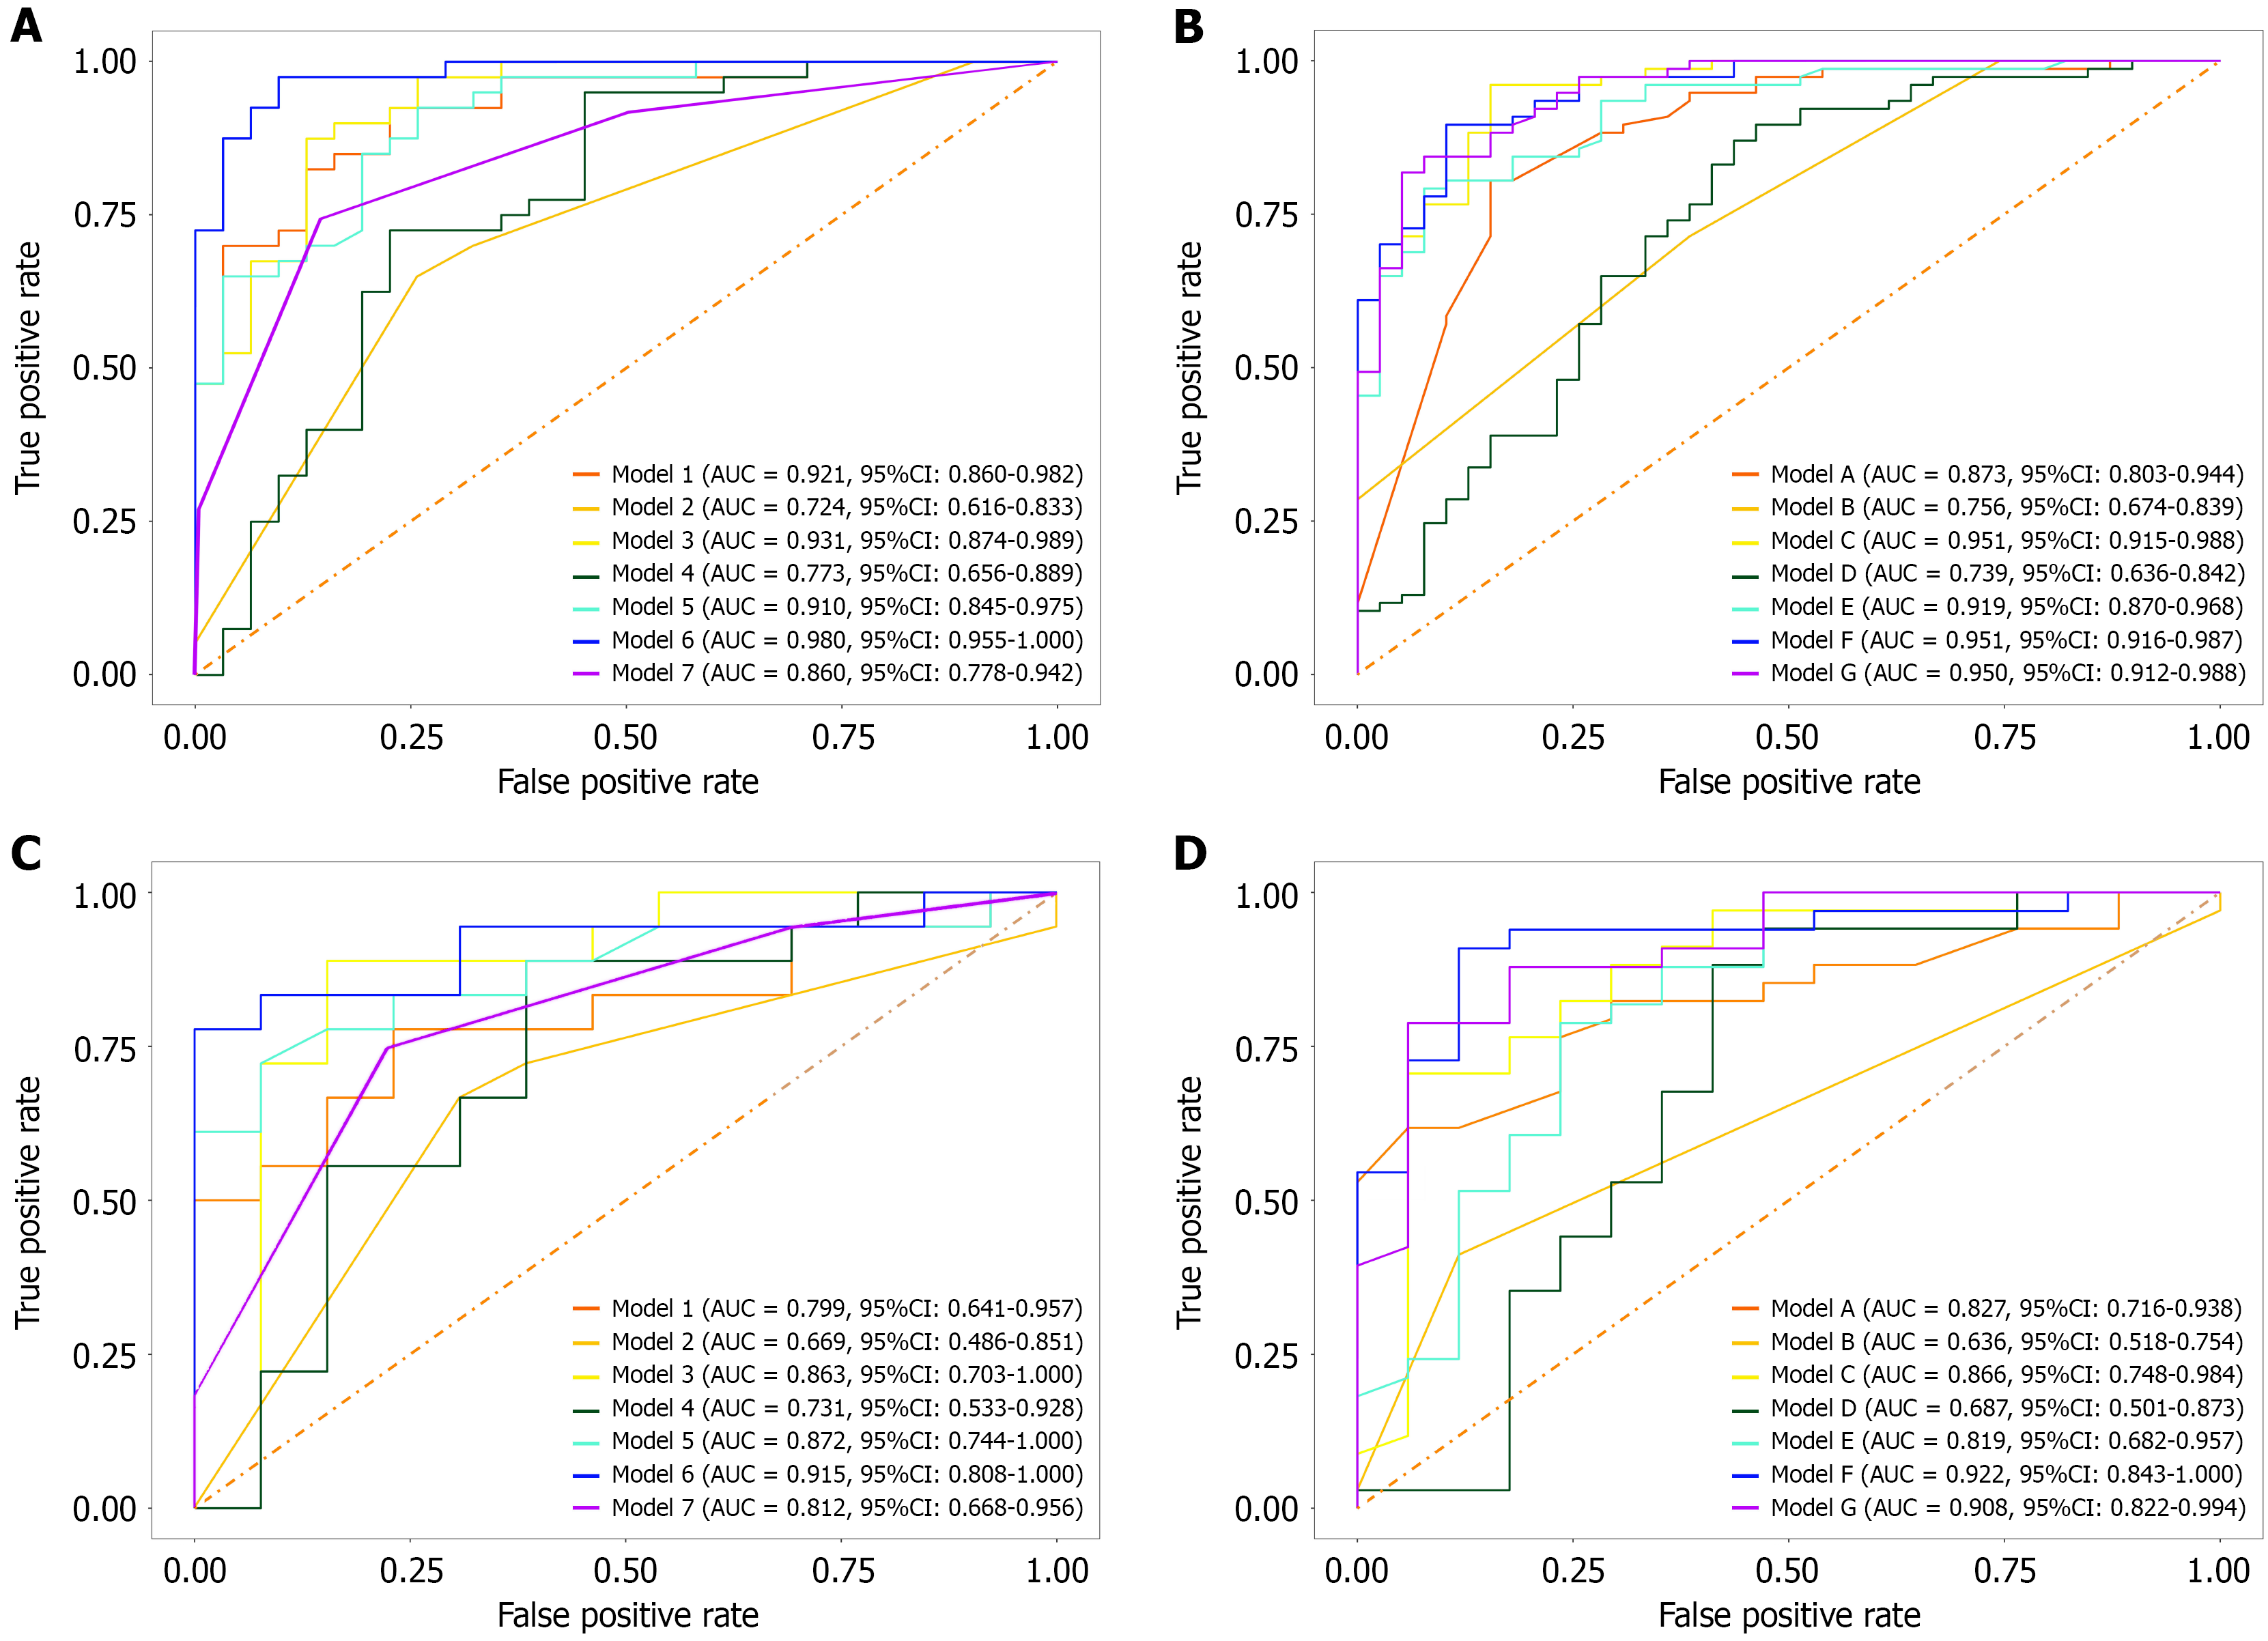
Figure 6 In the ileal and ileocolonic region, performance of all models in the train set and testing set.
A and B: Train set; C and D: Testing set. AUC: Area under the curve; CI: Confidence interval.
- Citation: Zhang H, Liu HM, Pei JX, Hu J, Zhu C, Liu KC, Rong C, Zheng XM, Shen Y, Cai YP, Wu XW. Baseline multimodal clinical-radiomics-pathomics model predicts mucosal healing in Crohn’s disease after infliximab therapy. World J Gastroenterol 2026; 32(25): 119071
- URL: https://www.wjgnet.com/1007-9327/full/v32/i25/119071.htm
- DOI: https://dx.doi.org/10.3748/wjg.119071