
















Copyright: ©Author(s) 2026.
World J Gastroenterol. Jul 7, 2026; 32(25): 118842
Published online Jul 7, 2026. doi: 10.3748/wjg.118842
Published online Jul 7, 2026. doi: 10.3748/wjg.118842
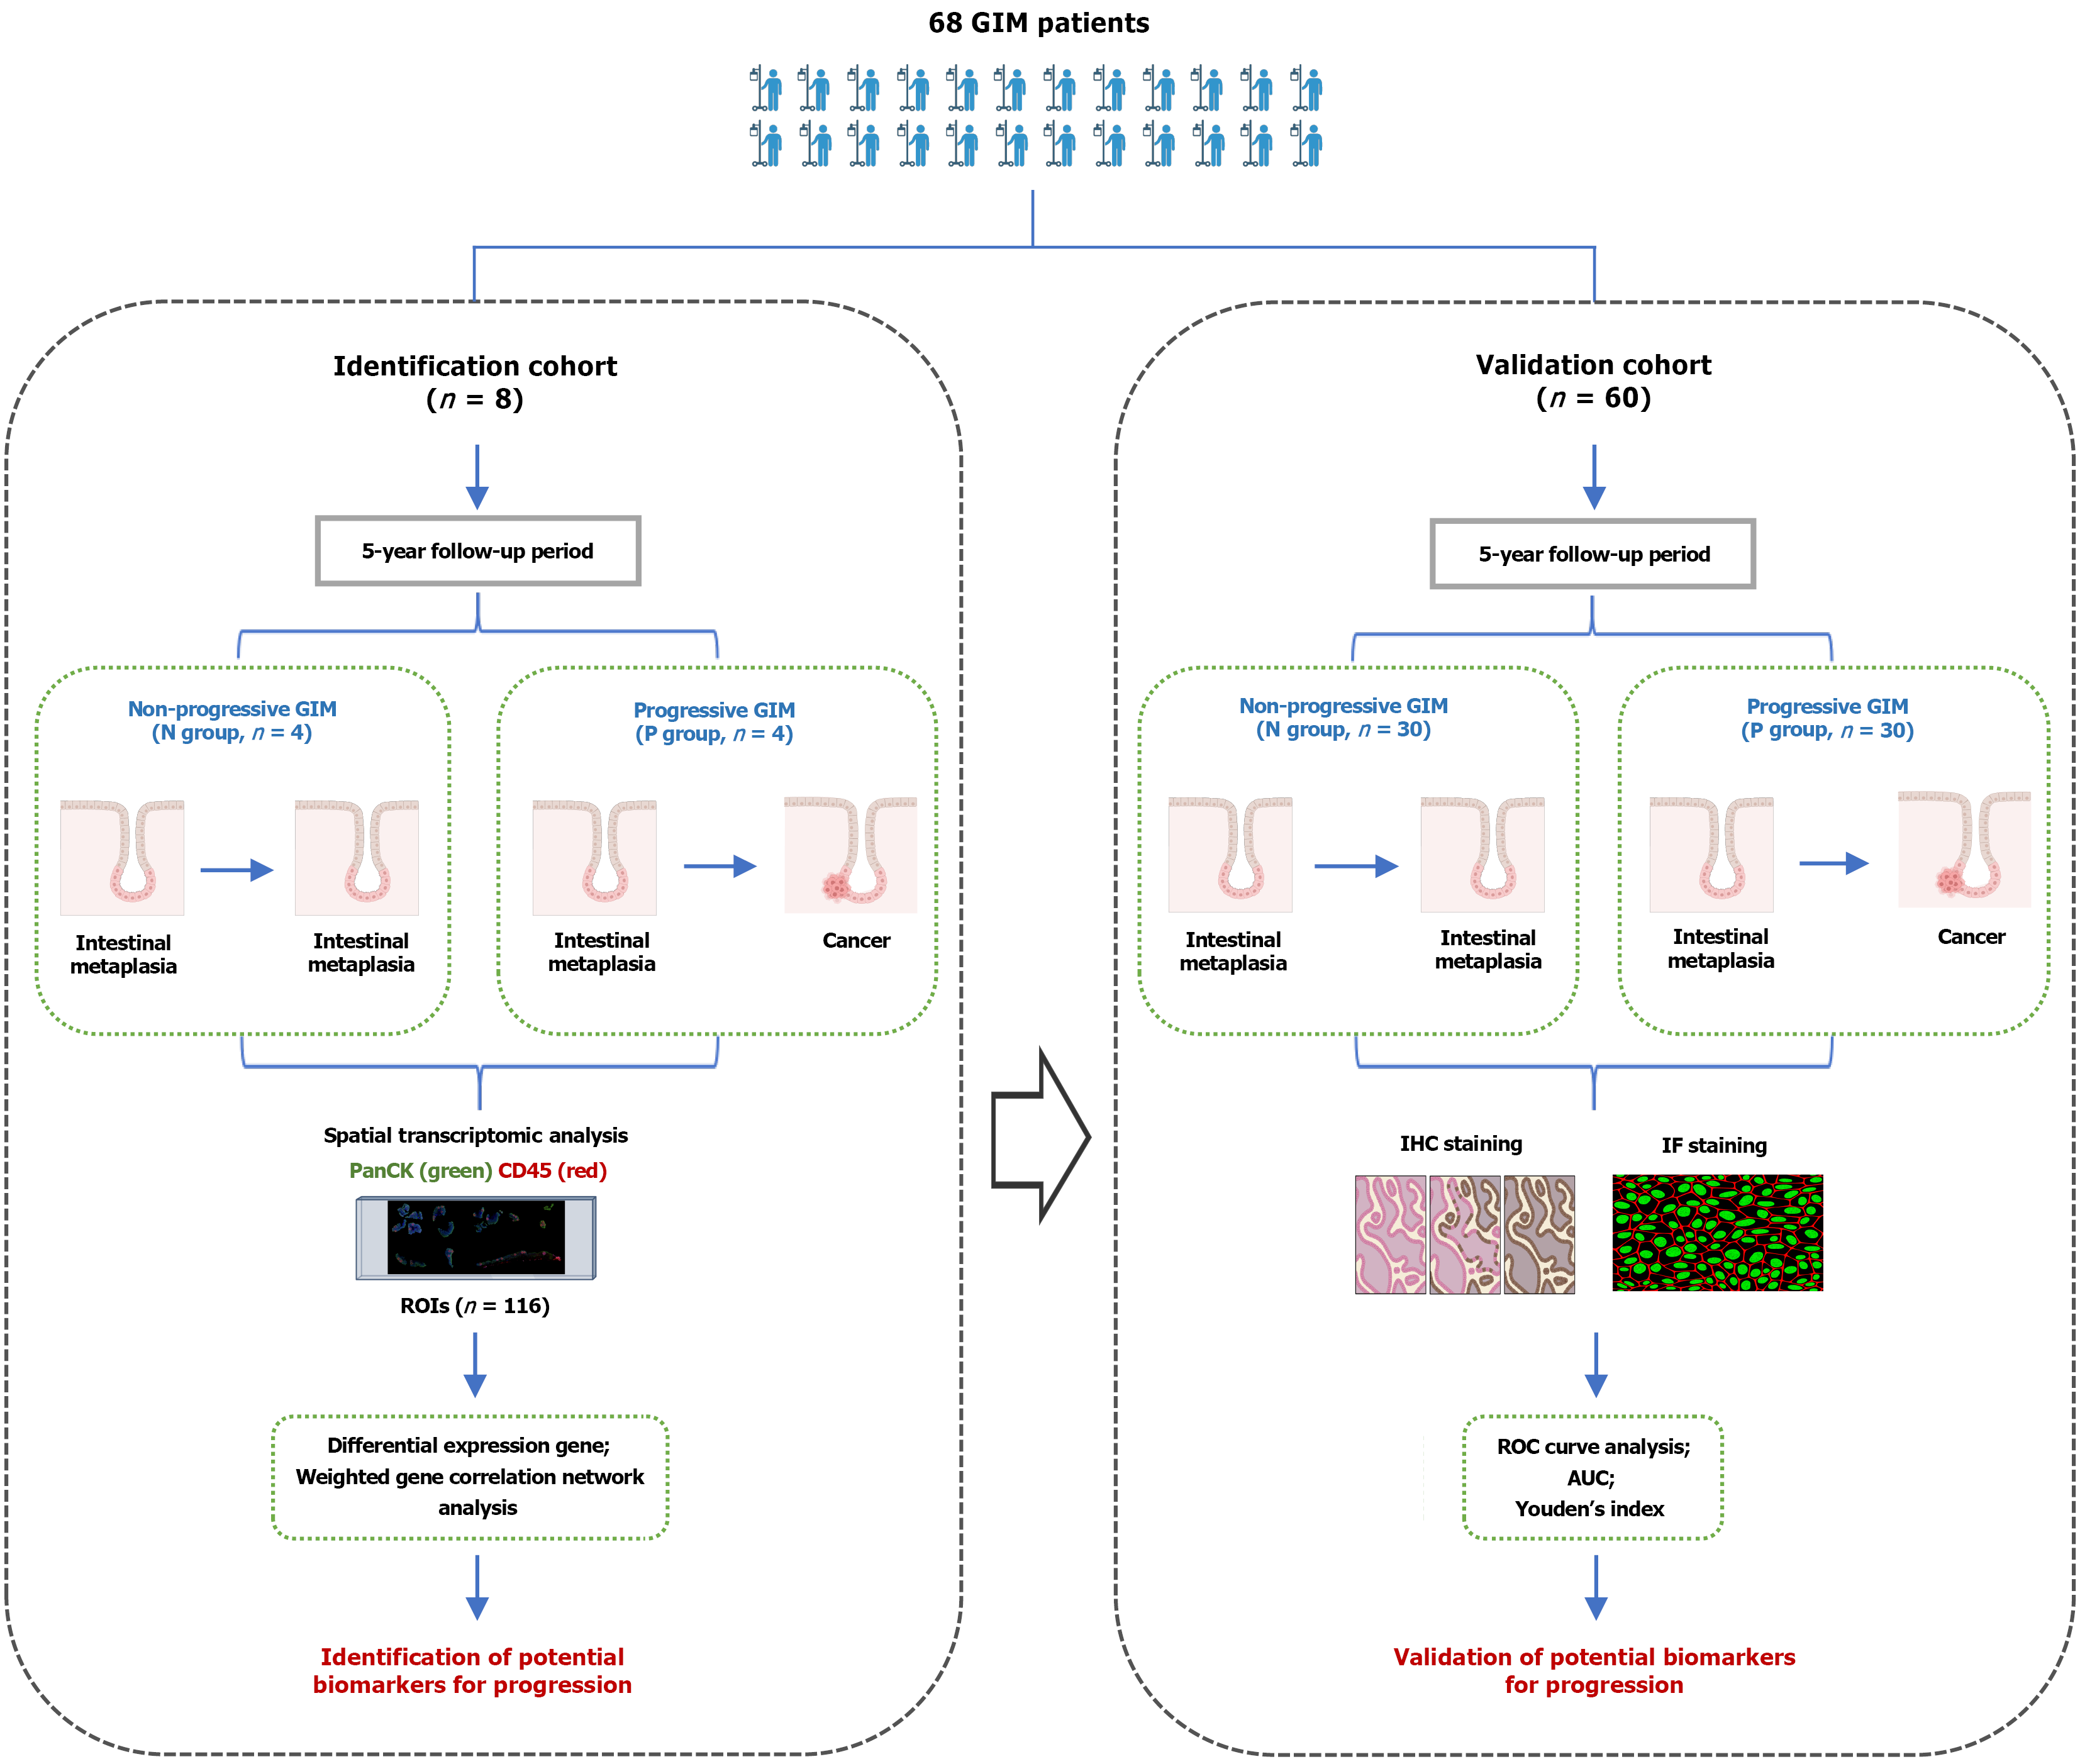
Figure 1 Flowchart of the study.
GIM: Gastric intestinal metaplasia; N group: Non-progression group; P group: Progression group; PanCK: Pan-cytokeratin; CD: Cluster of differentiation; ROIs: Regions of interest; IHC: Immunohistochemical; IF: Immunofluorescence; ROC: Receiver operating characteristic; AUC: Area under the curve.
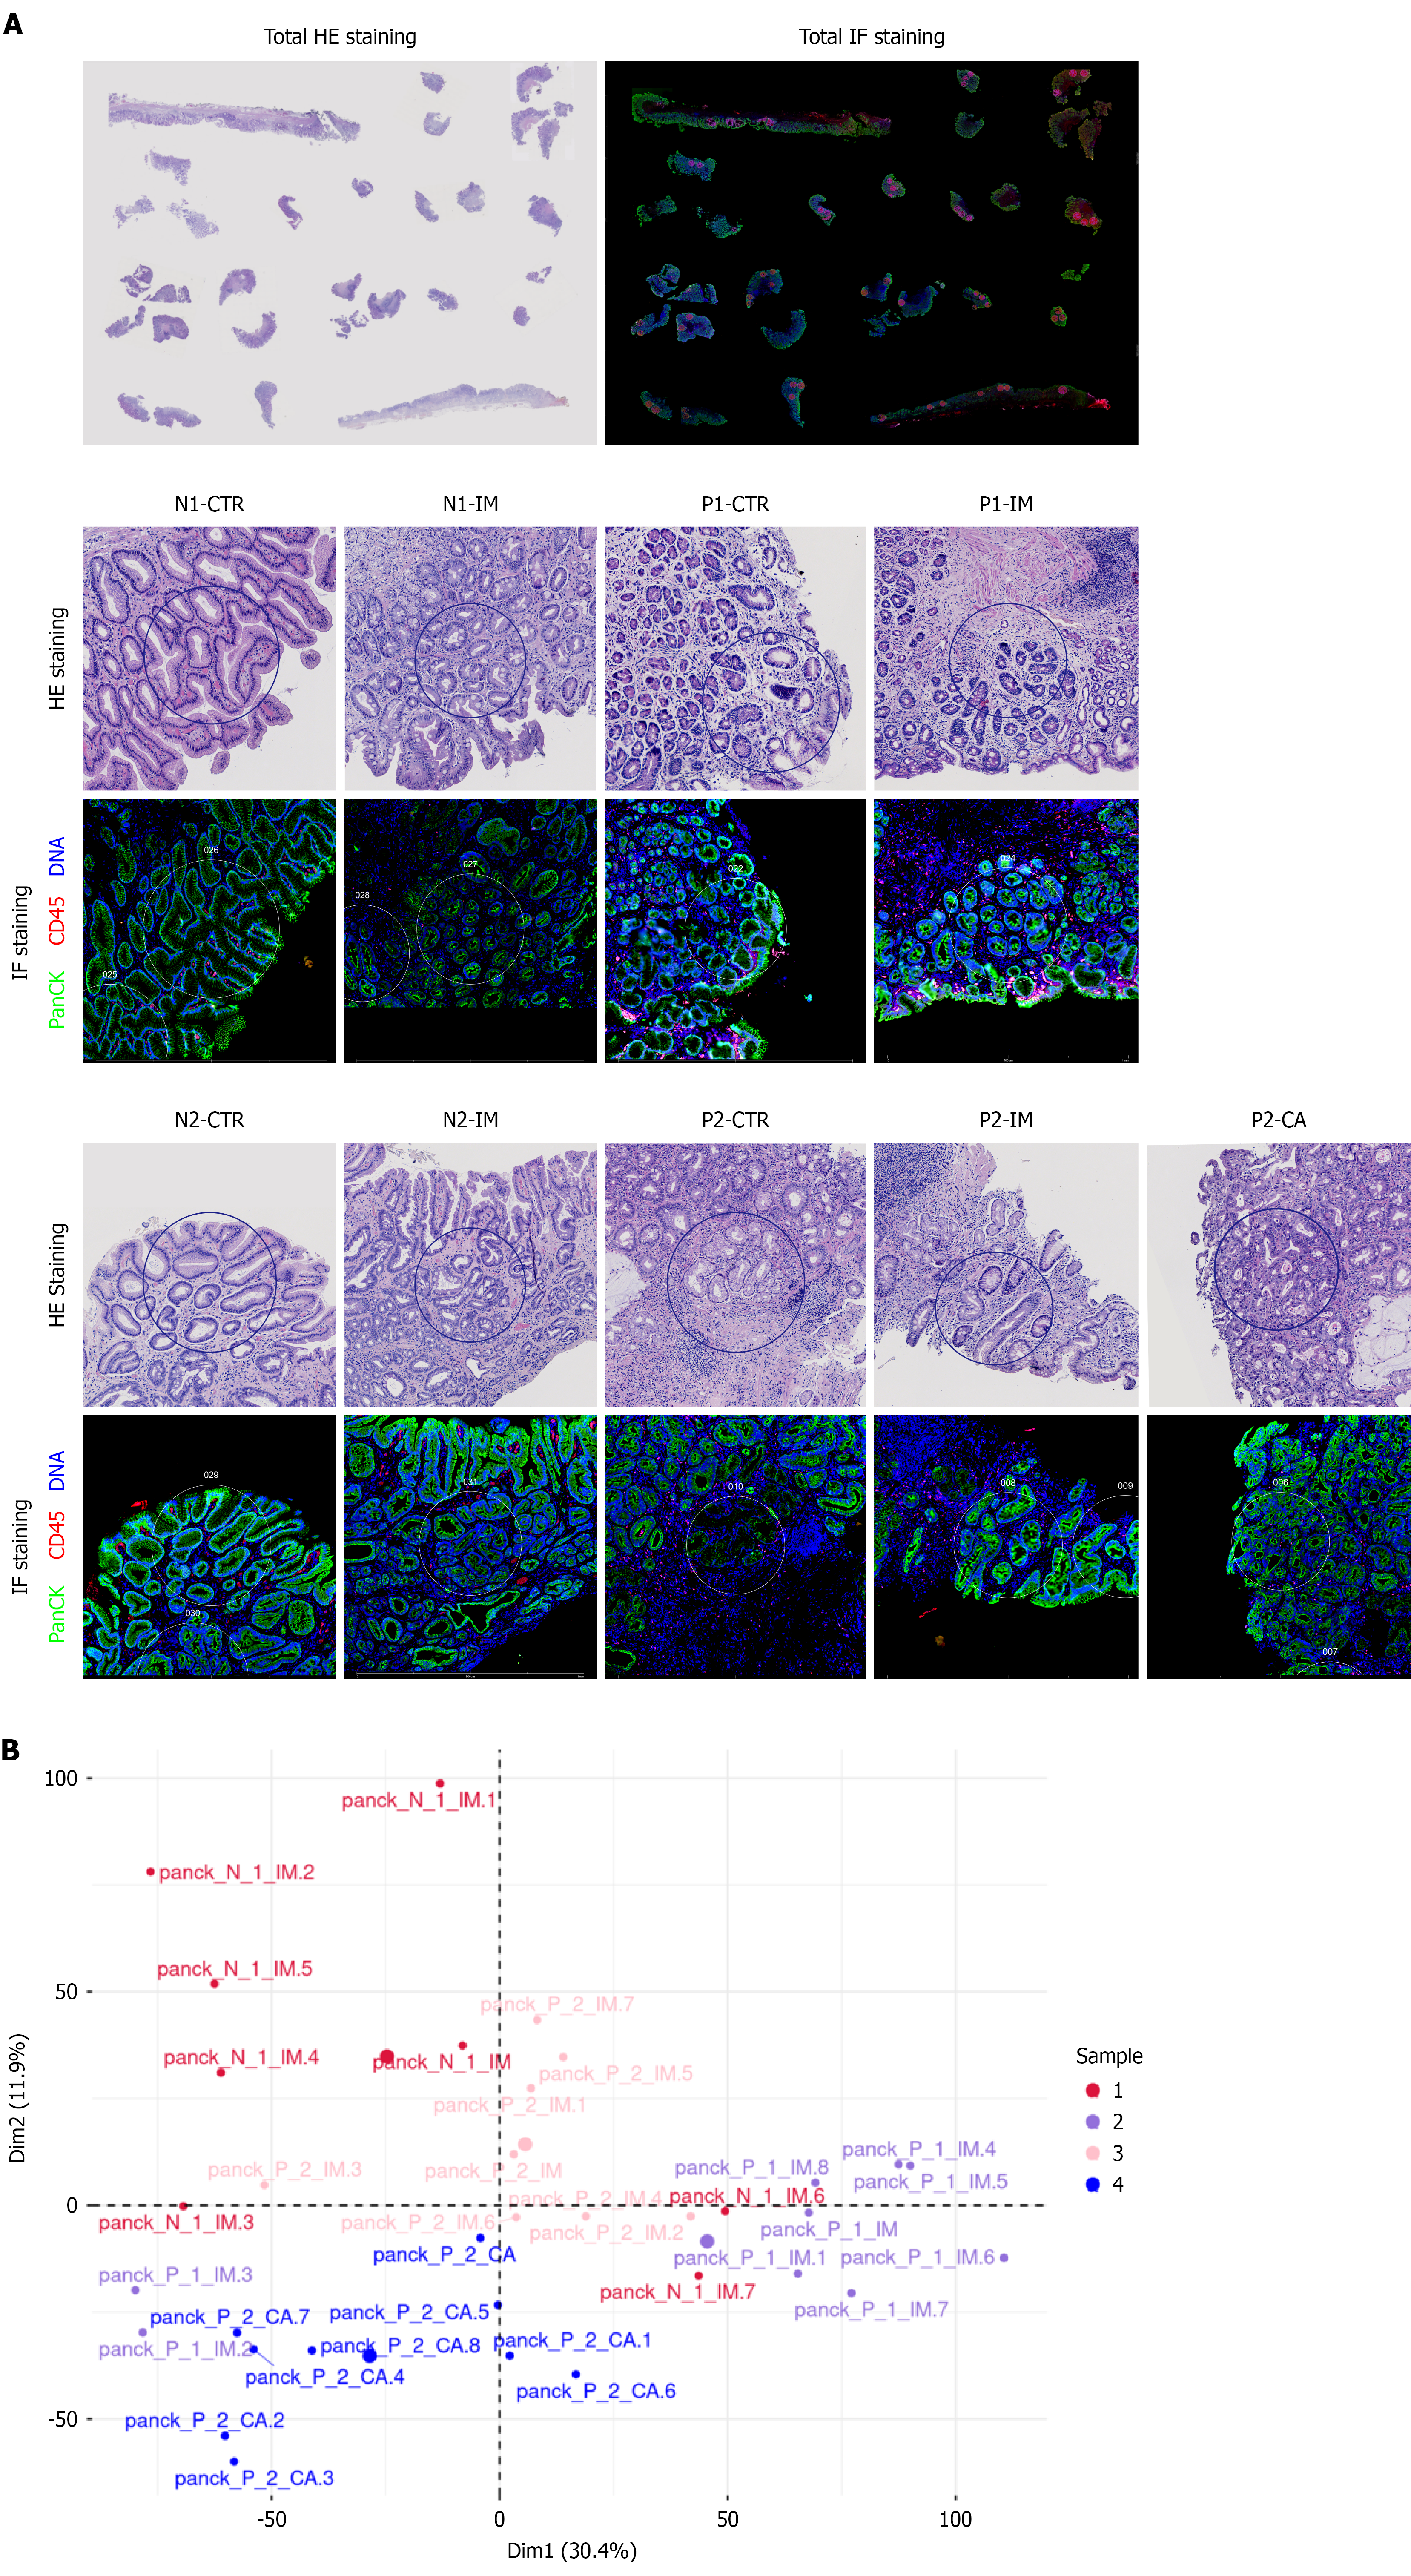
Figure 2 Digital spatial profiling of formalin-fixed, paraffin-embedded samples from gastric intestinal metaplasia patients.
A: Representative hematoxylin-eosin and immunofluorescence staining of regions of interest (ROIs); B: Principal component analysis for dimensionality reduction, visualizing all ROIs based on overall gene expression profiles, including the start of observation was defined as the time of the first gastroscopic biopsy [non-progression group (N)] N1-intestinal metaplasia (IM) (red color), progression group (P group) P1-IM (purple color), P2-IM (pink color), and P2-cancerous lesions (blue color). N group: Non-progression group; P group: Progression group; IF: Immunofluorescence; HE: Hematoxylin-eosin; PanCK: Pan-cytokeratin; CD: Cluster of differentiation; CTR: Containing normal tissue; IM: Intestinal metaplasia.
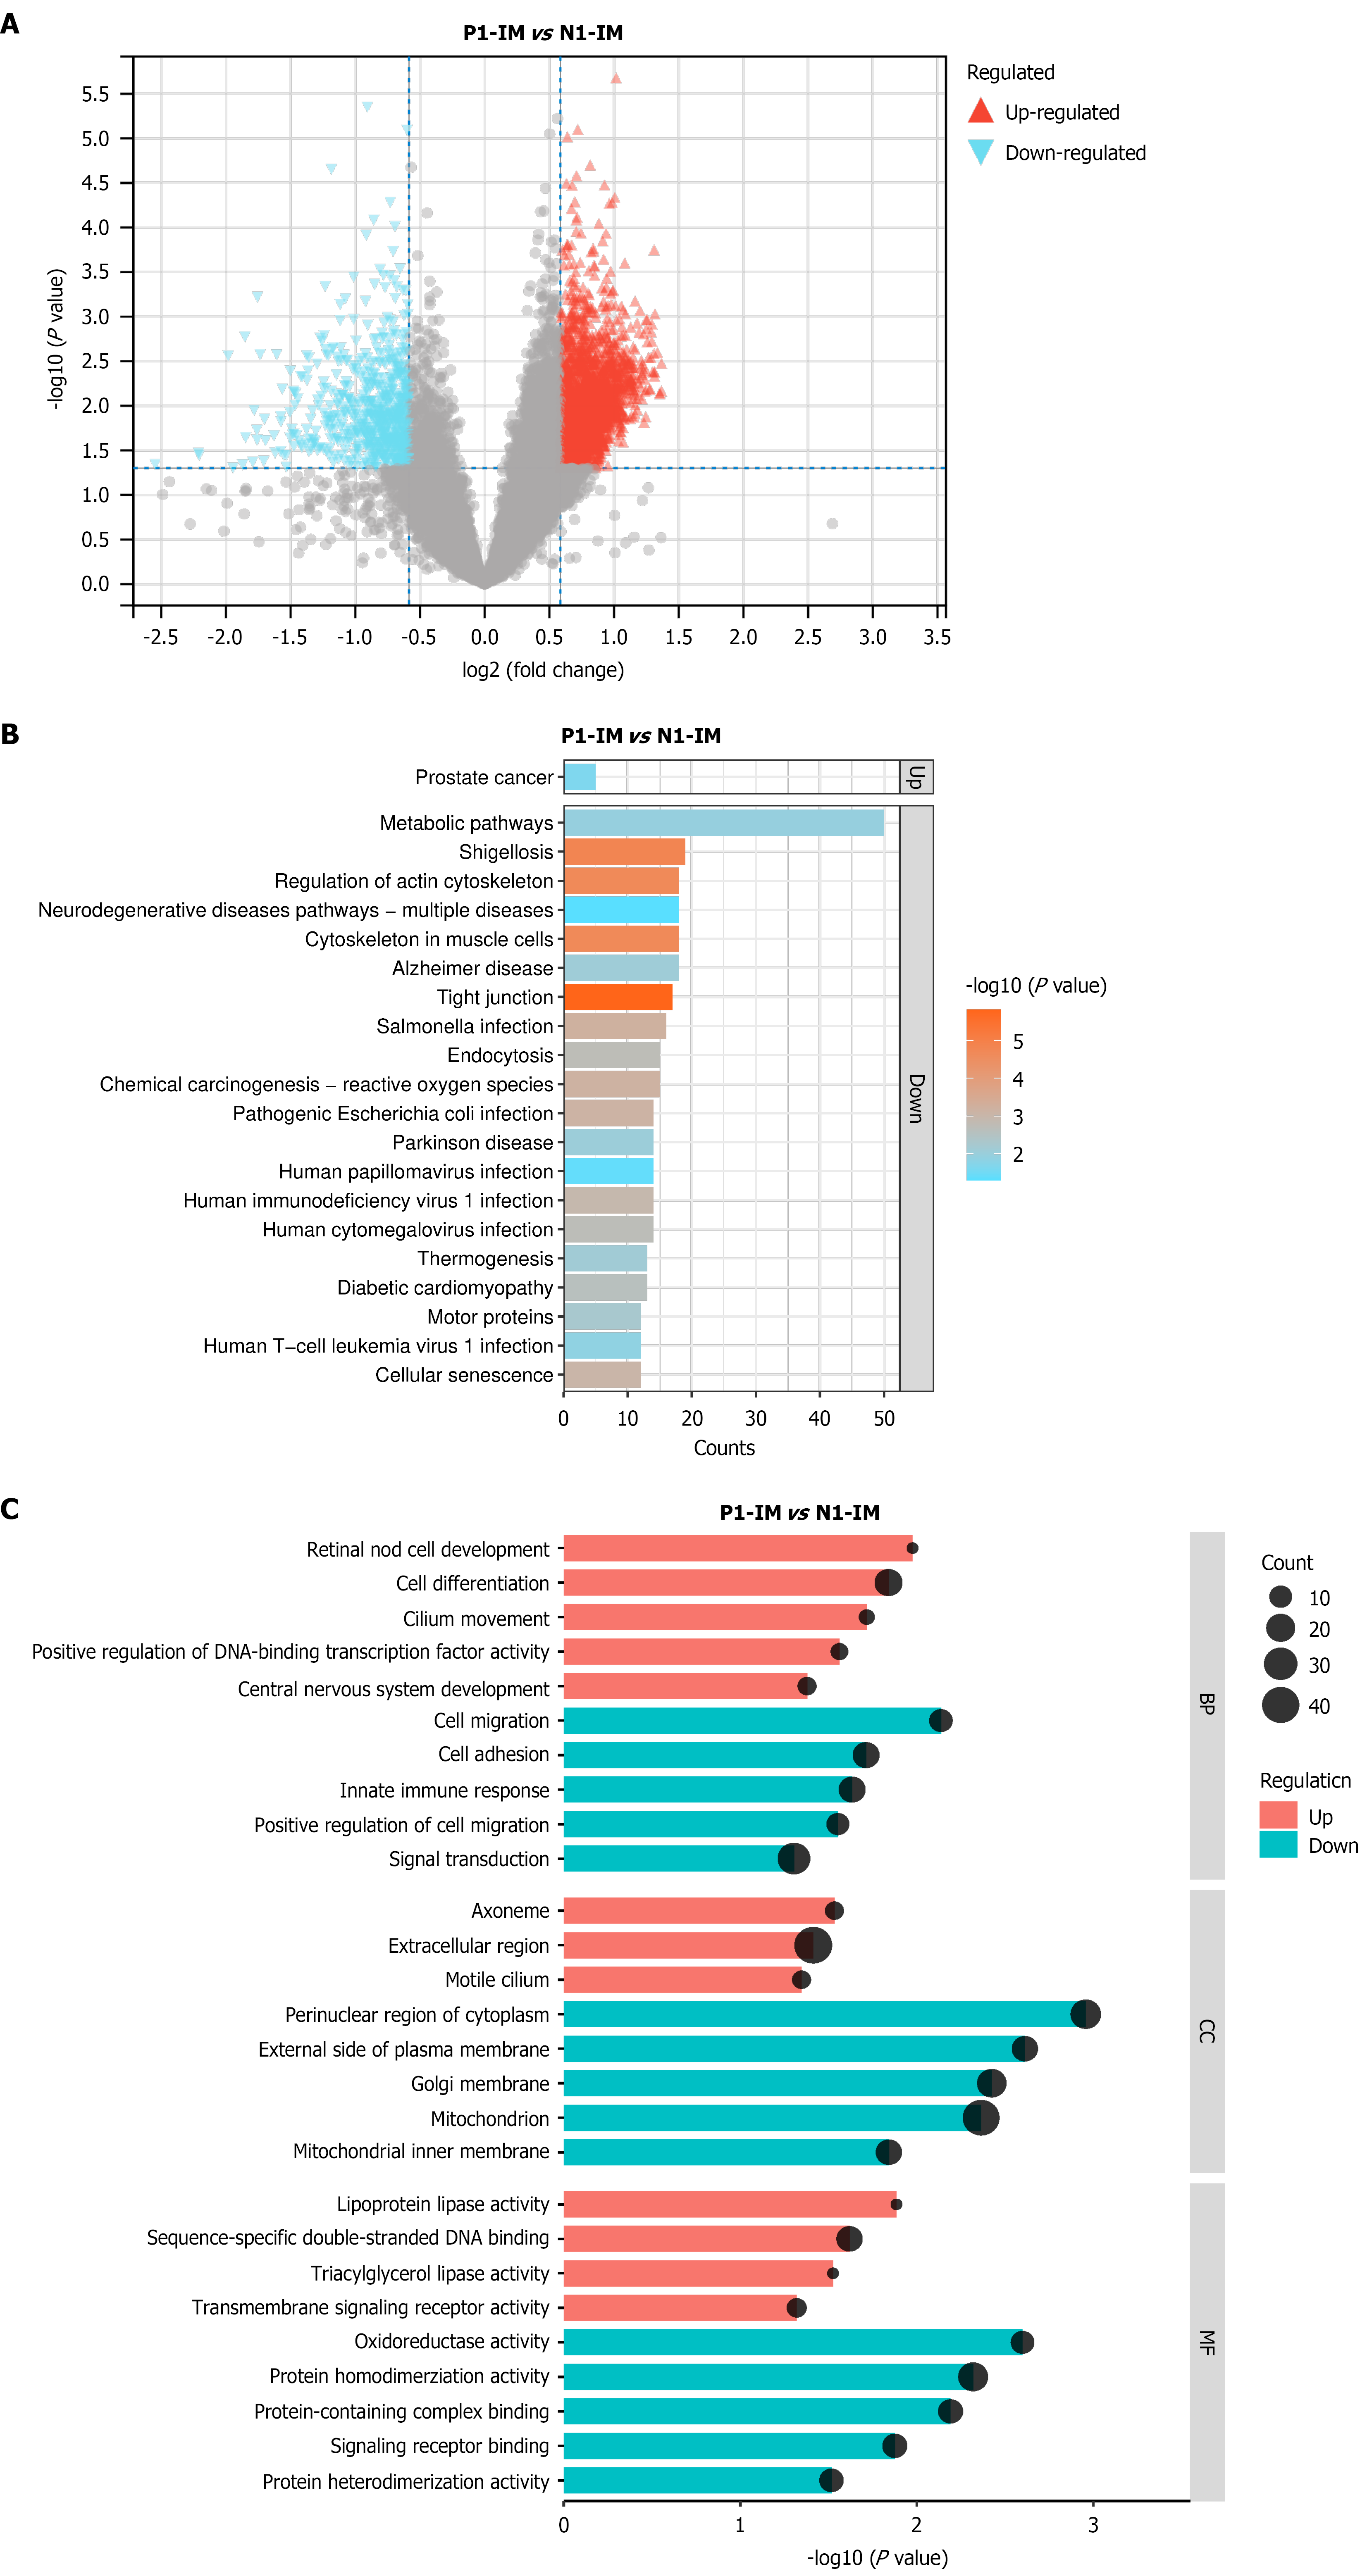
Figure 3 Gene Ontology and Kyoto Encyclopedia of Genes and Genomes pathway enrichment analyses of differentially expressed genes.
A: Volcano plot of differentially expressed genes; B: Kyoto Encyclopedia of Genes and Genomes analysis; C: Gene Ontology analysis including biological processes, cellular components, and molecular functions. N group: Non-progression group; P group: Progression group; IM: Intestinal metaplasia; BP: Biological processes; CC: Cellular components; MF: Molecular functions.
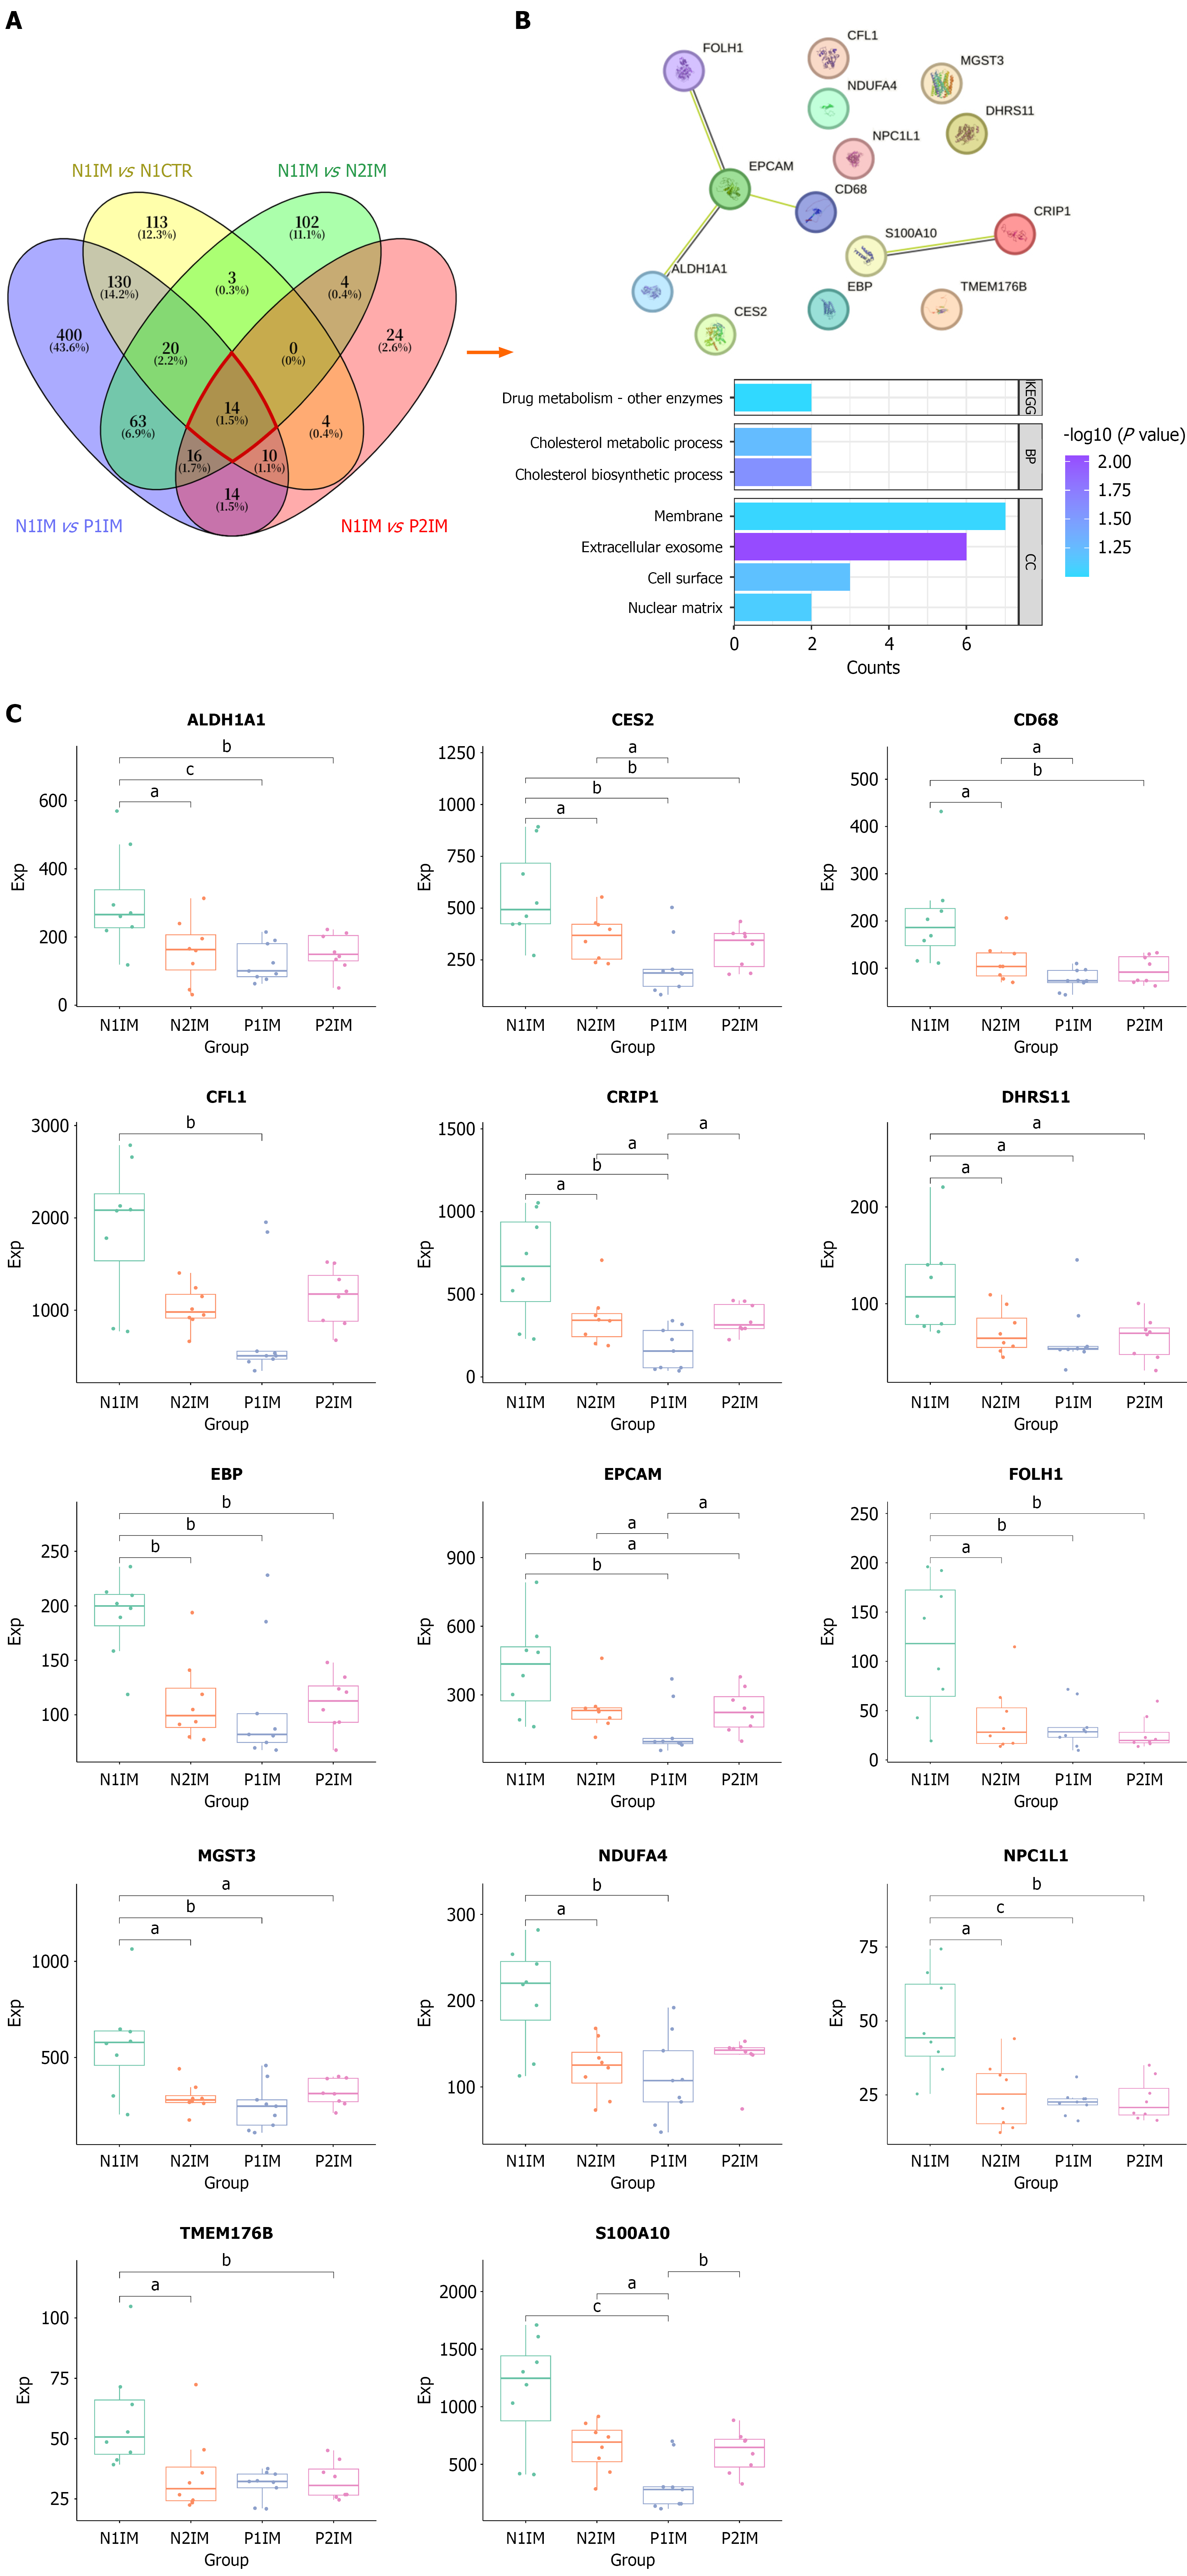
Figure 4 A total of 14 genes were identified as enriched in the pan-cytokeratin region.
A: Overlap of significantly differentially expressed genes in the pan-cytokeratin region between [non-progression group (N)] N1-intestinal metaplasia (IM) and N1-containing normal tissue, N1-IM and N2-IM, N1-IM and progression group (P group) P1-IM, and N1-IM and P2-IM; B: The protein-protein interaction network from the String Database based on 14 significantly differentially expressed genes and enrichment analysis results of these genes; C: The expression levels of 14 genes are shown by boxplots. P compared to N1-IM. aP < 0.05. bP < 0.01. cP < 0.001. N group: Non-progression group; P group: Progression group; IM: Intestinal metaplasia.
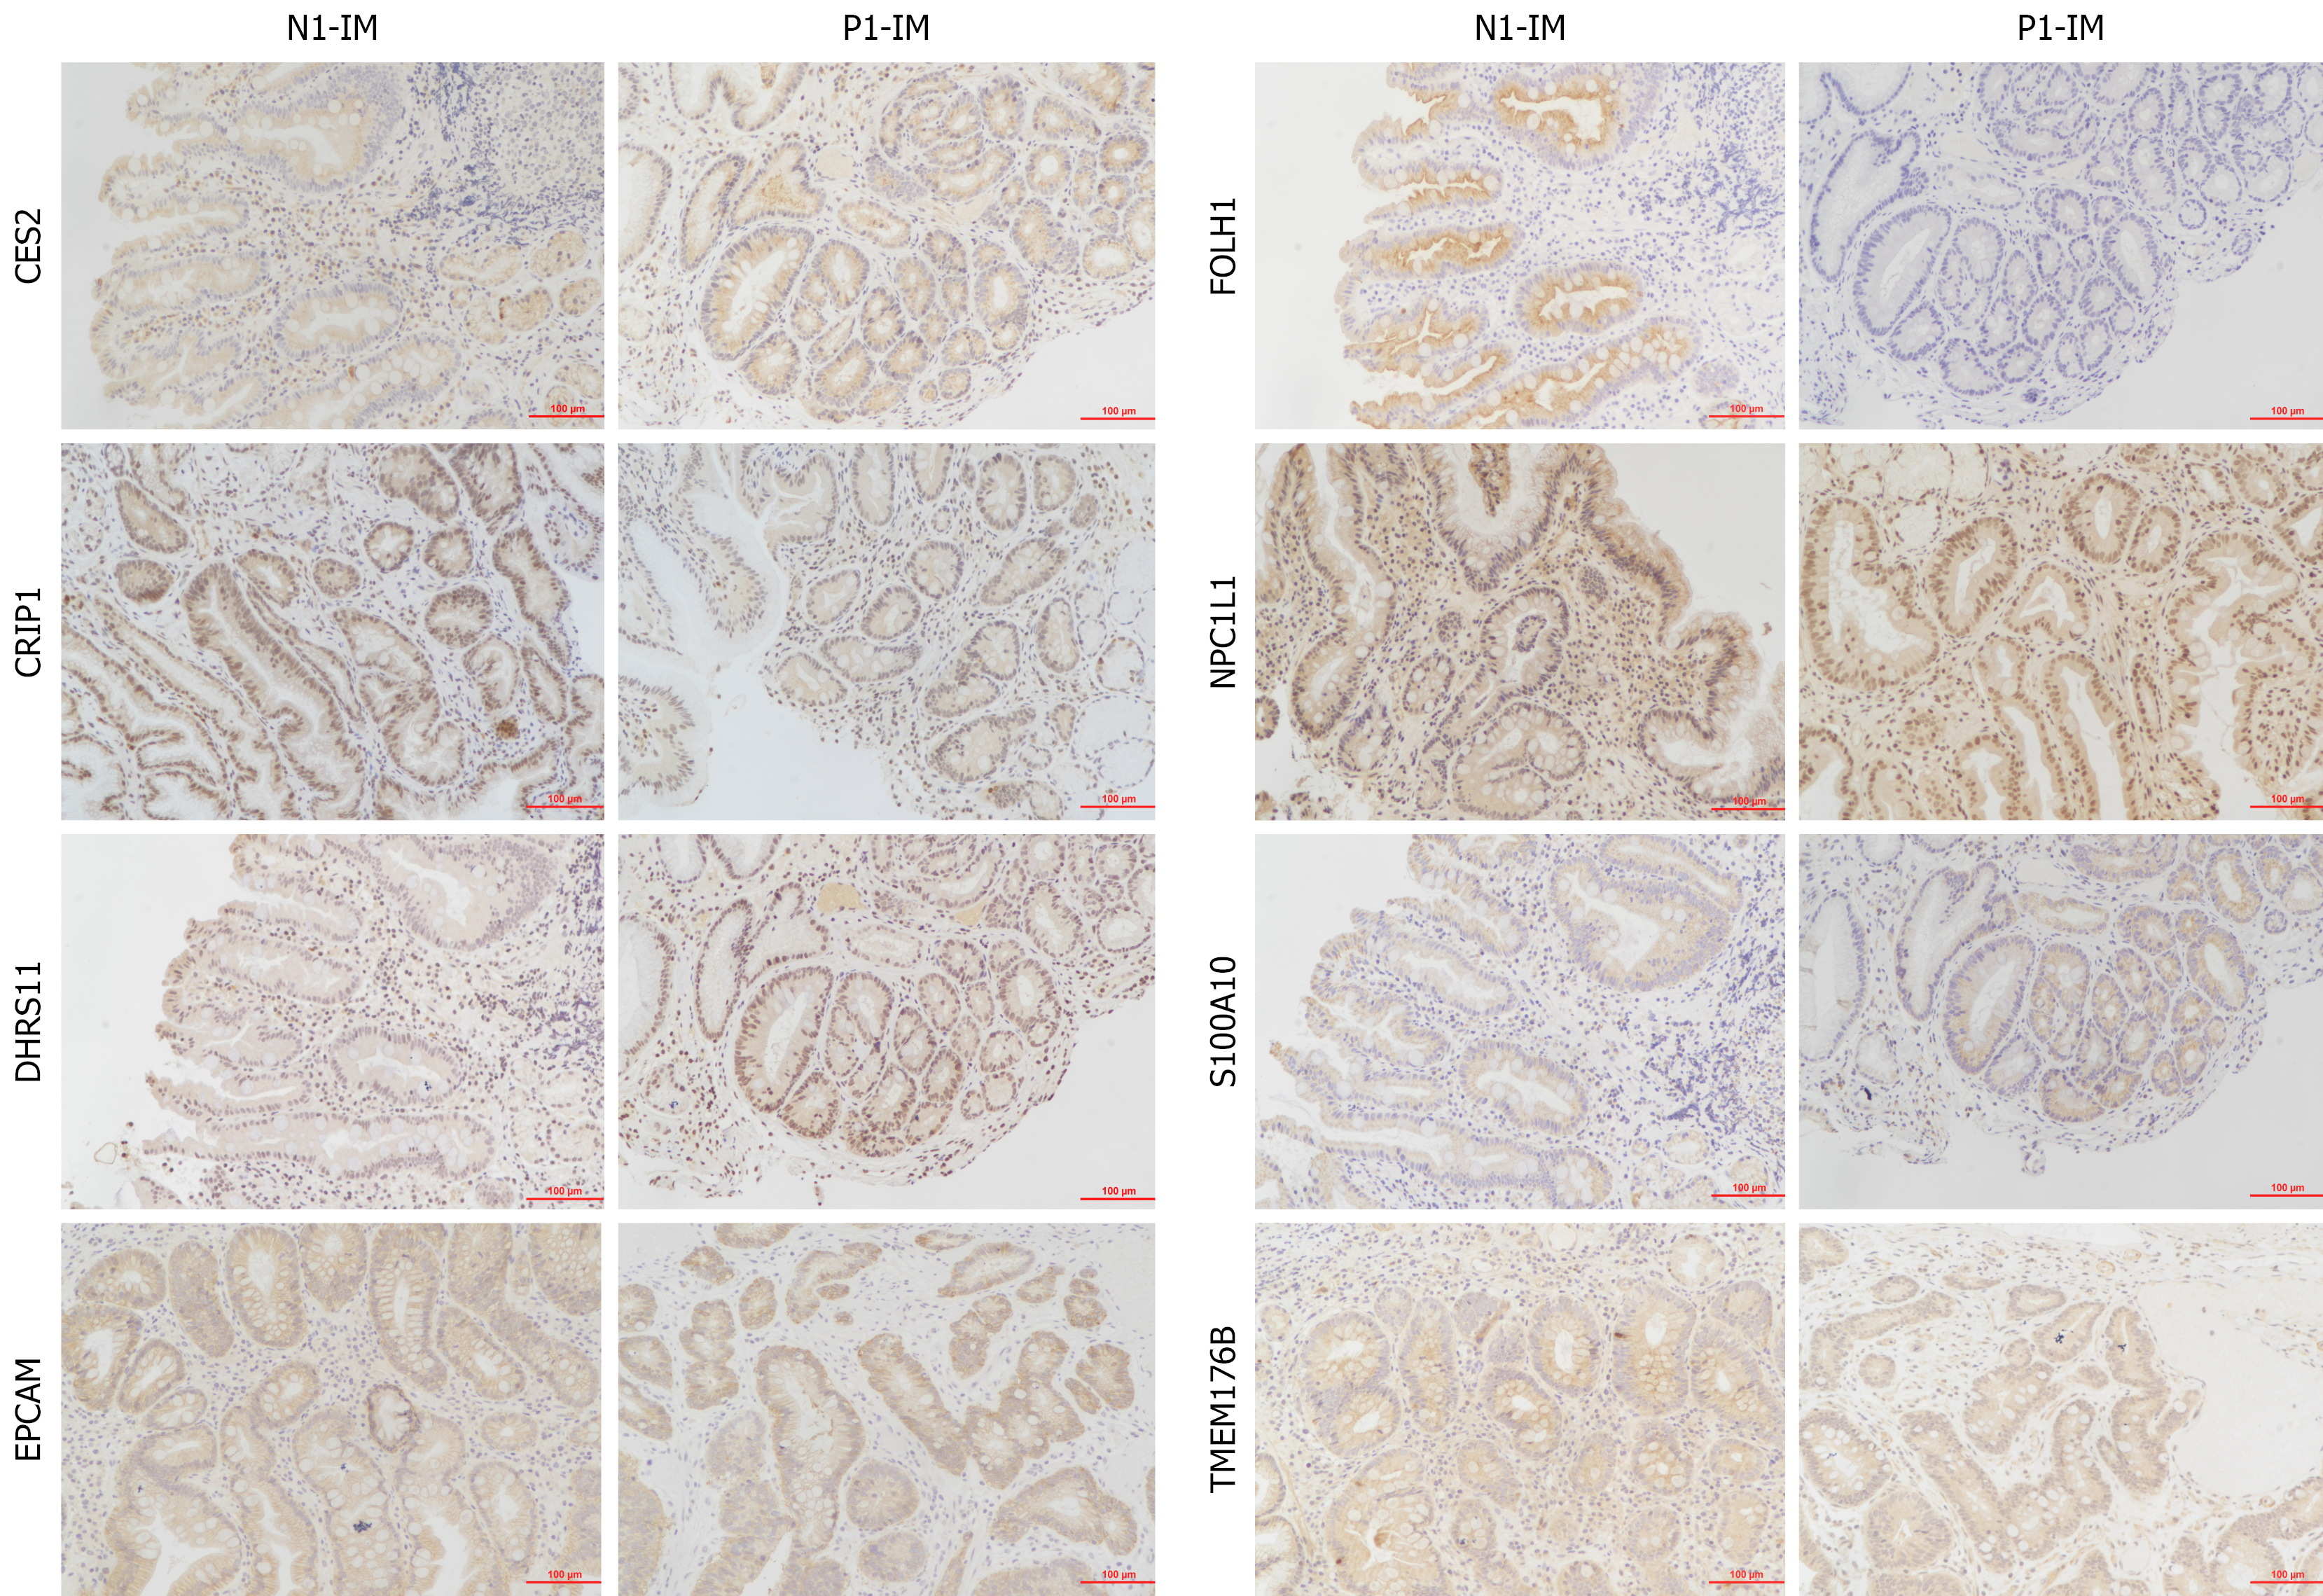
Figure 5 Immunohistochemical staining of additional gastric intestinal metaplasia patients.
Positive staining for CES2, CRIP1, DHRS11, EPCAM, FOLH1, NPC1 L1, S100A10, and TMEM176B is observed in brown color. N group: Non-progression group; P group: Progression group; IM: Intestinal metaplasia.
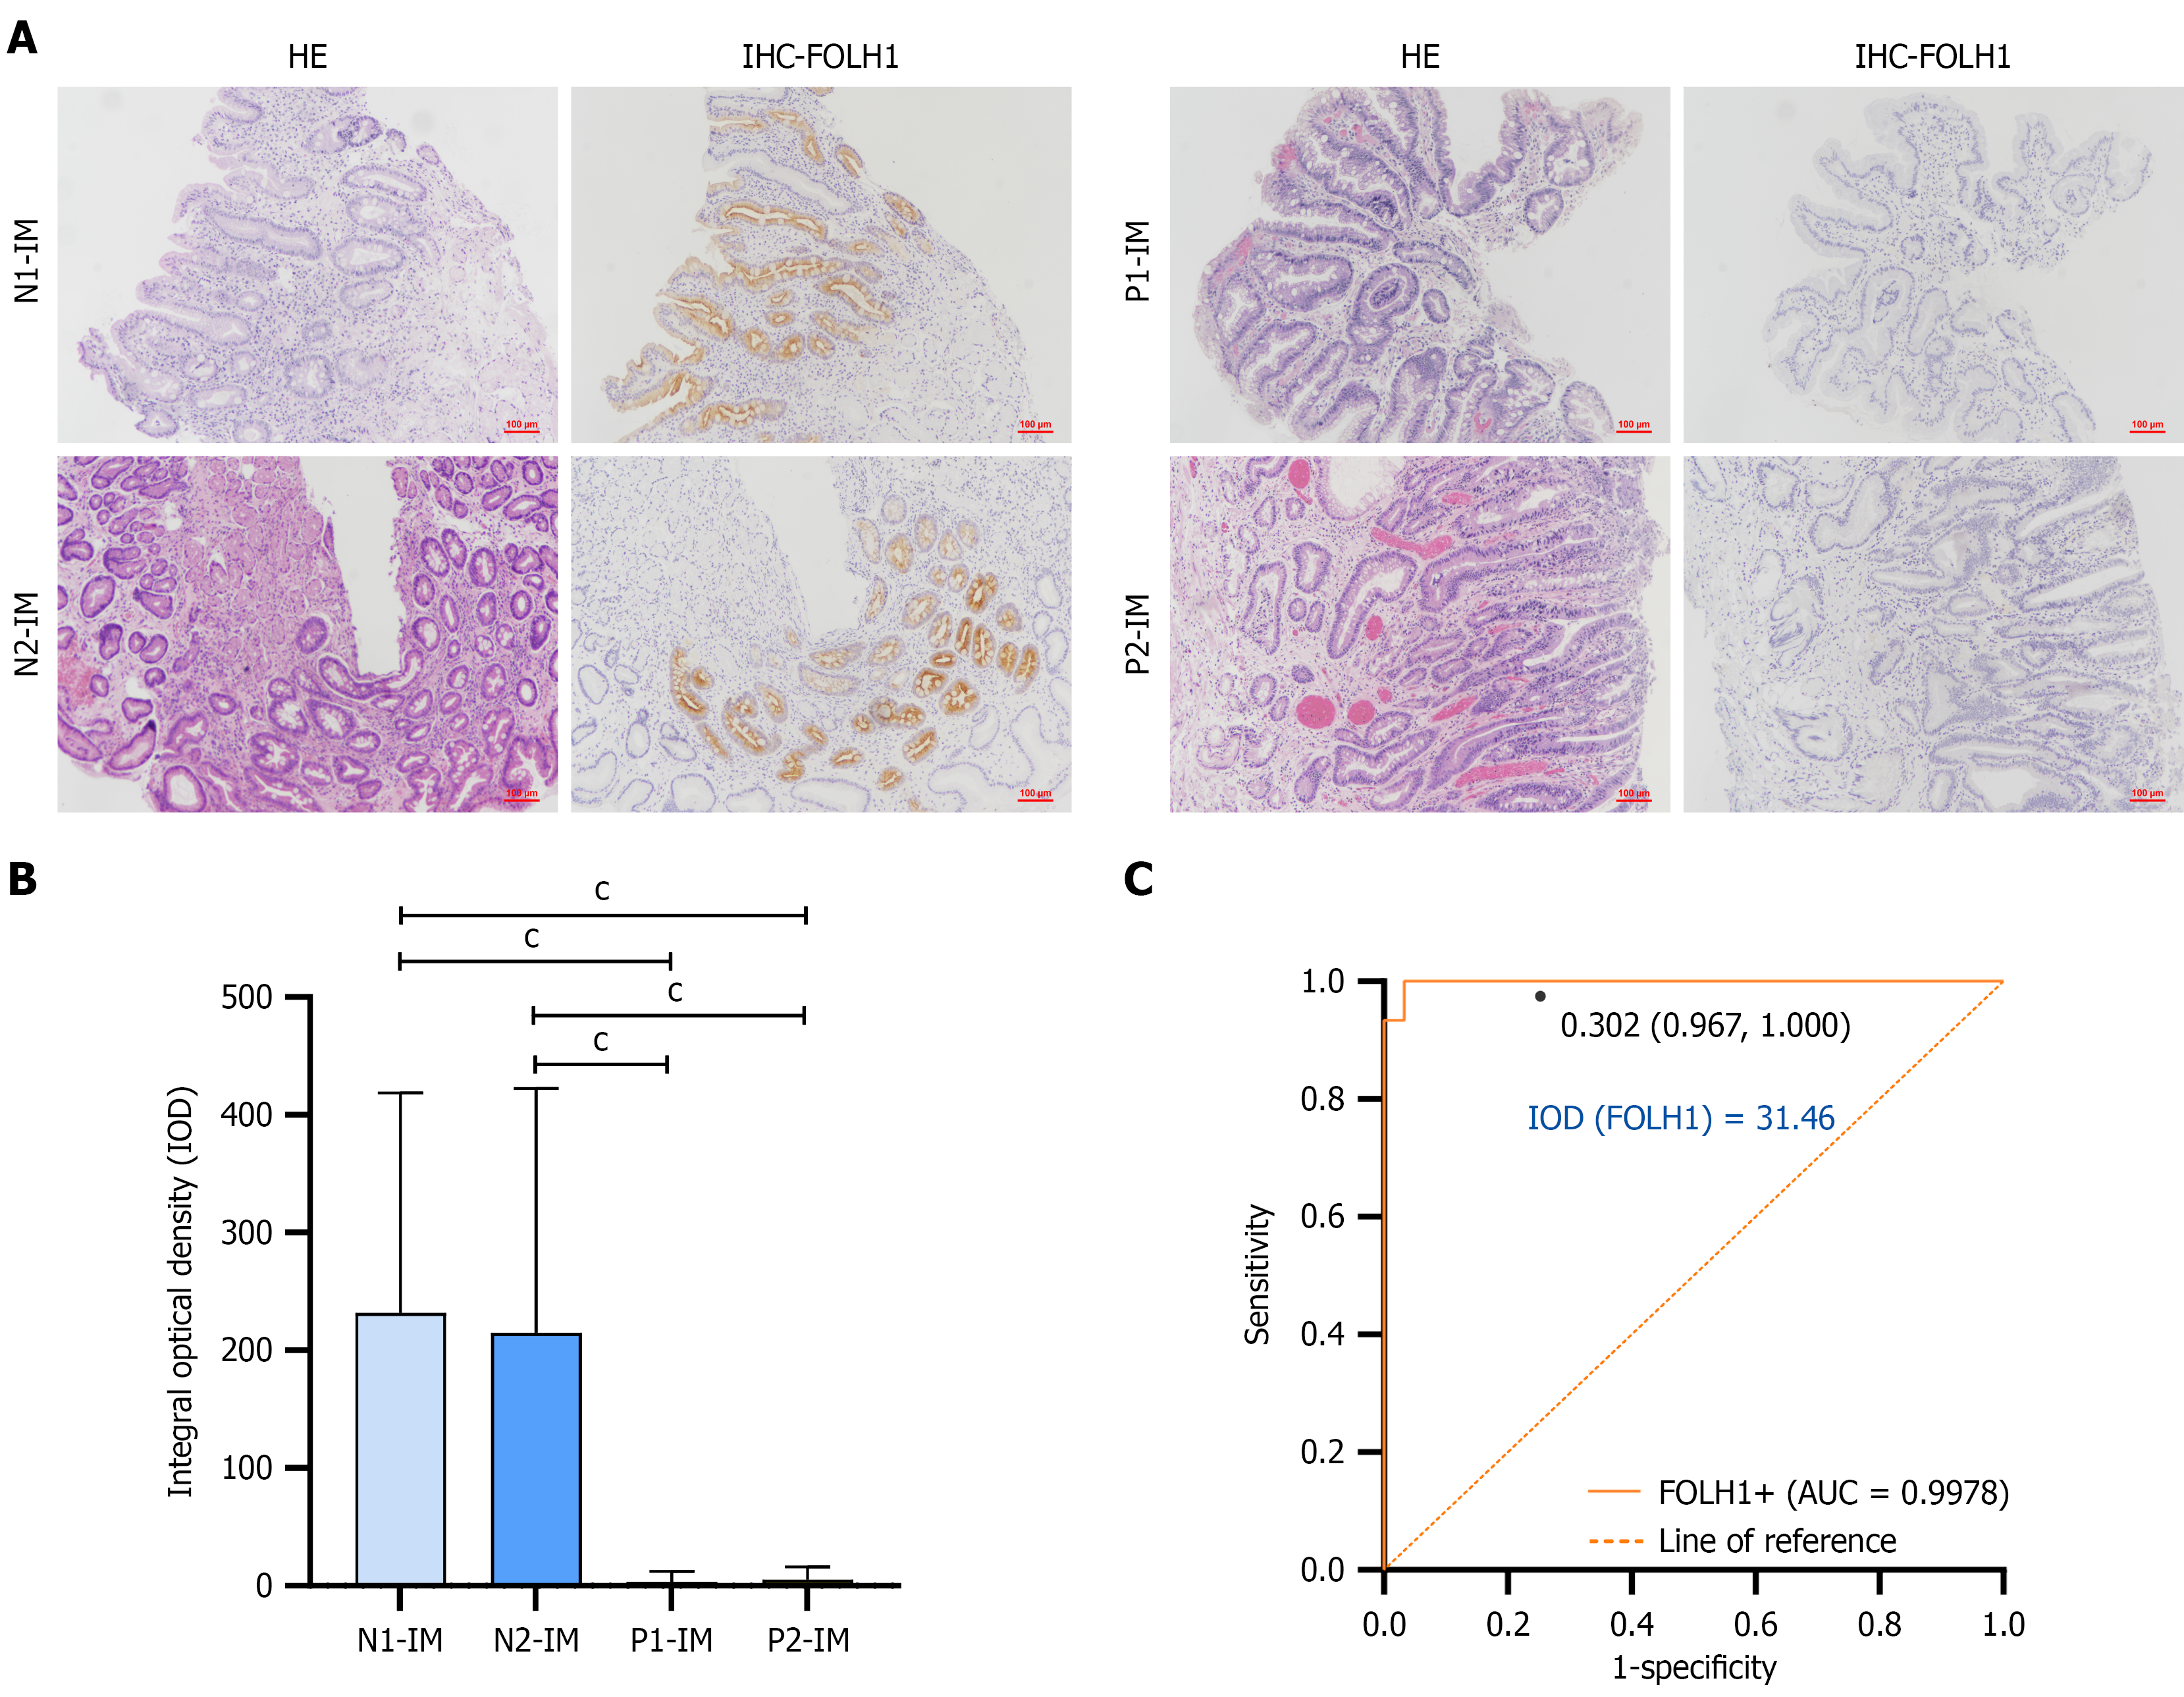
Figure 6 Hematoxylin-eosin and immunohistochemical staining of FOLH1 in 60 additional gastric intestinal metaplasia patients.
A: Positive staining of FOLH1 (brown color) was significantly higher in the epithelium of [non-progression group (N)] N1-intestinal metaplasia (IM), compared to progression group (P group) P1-IM; B: Integrated optical density (IOD) of FOLH1 expression in different groups: N1-IM, N2-IM, P1-IM, and P2-IM; C: The diagnostic cutoff value for FOLH1 is 0.302, a sensitivity of 1.0, and a specificity of 0.967, respectively. The corresponding IOD value for FOLH1 is 31.46. cP < 0.001. HE: Hematoxylin-eosin; IHC: Immunohistochemical; N group: Non-progression group; P group: Progression group; IM: Intestinal metaplasia; IOD: Integrated optical density; AUC: Area under the curve.
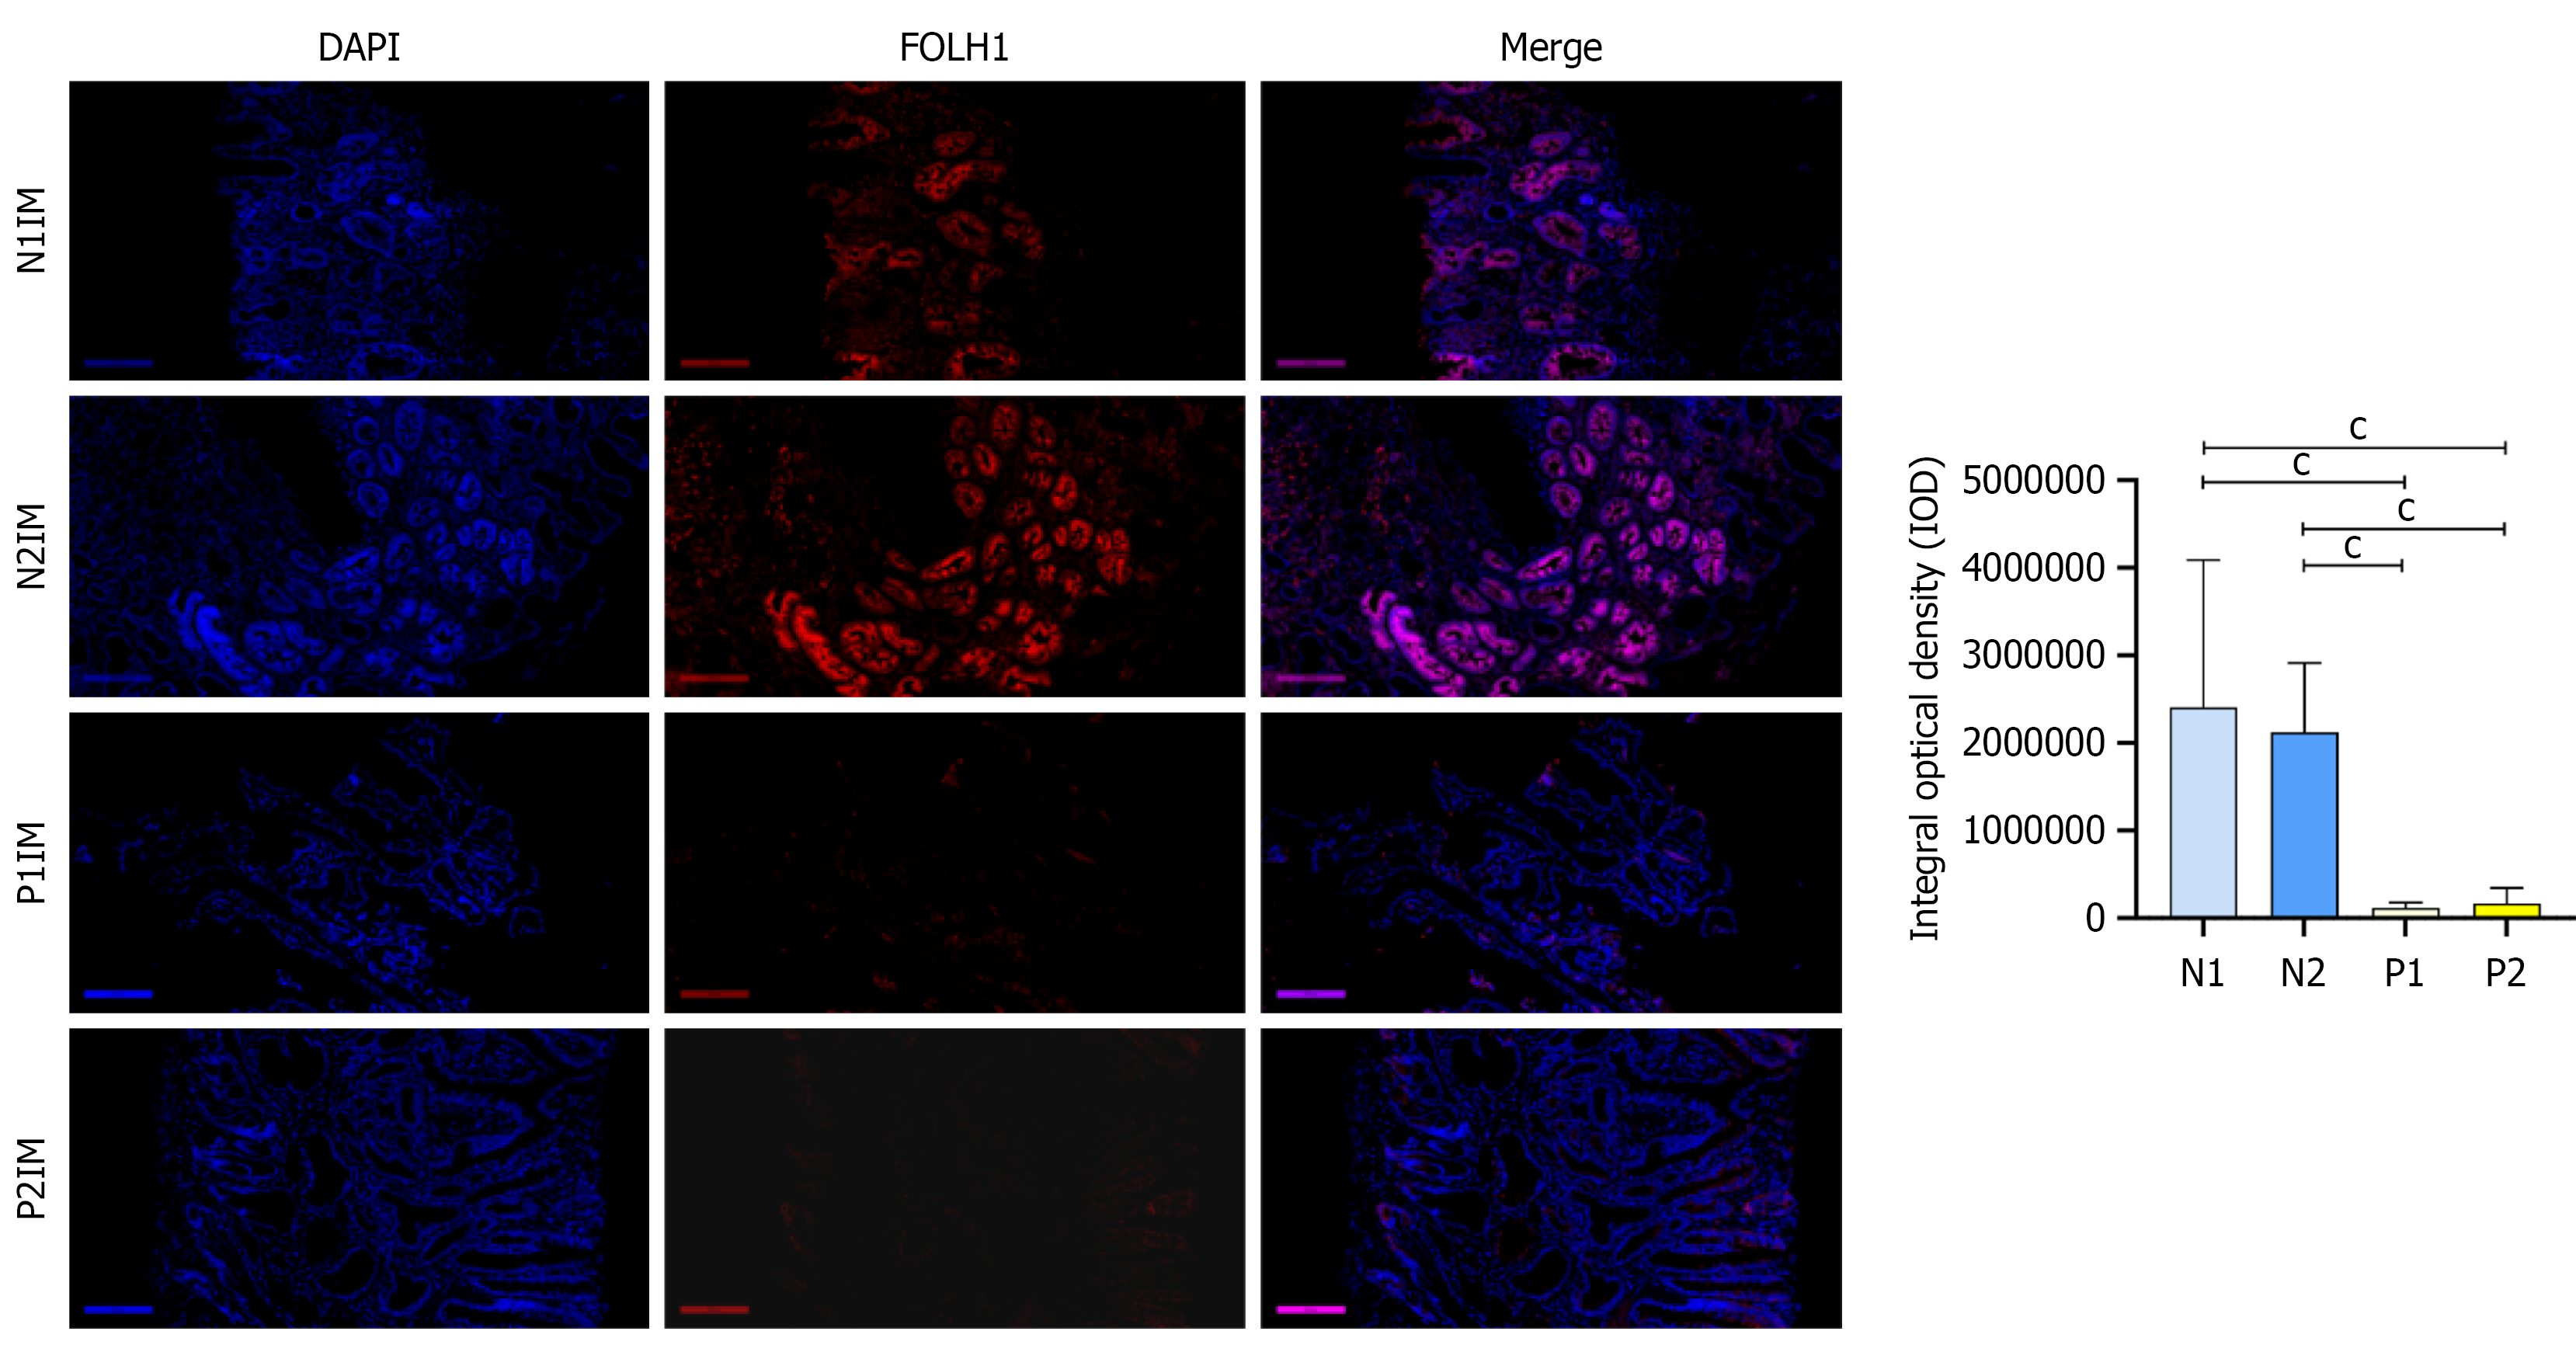
Figure 7 Immunofluorescence staining of additional gastric intestinal metaplasia patients.
Positive staining for FOLH1 (red color) was significantly increased in the epithelium of the [non-progression group (N)] N1-intestinal metaplasia (IM) group compared to the progression group (P group) P1-IM group. cP < 0.001. N group: Non-progression group; P group: Progression group; IM: Intestinal metaplasia; IOD: Integrated optical density; DAPI: 4’,6-diamidino-2-phenylindole.
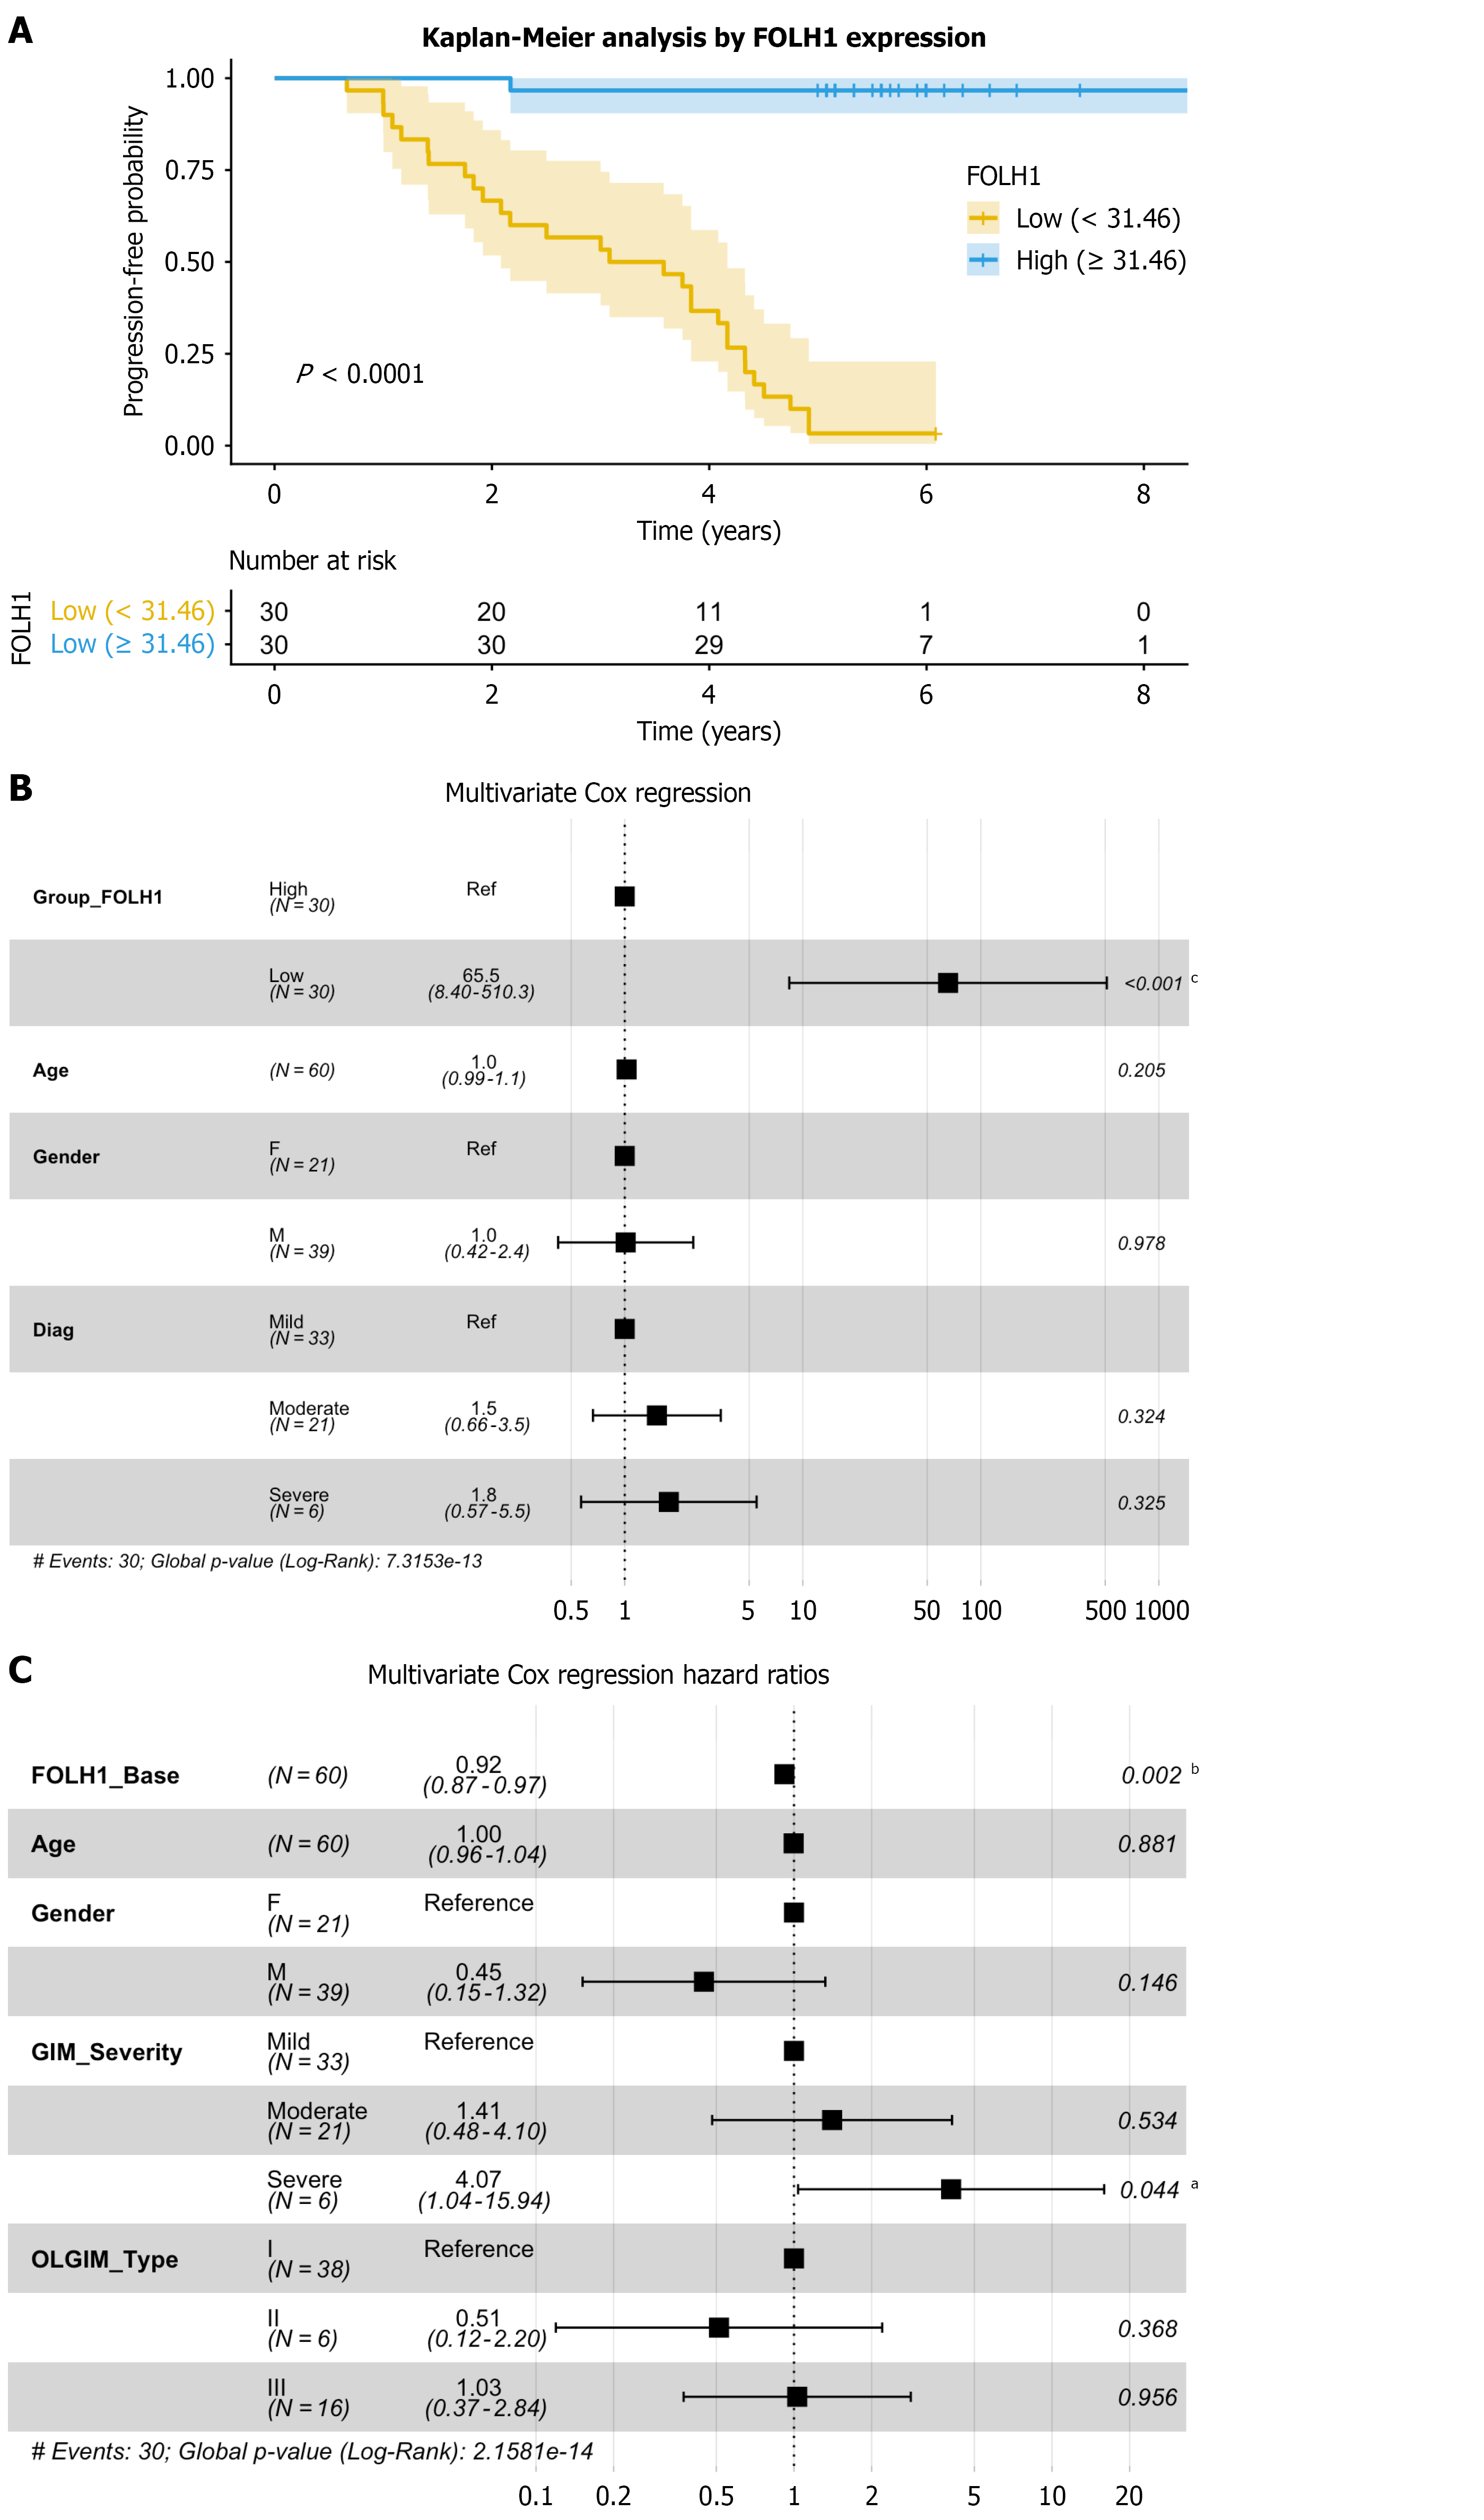
Figure 8 Prognostic value of FOLH1 for risk stratification in gastric intestinal metaplasia.
A: Kaplan-Meier progression-free survival analysis by FOLH1 expression. Cumulative probability of progression-free survival stratified by FOLH1 integrated optical density levels. Patients with low FOLH1 expression had a significantly higher rate of malignant transformation during 5-year follow-up than the high-expression group (Log-rank P < 0.0001); B: Multivariate Cox regression hazard ratios for gastric intestinal metaplasia (GIM) progression. Forest plot illustrating the independent risk of progression. Low FOLH1 expression is a dominant independent risk factor [hazard ratio (HR) = 65.5, P < 0.001] when adjusted for age, gender, and clinical diagnosis; C: Multivariate Cox regression incorporating operative link on GIM (OLGIM) staging. Forest plot evaluating the protective effect of continuous FOLH1 levels (HR = 0.92 per unit increase, P = 0.002) alongside clinical risk factors. Severe GIM remained a significant risk factor (HR = 4.07, P = 0.044), while OLGIM types II and III did not show independent statistical significance in this model. aP < 0.05. bP < 0.01. cP < 0.001. F: Female; M: Male; GIM: Gastric intestinal metaplasia; OLGIM: Operative link on gastric intestinal metaplasia.
- Citation: He S, Guo XF, Wang Y, Bai JQ, Wang JP, Shi JH, Shi YY, Yuan J, Wei W, Yang Y, Shi XH, Feng Y, Ding X, Gao W, Lu D, Zhou WX, Zhang P. FOLH1 as a novel biomarker for risk stratification in gastric intestinal metaplasia. World J Gastroenterol 2026; 32(25): 118842
- URL: https://www.wjgnet.com/1007-9327/full/v32/i25/118842.htm
- DOI: https://dx.doi.org/10.3748/wjg.118842