
















Copyright: ©Author(s) 2026.
World J Gastroenterol. Jun 14, 2026; 32(22): 118323
Published online Jun 14, 2026. doi: 10.3748/wjg.v32.i22.118323
Published online Jun 14, 2026. doi: 10.3748/wjg.v32.i22.118323
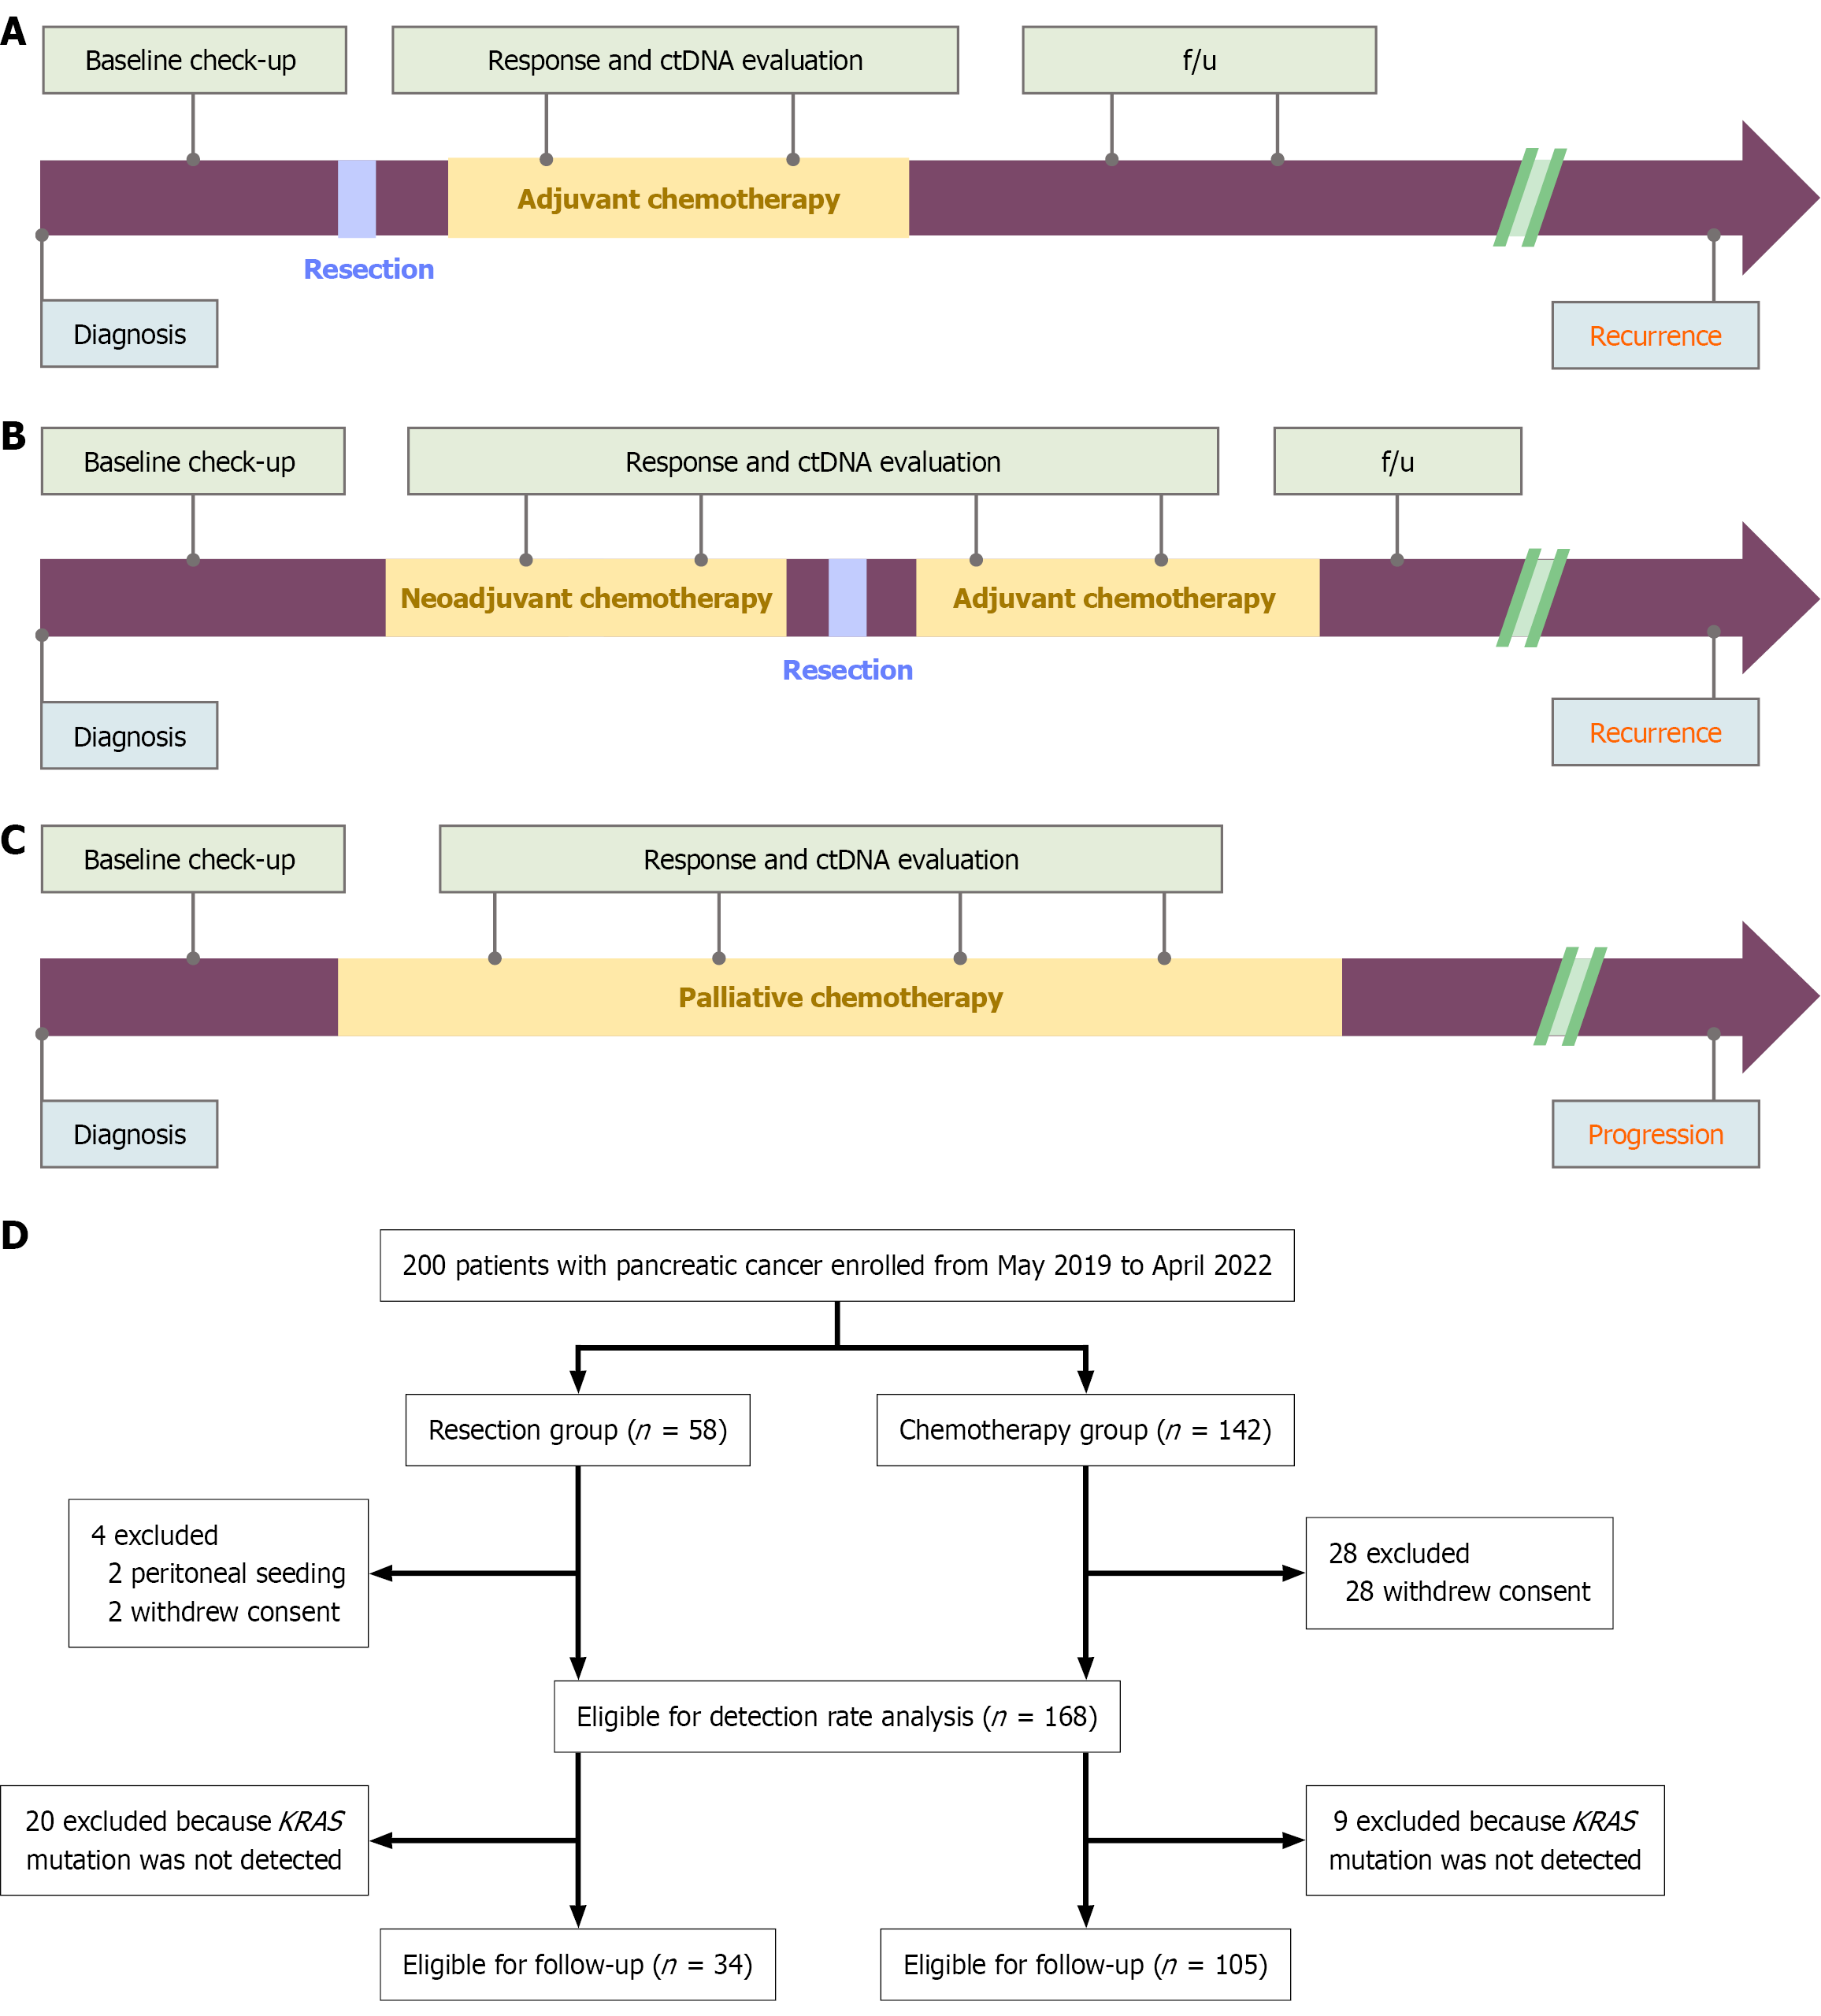
Figure 1 Study timeline of patients in resection and chemotherapy groups, indicating treatment phases and assessment points.
A: Study timeline for patients undergoing upfront surgery; B: Study timeline for patients undergoing resection after neoadjuvant chemotherapy; C: Study timeline for patients receiving palliative chemotherapy; D: Flow diagram showing patient enrolment and allocation in this study. ctDNA: Circulating tumor DNA; f/u: Follow up.
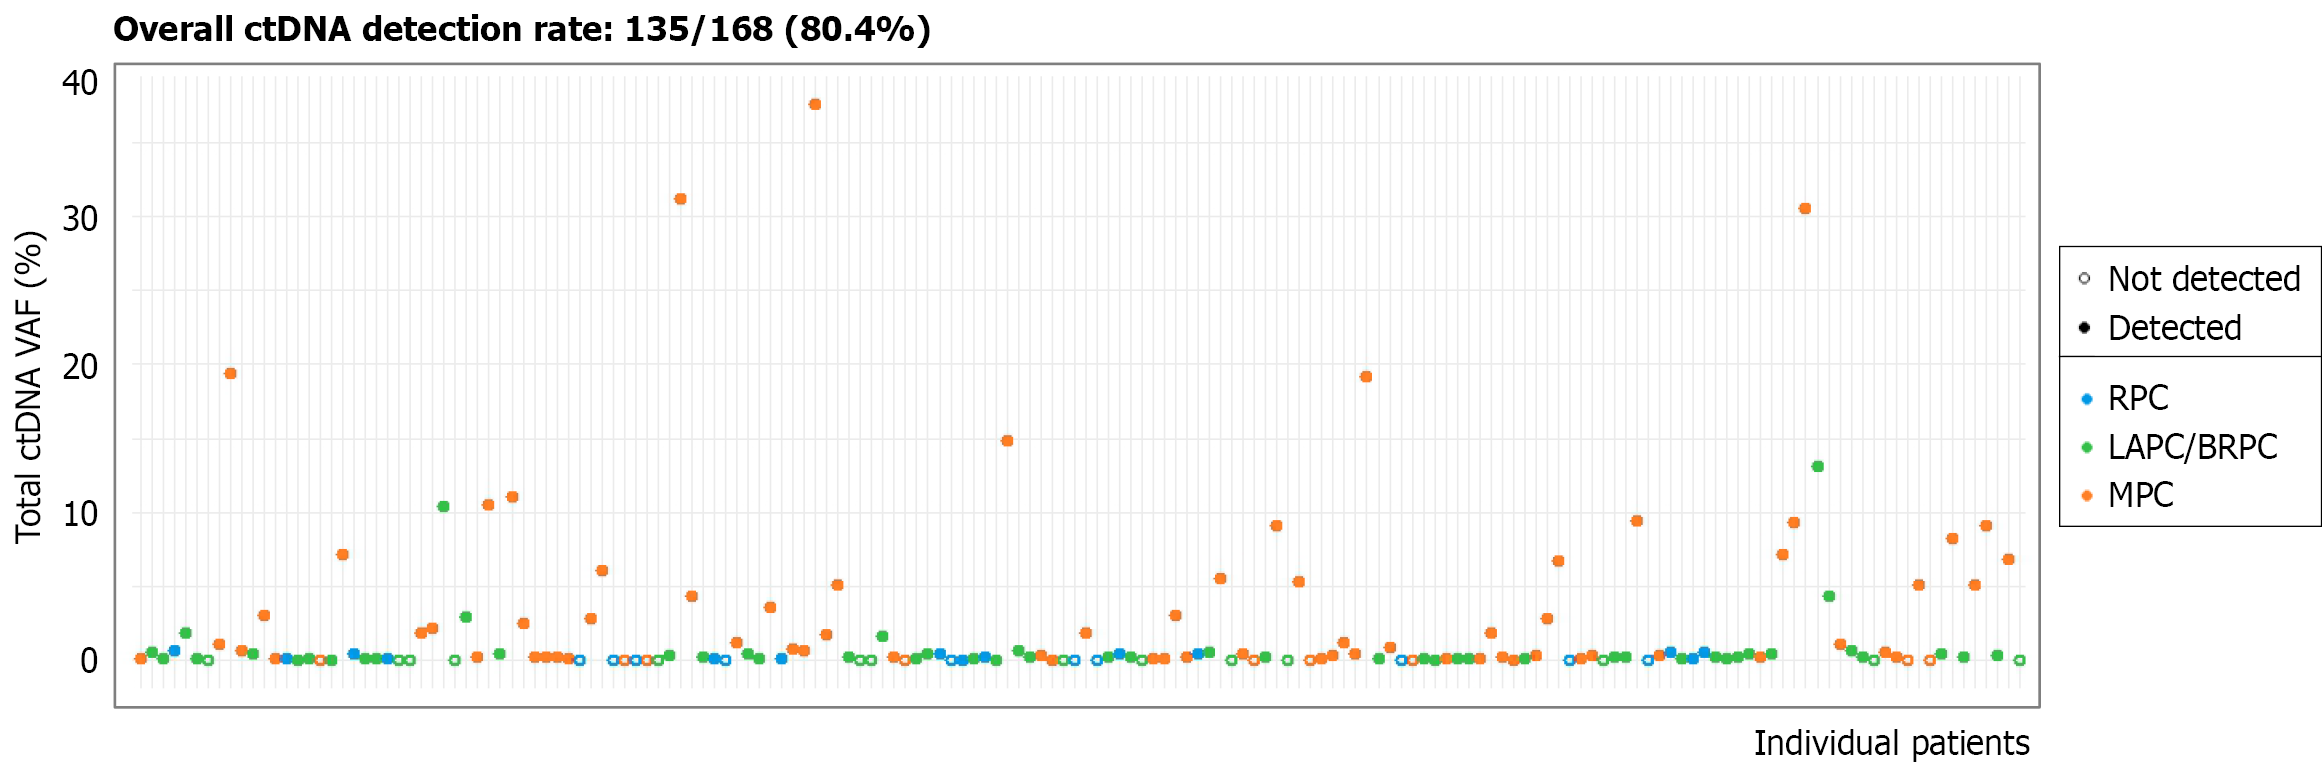
Figure 2 Analysis of circulating tumor DNA detection in pancreatic cancer patients using droplet digital polymerase chain reaction.
The empty circles indicate undetected circulating tumor DNA, whilst the filled circles represent the detection of circulating tumor DNA. Each color reflects the stages of pancreatic cancer. ctDNA: Circulating tumor DNA; VAF: Variant allele fraction; RPC: Resectable pancreatic cancer; LAPC: Locally advanced pancreatic cancer; BRPC: Borderline resectable pancreatic cancer; MPC: Metastatic pancreatic cancer.
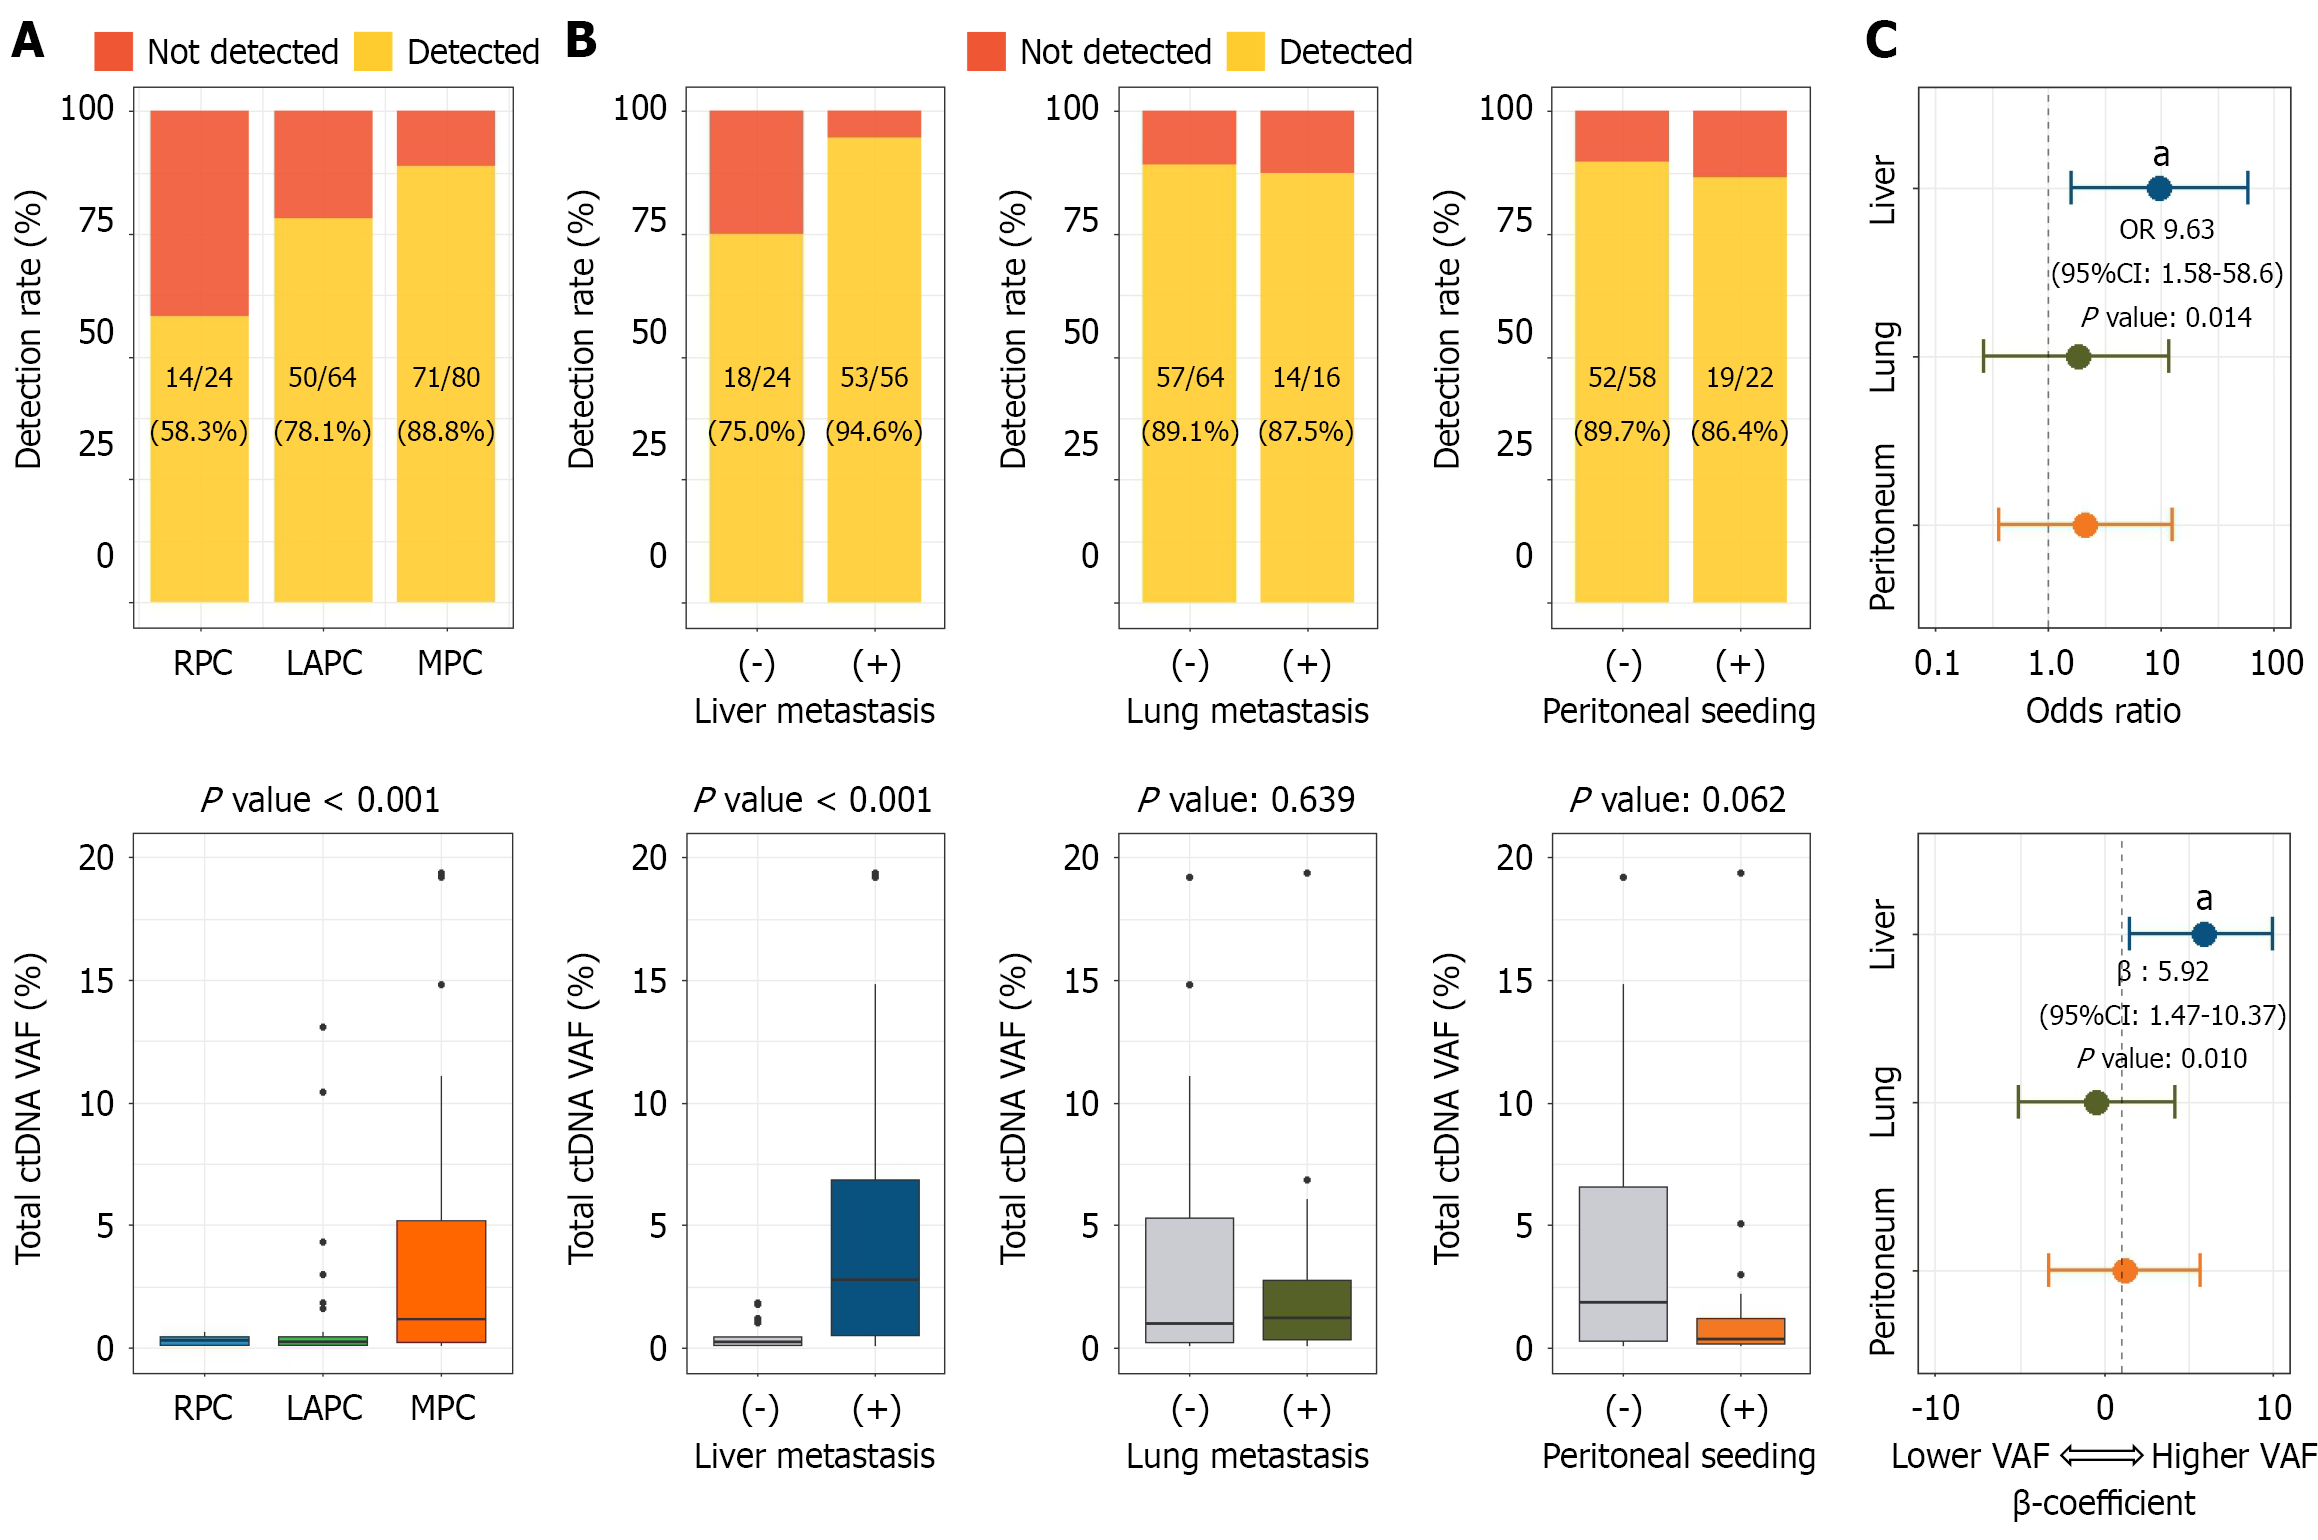
Figure 3 Circulating tumor DNA detection rates and variant allele fraction according to cancer stage and metastatic sites.
A: Circulating tumor DNA (ctDNA) detection rates and variant allele fraction (VAF) varied significantly by cancer stage; B: Analysis of ctDNA detection and VAF in metastatic sites showed a significantly higher detection rate in patients with liver metastasis compared to those without. No significant differences were observed in detection rates and VAF for patients with vs without lung metastasis and peritoneal metastasis; C: A multivariable analysis confirmed the persistence of higher ctDNA detection rates and VAF in the liver metastasis group. aP < 0.05. RPC: Resectable pancreatic cancer; LAPC: Locally advanced pancreatic cancer; MPC: Metastatic pancreatic cancer; ctDNA: Circulating tumor DNA; VAF: Variant allele fraction; OR: Odds ratio; CI: Confidence interval.
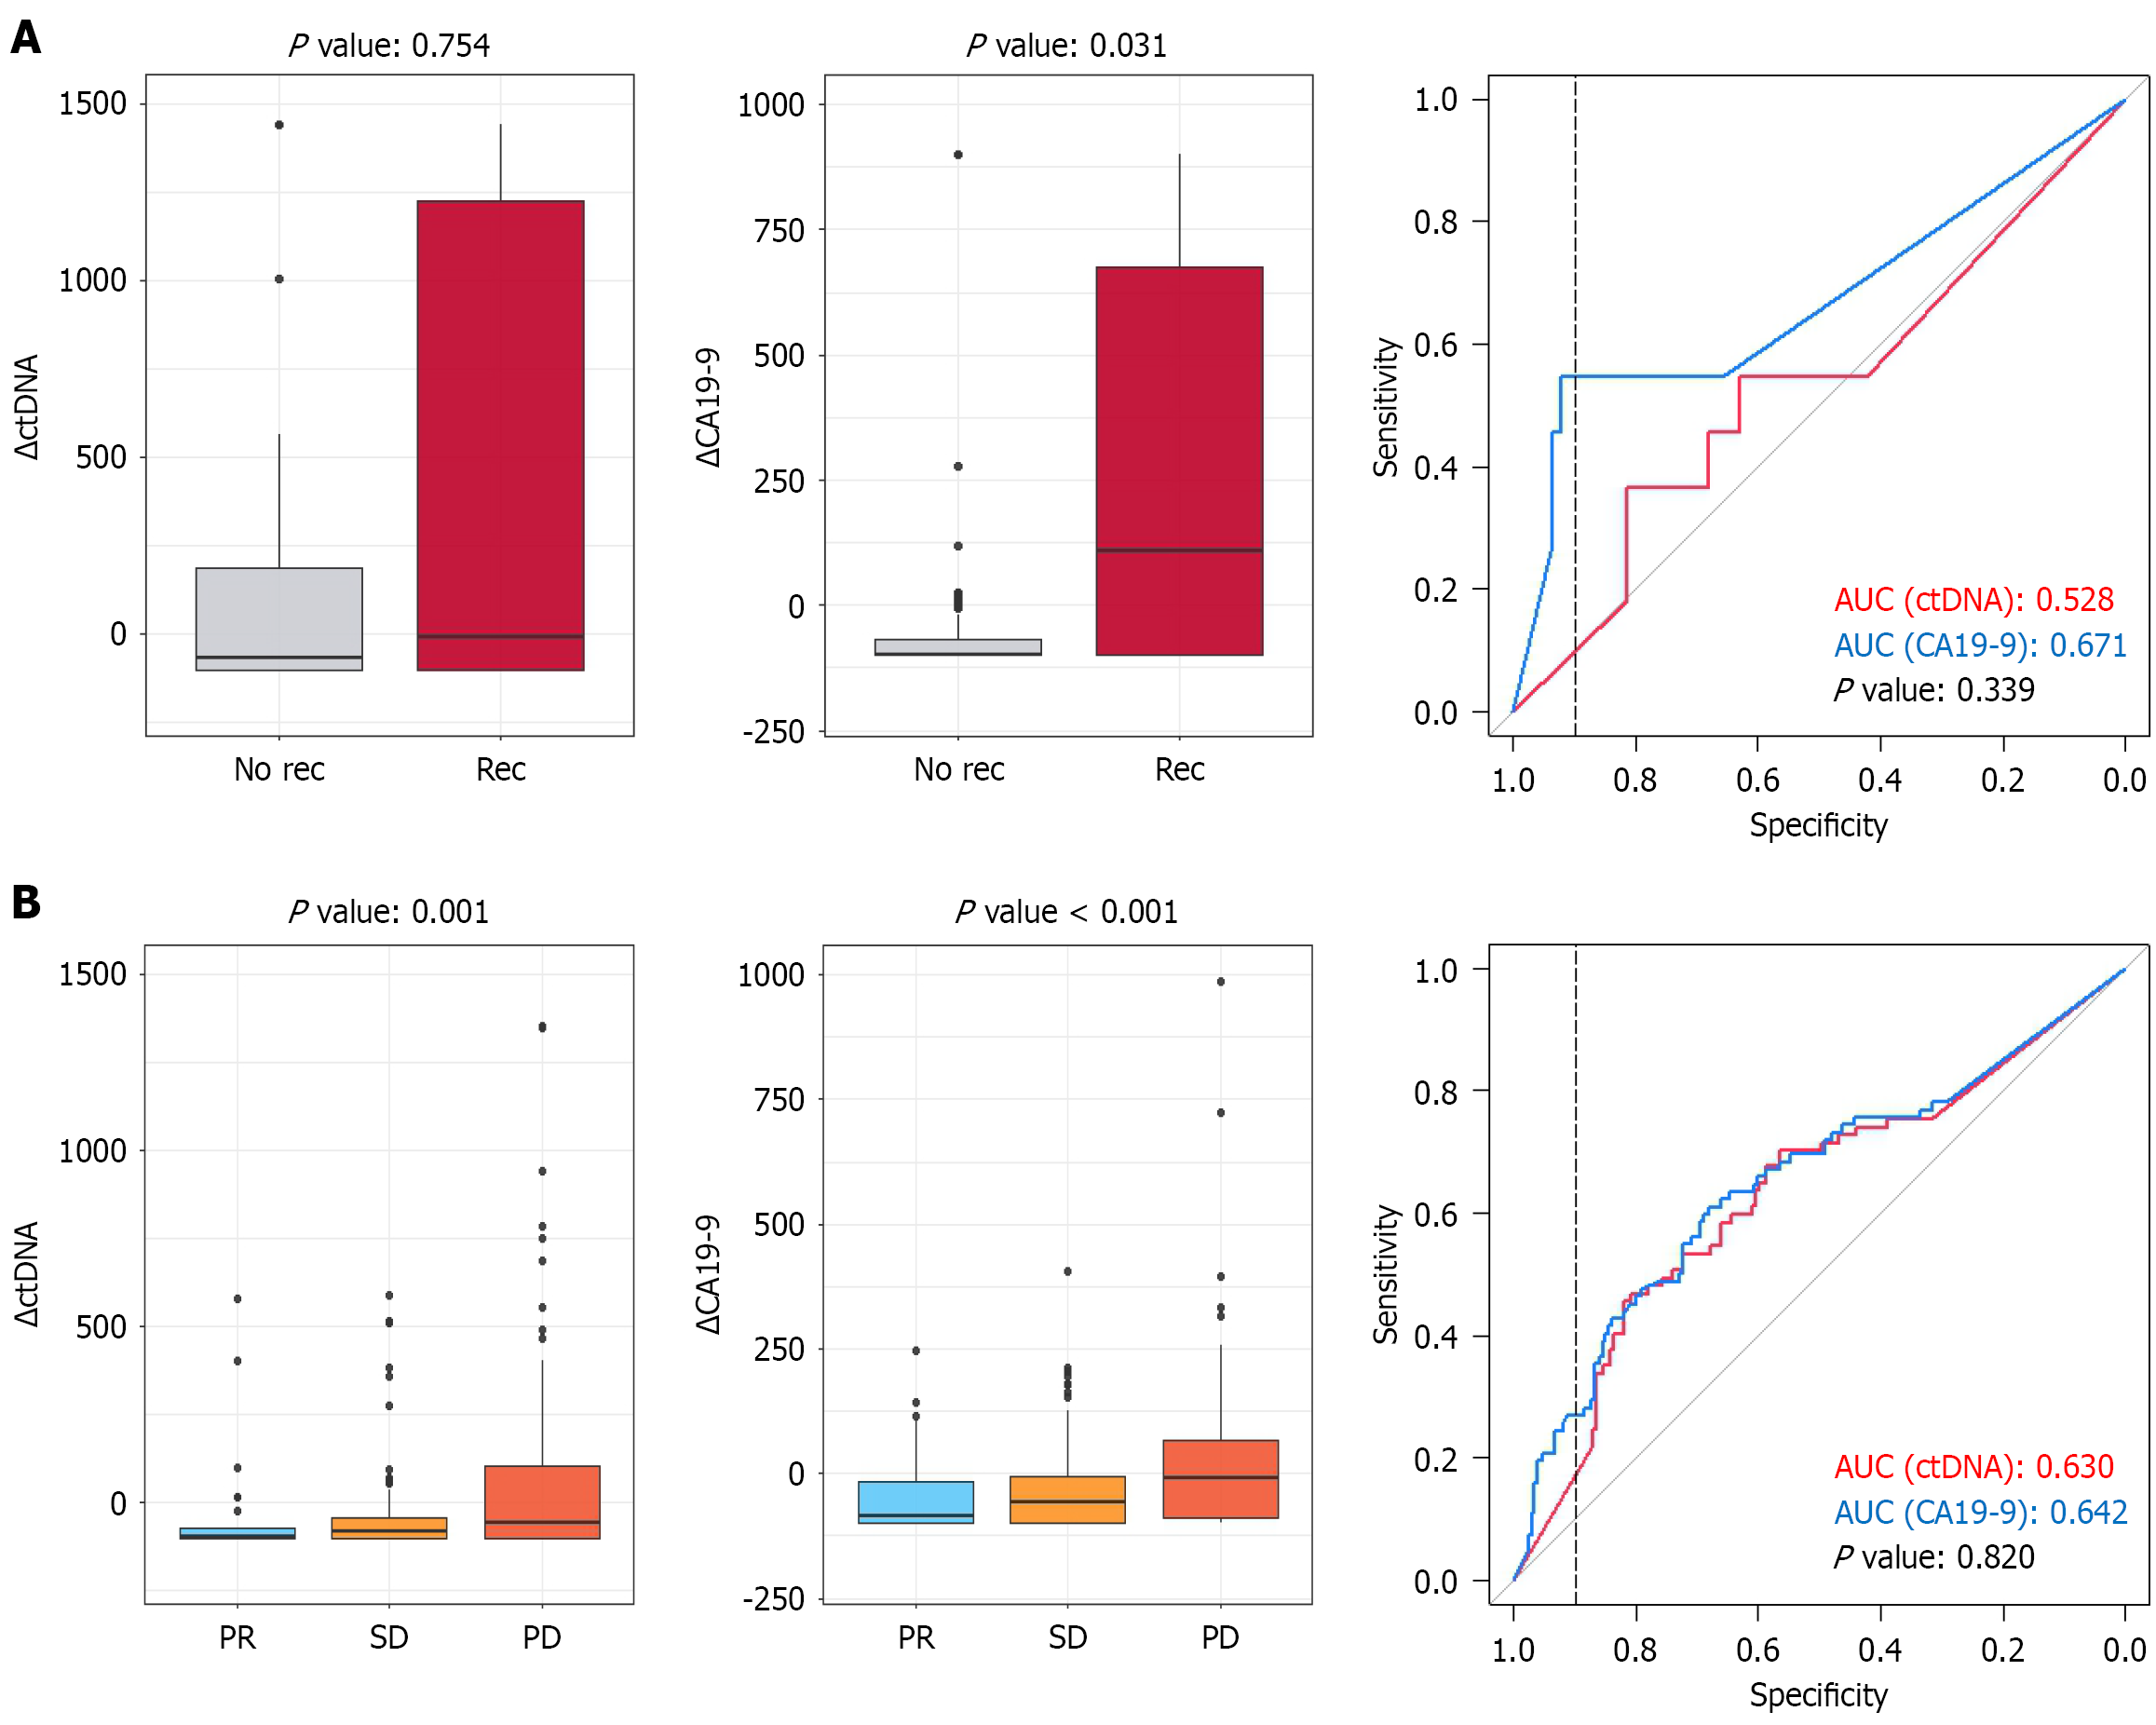
Figure 4 Comparison of changes in circulating tumor DNA and carbohydrate antigen 19-9 for predicting recurrence and treatment response.
A: Comparison of changes in circulating tumor DNA (ΔctDNA) and carbohydrate antigen 19-9 (ΔCA19-9) in the resection group. Box plots demonstrated the distribution of ΔctDNA and ΔCA19-9 values between recurrence and non-recurrence groups. The diagnostic performance of ΔctDNA and ΔCA19-9 for predicting tumor recurrence was compared using receiver operating characteristic curves; B: Comparison of ΔctDNA and ΔCA19-9 in the chemotherapy group. Box plots demonstrated the distribution of ΔctDNA and ΔCA19-9 values across different radiological response groups (partial response, stable disease, progressive disease). The diagnostic performance of ΔctDNA and ΔCA19-9 for predicting treatment response was compared using receiver operating characteristic curves. ctDNA: Circulating tumor DNA; CA19-9: Carbohydrate antigen 19-9; AUC: Area under the curve; PR: Partial response; SD: Stable disease; PD: Progressive disease.
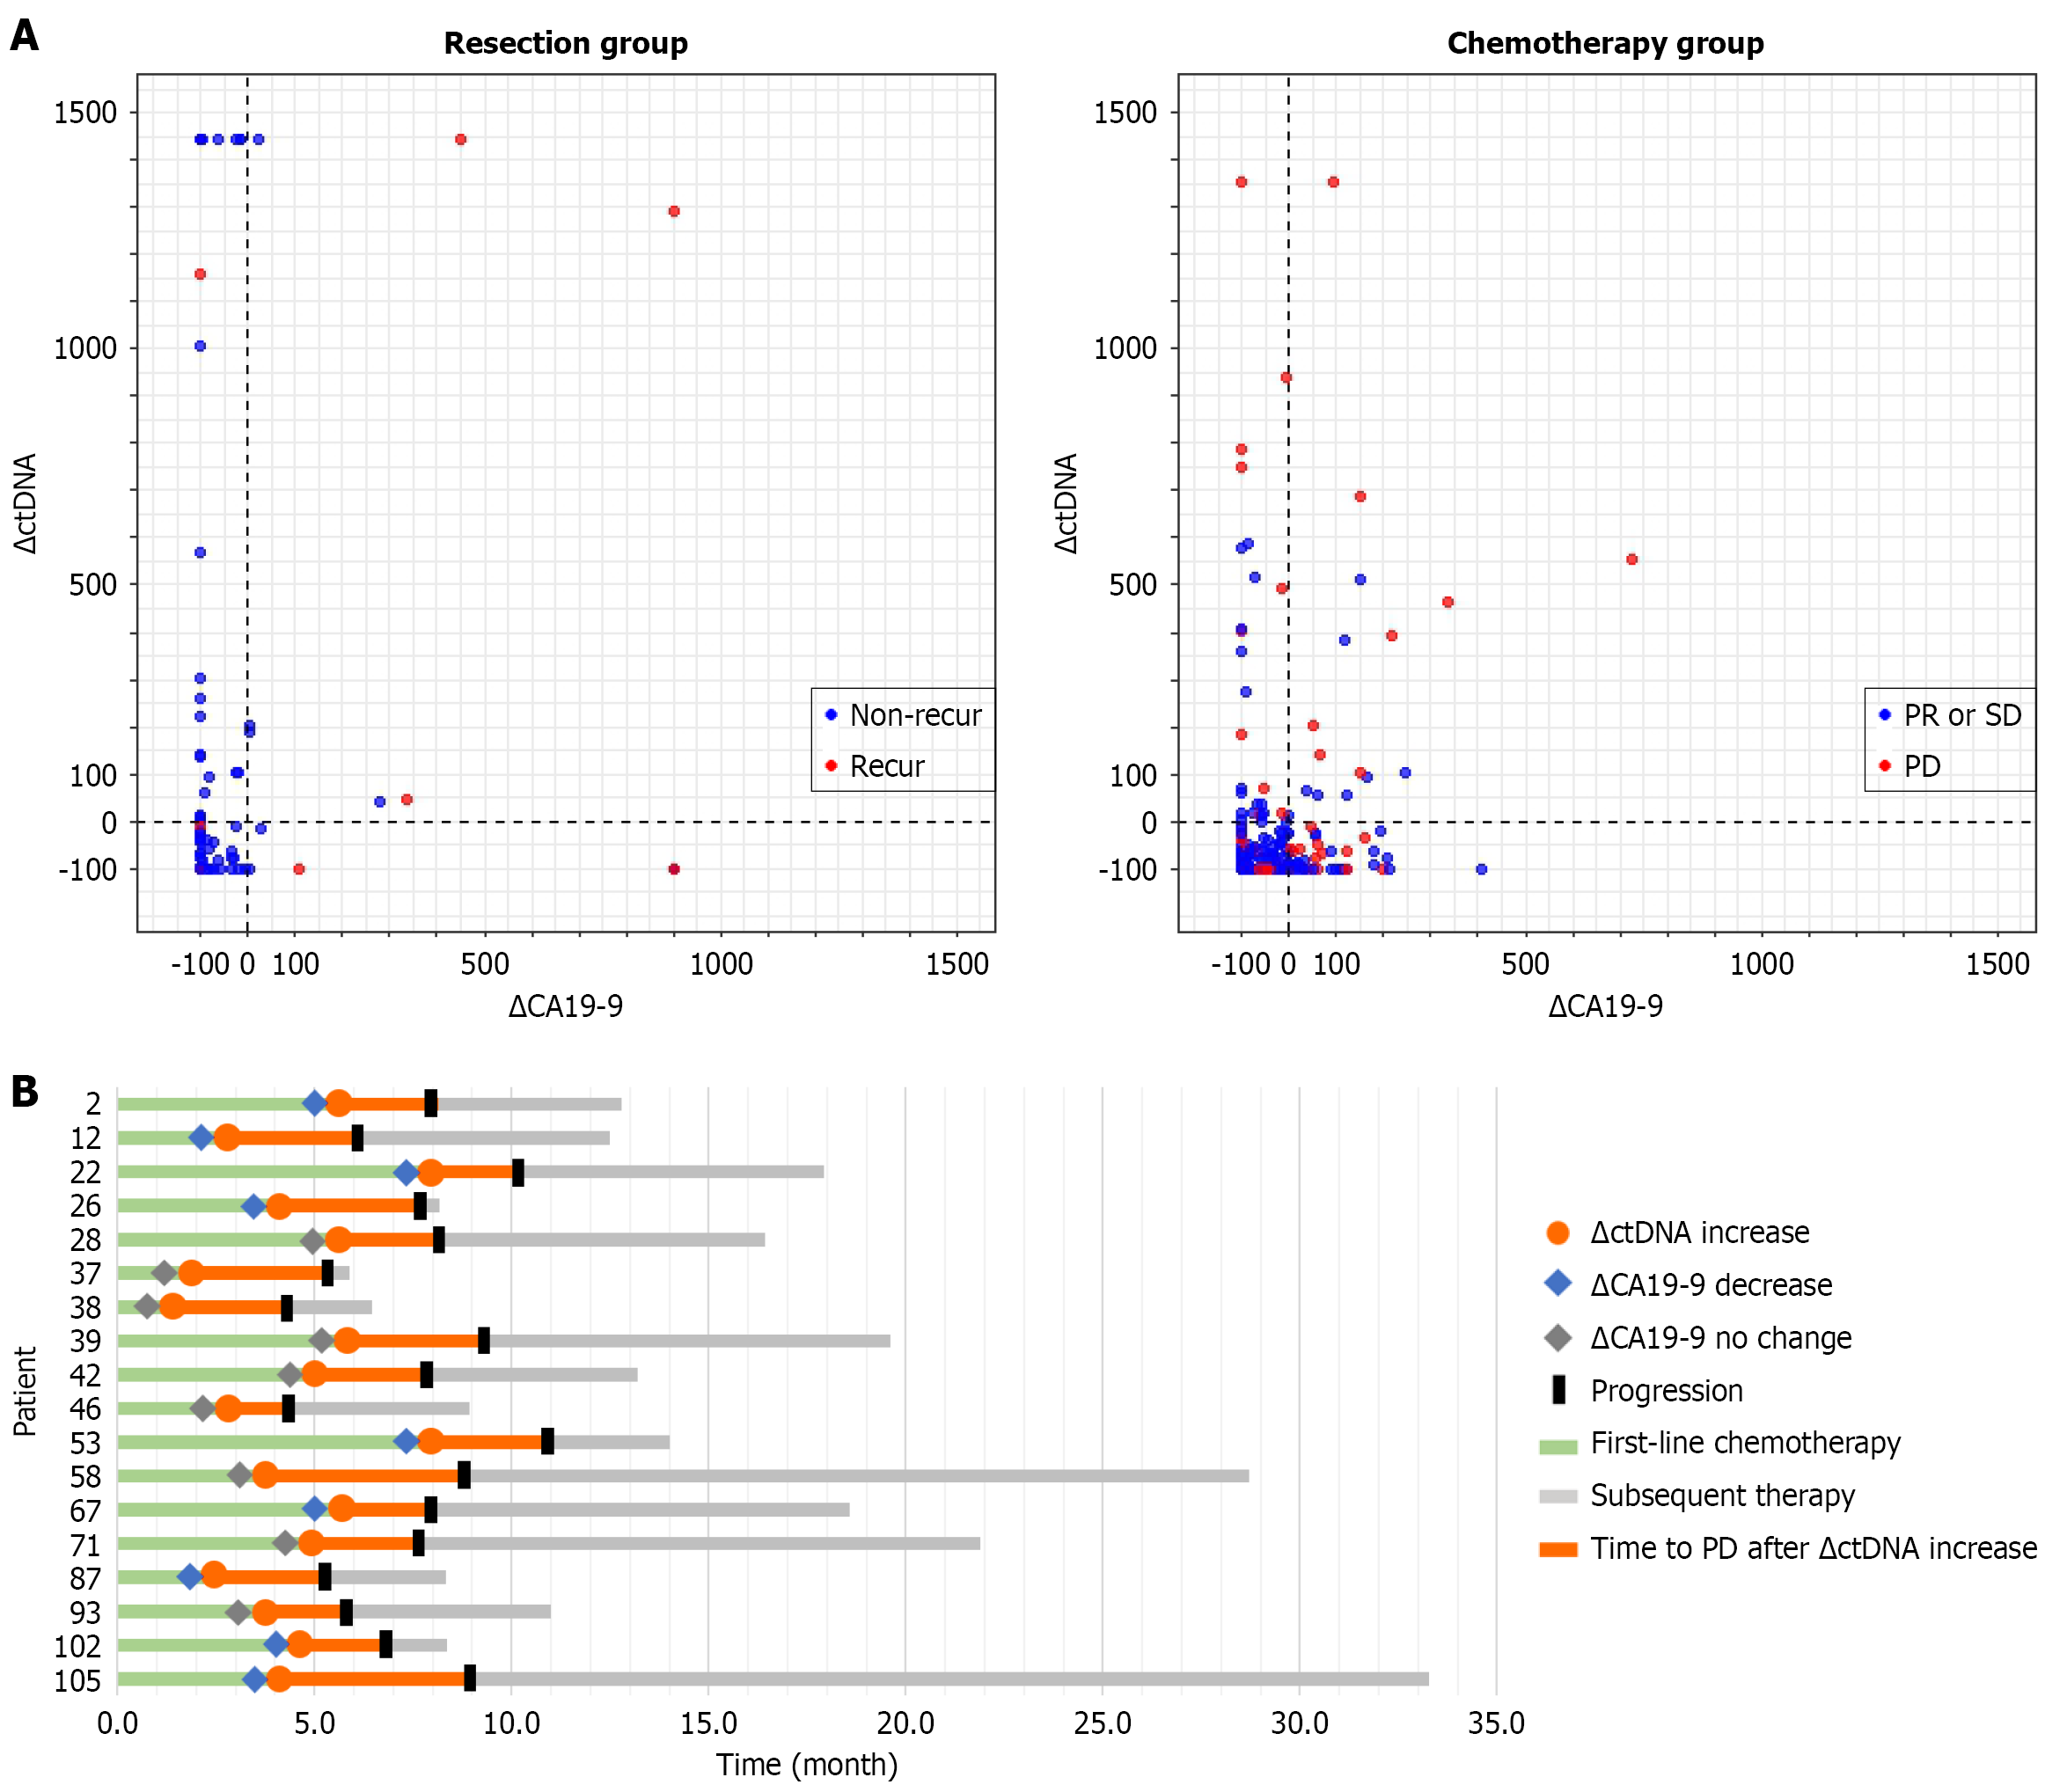
Figure 5 Synchronized and desynchronized changes in circulating tumor DNA and carbohydrate antigen 19-9 and early detection of disease progression.
A: Synchronized and desynchronized changes in circulating tumor DNA (ΔctDNA) and carbohydrate antigen 19-9 (ΔCA19-9) levels in the resection and chemotherapy groups. In the resection group, 108 events with concurrent ΔctDNA and ΔCA19-9 measurements were identified, of which 61.1% exhibited synchronized changes and 38.9% exhibited desynchronized changes. Tumor recurrence occurred in 10.2% of events, and 72.7% of recurrent cases were predicted by either ΔctDNA or ΔCA19-9. In the chemotherapy group, ΔctDNA and ΔCA19-9 levels were simultaneously measured in 273 events, with 61.9% showing synchronized changes and 38.1% showing desynchronized changes. Progressive disease (PD) was observed in 31.1% of events, and 88.2% of PD cases were predicted by either biomarker; B: Early detection of PD by ctDNA monitoring. Time to radiological progression was visualized using a swimmer plot in stable disease patients who exhibited increased ΔctDNA levels without corresponding ΔCA19-9 elevation. Each bar represents an individual patient, with the length indicating the follow-up duration. ctDNA: Circulating tumor DNA; CA19-9: Carbohydrate antigen 19-9; PR: Partial response; SD: Stable disease; PD: Progressive disease.
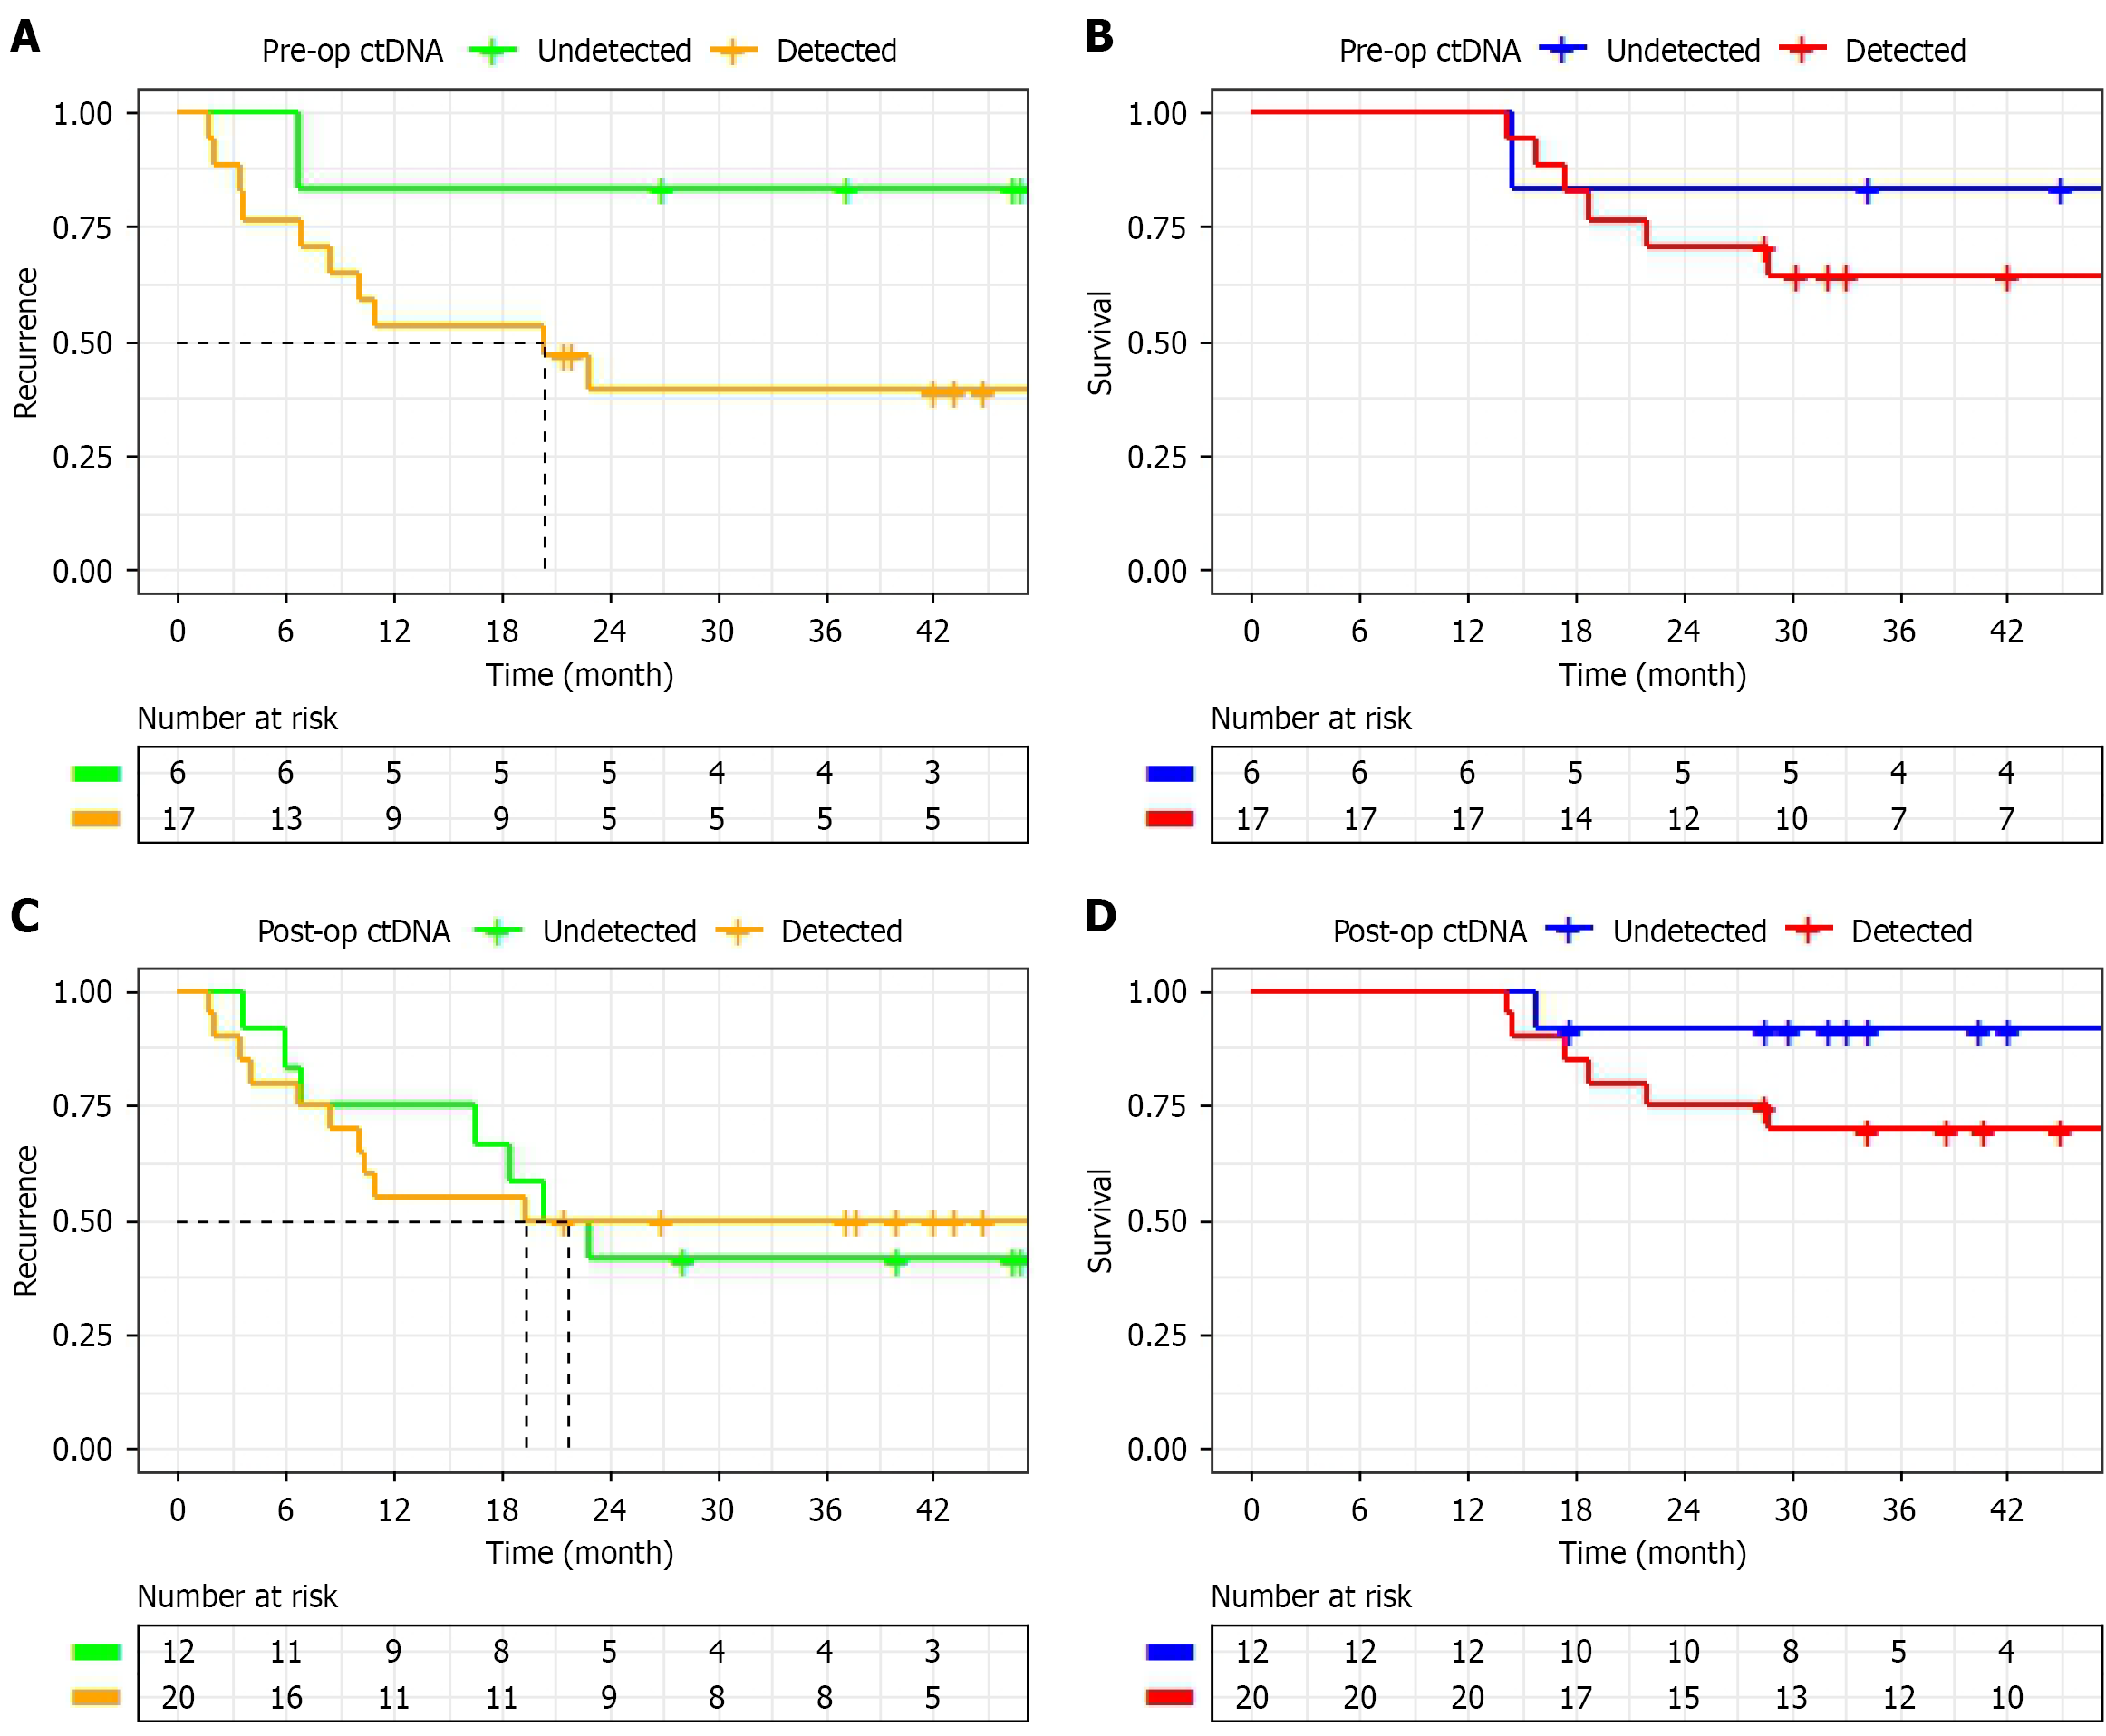
Figure 6 Survival outcomes according to preoperative and postoperative circulating tumor DNA status after resection.
A and B: Recurrence-free survival (A) and overall survival (B) curves comparing patients with detectable vs undetectable preoperative circulating tumor DNA levels among those who underwent resection after neoadjuvant chemotherapy (n = 23); C and D: Recurrence-free survival (C) and overall survival (D) curves comparing patients with detectable vs undetectable postoperative circulating tumor DNA levels in the combined cohort of upfront resection and post-chemotherapy resection groups (n = 32). ctDNA: Circulating tumor DNA.
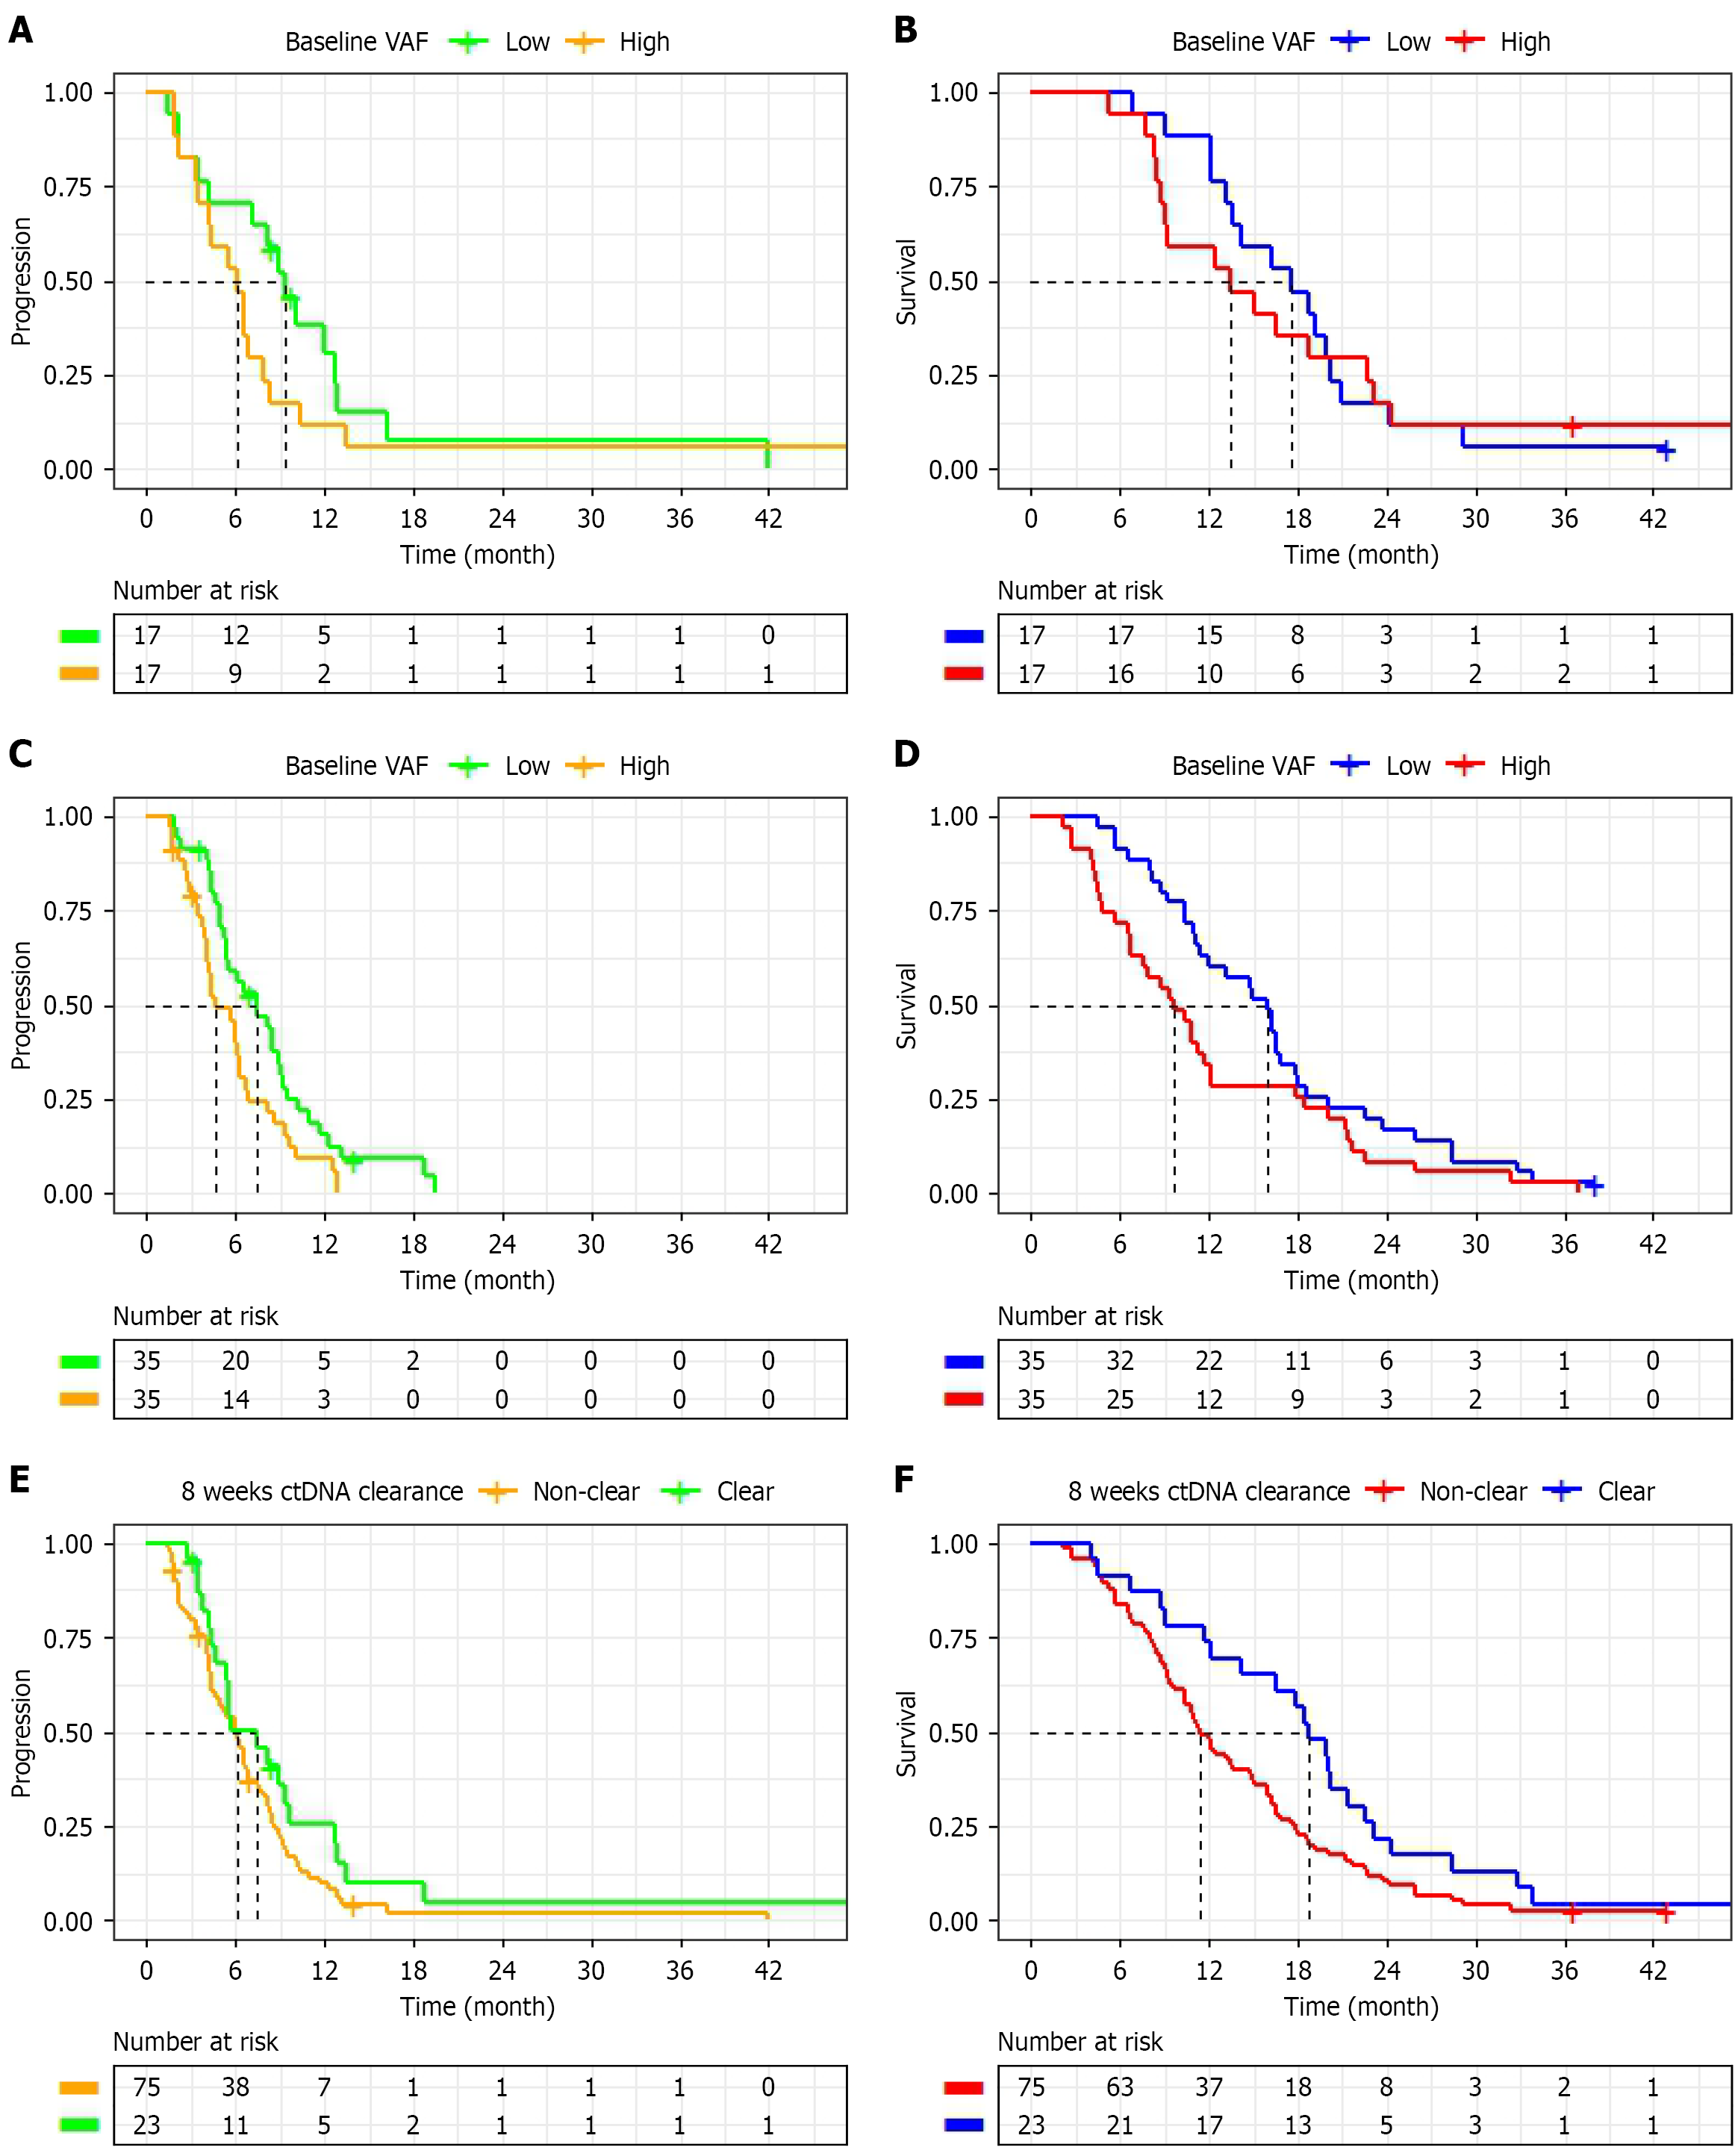
Figure 7 Survival outcomes according to baseline circulating tumor DNA levels and circulating tumor DNA clearance after chemotherapy.
A and B: Survival analysis in localized stage patients stratified by median baseline circulating tumor DNA (ctDNA) level. No significant differences were observed in either median progression-free survival (PFS) or median overall survival between the two groups; C and D: Survival outcomes in metastatic stage patients stratified by median baseline ctDNA level, patients with ctDNA levels below the median showed significantly longer median PFS and compared to those above the median; E and F: Survival analysis according to ctDNA clearance status at 8 weeks after chemotherapy initiation. While PFS showed no significant difference between groups, median overall survival was significantly longer in the clearance group compared to the non-clearance group. ctDNA: Circulating tumor DNA; VAF: Variant allele fraction.
- Citation: Jung K, Lee J, Jang D, Ahn J, Kim B, Yang S, Kim JH, Youn Y, Lee JC, Kim J, Hwang JH. Serial circulating tumor DNA as a biomarker for monitoring and prognostication in patients with pancreatic cancer. World J Gastroenterol 2026; 32(22): 118323
- URL: https://www.wjgnet.com/1007-9327/full/v32/i22/118323.htm
- DOI: https://dx.doi.org/10.3748/wjg.v32.i22.118323