
















Copyright: ©Author(s) 2026.
World J Gastroenterol. Jun 14, 2026; 32(22): 117417
Published online Jun 14, 2026. doi: 10.3748/wjg.v32.i22.117417
Published online Jun 14, 2026. doi: 10.3748/wjg.v32.i22.117417
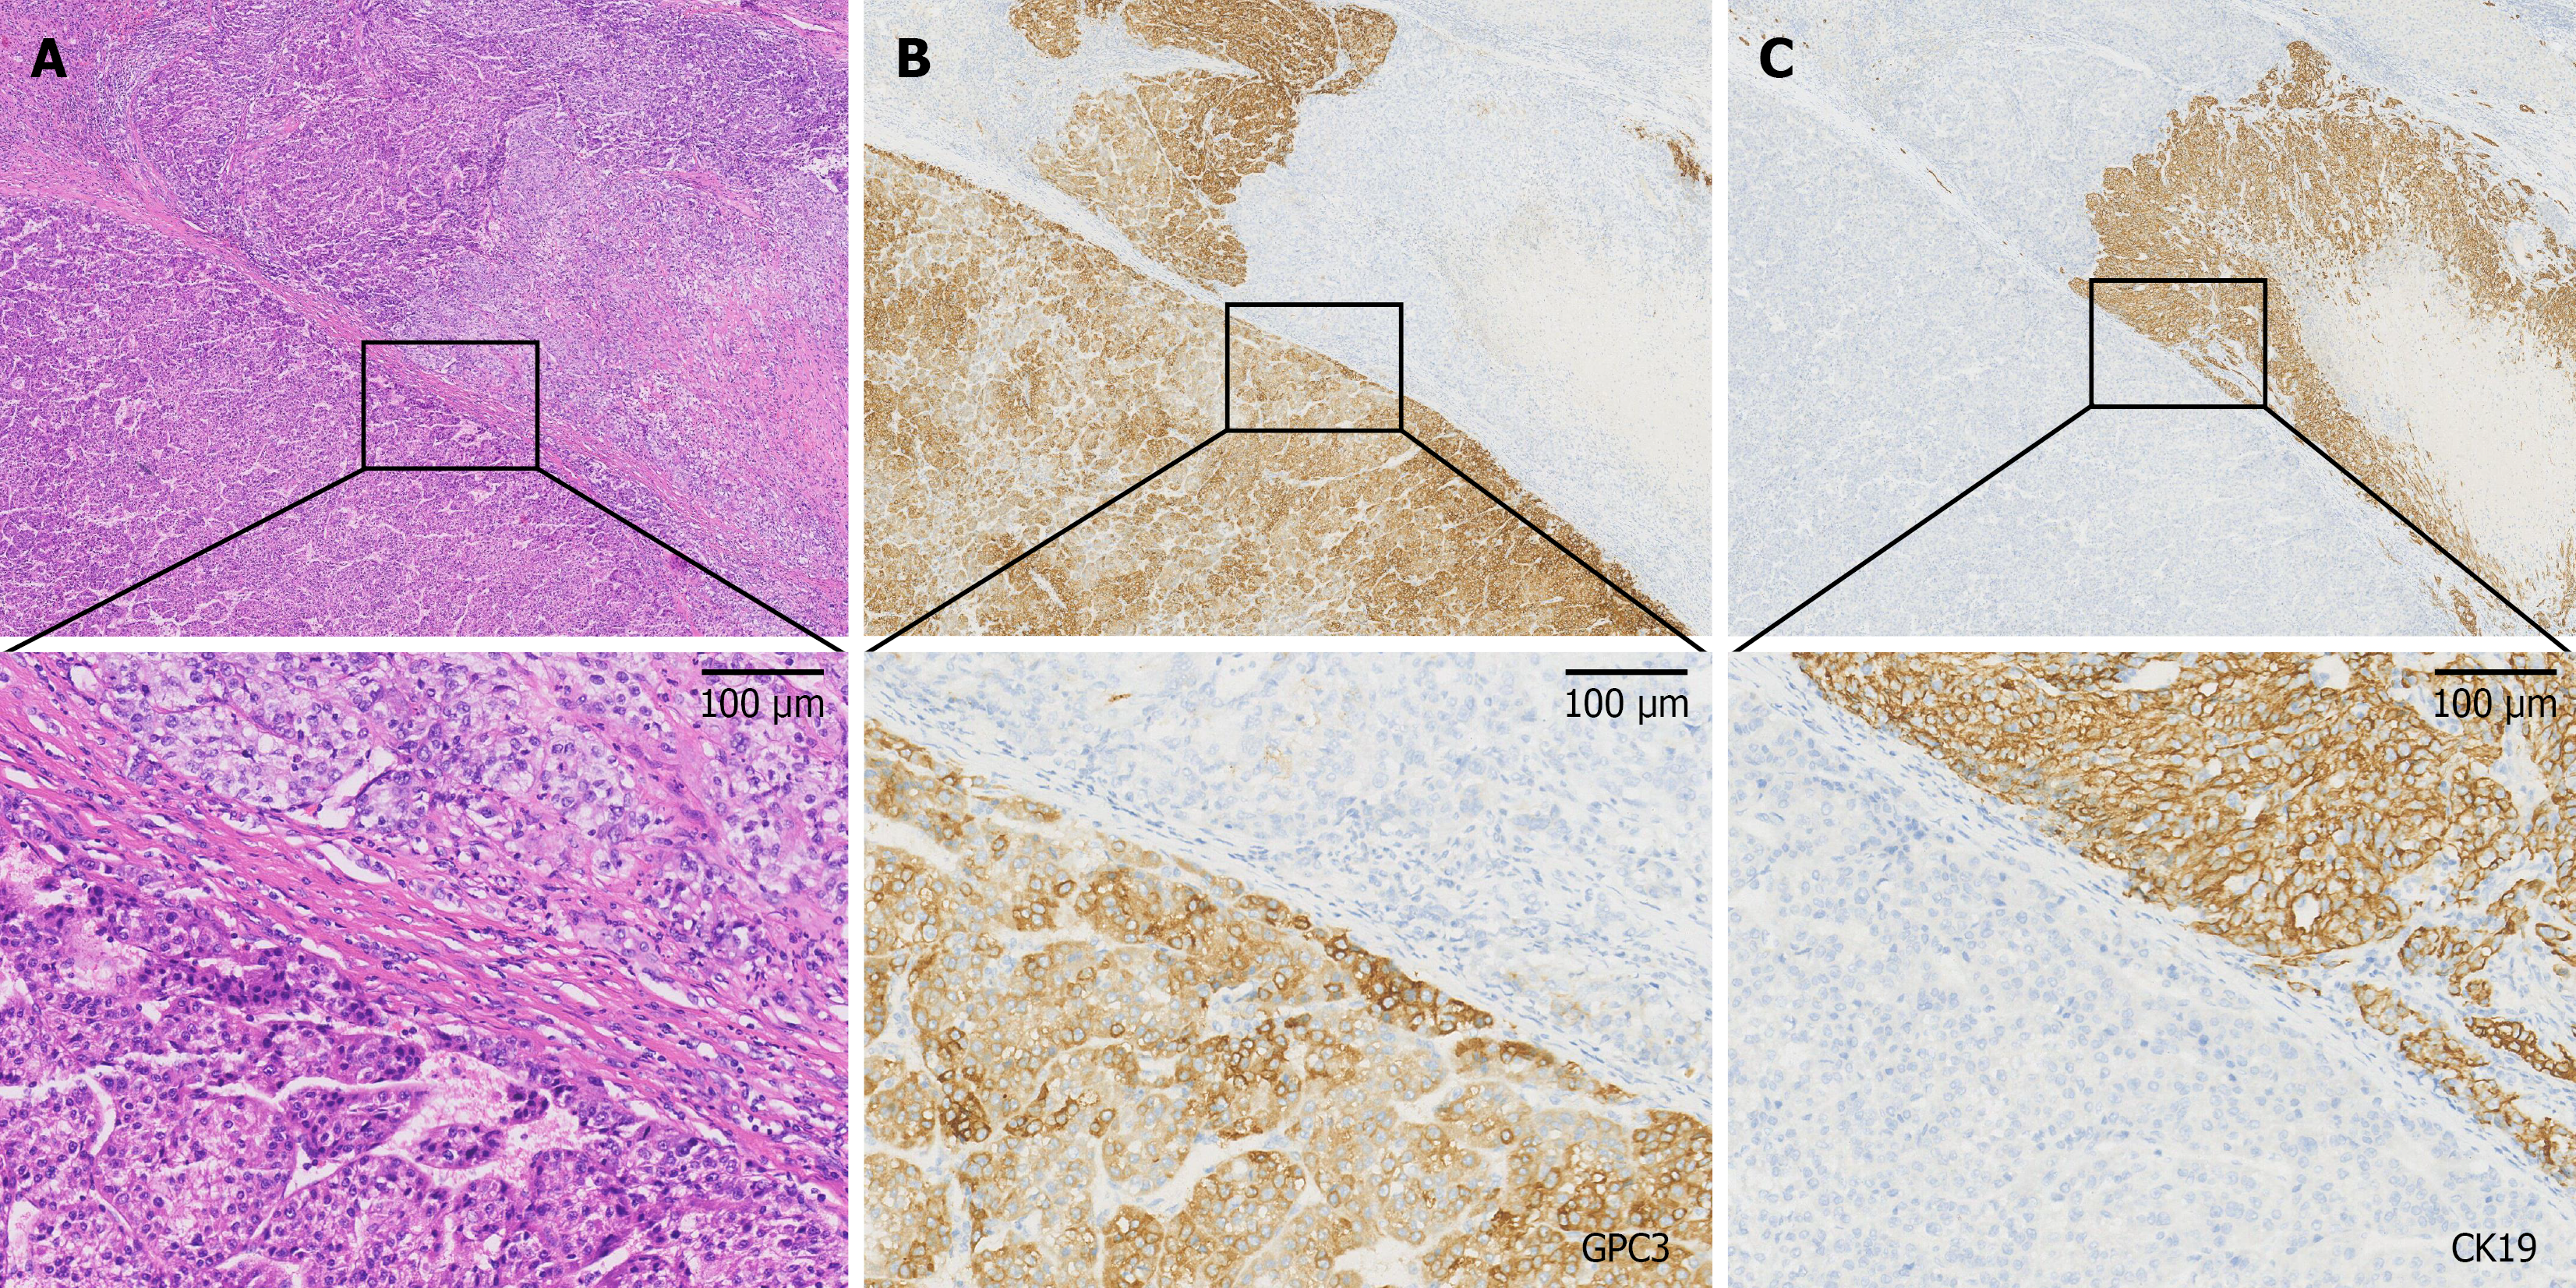
Figure 1 Histopathological features of patients with combined hepatocellular cholangiocarcinoma.
A: Hematoxylin and eosin staining showing distinct hepatocellular carcinoma-like and cholangiocarcinoma-like regions; B: Immunohistochemical staining for GPC3 confirms the hepatocellular phenotype; C: Immunohistochemical staining for CK19 confirms the cholangiocellular phenotype.
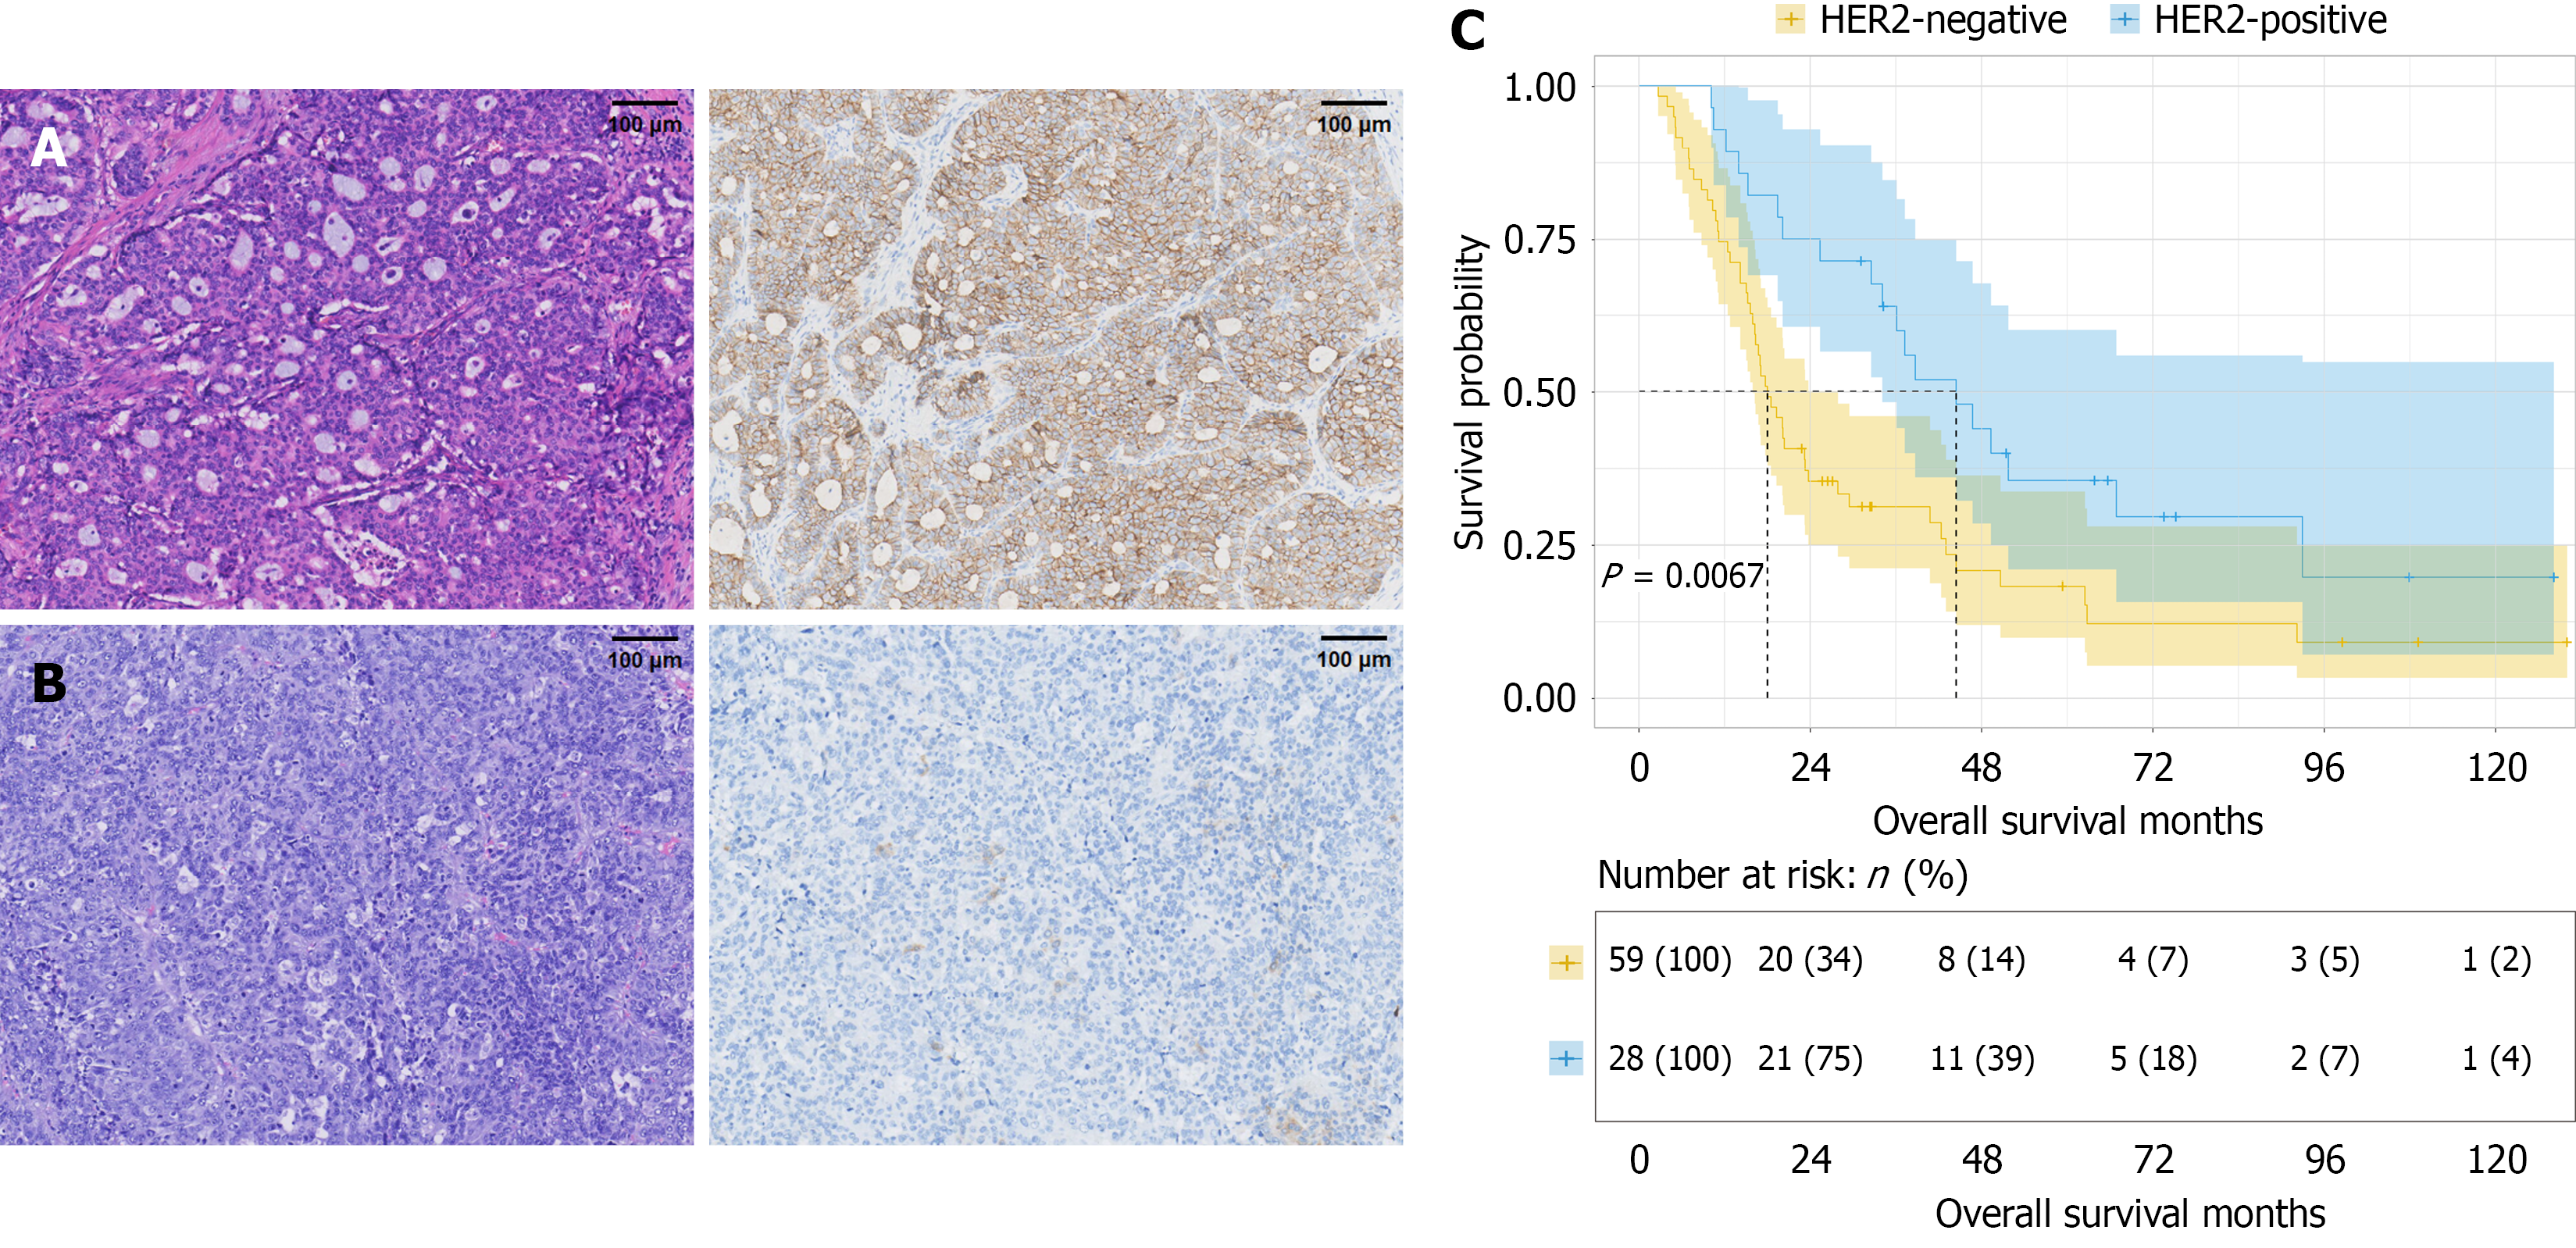
Figure 2 Human epidermal growth factor receptor 2 expression and survival outcomes in patients with combined hepatocellular cholangiocarcinoma.
A: Postoperative hematoxylin and eosin (H&E) staining and immunohistochemistry detection of human epidermal growth factor receptor 2 (HER2) in HER2-positive patients; B: Postoperative H&E staining and immunohistochemical detection of HER2 in HER2-negative patients; C: Kaplan-Meier curve comparing overall survival between HER2-positive and HER2-negative patients.
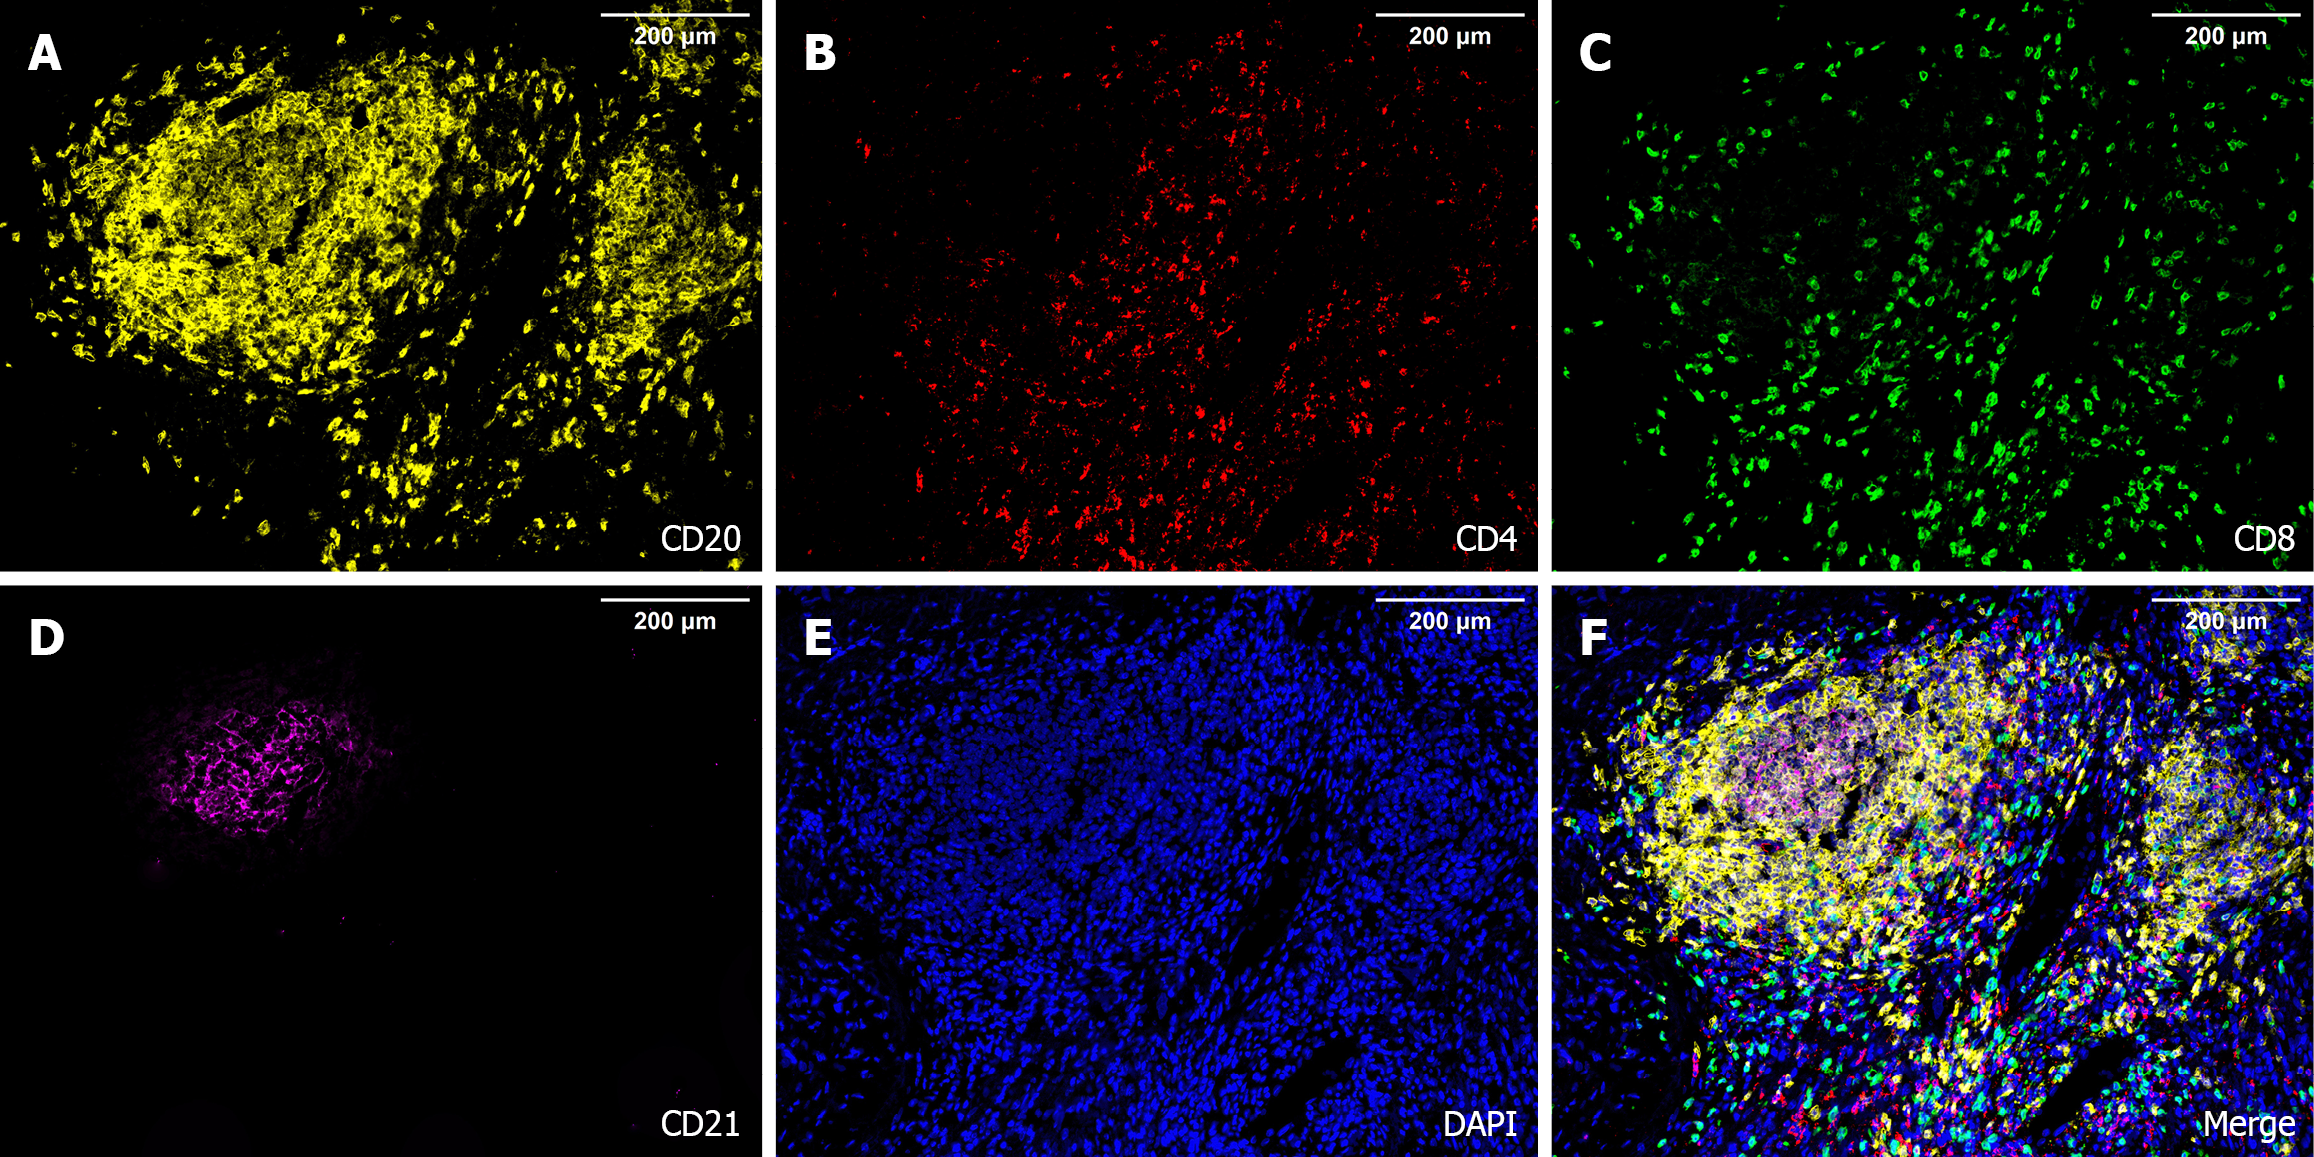
Figure 3 Postoperative analysis of tertiary lymphoid structures in patient tissue specimens by immunofluorescence.
A: High-magnification view showing the spatial distribution and density of CD20+ B cells within the tertiary lymphoid structure (TLS); B: High-magnification view showing the spatial distribution and density of CD4+ T helper cells; C: High-magnification view showing the spatial distribution and density of CD8+ cytotoxic T cells; D: High-magnification view showing the spatial distribution and density of the CD21+ follicular dendritic cell network; E: Visualization of tissue architecture and cell nuclei using DAPI nuclear counterstain; F: Merged image showing the integrated architecture and spatial co-localization of the various immune cell subsets within a representative TLS.
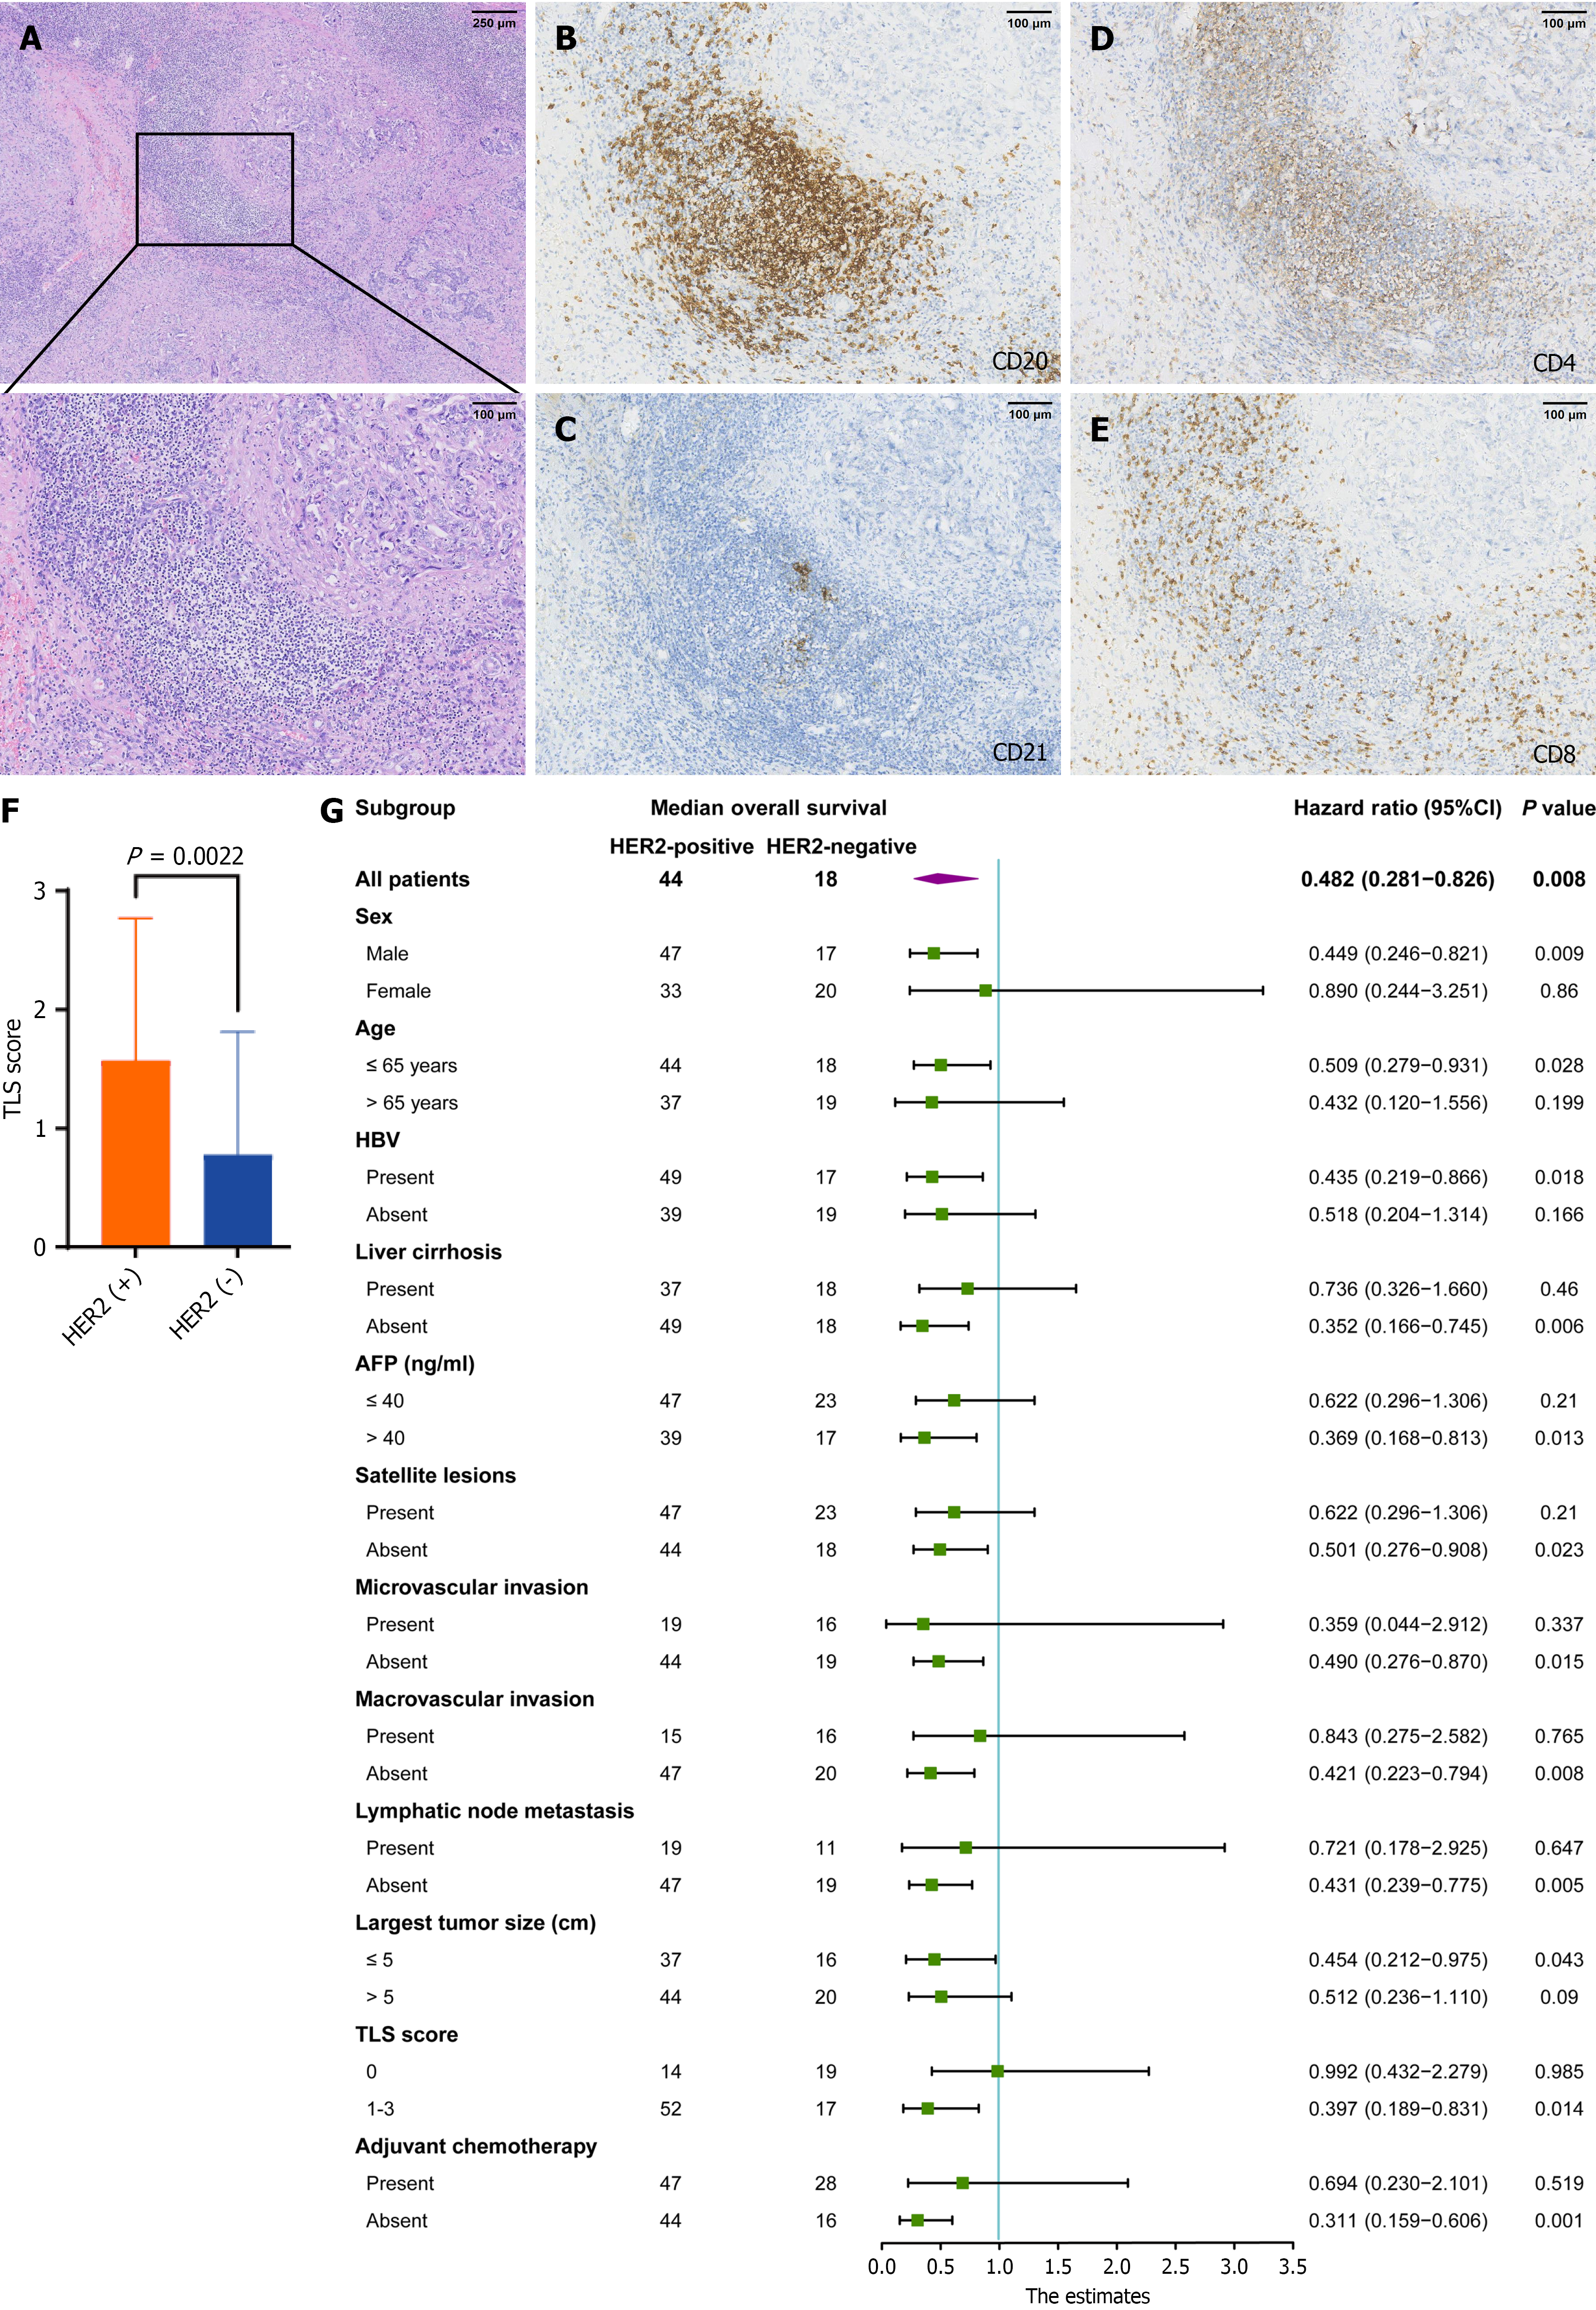
Figure 4 Assessment of tertiary lymphoid structures and their prognostic value stratified by human epidermal growth factor receptor 2 status.
A: Hematoxylin and eosin staining showing the histopathological structure of tertiary lymphoid structures (TLS); B: Immunohistochemistry (IHC) staining for CD20 within the TLS; C: IHC staining for CD21; D: IHC staining for CD4; E: IHC staining for CD8; F: Correlation analysis between TLS abundance (TLS score) and human epidermal growth factor receptor 2 (HER2) expression; G: Forest plot showing subgroup survival analysis comparing overall survival between HER2-positive and HER2-negative patients across clinicopathological factors.
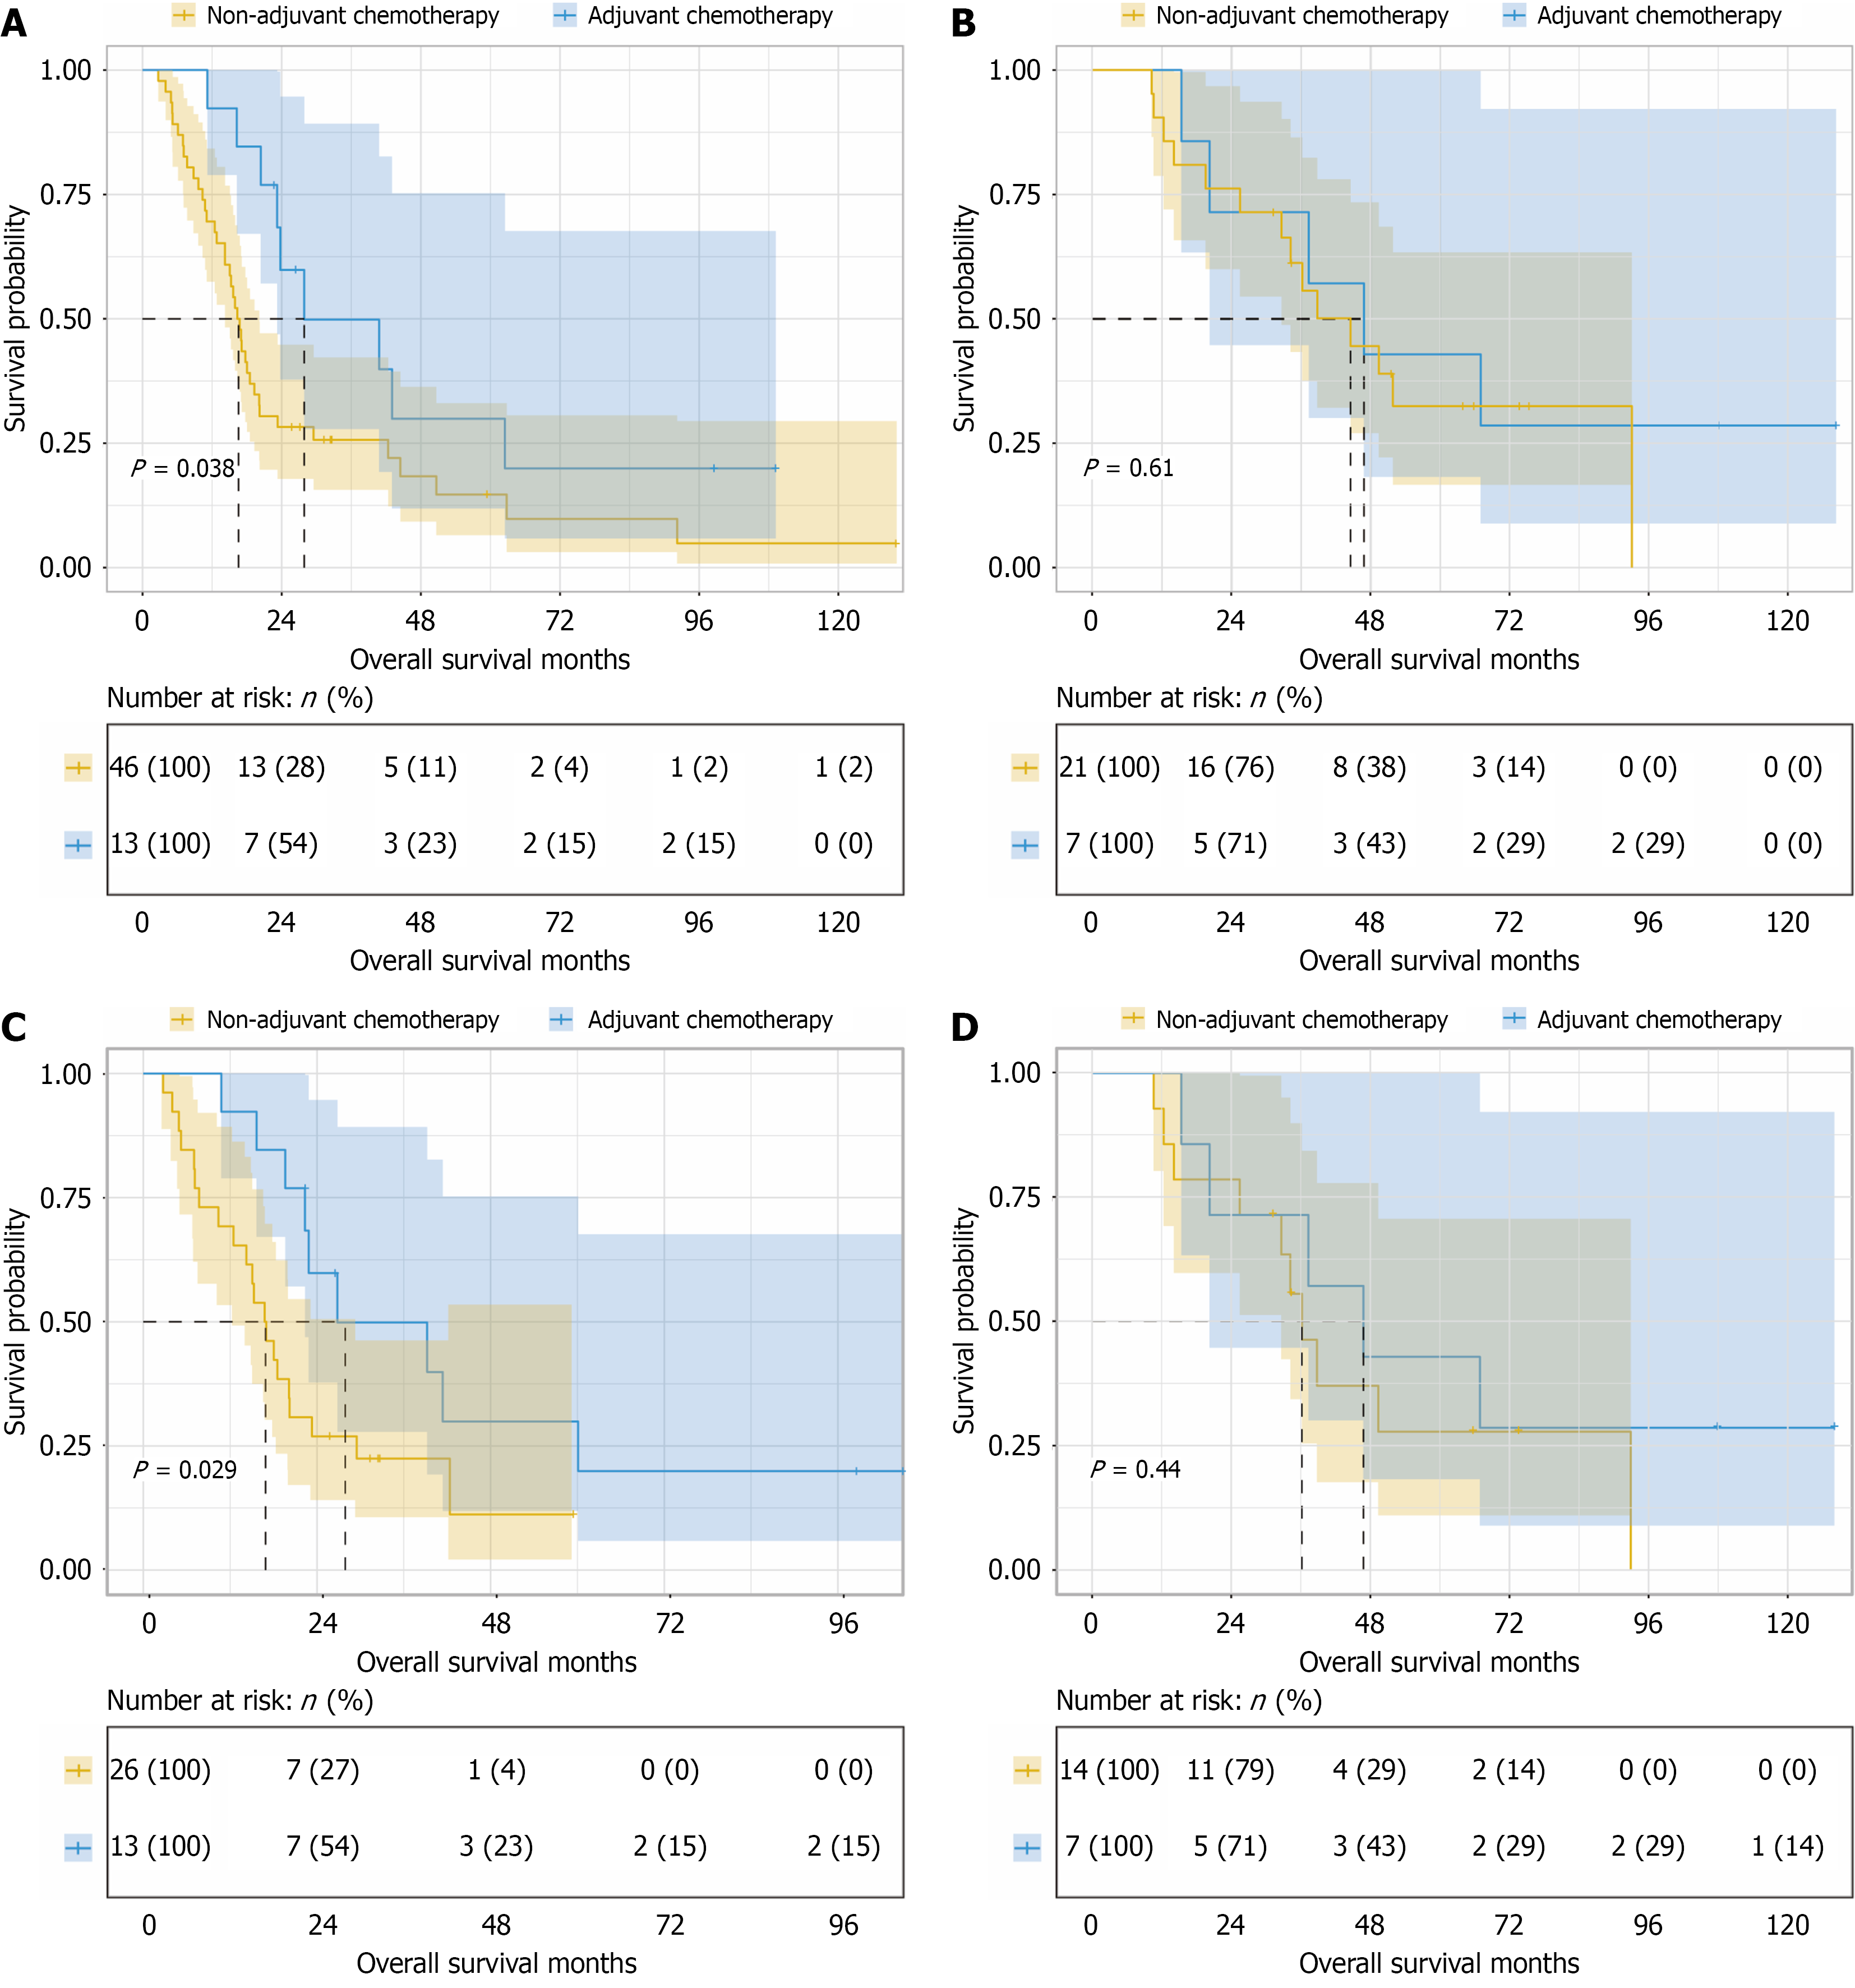
Figure 5 Comparative analysis of adjuvant chemotherapy benefit in human epidermal growth factor receptor 2-positive and human epidermal growth factor receptor 2-negative patients before and after propensity score matching.
A: Kaplan-Meier survival curve for overall survival (OS) in human epidermal growth factor receptor 2 (HER2)-negative patients before propensity score matching (PSM), showing a significant benefit from adjuvant chemotherapy; B: Kaplan-Meier survival curve for OS in HER2-positive patients before PSM, showing no significant difference between chemotherapy and non-chemotherapy groups; C: Kaplan-Meier survival curve for OS in HER2-negative patients after PSM, confirming the continued survival benefit of adjuvant chemotherapy; D: Kaplan-Meier survival curve for OS in HER2-positive patients after PSM, validating no significant benefit from conventional chemotherapy.
- Citation: Han RY, Wei YK, Liu WN, Wang YM, Song TQ, Tian XD, Xia YR, Chen L, Gong WC. Human epidermal growth factor receptor 2 in combined hepatocellular-cholangiocarcinoma: Prognostic and predictive guide for adjuvant chemotherapy. World J Gastroenterol 2026; 32(22): 117417
- URL: https://www.wjgnet.com/1007-9327/full/v32/i22/117417.htm
- DOI: https://dx.doi.org/10.3748/wjg.v32.i22.117417