
















Copyright: ©Author(s) 2026.
World J Gastroenterol. Jun 14, 2026; 32(22): 116469
Published online Jun 14, 2026. doi: 10.3748/wjg.v32.i22.116469
Published online Jun 14, 2026. doi: 10.3748/wjg.v32.i22.116469
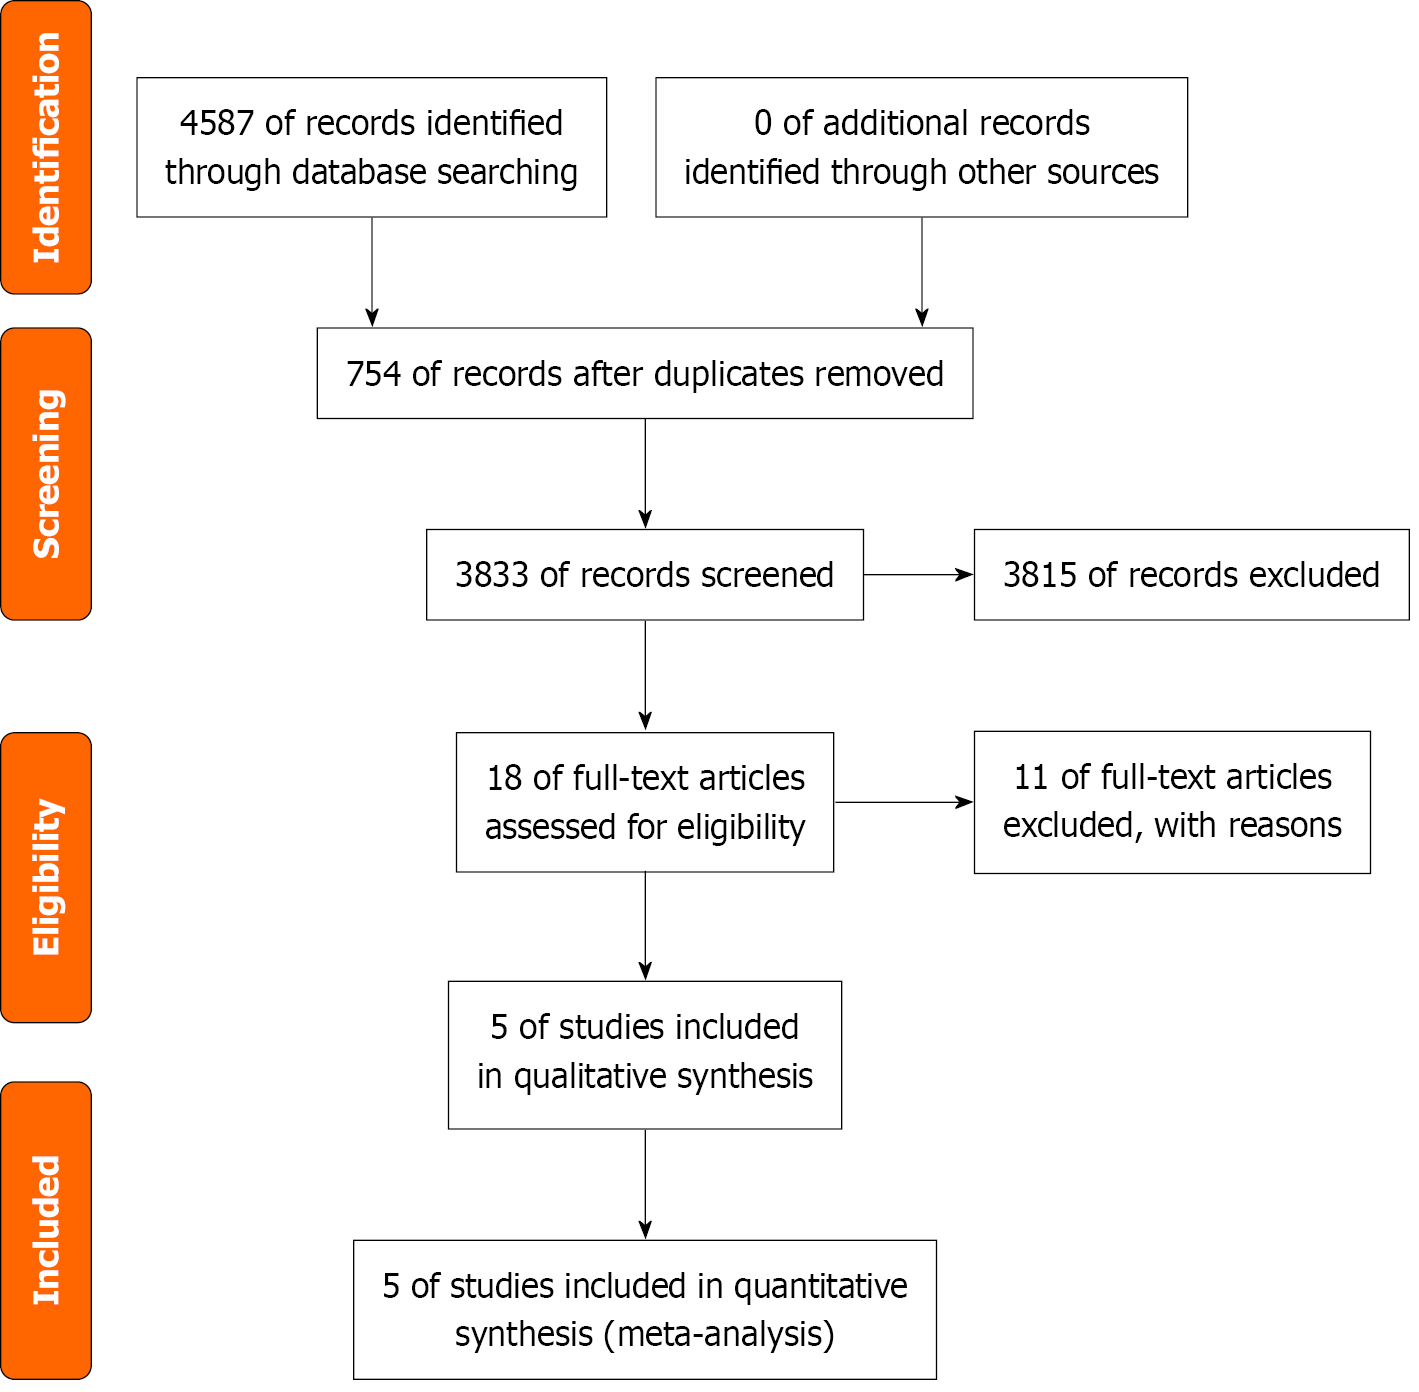
Figure 1
PRISMA flow diagram for the study selection process.
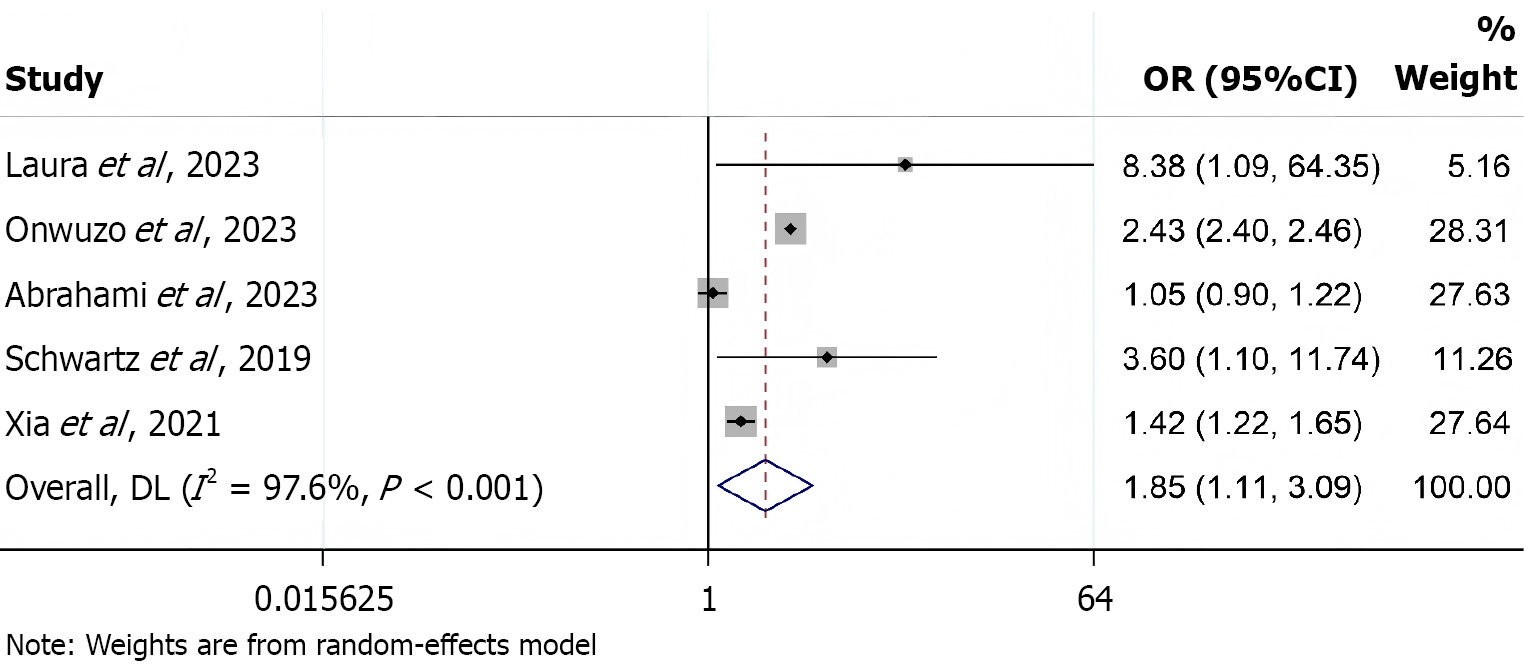
Figure 2 Forest plot for the association between proton pump inhibitor use and incident inflammatory bowel disease.
OR: Odds ratio; CI: Confidential interval.
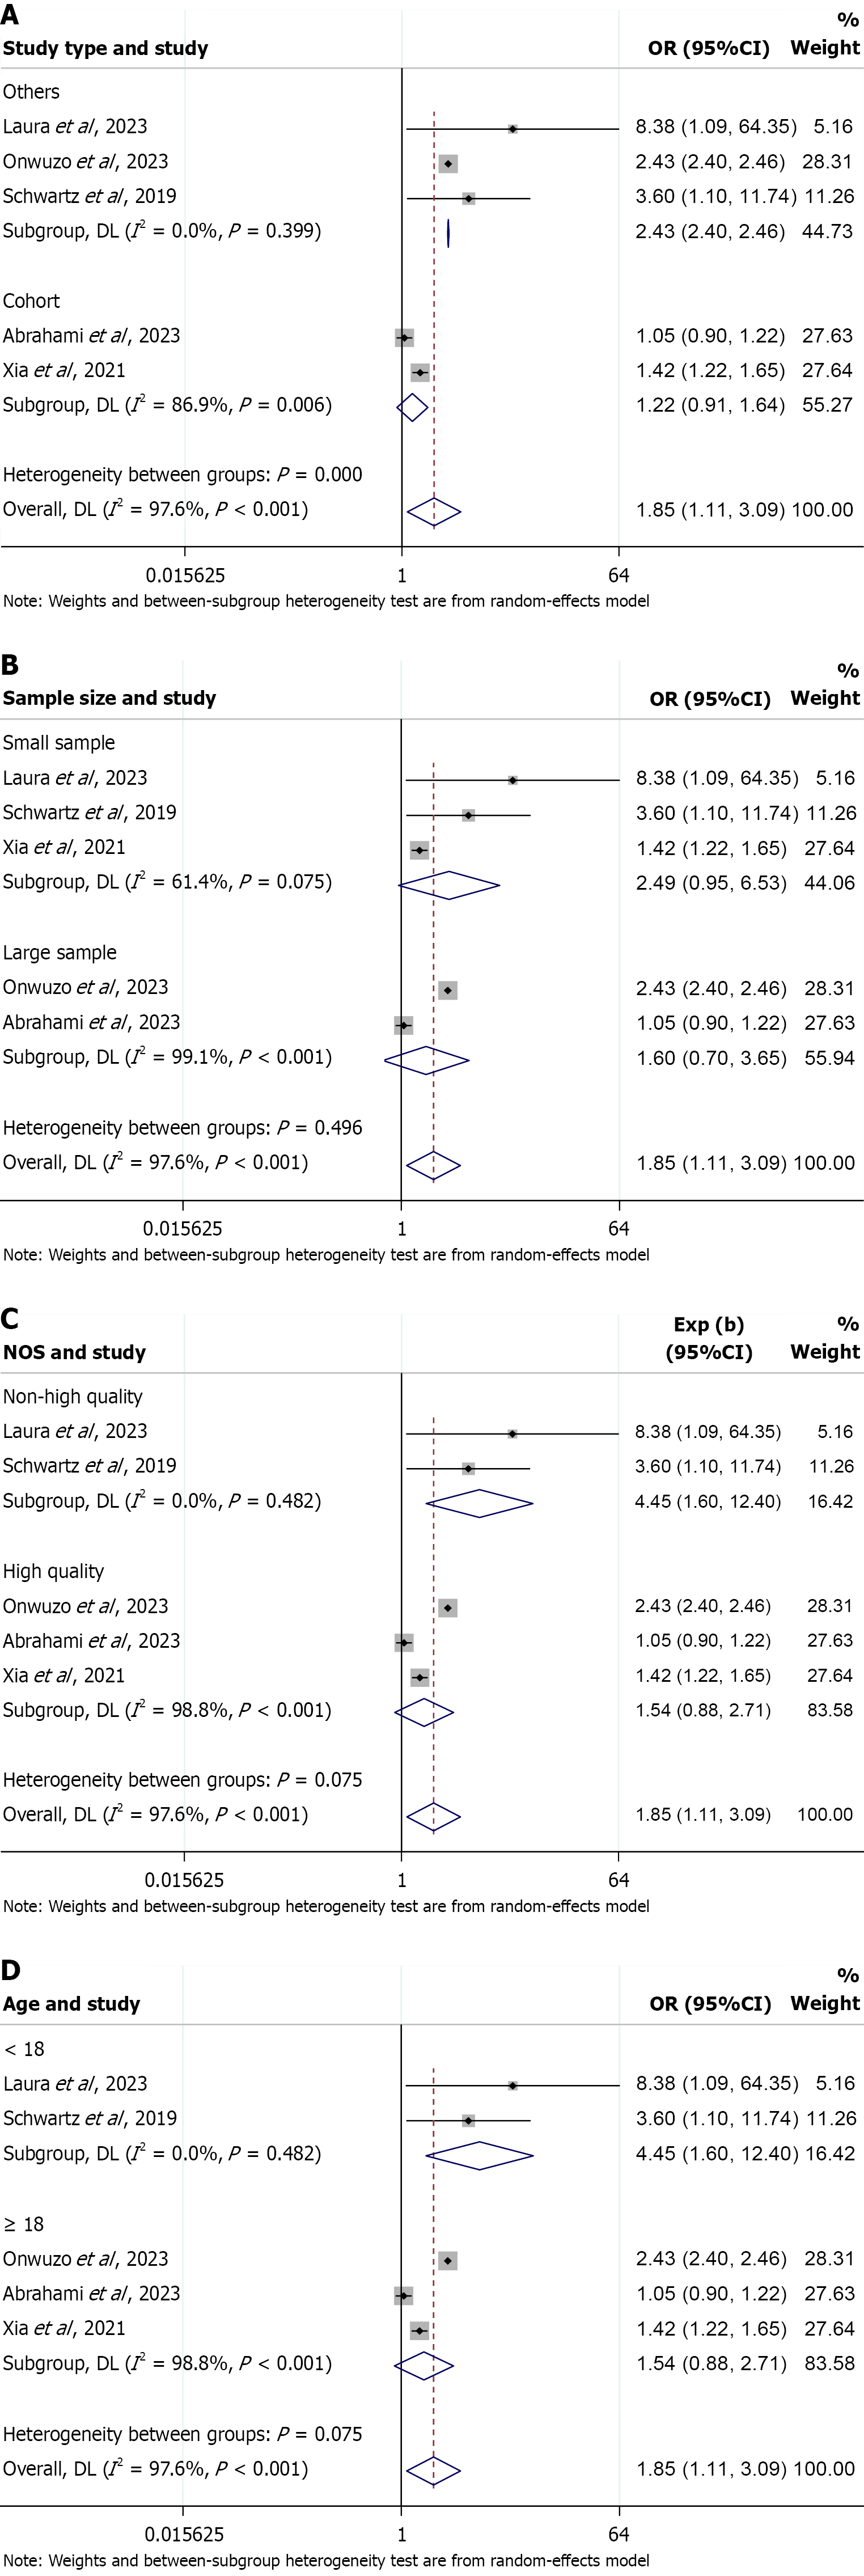
Figure 3 Subgroup analysis of proton pump inhibitor use and inflammatory bowel disease risk.
A: Subgroup analysis by study design; B: Subgroup analysis by sample size; C: Subgroup analysis by study quality; D: Subgroup analysis by participant age. OR: Odds ratio; CI: Confidential interval.
- Citation: Gao M, Yin RR, Mao X, Shao ZX, Shi YY. Association between proton pump inhibitor use and the risk of inflammatory bowel disease: A systematic review and meta-analysis. World J Gastroenterol 2026; 32(22): 116469
- URL: https://www.wjgnet.com/1007-9327/full/v32/i22/116469.htm
- DOI: https://dx.doi.org/10.3748/wjg.v32.i22.116469