
















Copyright: ©Author(s) 2026.
World J Gastroenterol. Jun 7, 2026; 32(21): 118057
Published online Jun 7, 2026. doi: 10.3748/wjg.v32.i21.118057
Published online Jun 7, 2026. doi: 10.3748/wjg.v32.i21.118057
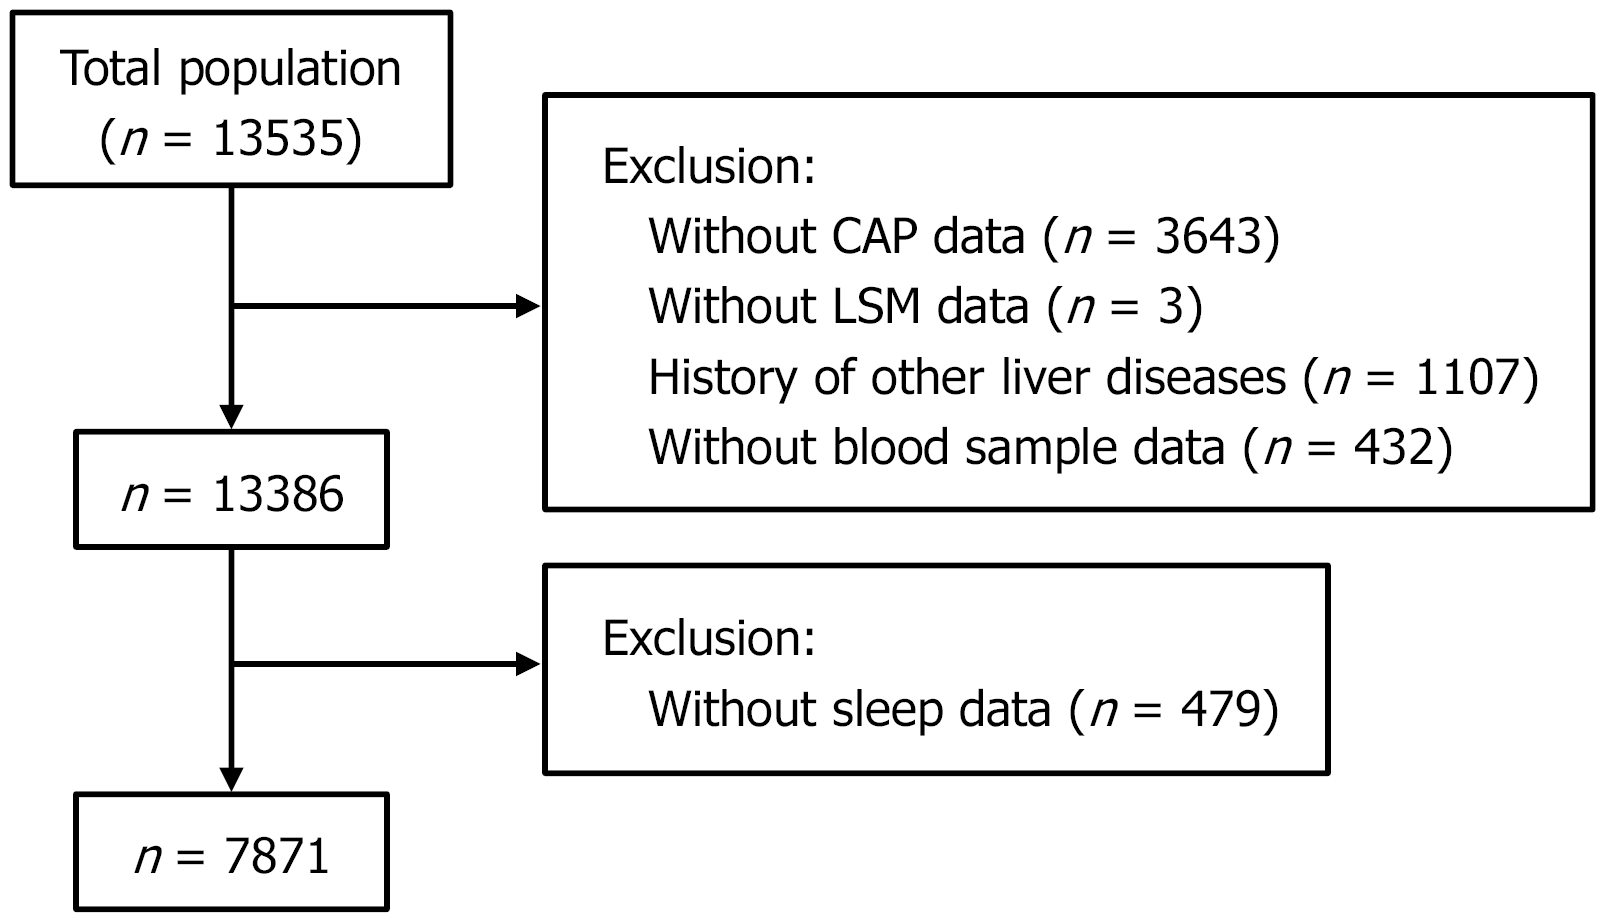
Figure 1 The enrollment of population.
CAP: Controlled attenuation parameter; LSM: Liver stiffness measurement.
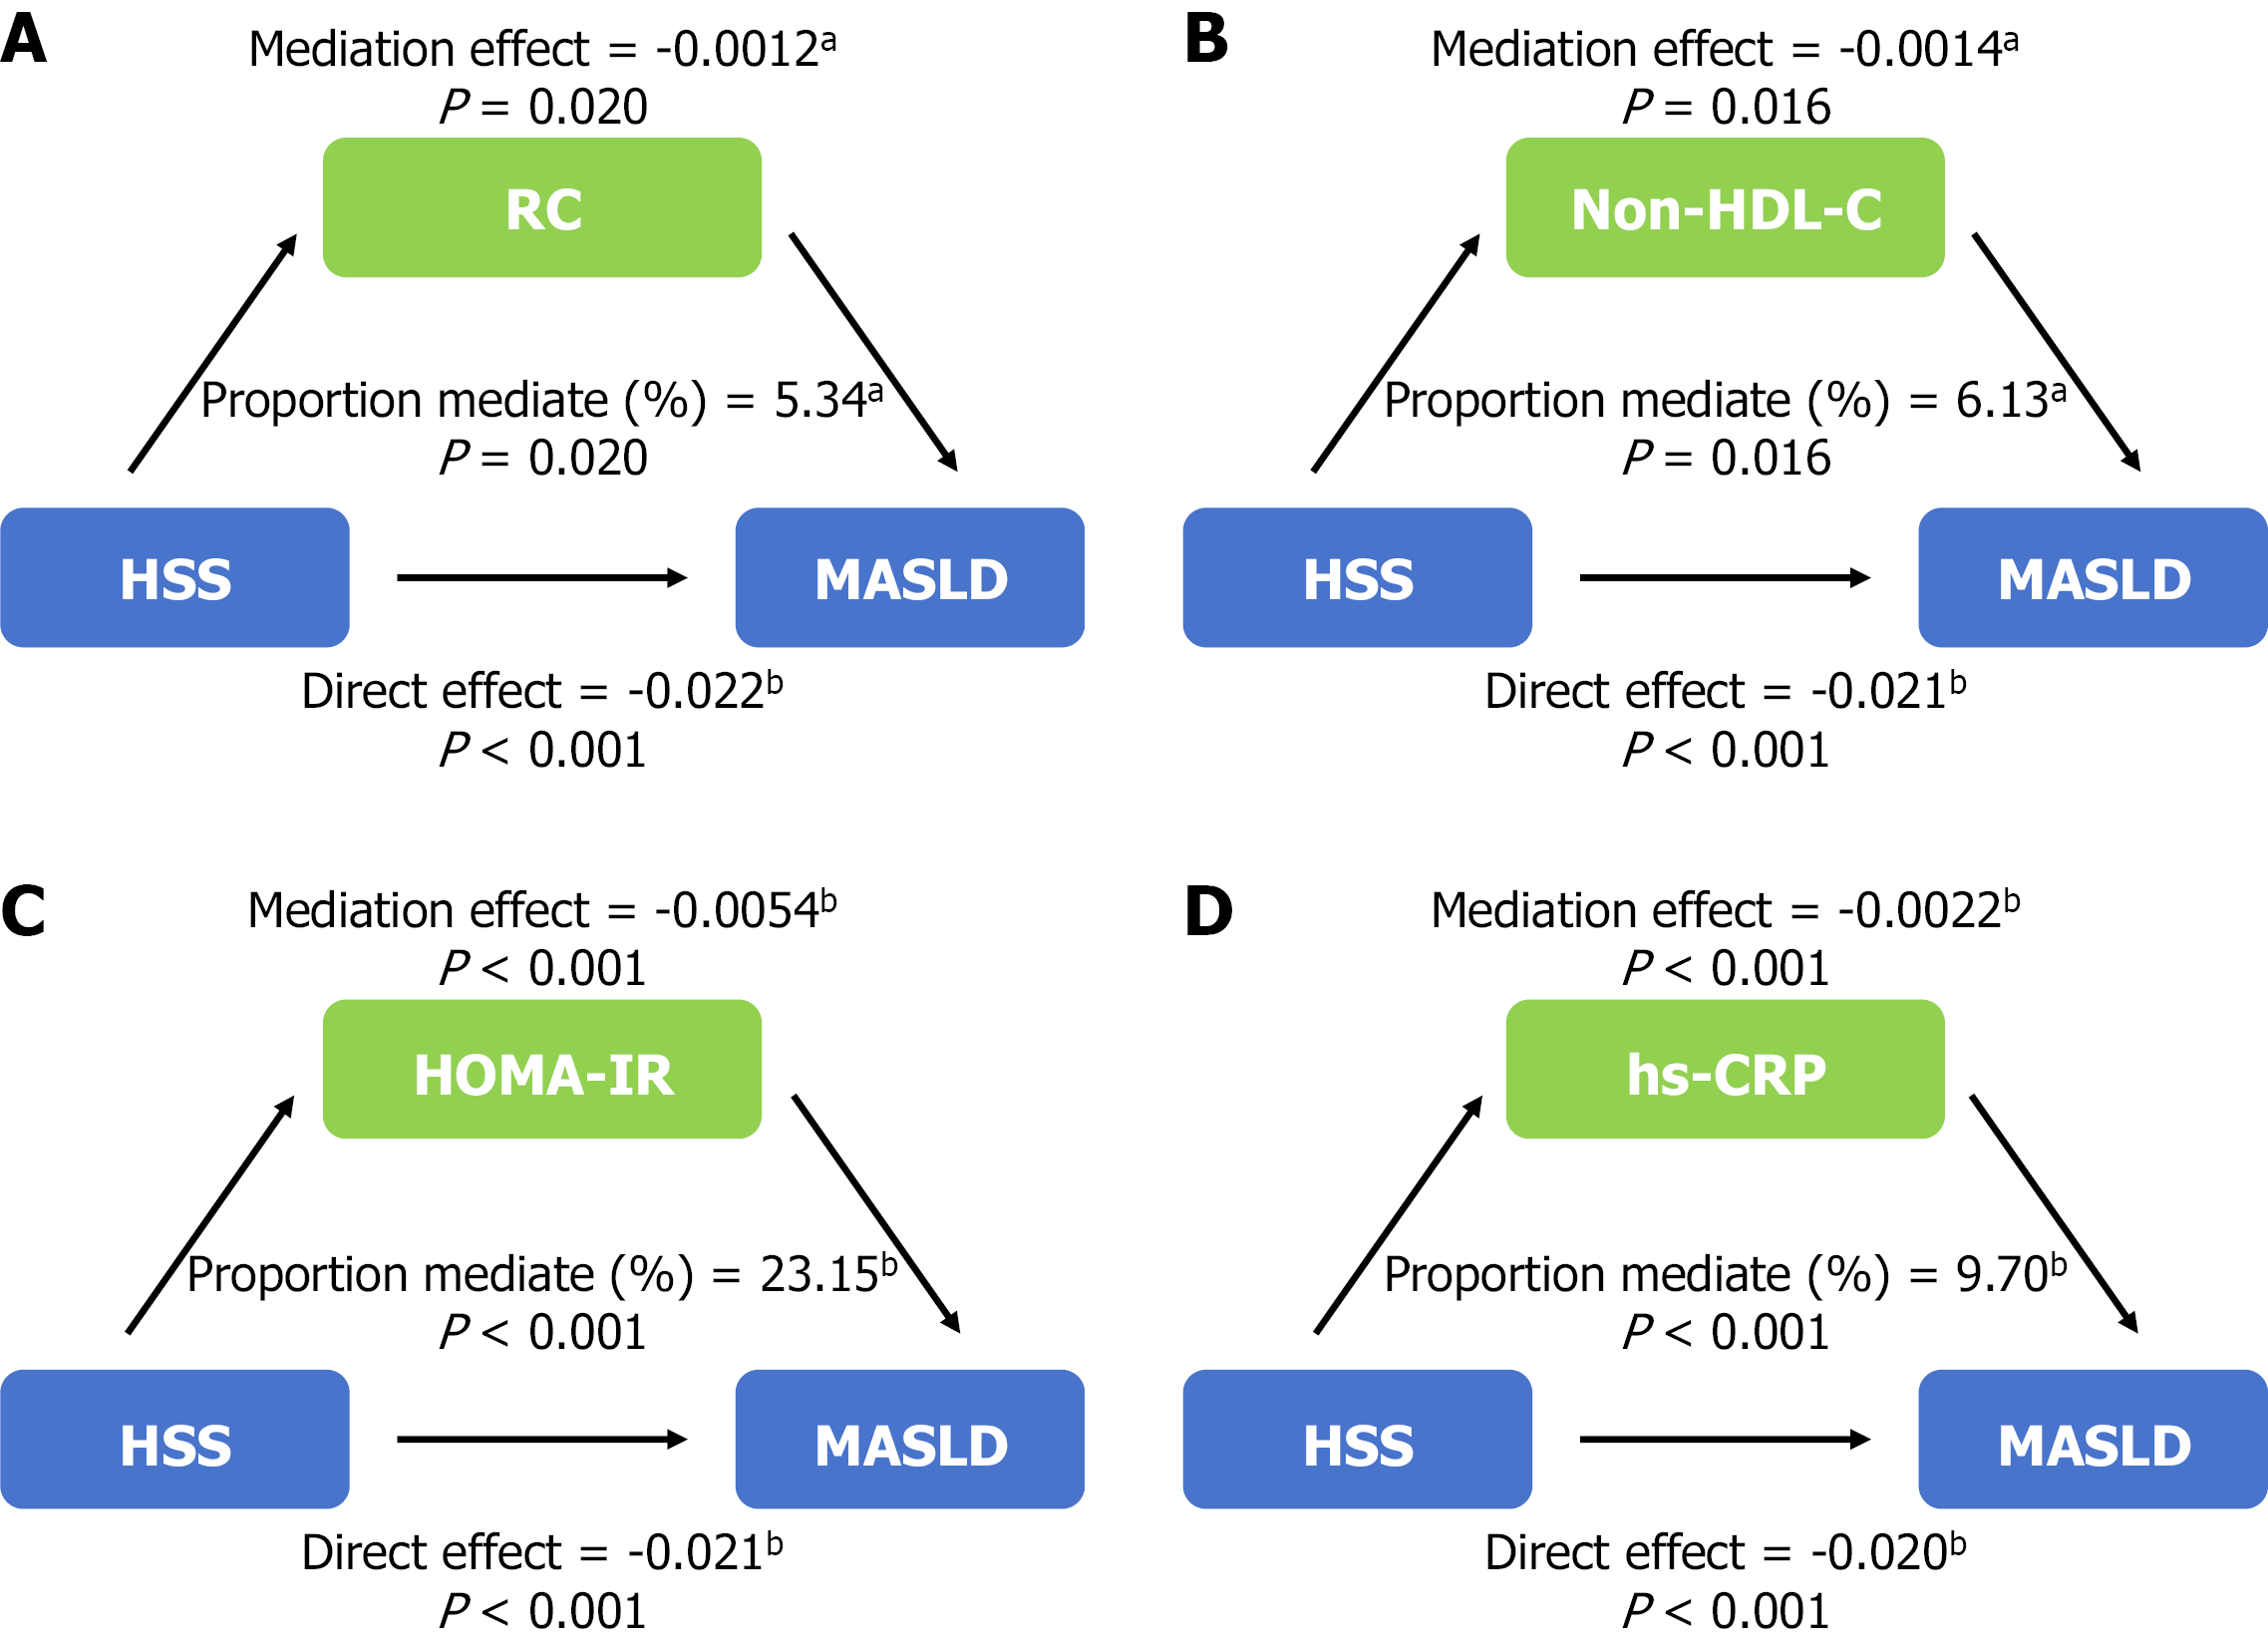
Figure 2 Mediating role of metabolic and inflammatory indicators in the healthy sleep score and metabolic dysfunction-associated steatotic liver disease relationship.
A: Mediating role of remnant cholesterol in the healthy sleep score (HSS)-metabolic dysfunction-associated steatotic liver disease (MASLD) association; B: Mediating role of non-high-density lipoprotein cholesterol (non-HDL-C) in the HSS-MASLD association; C: Mediating role of homeostasis model assessment of insulin resistance (HOMA-IR) in the HSS-MASLD association; D: Mediating role of high-sensitivity C-reactive protein in the HSS-MASLD association. Diabetes was not adjusted for in the covariates when HOMA-IR was as the mediator. aP < 0.05; bP < 0.001. MASLD: Metabolic dysfunction-associated steatotic liver disease; RC: Remnant cholesterol; Non-HDL-C: Non-high-density lipoprotein cholesterol; HOMA-IR: Homeostasis model assessment of insulin resistance; hs-CRP: High-sensitivity C-reactive protein; HSS: Healthy sleep score.
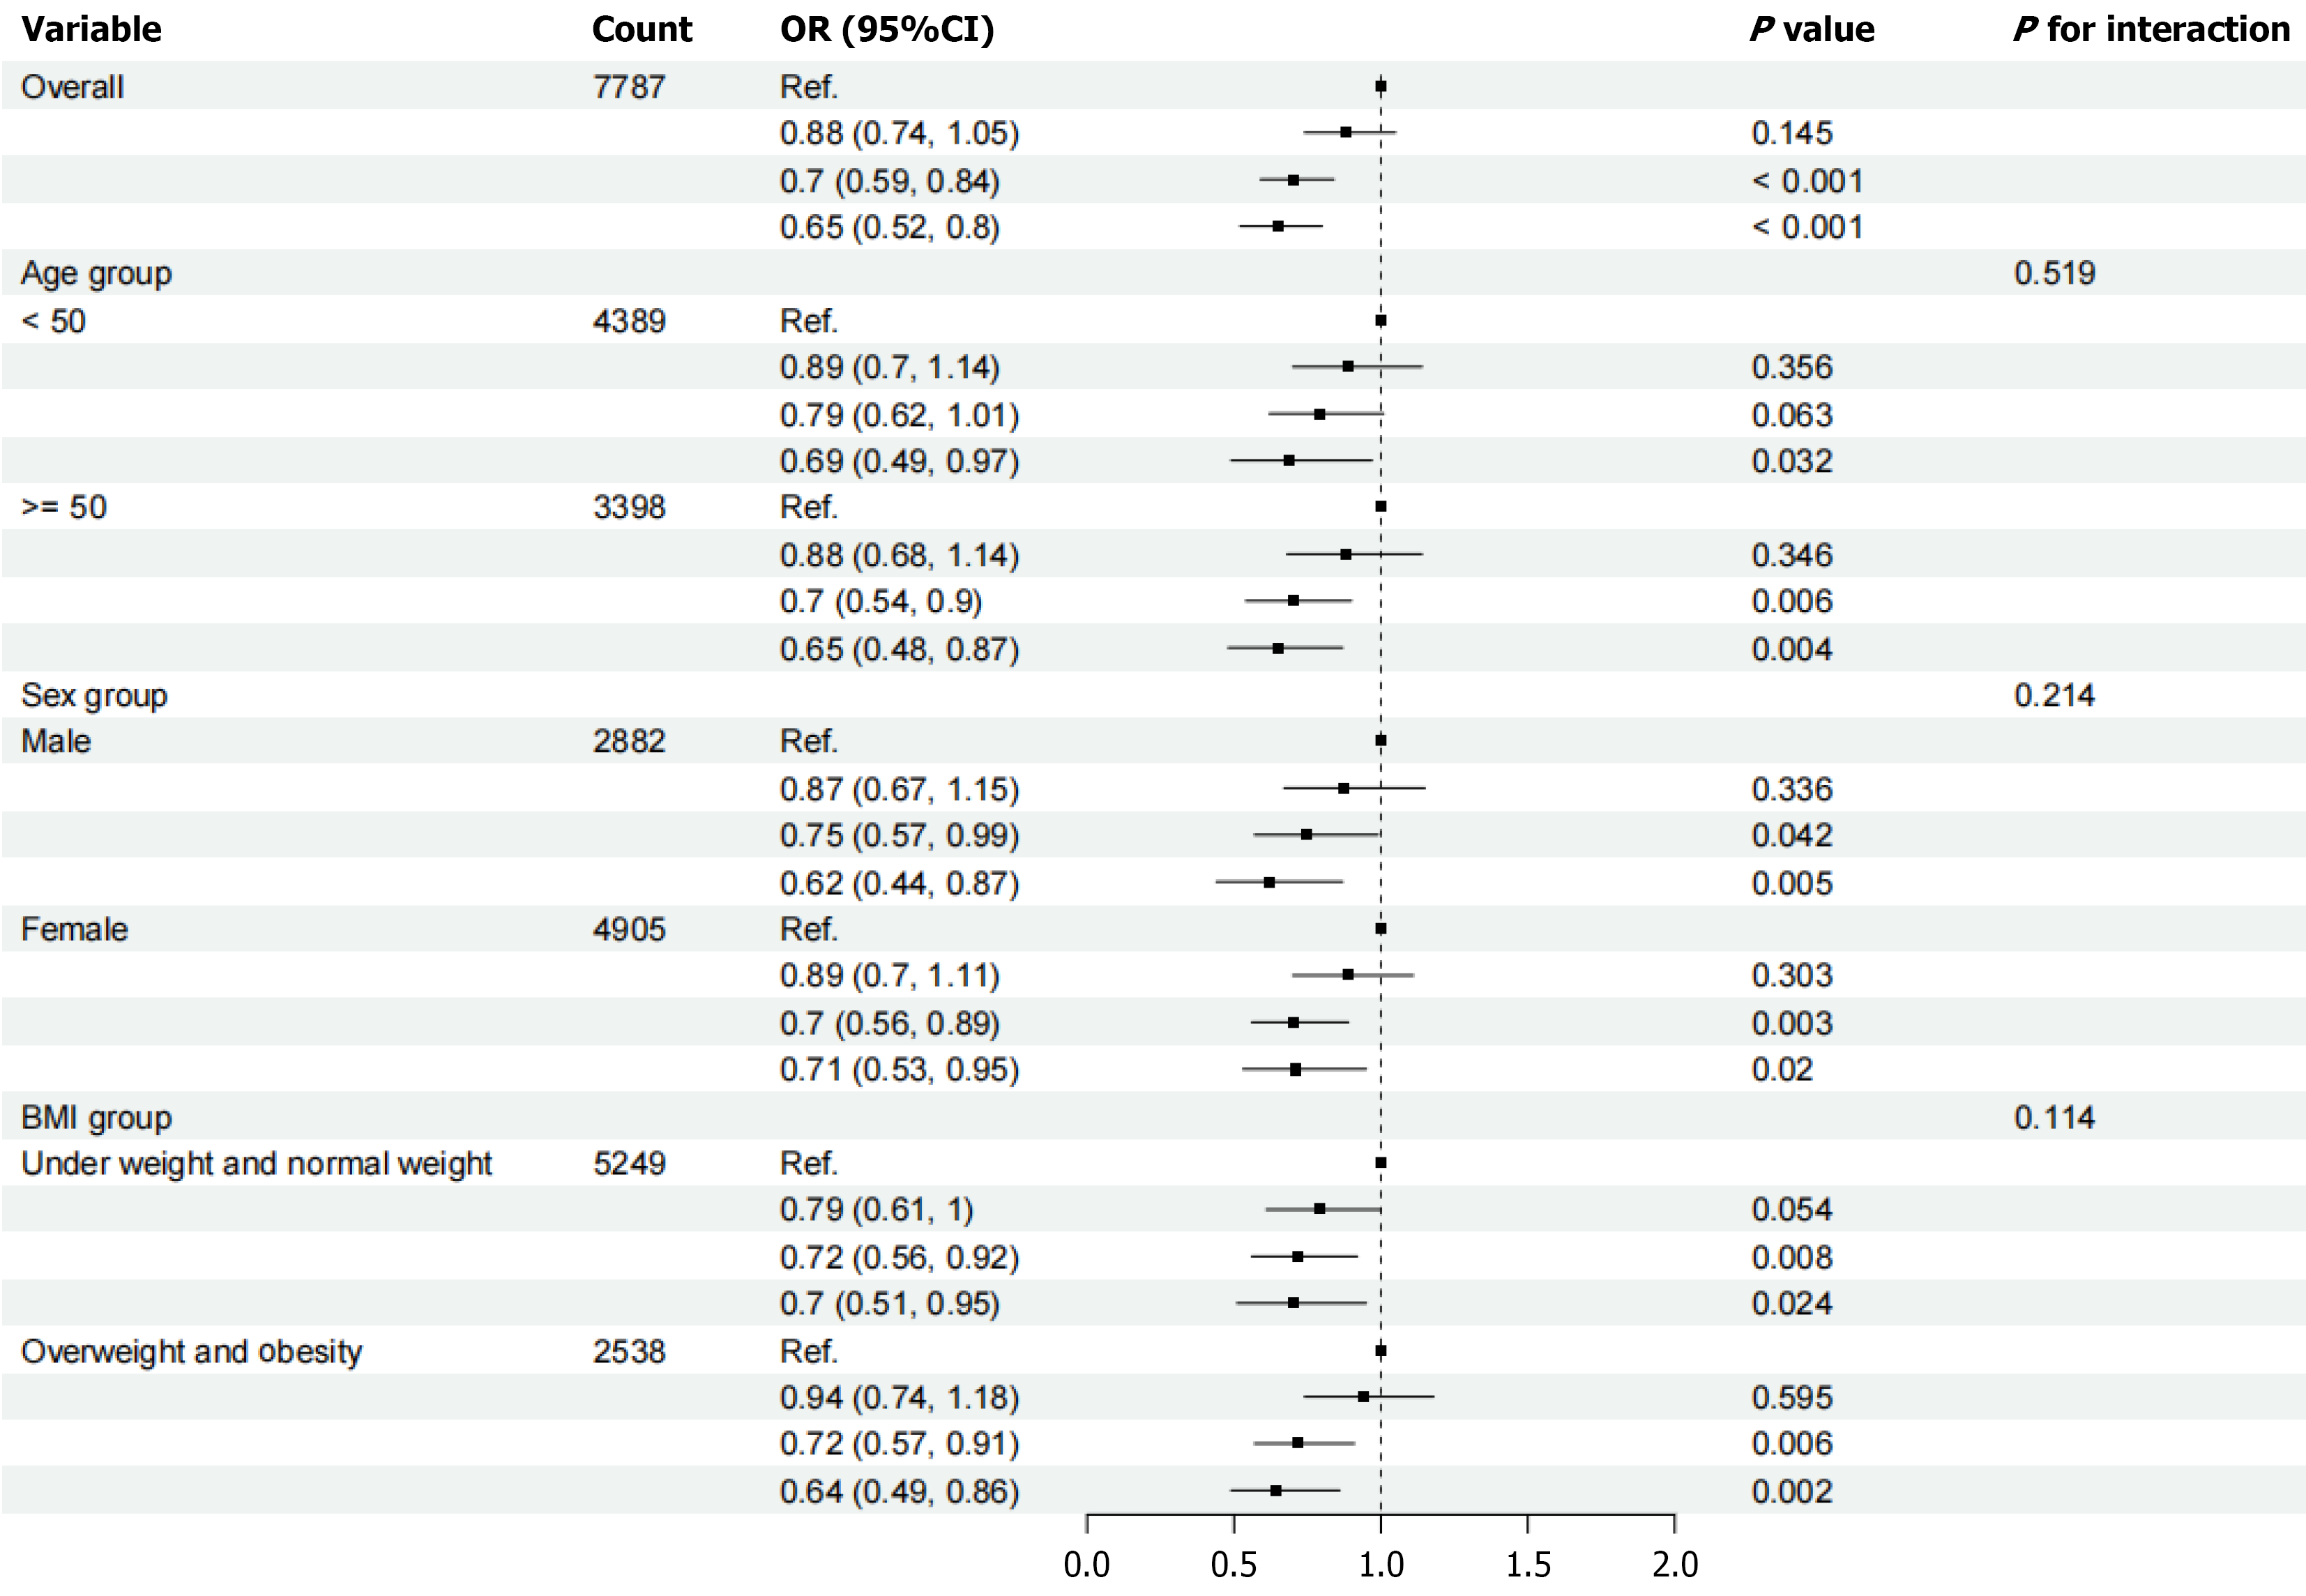
Figure 3 Subgroup analysis of the association between healthy sleep score and metabolic dysfunction-associated steatotic liver disease.
The comprehensive model was adjusted for age, gender, physical exercise, smoking, education, body mass index (BMI), hypertension and diabetes. The model was adjusted for gender, physical exercise, smoking, education, BMI, hypertension and diabetes when age categories (< 50 years and ≥ 50 years) was analyzed in group. The model was adjusted for age, physical exercise, smoking, education, BMI, hypertension and diabetes when sex categories (male and female) was analyzed in group. The model was adjusted for age, sex, physical exercise, smoking, education, hypertension and diabetes when BMI categories (under-weight and normal weight BMI ≤ 24.9 kg/m2, overweight and obesity BMI > 24.9 kg/m2) was analyzed in group. Data are presented as the logistic regression index (95%CI). BMI: Body mass index.
- Citation: Yu QT, Lin YY, Gui ZH, Duan HL, Yang JJ, Meng Y, Peng XT, Liu L, Wan H, Shen J. Mediating roles of insulin resistance and inflammatory markers between healthy sleep scores and metabolic dysfunction-associated steatotic liver disease. World J Gastroenterol 2026; 32(21): 118057
- URL: https://www.wjgnet.com/1007-9327/full/v32/i21/118057.htm
- DOI: https://dx.doi.org/10.3748/wjg.v32.i21.118057