
















Copyright: ©Author(s) 2026.
World J Gastroenterol. Jun 7, 2026; 32(21): 117959
Published online Jun 7, 2026. doi: 10.3748/wjg.v32.i21.117959
Published online Jun 7, 2026. doi: 10.3748/wjg.v32.i21.117959
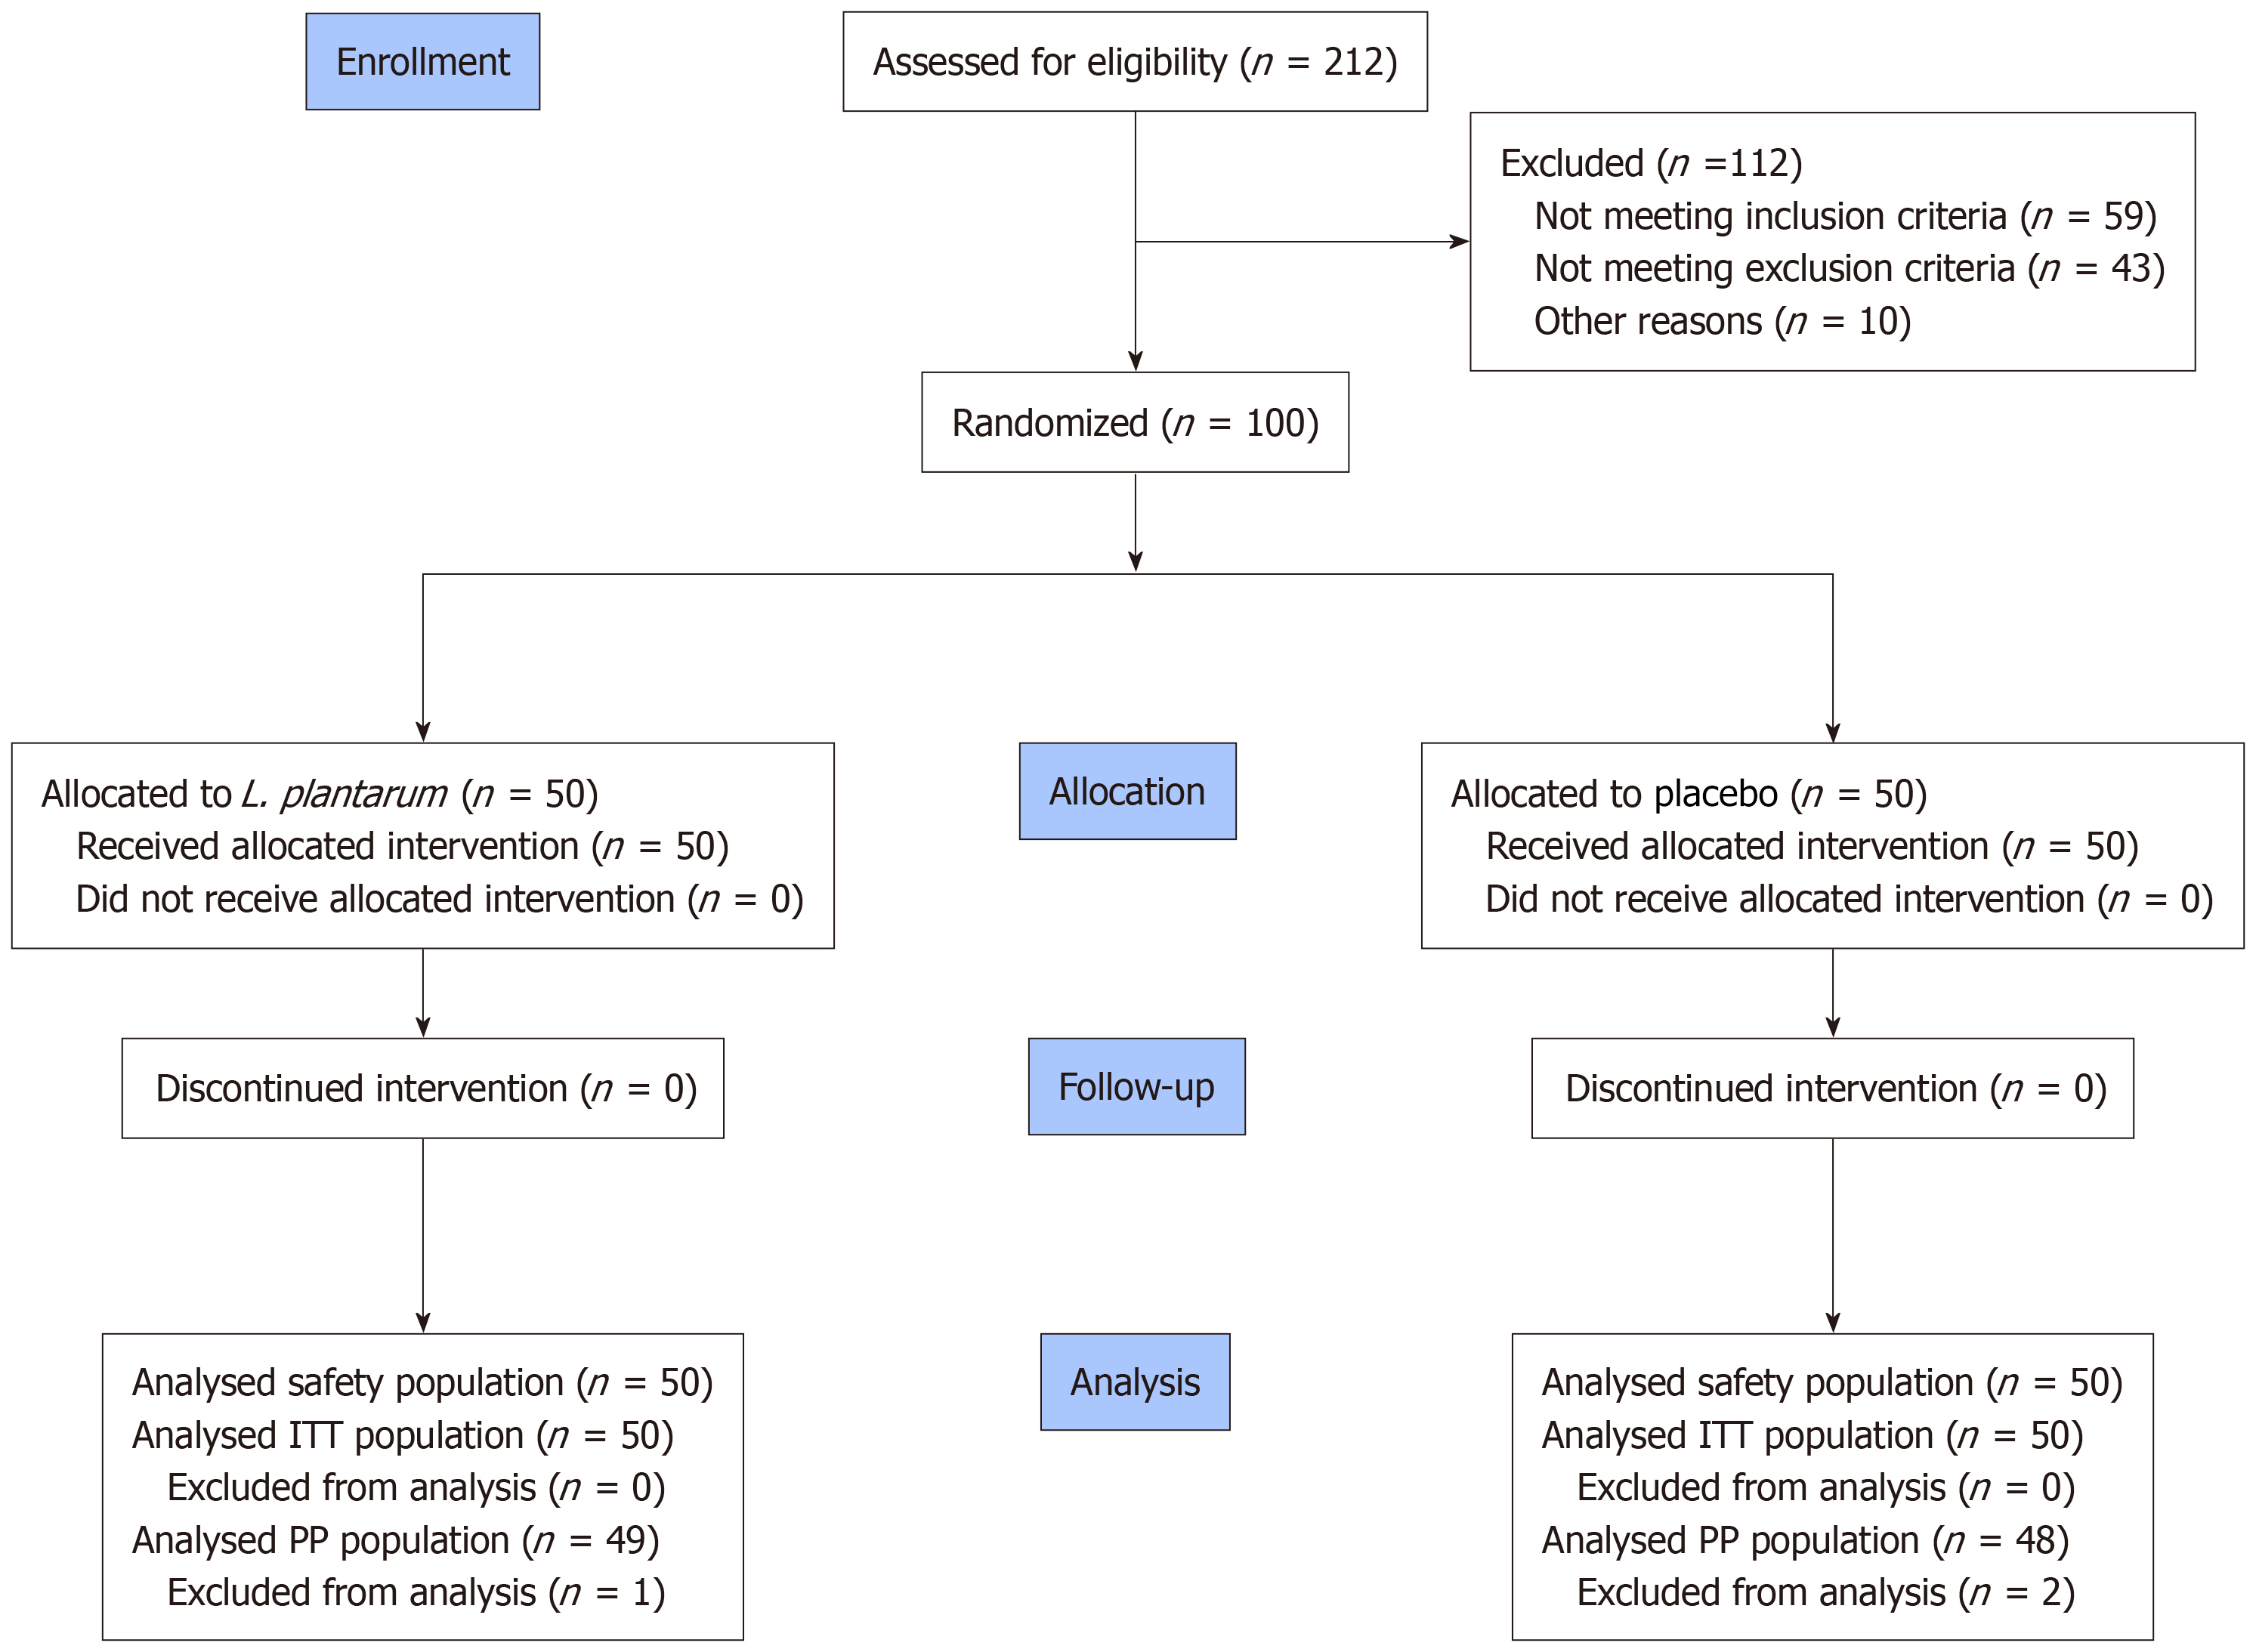
Figure 1 Subject flow chart.
L. plantarum: Lactiplantibacillus plantarum; ITT: Intention-to-treat; PP: Per-protocol.
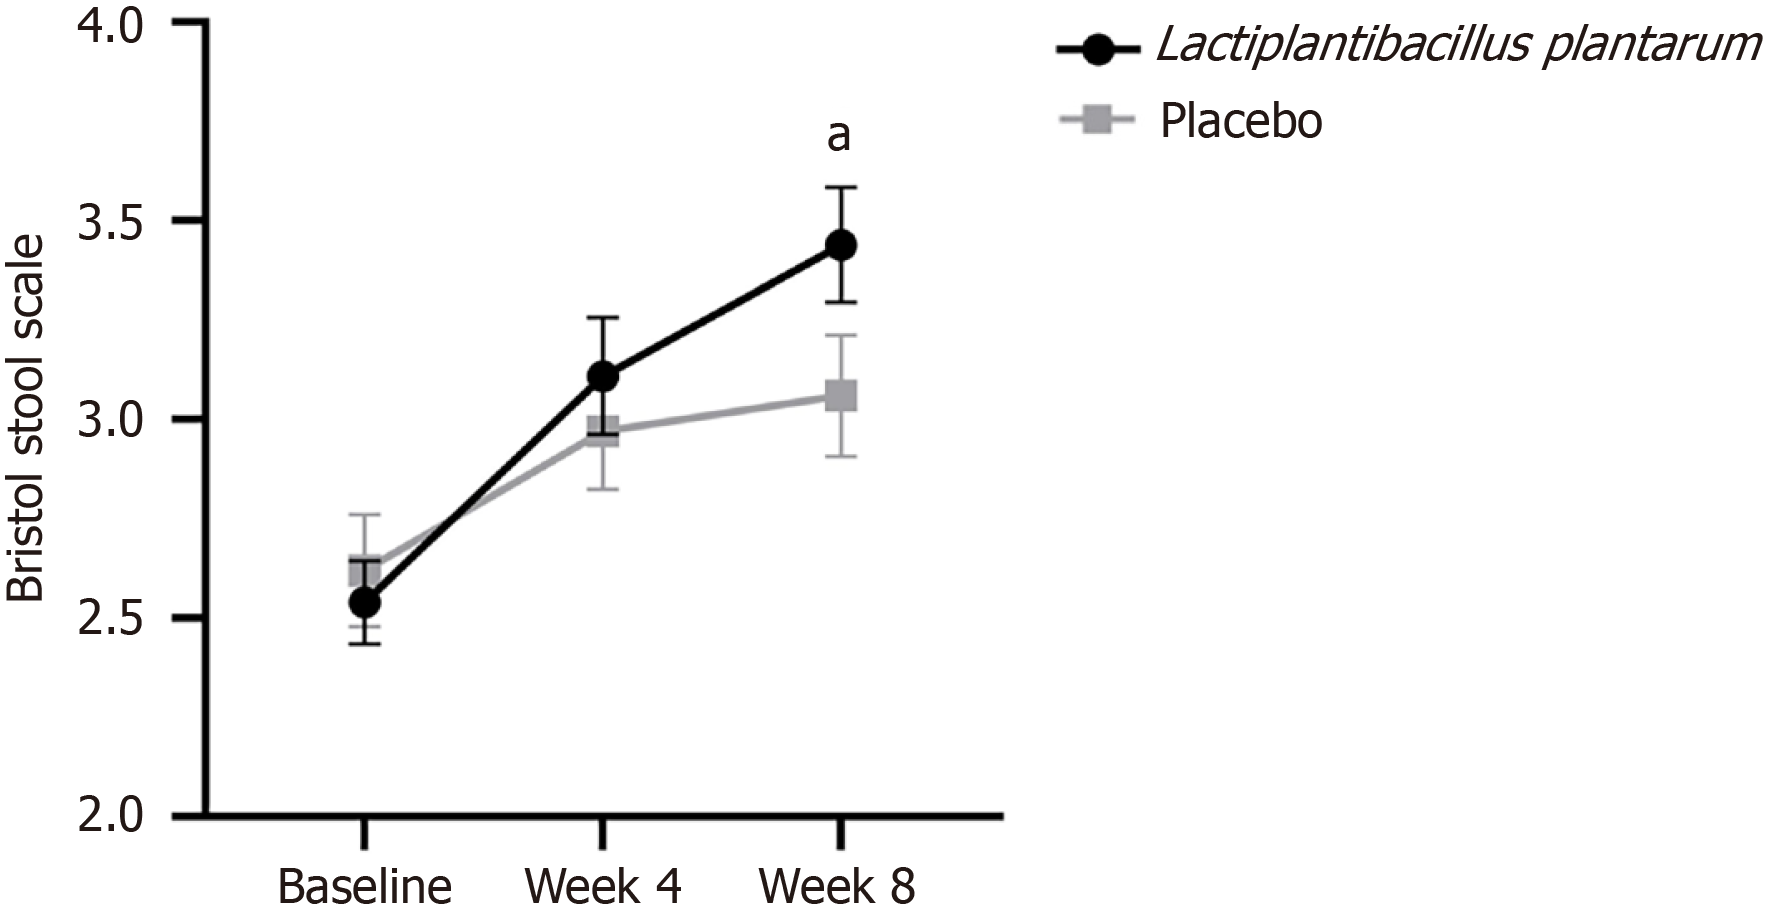
Figure 2 Stool consistency (Bristol Stool Scale) at baseline, week 4 and week 8 in the Lactiplantibacillus plantarum (n = 49) and placebo group (n = 48; mean ± SE).
aP < 0.05 between-group difference in change from baseline (linear mixed model analysis).
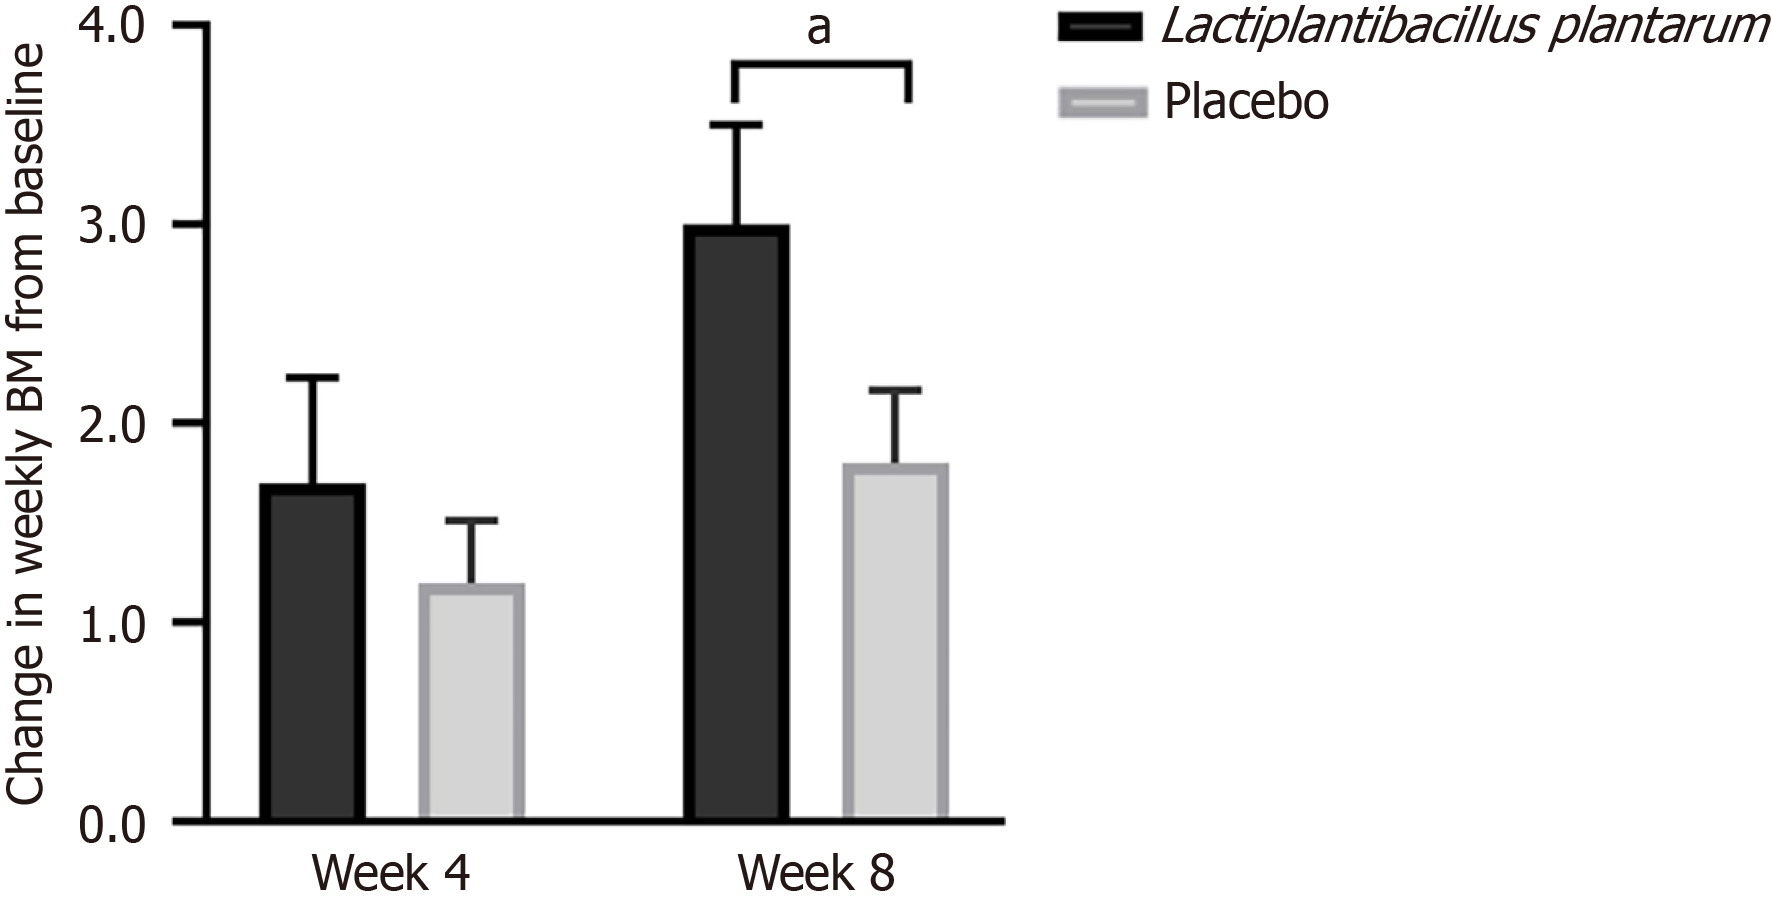
Figure 3 Change in weekly complete spontaneous bowel movements compared to baseline at week 4 and week 8 in the Lactiplan
- Citation: Önning G, Vegge CS, Montelius C, Lewis ED, Al-Wahsh H, Moulin M, Crowley DC, Guthrie N. Effects of Lactiplantibacillus plantarum 299v and Lactiplantibacillus plantarum GOS42 on gastrointestinal symptoms in healthy adults with occasional constipation. World J Gastroenterol 2026; 32(21): 117959
- URL: https://www.wjgnet.com/1007-9327/full/v32/i21/117959.htm
- DOI: https://dx.doi.org/10.3748/wjg.v32.i21.117959