
















Copyright: ©Author(s) 2026.
World J Gastroenterol. Jun 7, 2026; 32(21): 116581
Published online Jun 7, 2026. doi: 10.3748/wjg.v32.i21.116581
Published online Jun 7, 2026. doi: 10.3748/wjg.v32.i21.116581
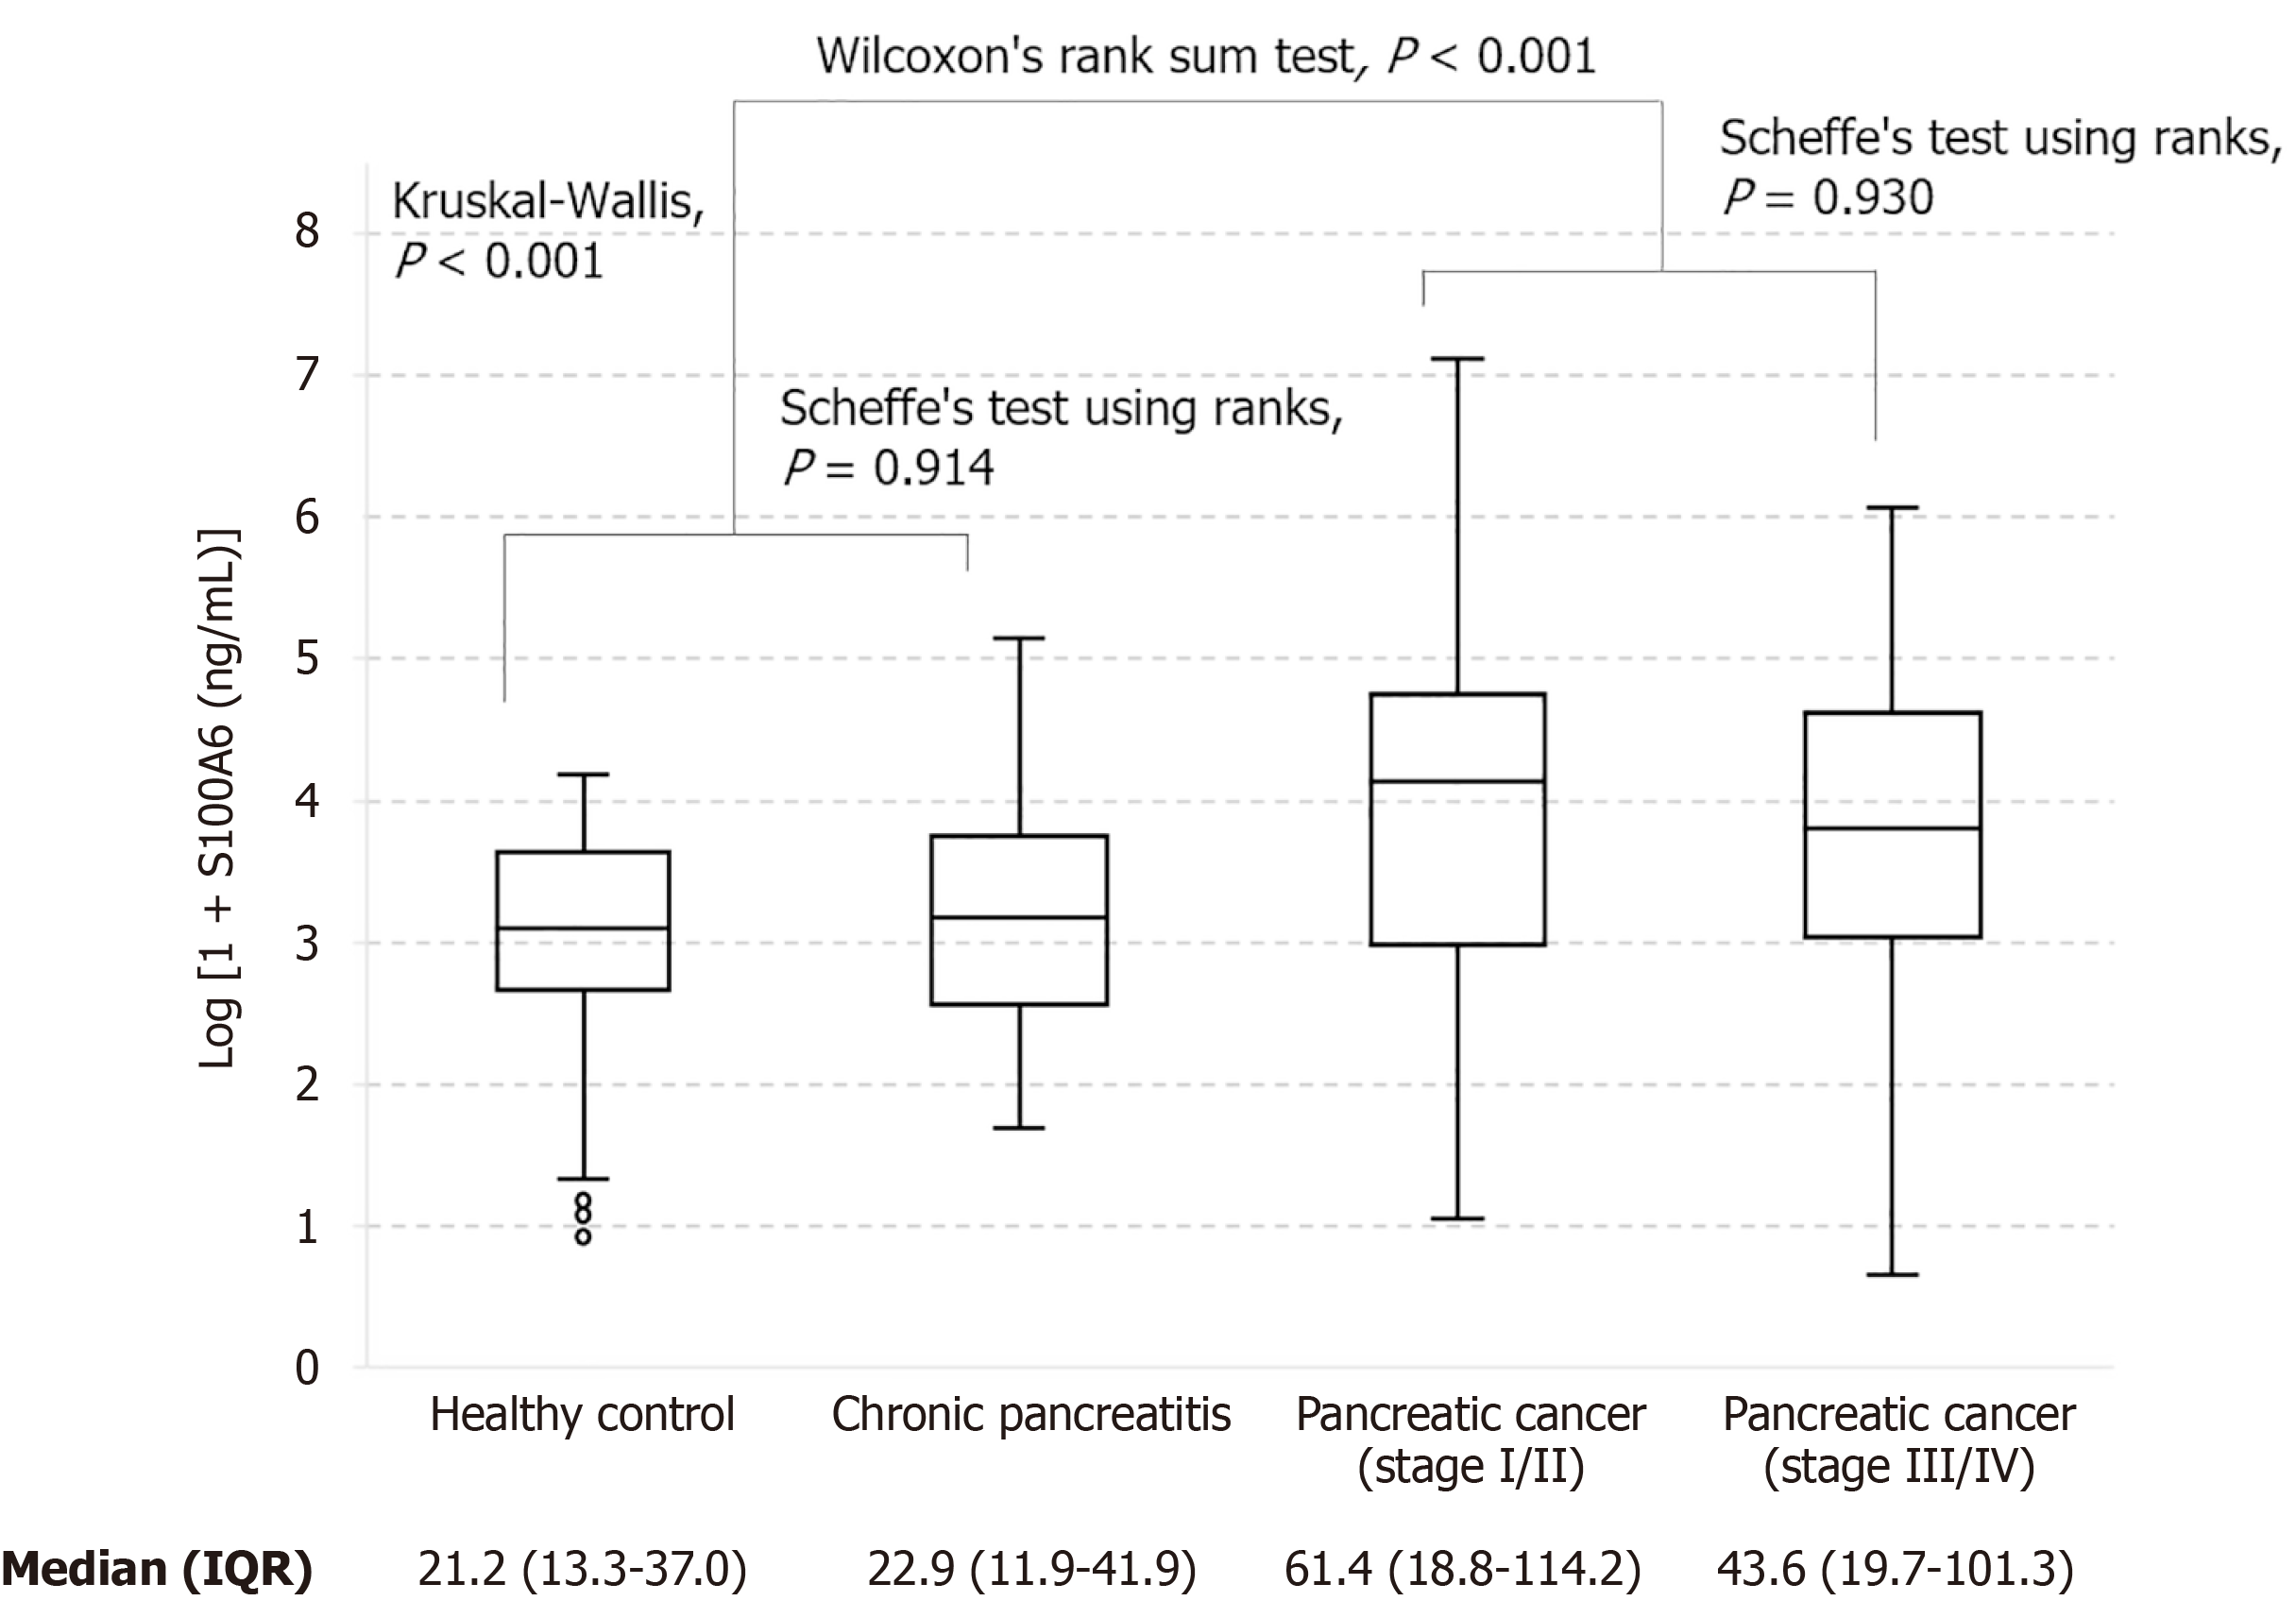
Figure 1 Serum S100A6 levels were compared among healthy controls, patients with chronic pancreatitis, and patients with pancreatic cancer stratified by stage (stage I/II and stage III/IV).
Data are presented as box plots showing the median and interquartile range, with whiskers indicating the range. Overall differences among the four groups were assessed using the Kruskal-Wallis test. When a significant overall difference was observed, post hoc pairwise comparisons were performed using Scheffé’s test based on ranks. For binary comparisons between pancreatic cancer and non-pancreatic cancer groups, Wilcoxon rank-sum tests were applied. Median values and interquartile ranges are shown below the plot. IQR: Interquartile range.
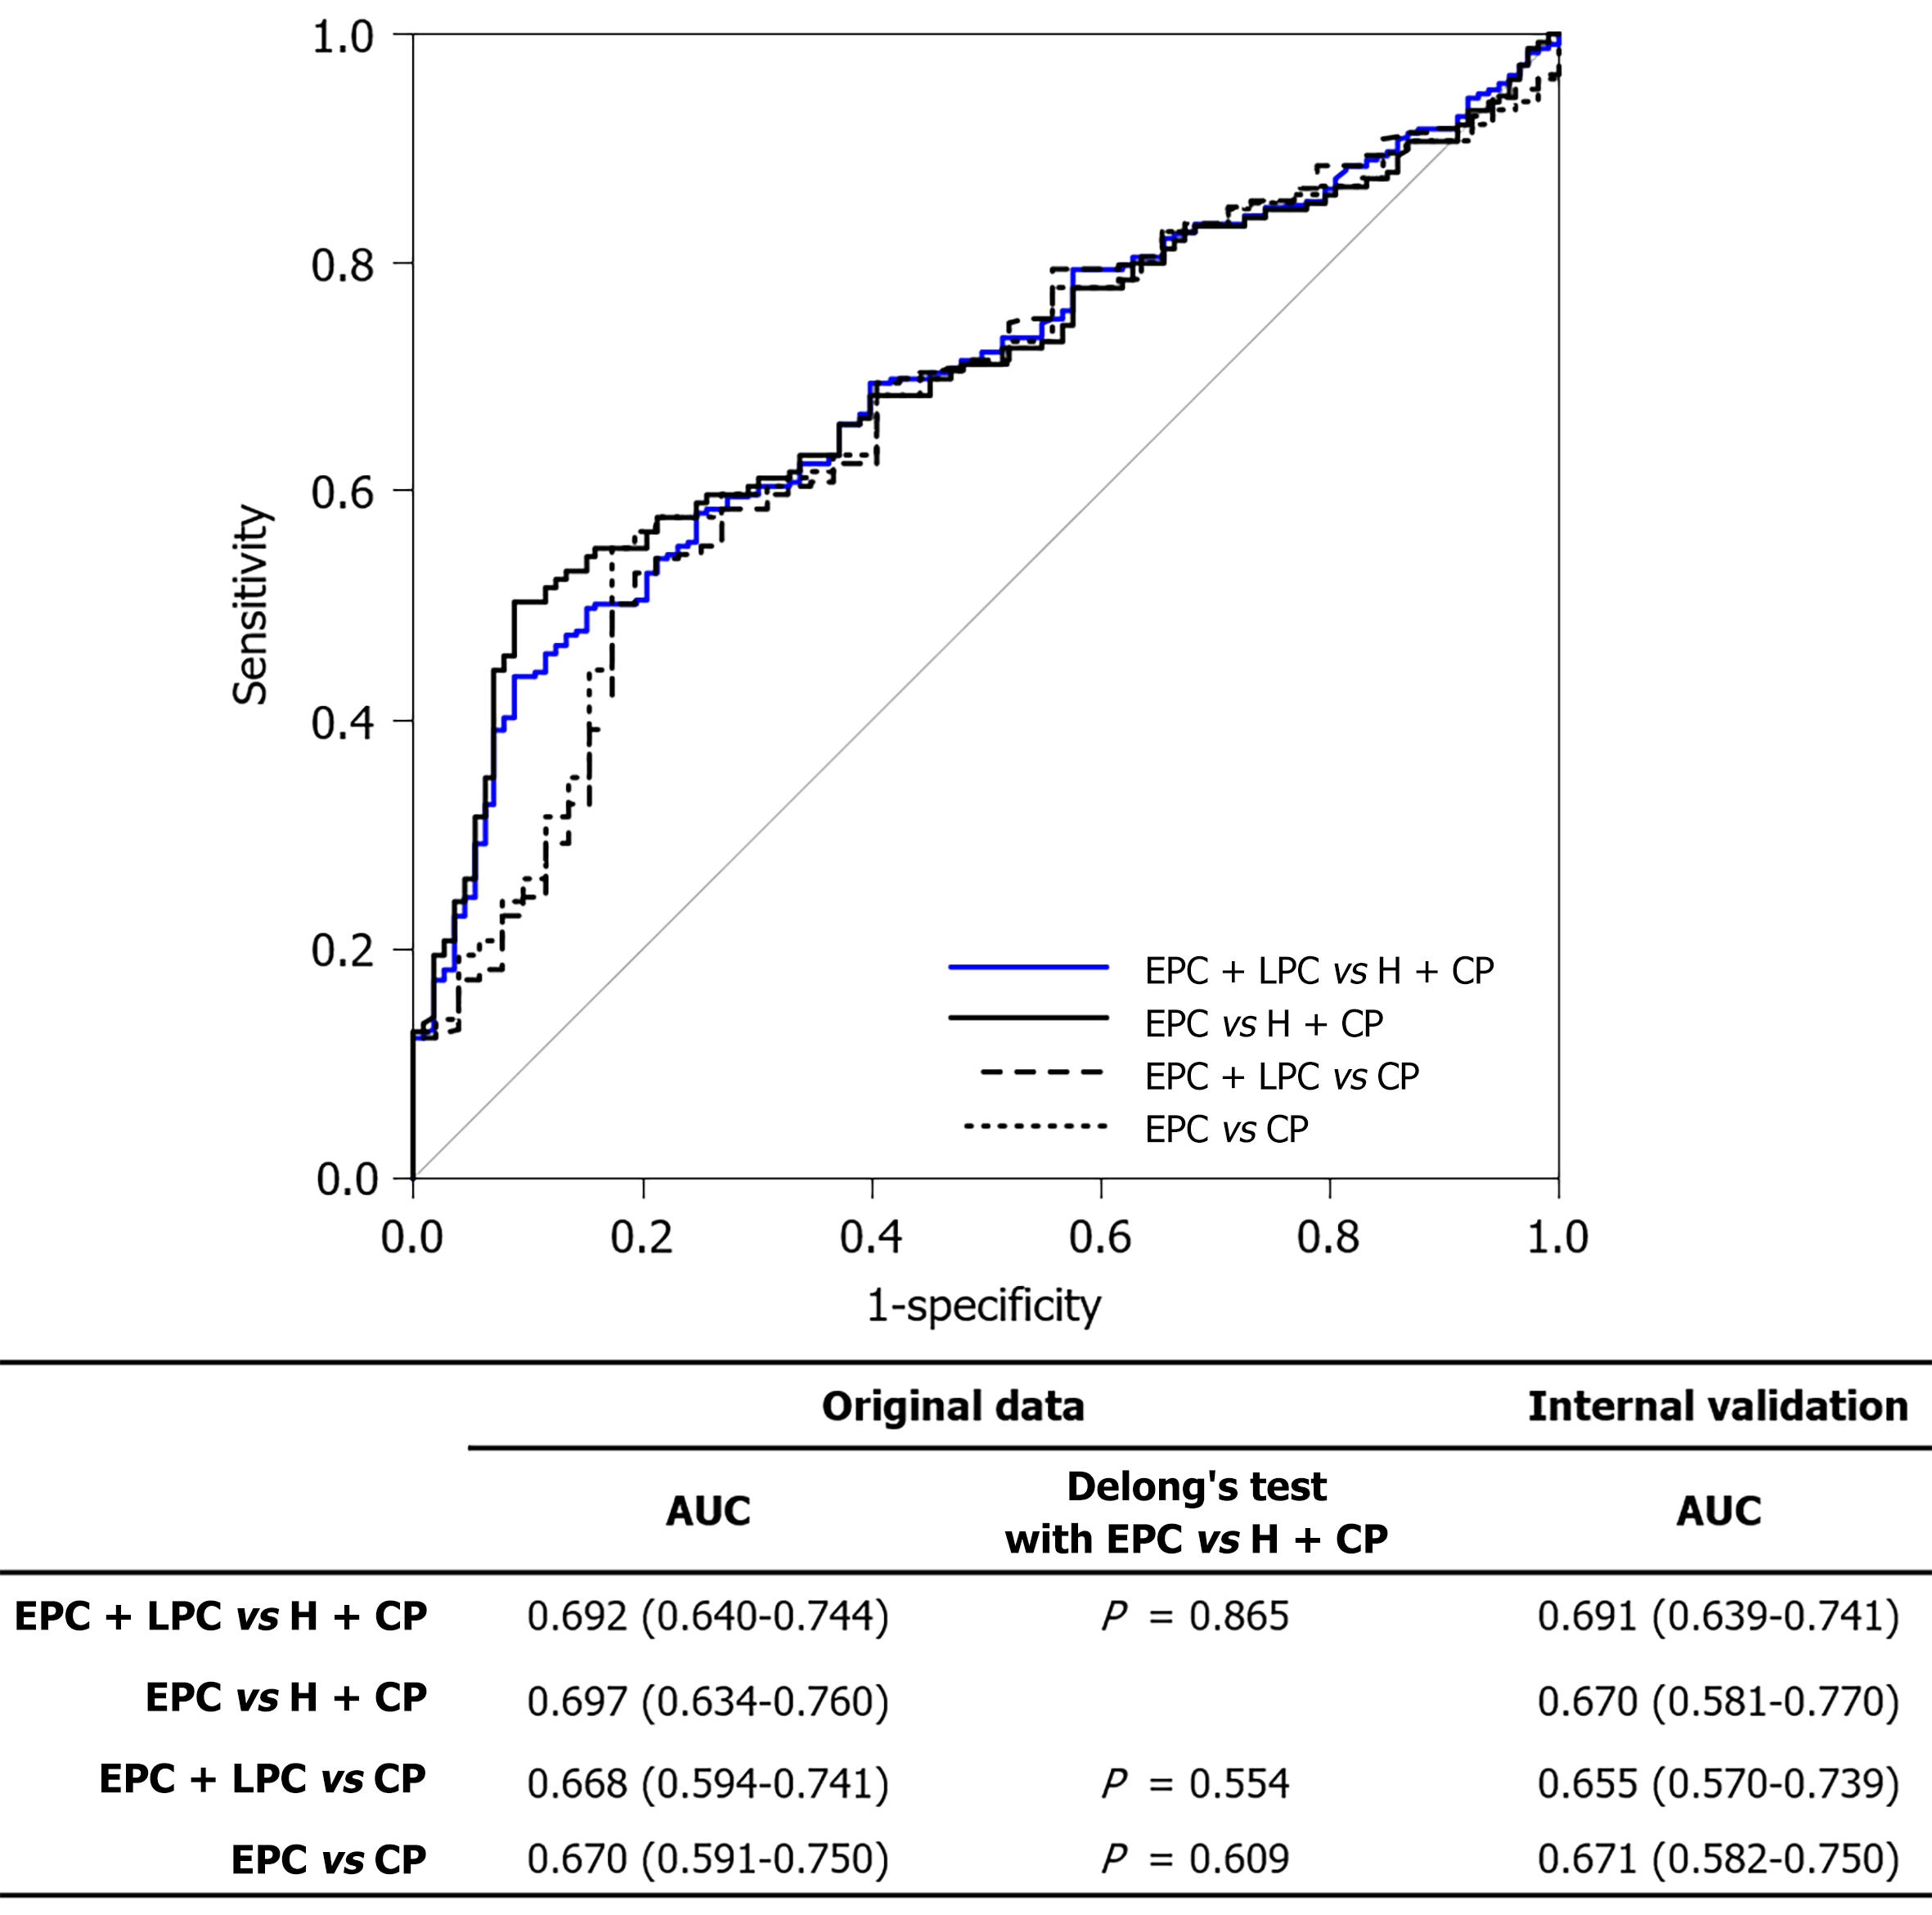
Figure 2 Receiver operating characteristic curves for distinguishing pancreatic cancer from control groups.
Areas under the curves with 95% confidence intervals are shown for the original dataset and internal validation, and areas under the curve comparisons were performed using DeLong’s test. EPC: Early pancreatic cancer; LPC: Late pancreatic cancer; H: Healthy control; CP: Chronic pancreatitis.
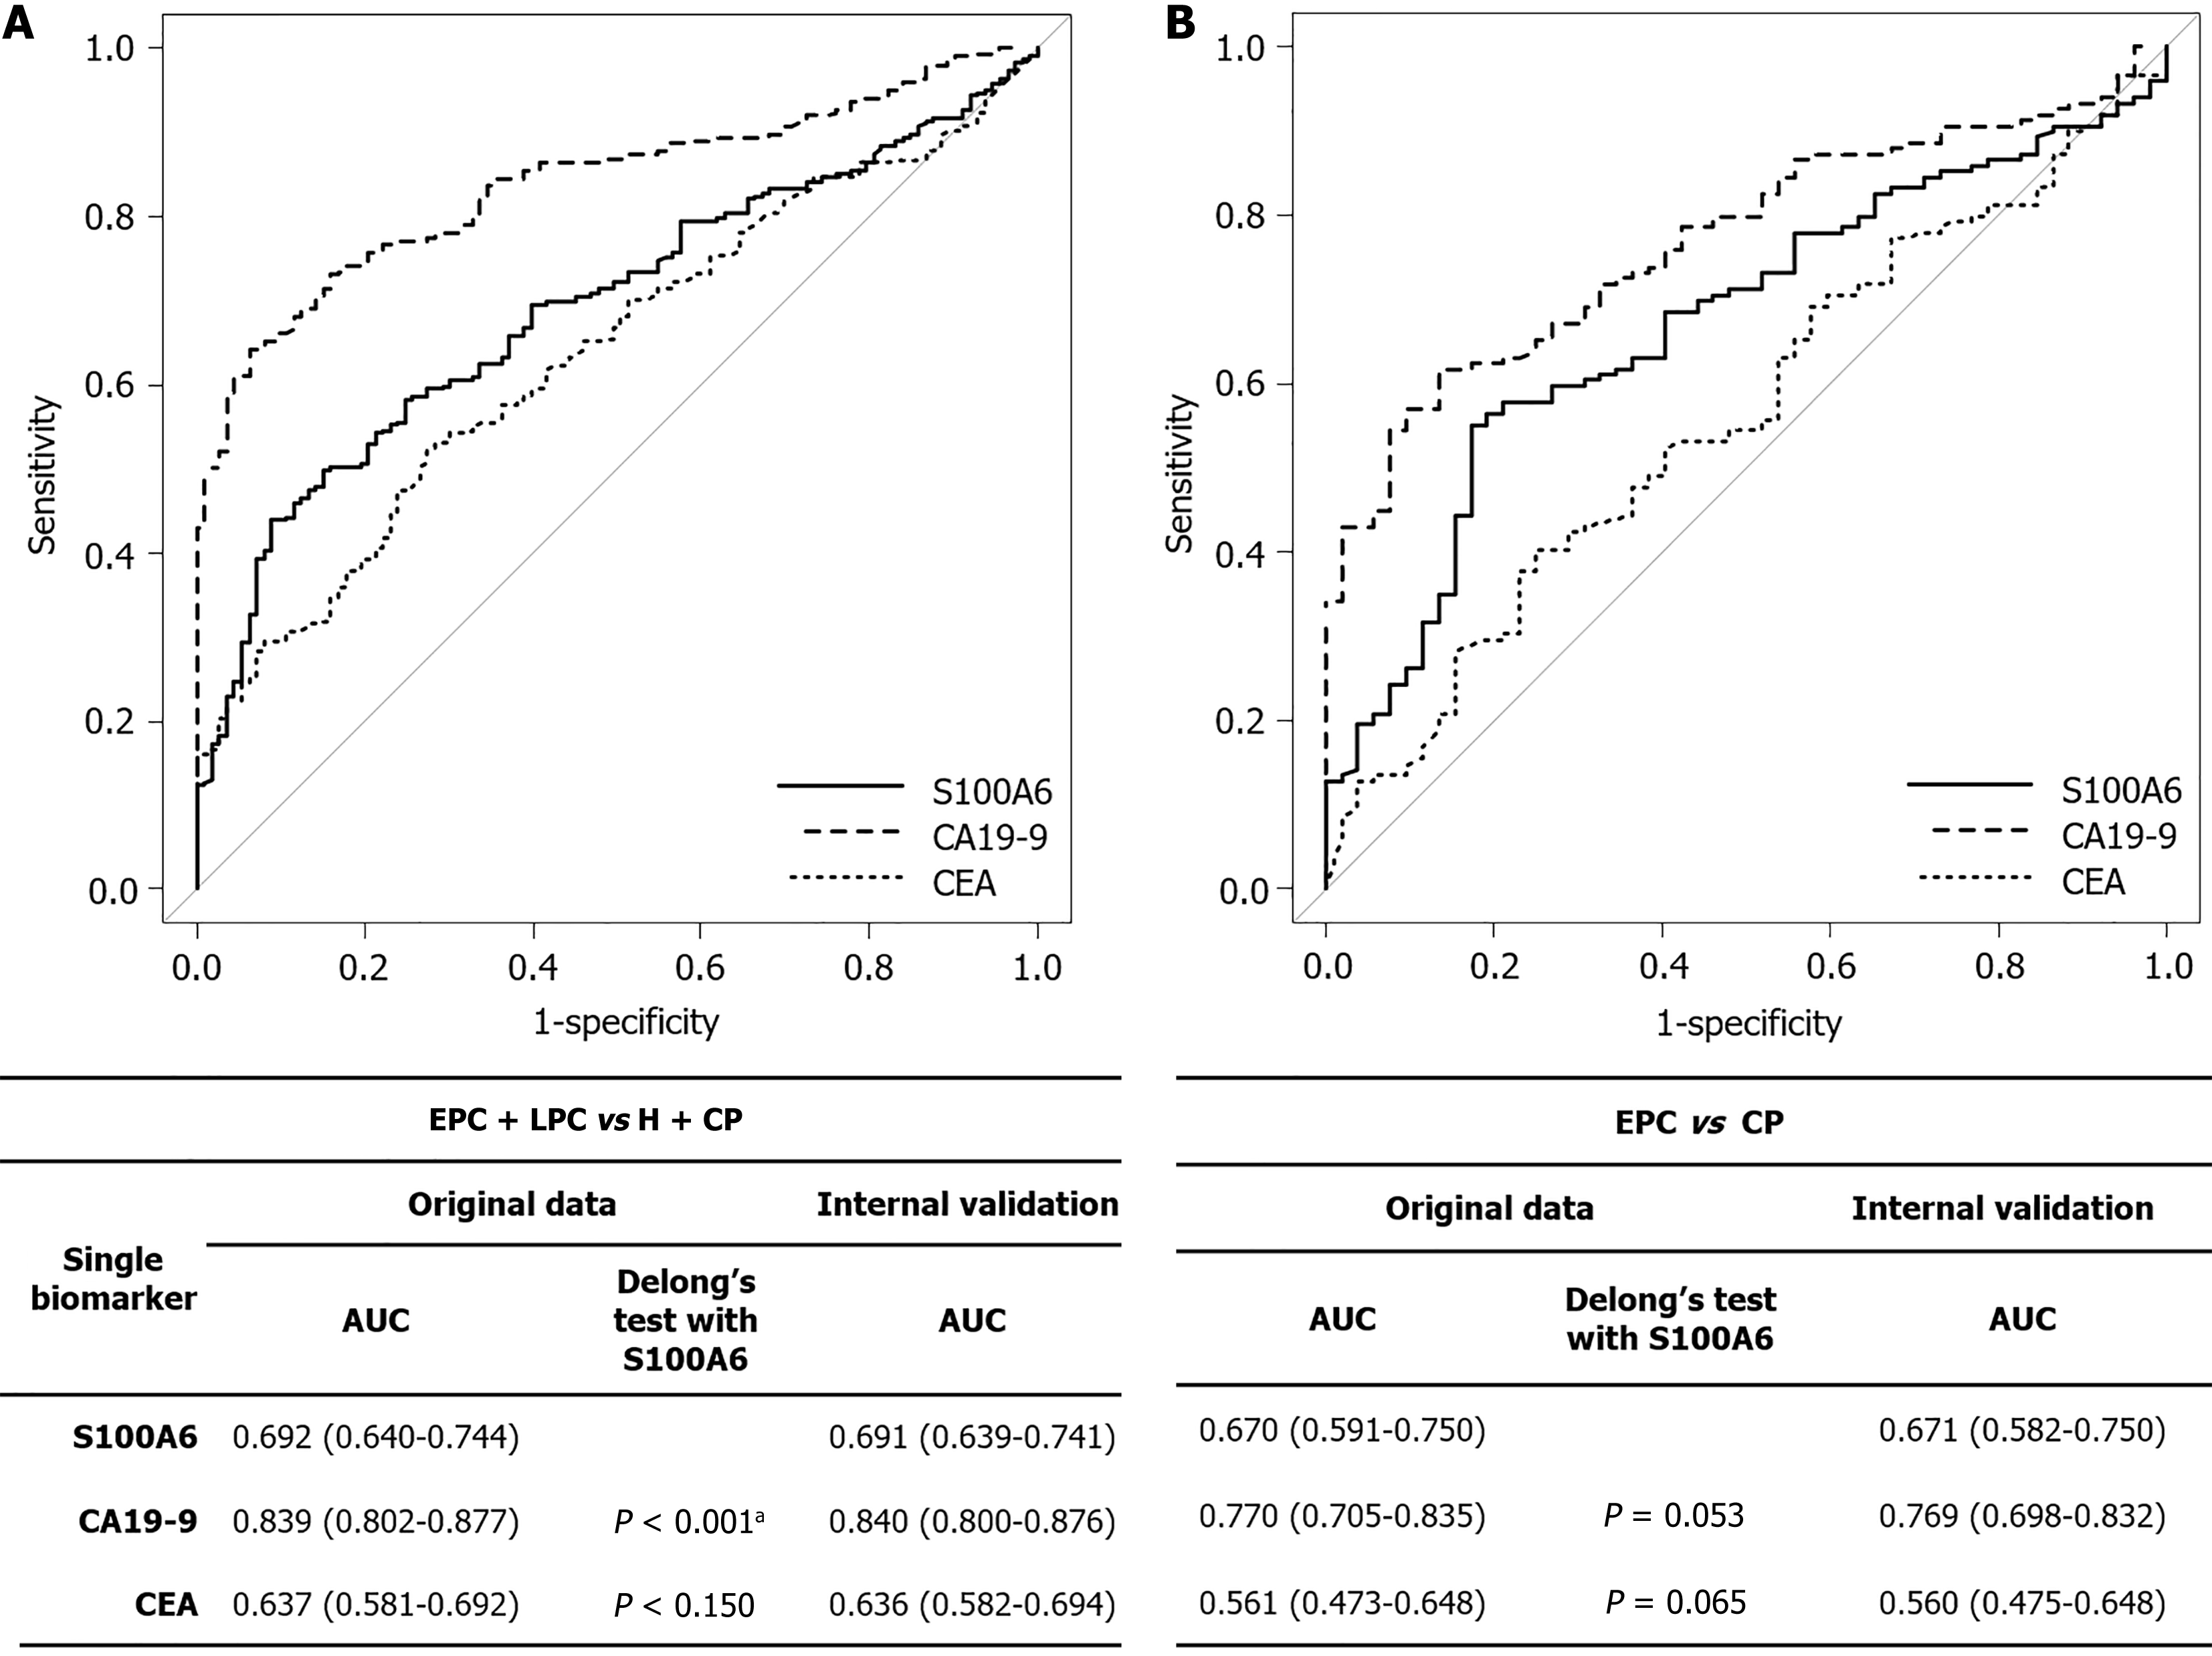
Figure 3 Receiver operating characteristic curves for single biomarkers (S100A6, carbohydrate antigen 19-9, and carcinoembryonic antigen) in the diagnosis of pancreatic cancer.
A: Receiver operating characteristic curves comparing early and late pancreatic cancer (early pancreatic cancer + late pancreatic cancer) with all control subjects, including healthy controls and patients with chronic pancreatitis (healthy control + chronic pancreatitis); B: Receiver operating characteristic curves comparing early pancreatic cancer with chronic pancreatitis. Areas under the curve with 95% confidence intervals are shown for both the original dataset and internal validation. Comparisons of areas under the curves between S100A6 and the other biomarkers were performed using DeLong’s test. aP < 0.05. CA19-9: Carbohydrate antigen 19-9; CEA: Carcinoembryonic antigen; EPC: Early pancreatic cancer; LPC: Late pancreatic cancer; H: Healthy control; CP: Chronic pancreatitis; AUC: Areas under the curve.
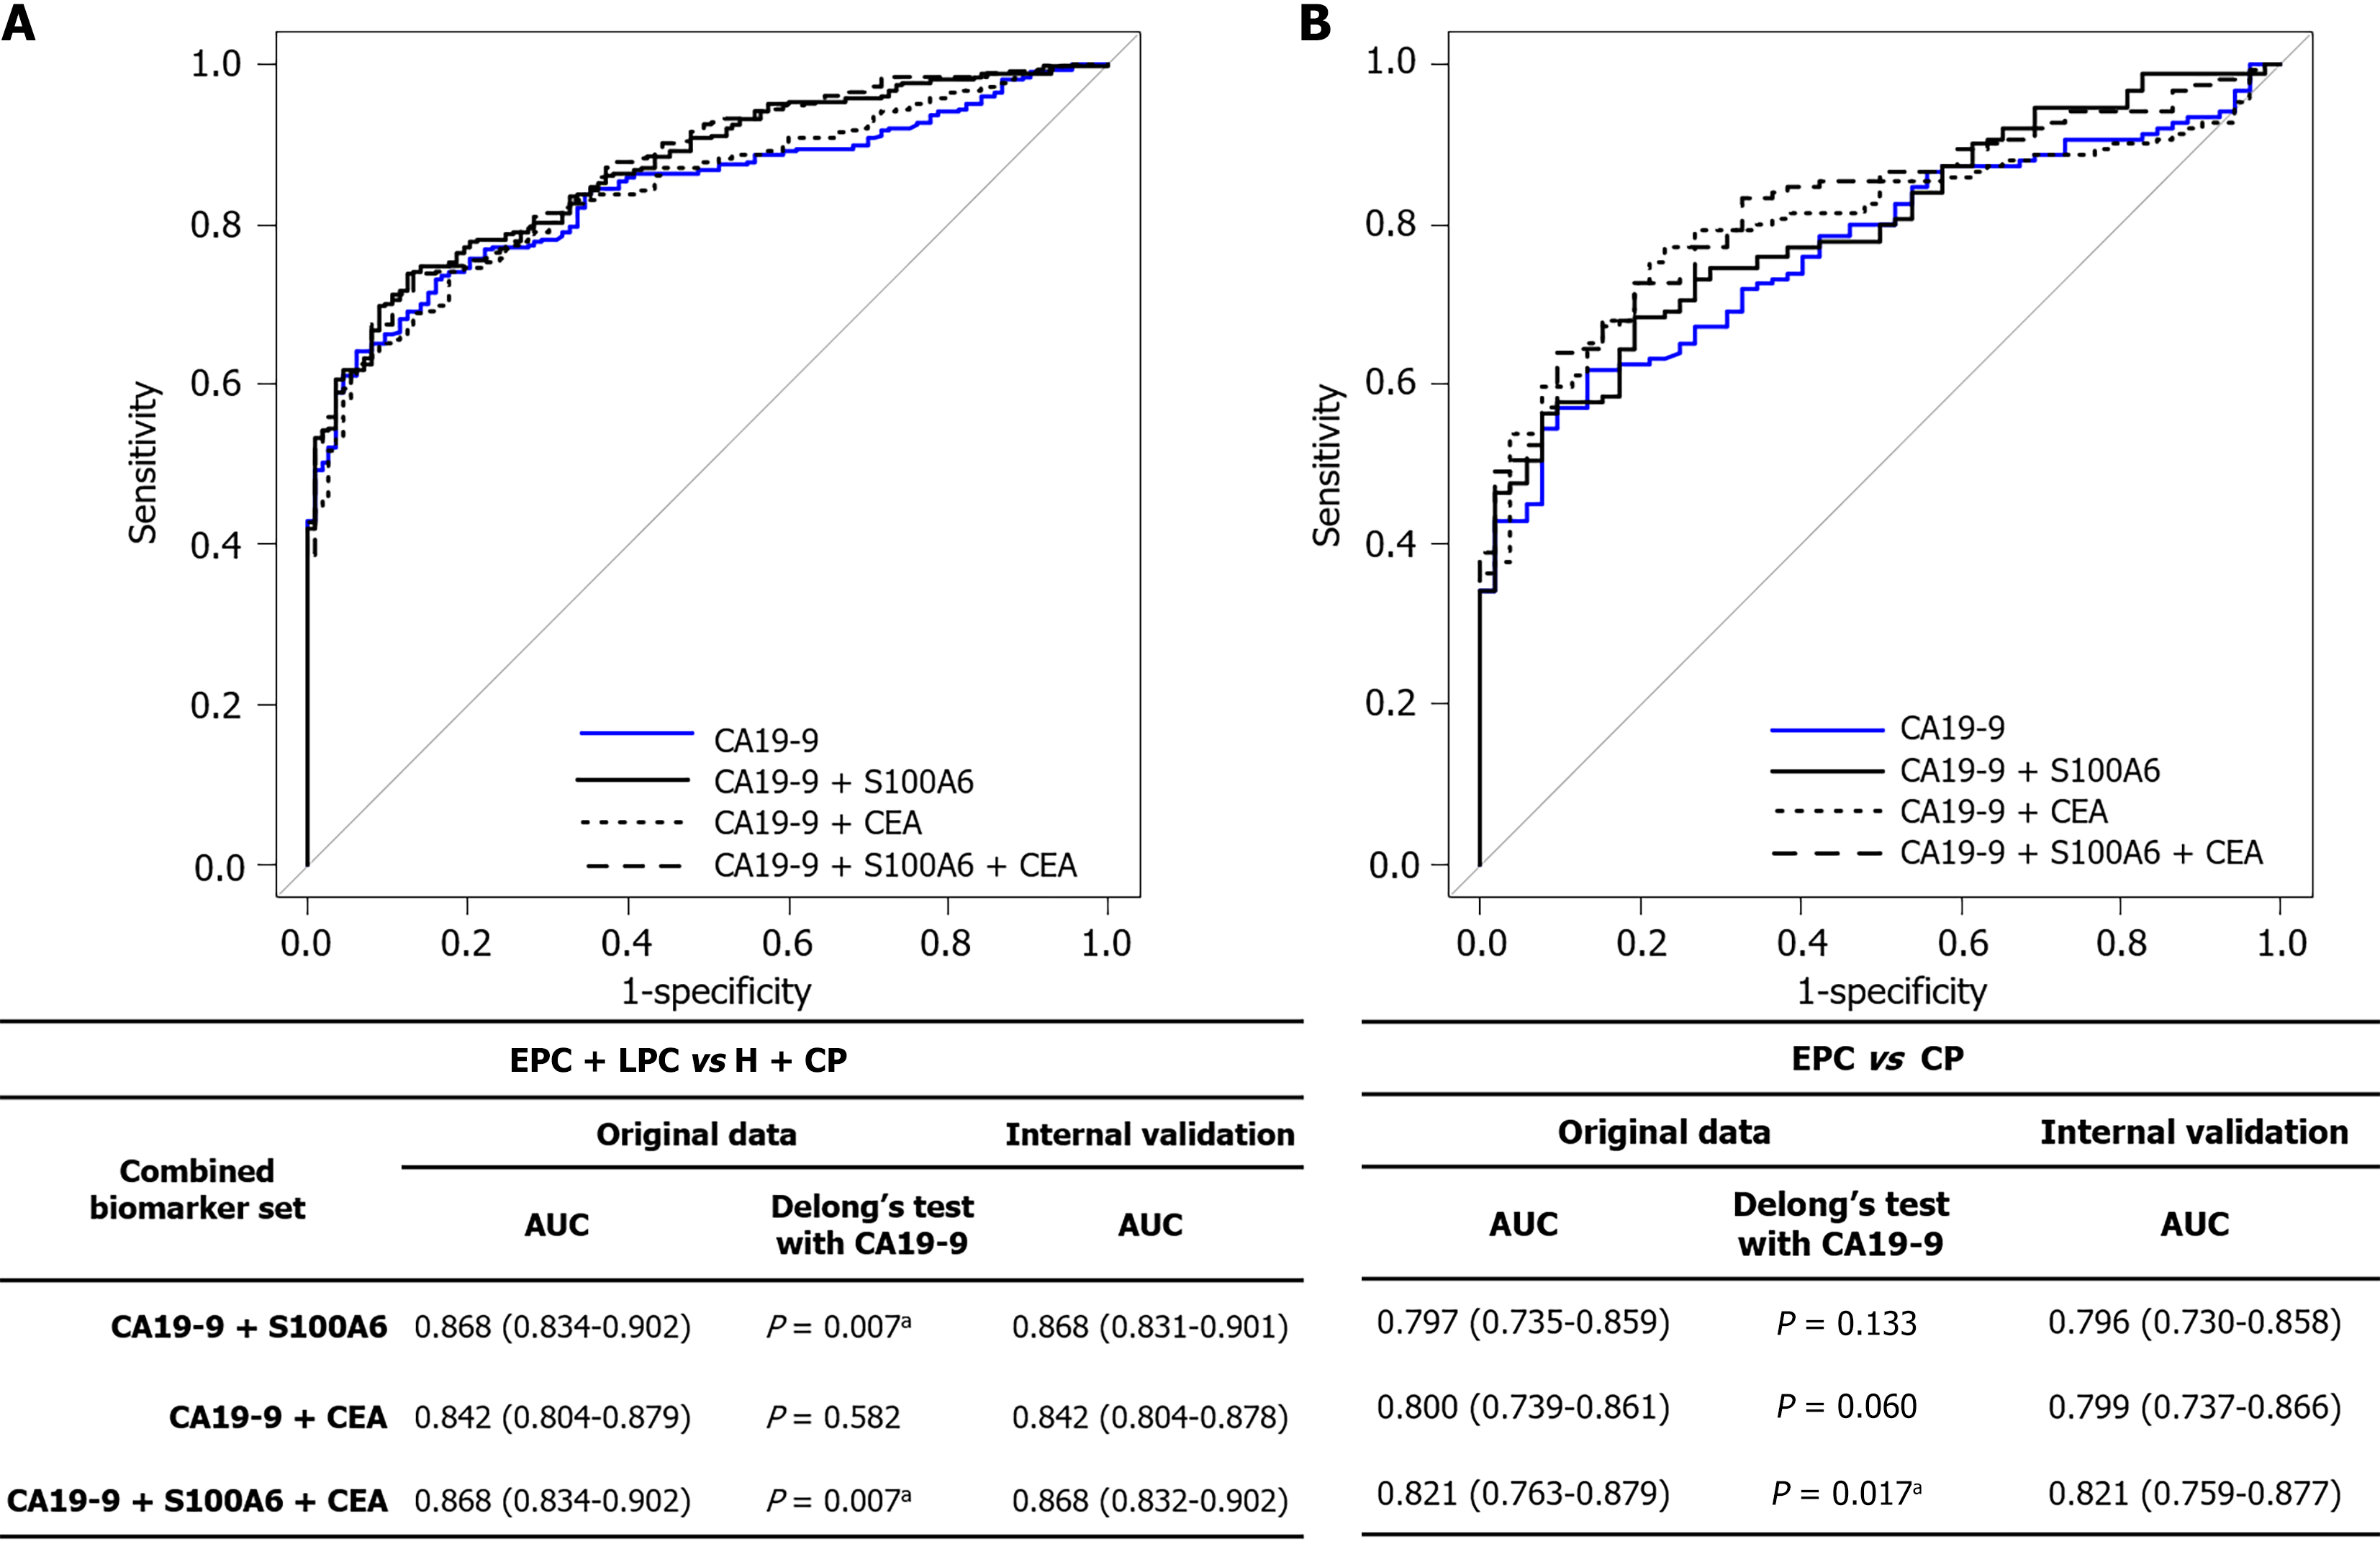
Figure 4 Receiver operating characteristic curves for combined biomarker sets in the diagnosis of pancreatic cancer.
A: Receiver operating characteristic curves comparing early and late pancreatic cancer (early pancreatic cancer + late pancreatic cancer) with all control subjects, including healthy controls and patients with chronic pancreatitis (healthy control + chronic pancreatitis); B: Receiver operating characteristic curves comparing early pancreatic cancer with chronic pancreatitis. Areas under the curve with 95% confidence intervals are shown for both the original dataset and internal validation. Comparisons of areas under the curves between single carbohydrate antigen 19-9 and the combined biomarker sets were performed using DeLong’s test. aP < 0.05. CA19-9: Carbohydrate antigen 19-9; CEA: Carcinoembryonic antigen; EPC: Early pancreatic cancer; LPC: Late pancreatic cancer; H: Healthy control; CP: Chronic pancreatitis; AUC: Areas under the curve.
- Citation: Bae GE, Kim SM, Lee JK, Lee SY. First large-scale prospective evaluation of serum S100A6 as a complementary biomarker for early pancreatic cancer detection. World J Gastroenterol 2026; 32(21): 116581
- URL: https://www.wjgnet.com/1007-9327/full/v32/i21/116581.htm
- DOI: https://dx.doi.org/10.3748/wjg.v32.i21.116581