©The Author(s) 2025.
World J Gastroenterol. Feb 28, 2025; 31(8): 100227
Published online Feb 28, 2025. doi: 10.3748/wjg.v31.i8.100227
Published online Feb 28, 2025. doi: 10.3748/wjg.v31.i8.100227
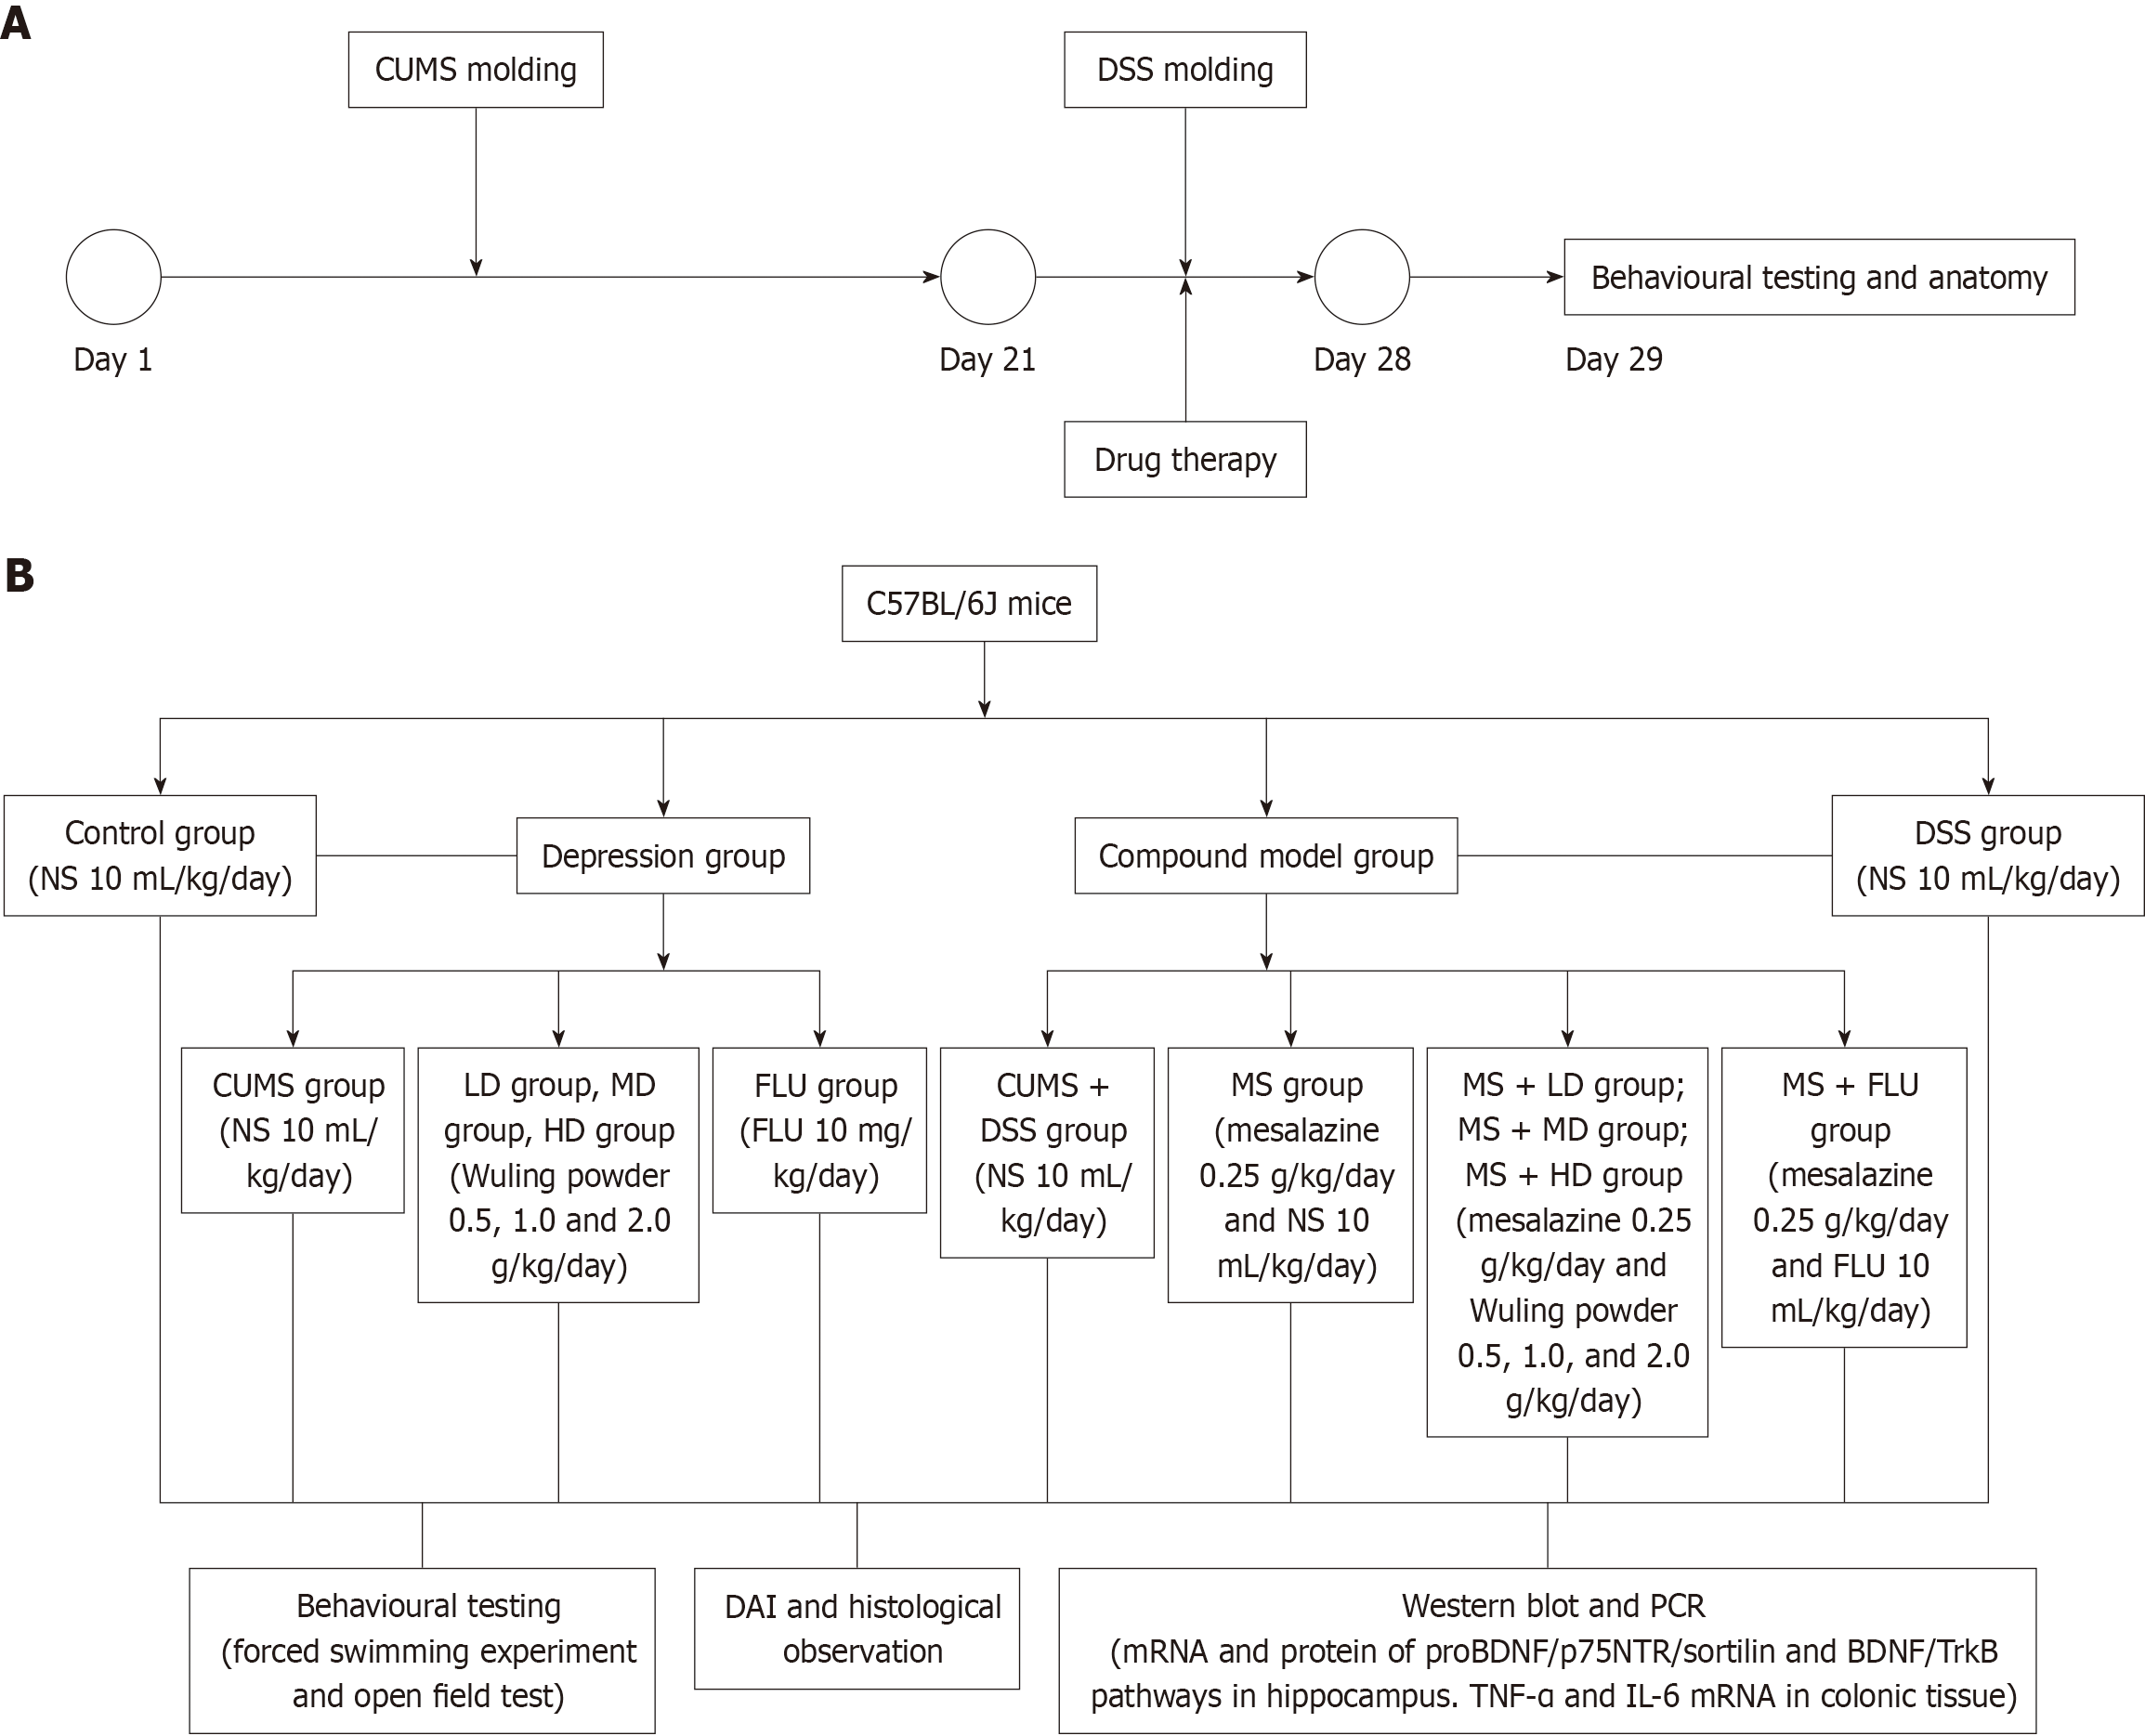
Figure 1 Flowchart of intervention and outcome evaluation.
A: Molding flow chart; B: Group administration and index detection. CUMS: Chronic restraint stress; DSS: Dextran sodium sulfate; NS: Normal saline; LD: Low-dose Wuling powder; MD: Medium-dose Wuling powder; HD: High-dose Wuling powder; FLU: Fluoxetine; MS: Mesalazine; PCR: Polymerase chain reaction; proBDNF: Brain-derived neurotrophic factor precursor; p75NTR: P75 neurotrophin receptor; TrkB: Tropomyosin receptor kinase B; TNF: Tumor necrosis factor; IL: Interleukin.
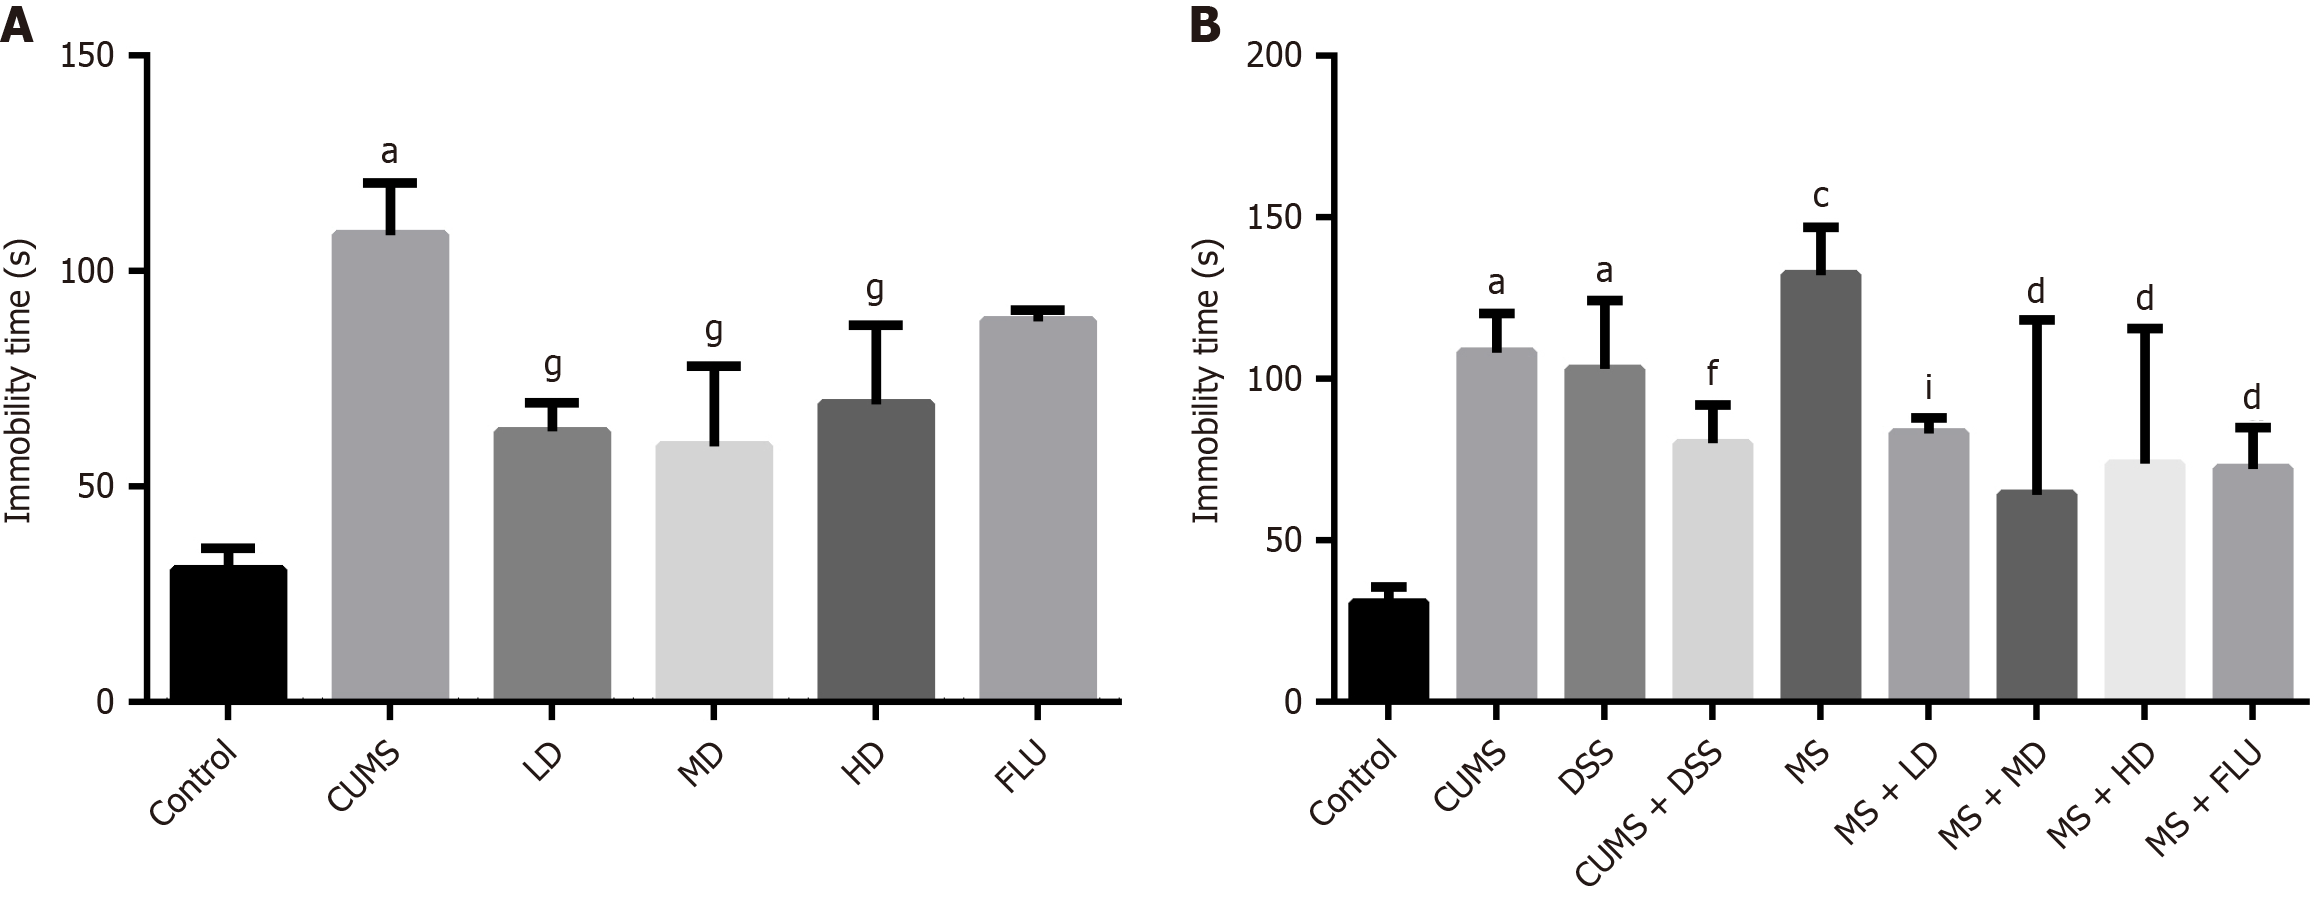
Figure 2 Immobility time in the forced swimming experiment after treatment.
A: Immobility time in depression groups; B: Immobility time in chronic restraint stress, dextran sodium sulfate and compound model groups. aP < 0.01 vs control group; cP < 0.01 vs chronic restraint stress + dextran sodium sulfate group; dP < 0.01 vs mesalazine group; fP < 0.05 vs control group; gP < 0.05 vs chronic restraint stress group; iP < 0.05 vs mesalazine group. CUMS: Chronic restraint stress; DSS: Dextran sodium sulfate; LD: Low-dose Wuling powder; MD: Medium-dose Wuling powder; HD: High-dose Wuling powder; FLU: Fluoxetine; MS: Mesalazine.
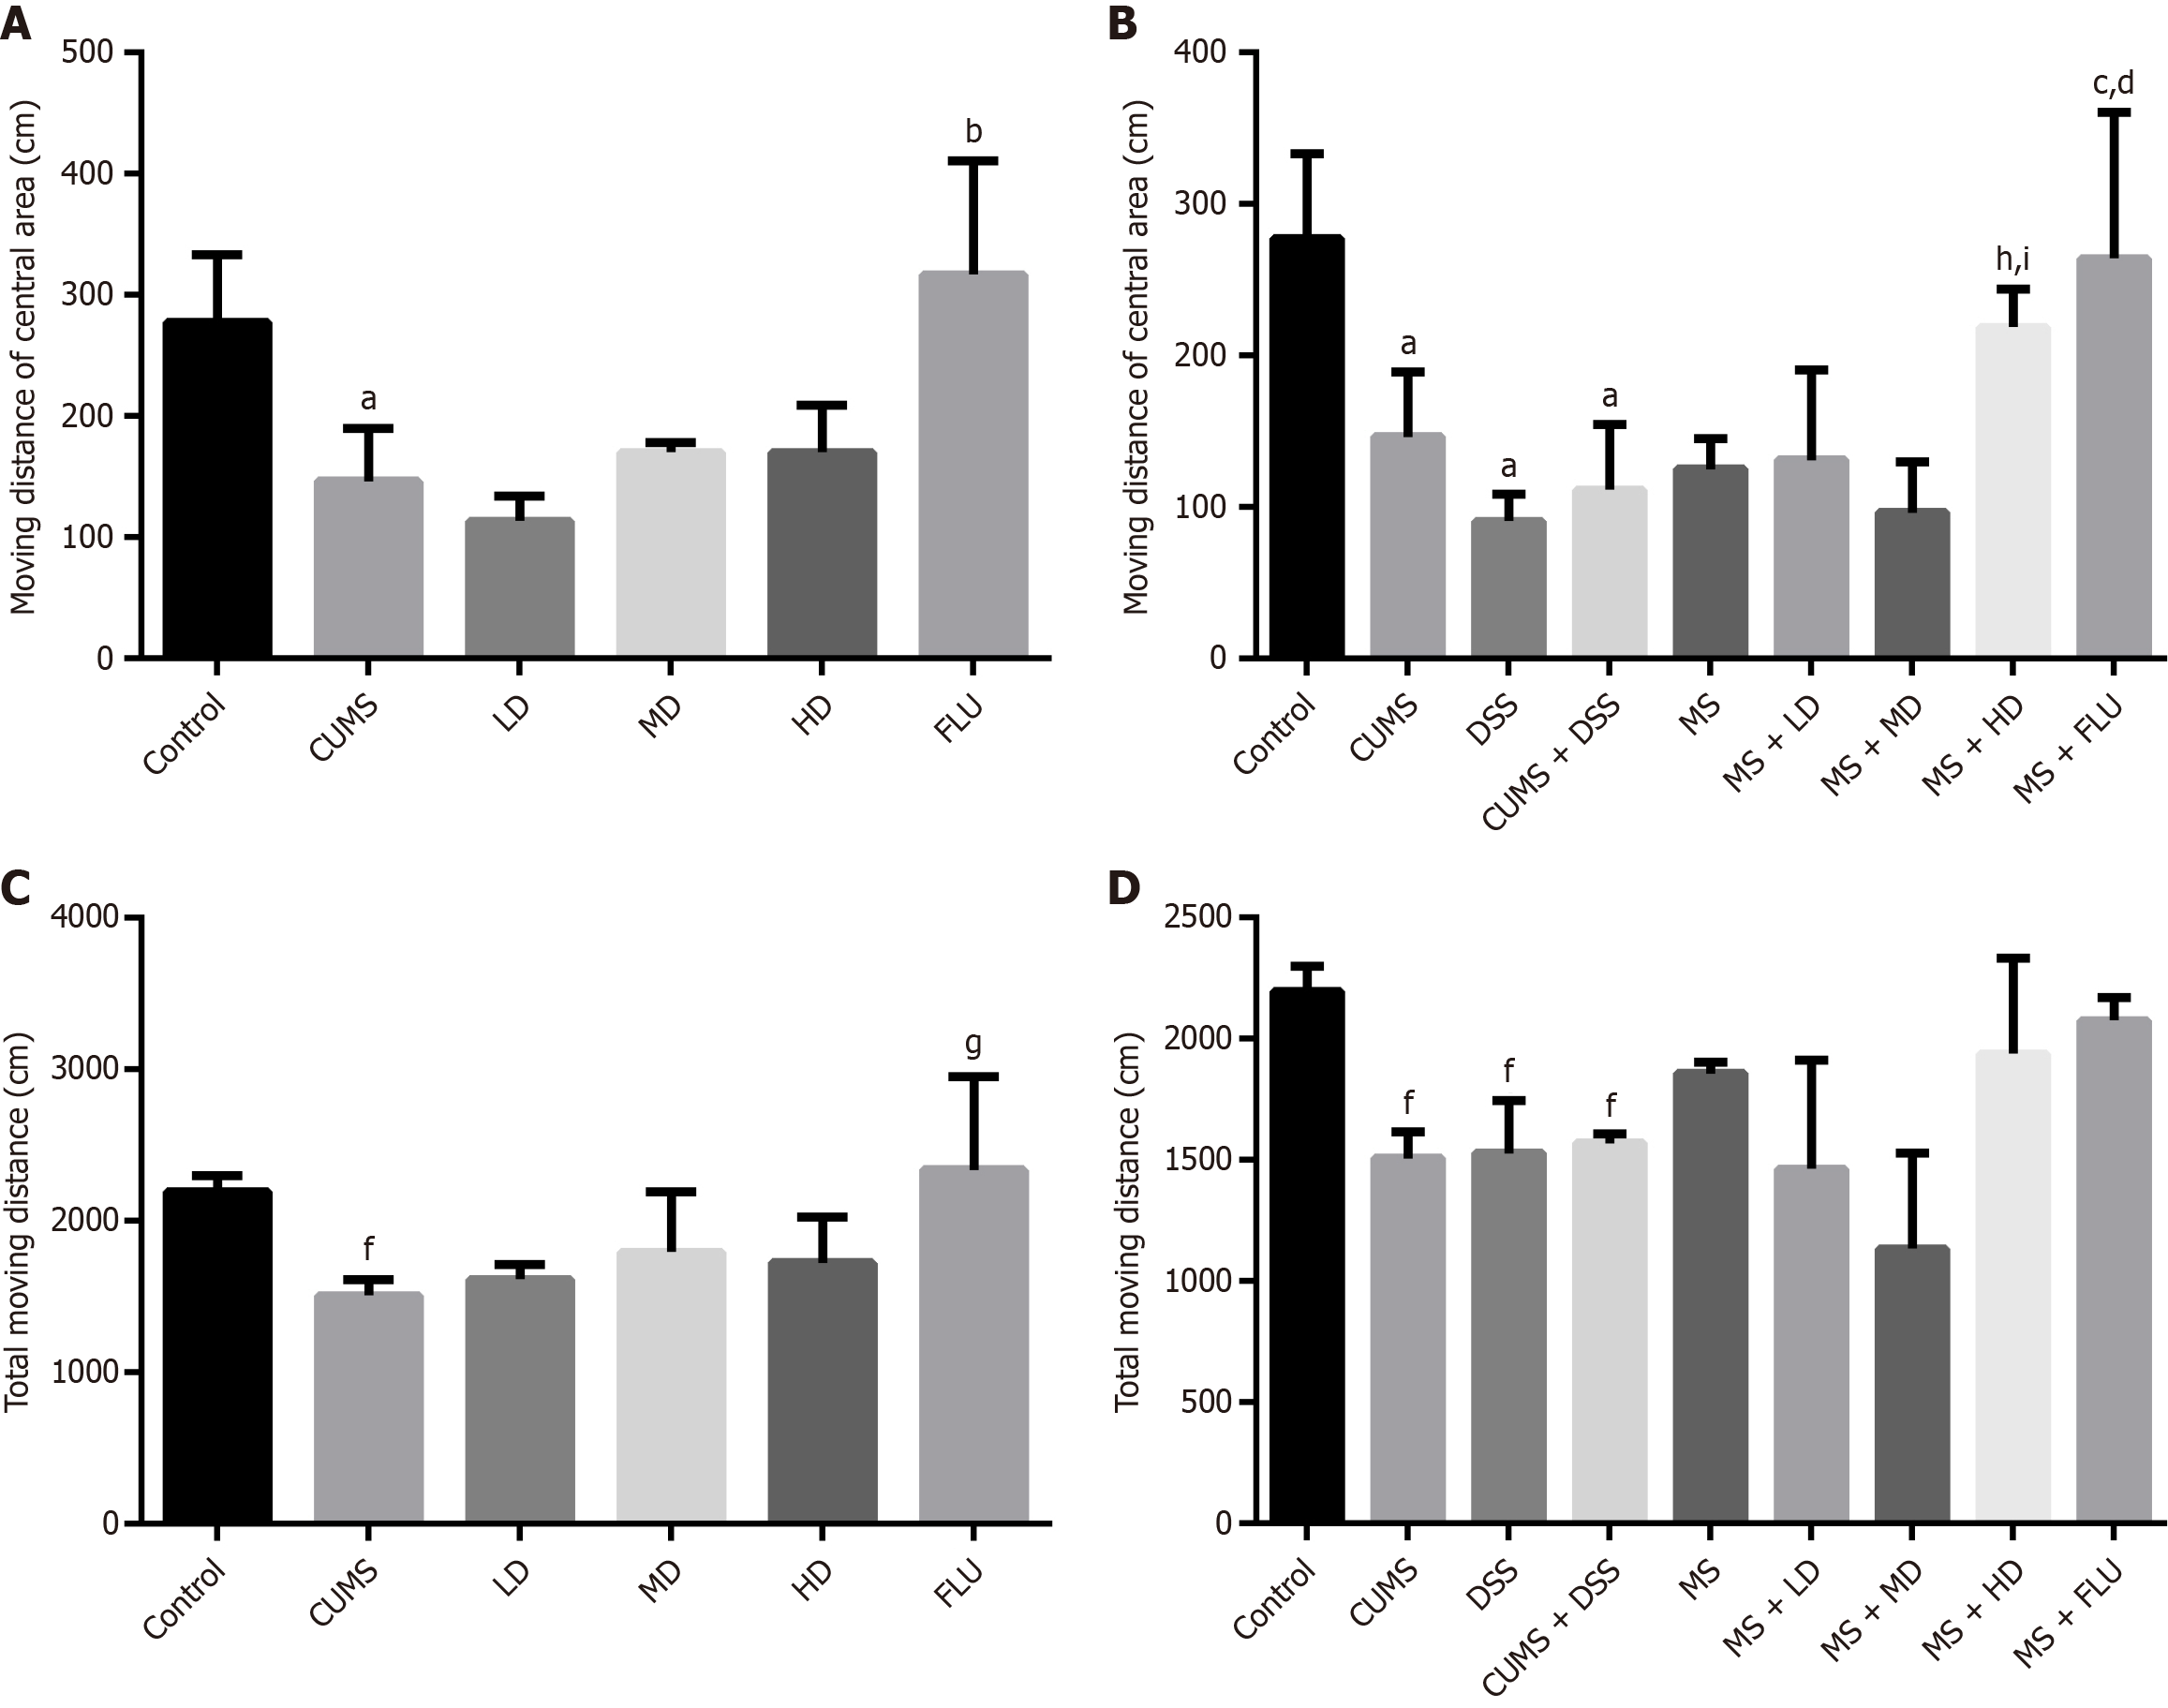
Figure 3 Central area movement distance and total movement distance of open-field test mice after treatment.
A: Moving distance of central area in depression groups; B: Moving distance of central area in chronic restraint stress, dextran sodium sulfate and compound model groups; C: Total moving distance in depression groups; D: Total moving distance in chronic restraint stress, dextran sodium sulfate and compound model groups. aP < 0.01 vs control group; bP < 0.01 vs chronic restraint stress group; cP < 0.01 vs chronic restraint stress + dextran sodium sulfate group; dP < 0.01 vs mesalazine group; fP < 0.05 vs control group; gP < 0.05 vs chronic restraint stress group; hP < 0.05 vs chronic restraint stress + dextran sodium sulfate group; iP < 0.05 vs mesalazine group. CUMS: Chronic restraint stress; DSS: Dextran sodium sulfate; LD: Low-dose Wuling powder; MD: Medium-dose Wuling powder; HD: High-dose Wuling powder; FLU: Fluoxetine; MS: Mesalazine.
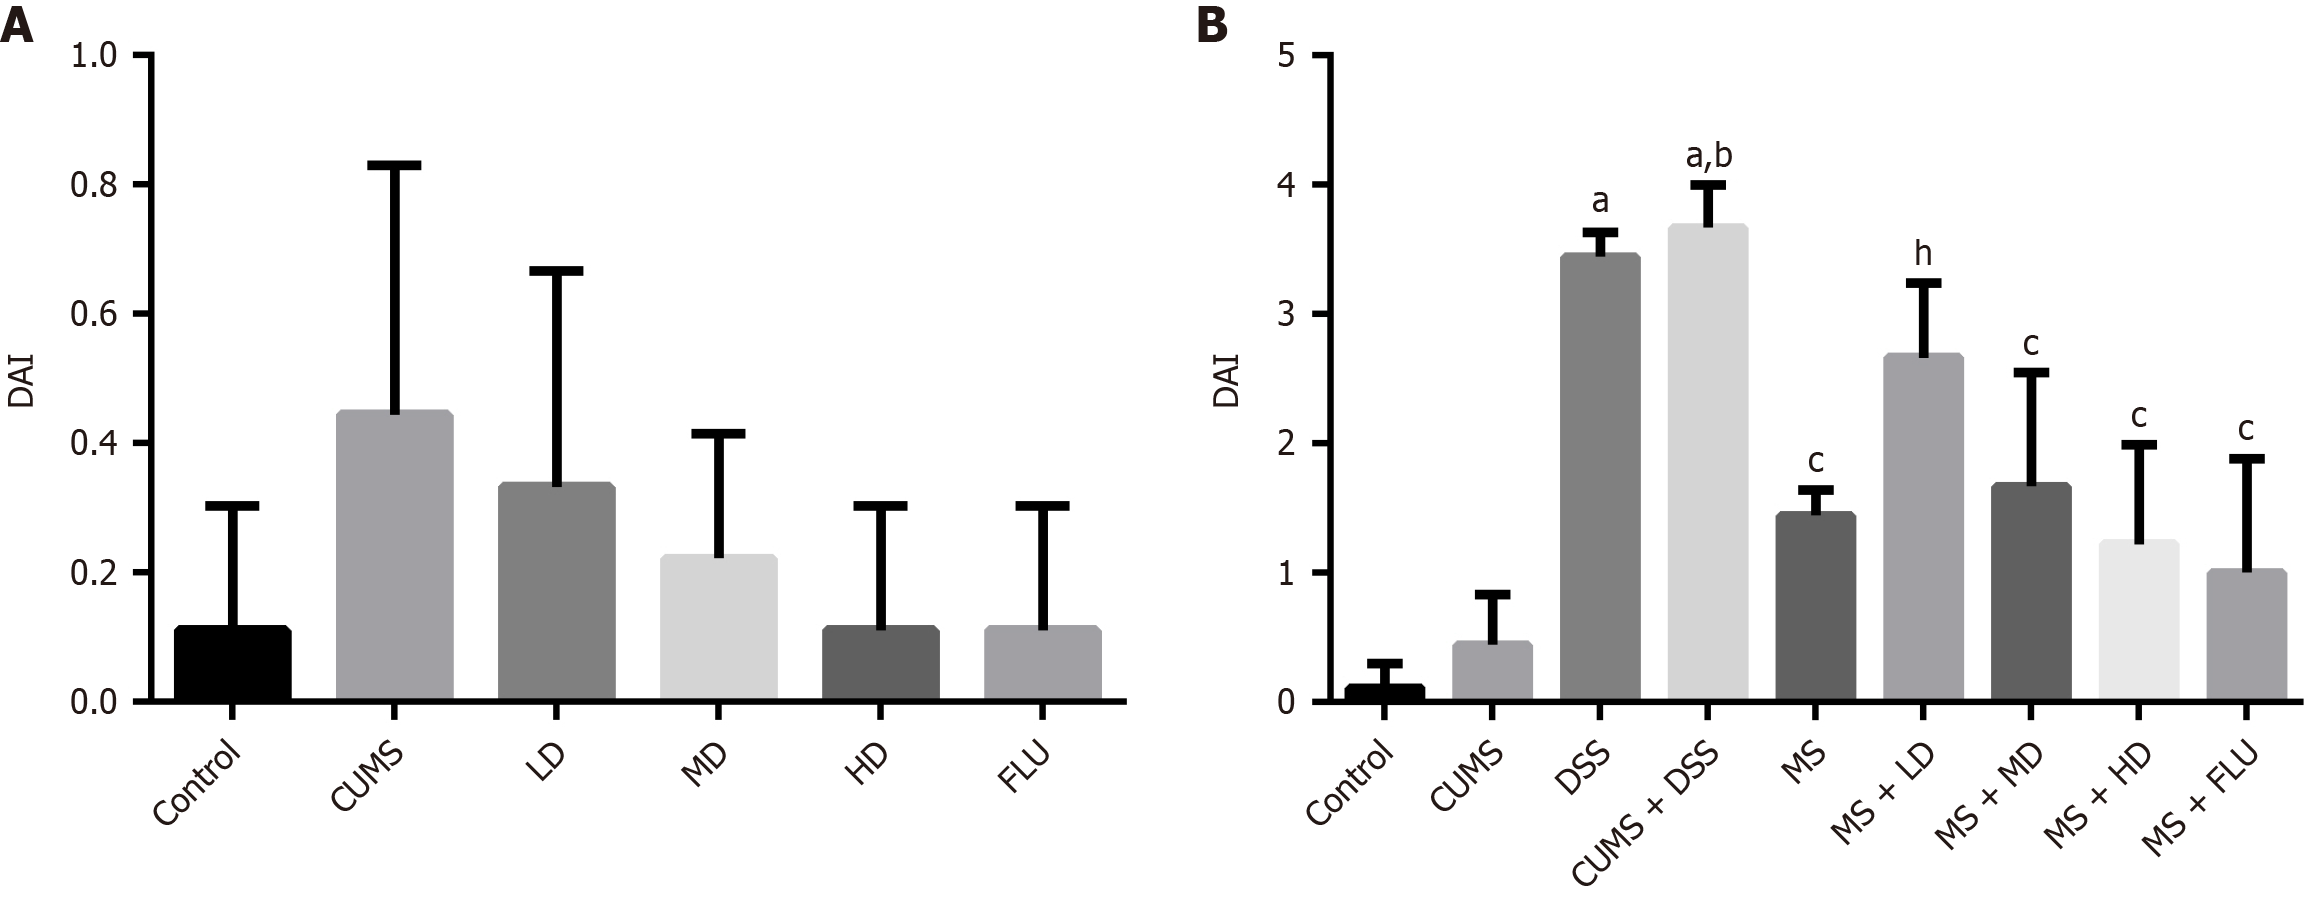
Figure 4 Disease activity index score after treatment.
A: Disease activity index score in depression groups; B: Disease activity index score in chronic restraint stress, dextran sodium sulfate and compound model groups. aP < 0.01 vs control group; bP < 0.01 vs chronic restraint stress group; cP < 0.01 vs chronic restraint stress + dextran sodium sulfate group; hP < 0.05 vs chronic restraint stress + dextran sodium sulfate group. DAI: Disease activity index; CUMS: Chronic restraint stress; DSS: Dextran sodium sulfate; LD: Low-dose Wuling powder; MD: Medium-dose Wuling powder; HD: High-dose Wuling powder; FLU: Fluoxetine; MS: Mesalazine.
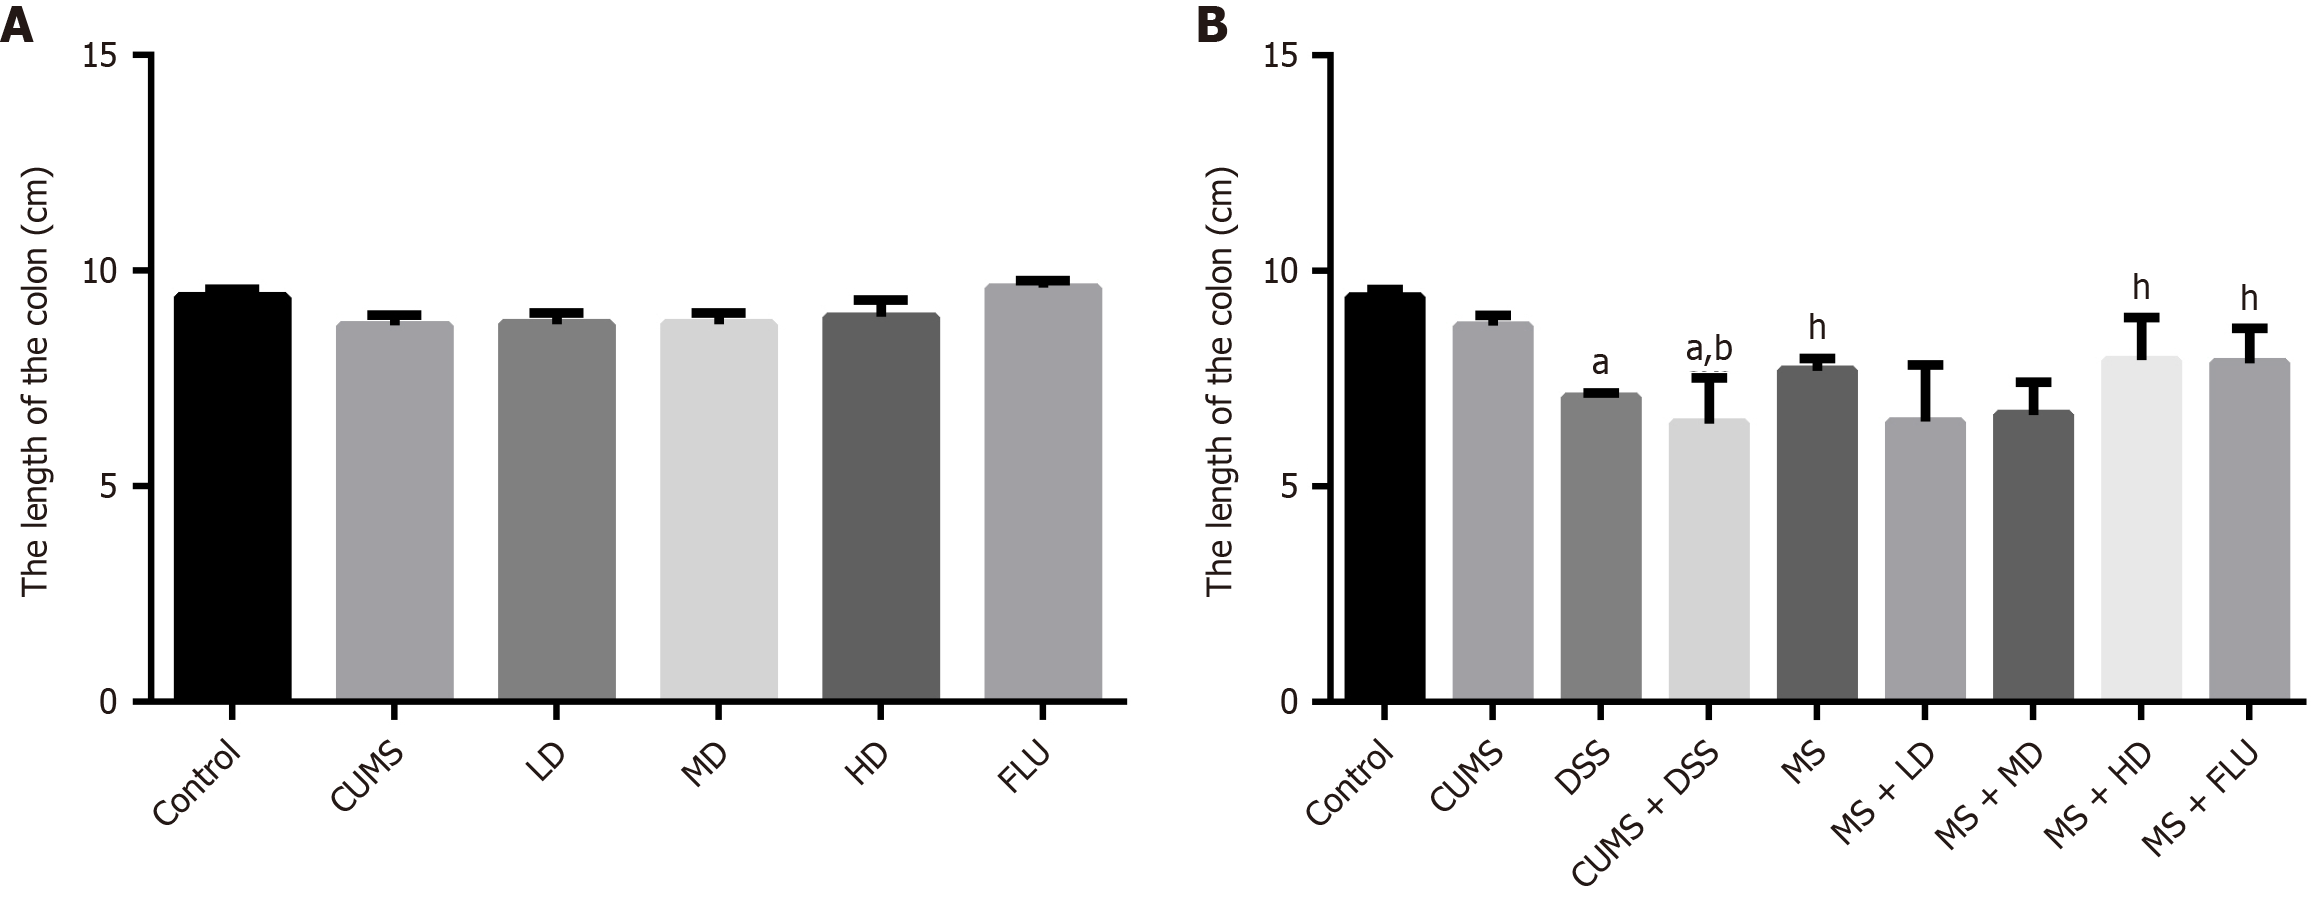
Figure 5 Length of the colon after treatment.
A: Length of the colon in depression groups; B: Length of the colon in chronic restraint stress, dextran sodium sulfate and compound model groups. aP < 0.01 vs control group; bP < 0.01 vs chronic restraint stress group; hP < 0.05 vs chronic restraint stress + dextran sodium sulfate group. CUMS: Chronic restraint stress; DSS: Dextran sodium sulfate; LD: Low-dose Wuling powder; MD: Medium-dose Wuling powder; HD: High-dose Wuling powder; FLU: Fluoxetine; MS: Mesalazine.
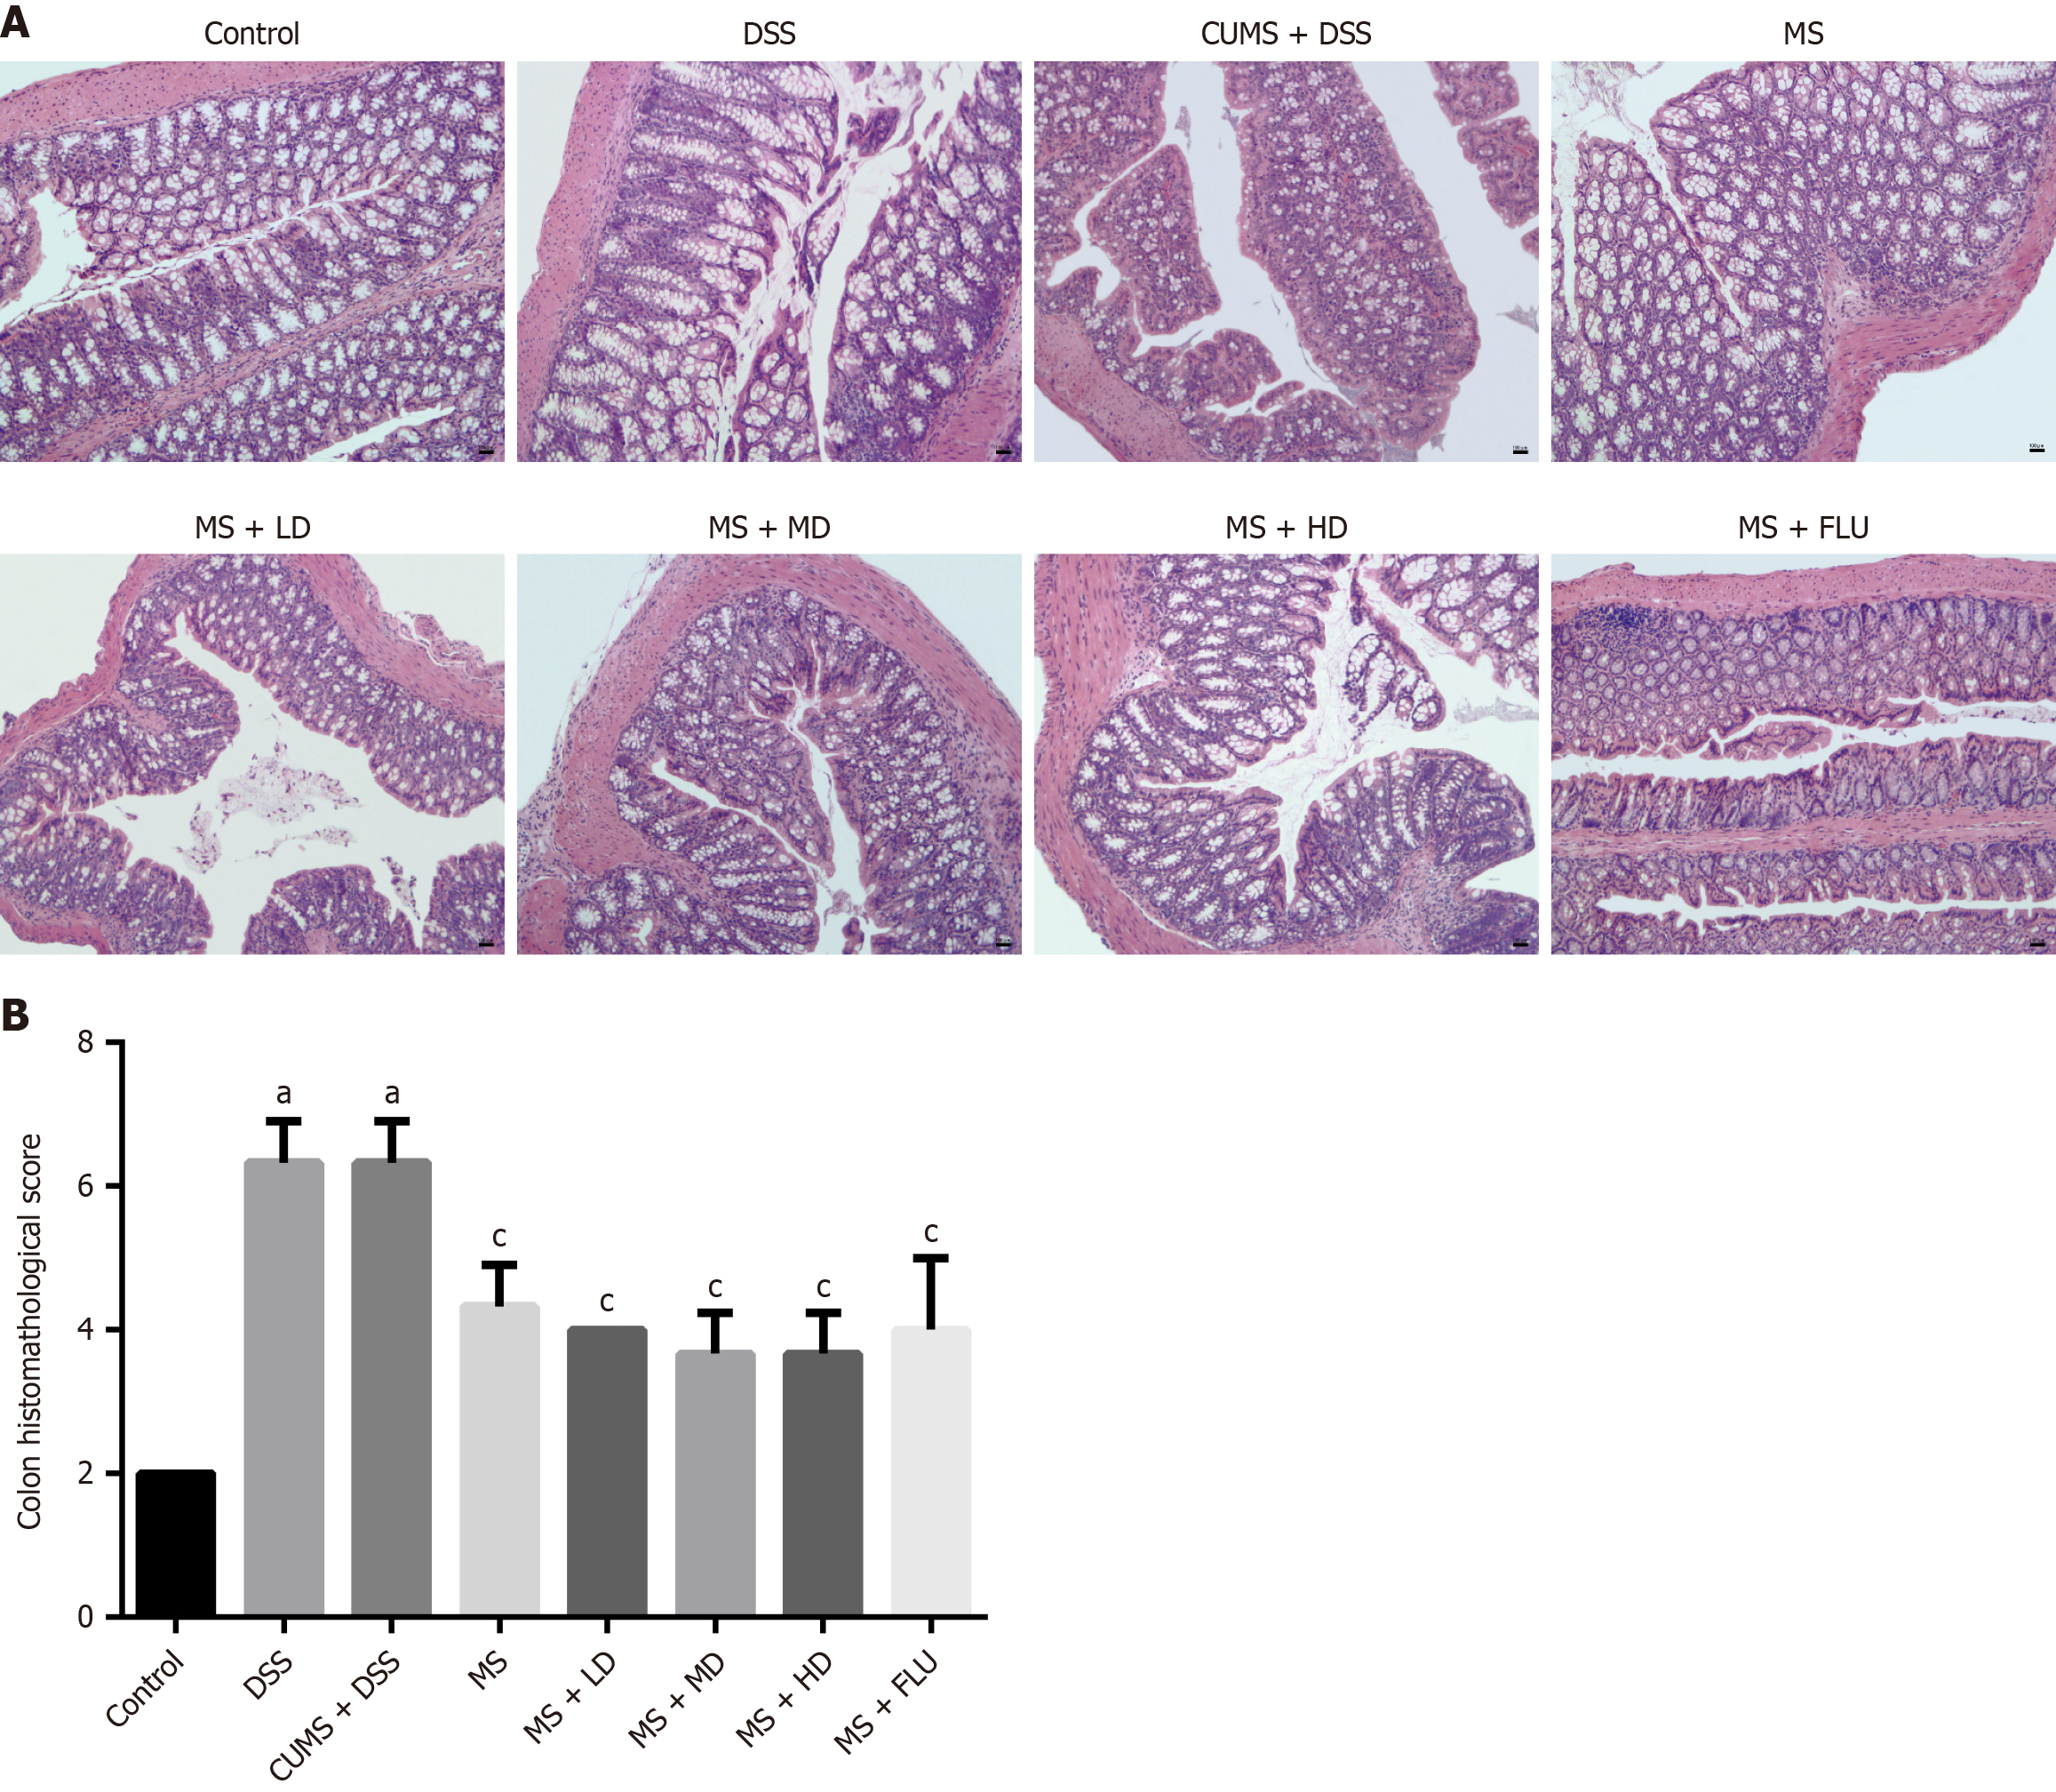
Figure 6 Histopathological examination by hematoxylin-eosin staining (100 ×) and colon histopathological scores.
A: Hematoxylin-eosin staining images; B: Colon histopathological scores of each group. aP < 0.01 vs control group; cP < 0.01 vs chronic restraint stress + dextran sodium sulfate group. CUMS: Chronic restraint stress; DSS: Dextran sodium sulfate; LD: Low-dose Wuling powder; MD: Medium-dose Wuling powder; HD: High-dose Wuling powder; FLU: Fluoxetine; MS: Mesalazine.
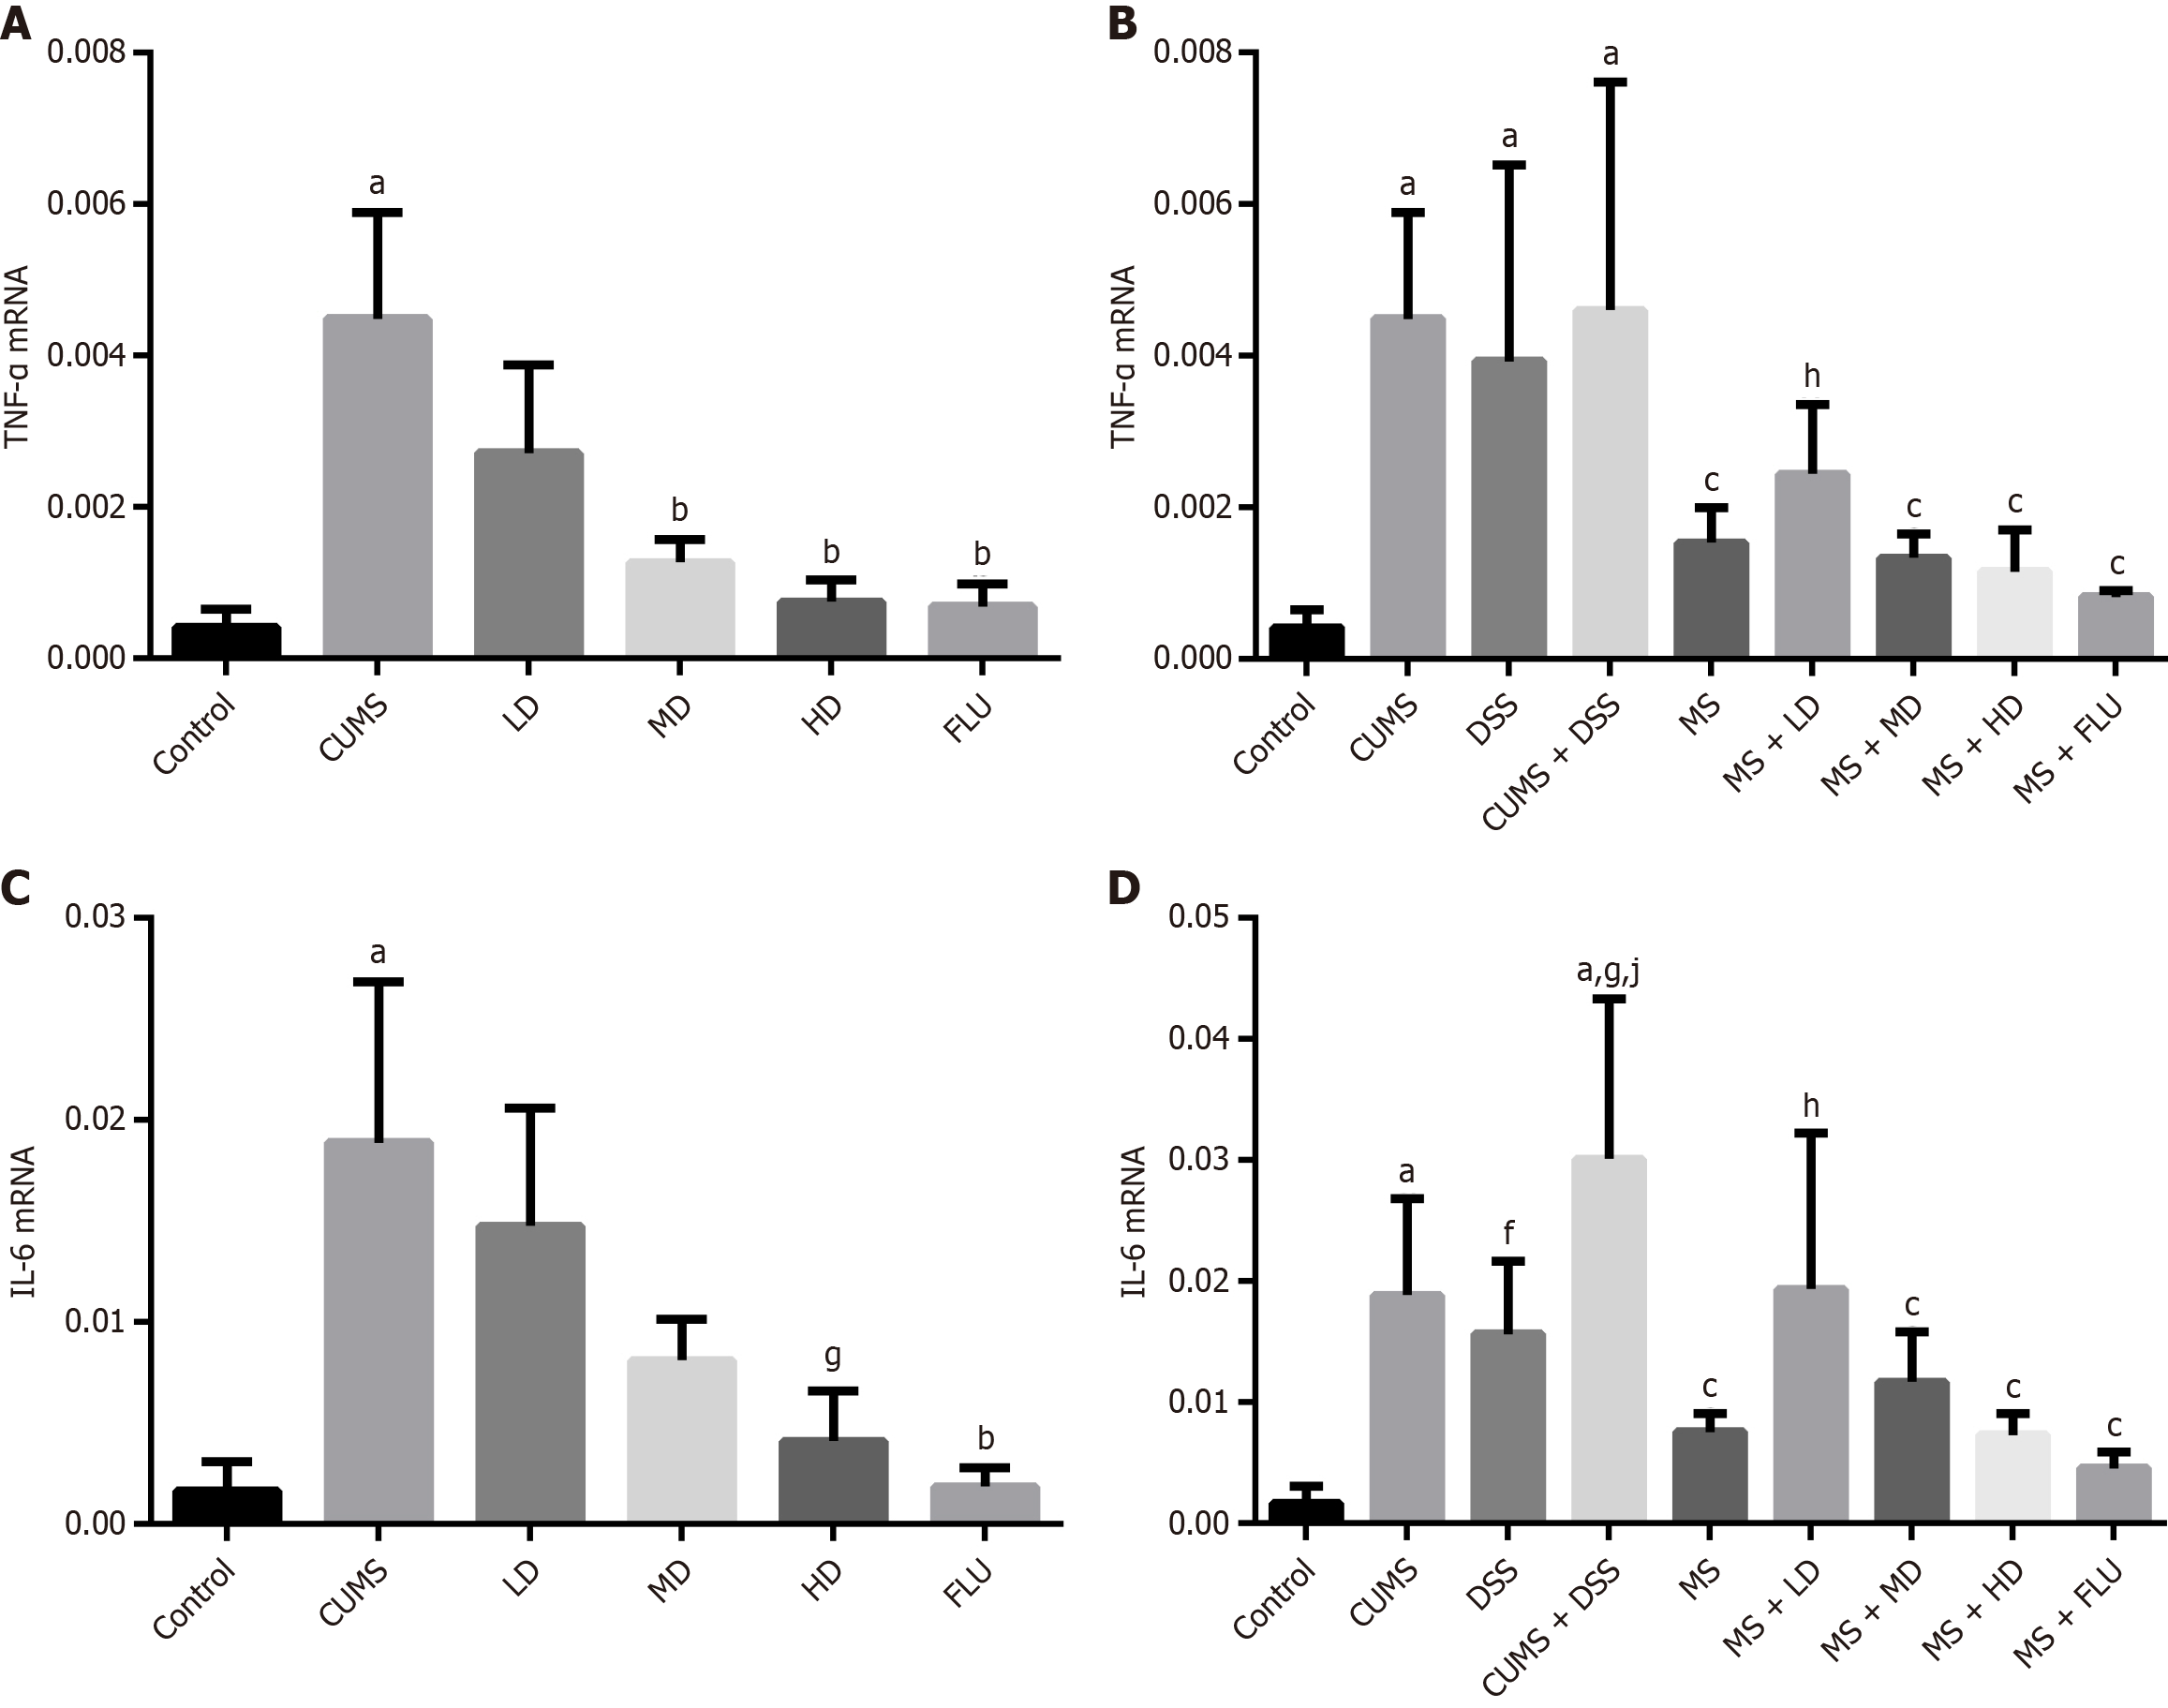
Figure 7 Expression of tumor necrosis factor-alpha and interleukin-6 mRNA in colonic tissue after treatment.
A: Expression of tumor necrosis factor-alpha mRNA in depression groups; B: Expression of tumor necrosis factor-alpha mRNA in chronic restraint stress, dextran sodium sulfate and compound model groups; C: Expression of interleukin-6 mRNA in depression groups; D: Expression of interleukin-6 mRNA in chronic restraint stress, dextran sodium sulfate and compound model groups. aP < 0.01 vs control group; bP < 0.01 vs chronic restraint stress group; cP < 0.01 vs chronic restraint stress + dextran sodium sulfate group; fP < 0.05 vs control group; gP < 0.05 vs chronic restraint stress group; hP < 0.05 vs chronic restraint stress + dextran sodium sulfate group; jP < 0.05 vs dextran sodium sulfate group. CUMS: Chronic restraint stress; DSS: Dextran sodium sulfate; LD: Low-dose Wuling powder; MD: Medium-dose Wuling powder; HD: High-dose Wuling powder; FLU: Fluoxetine; MS: Mesalazine; TNF: Tumor necrosis factor; IL: Interleukin.
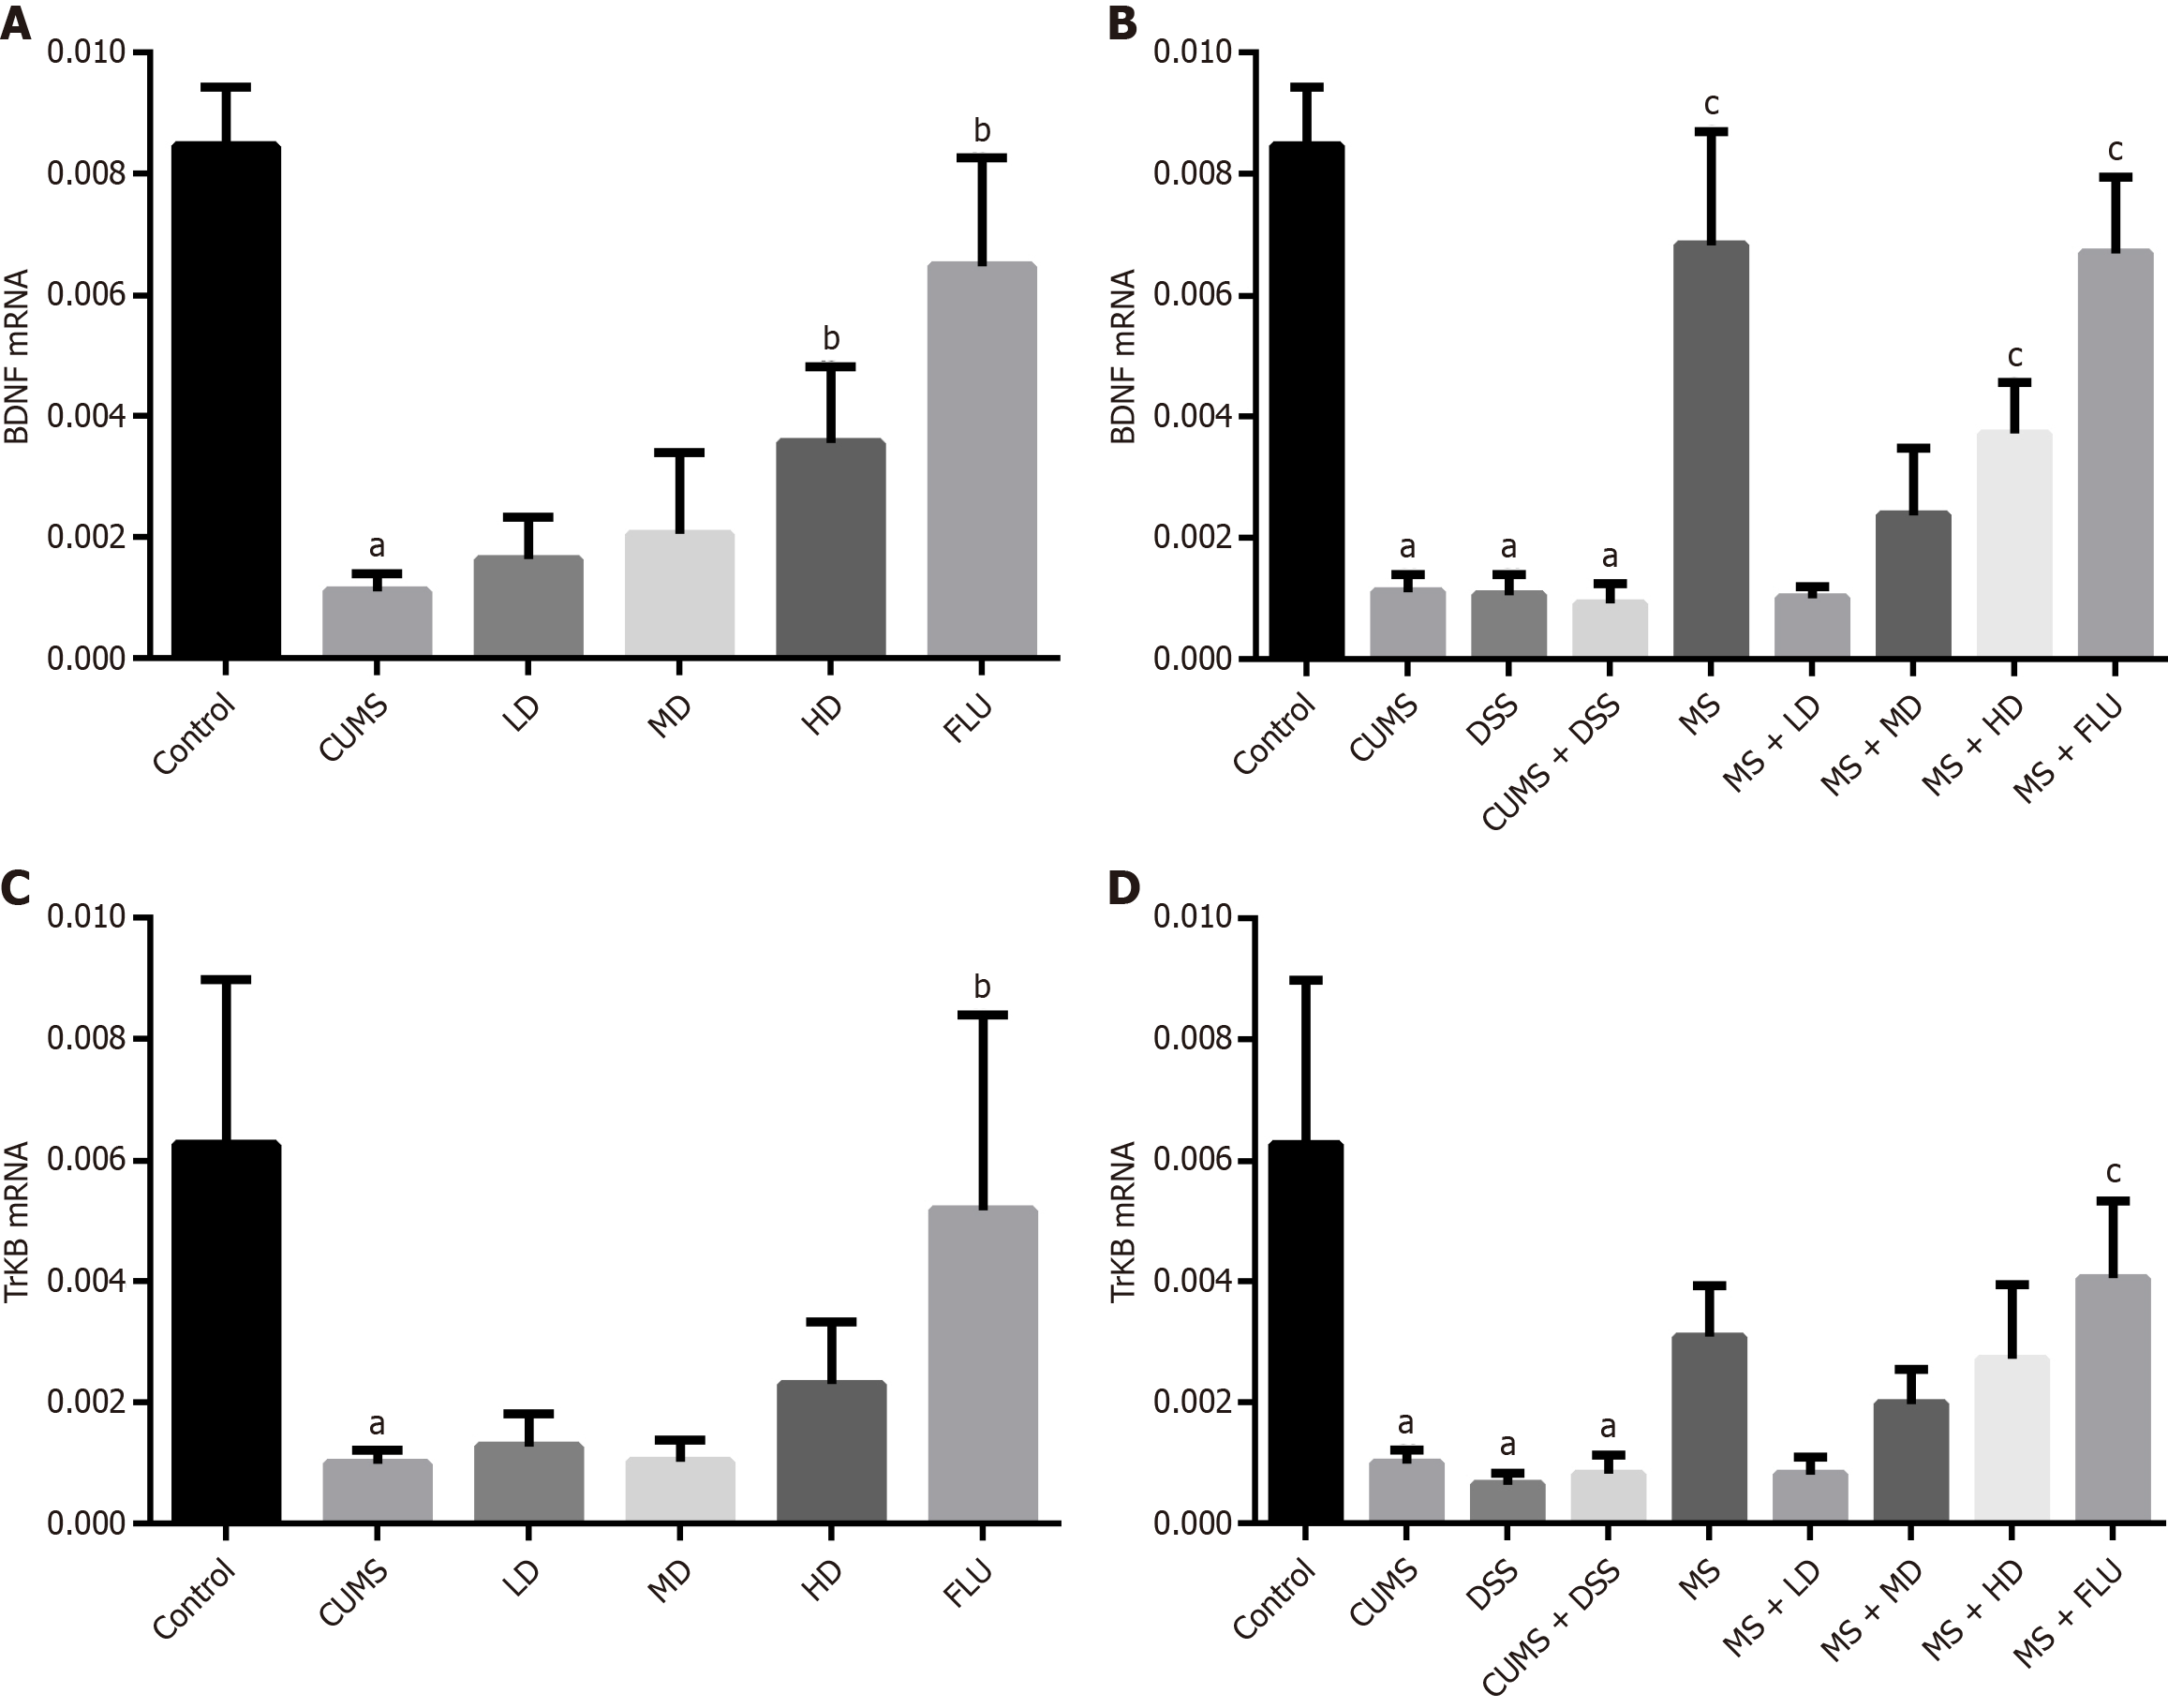
Figure 8 Expression of brain-derived neurotrophic factor and tropomyosin receptor kinase B mRNA in the hippocampus.
A: Expression of brain-derived neurotrophic factor mRNA in depression groups; B: Expression of brain-derived neurotrophic factor mRNA in chronic restraint stress, dextran sodium sulfate and compound model groups; C: Expression of tropomyosin receptor kinase B mRNA in depression groups; D: Expression of tropomyosin receptor kinase B mRNA in chronic restraint stress, dextran sodium sulfate and compound model groups. aP < 0.01 vs control group; bP < 0.01 vs chronic restraint stress group; cP < 0.01 vs chronic restraint stress + dextran sodium sulfate group. CUMS: Chronic restraint stress; DSS: Dextran sodium sulfate; LD: Low-dose Wuling powder; MD: Medium-dose Wuling powder; HD: High-dose Wuling powder; FLU: Fluoxetine; MS: Mesalazine; BDNF: Brain-derived neurotrophic factor; TrkB: Tropomyosin receptor kinase B.
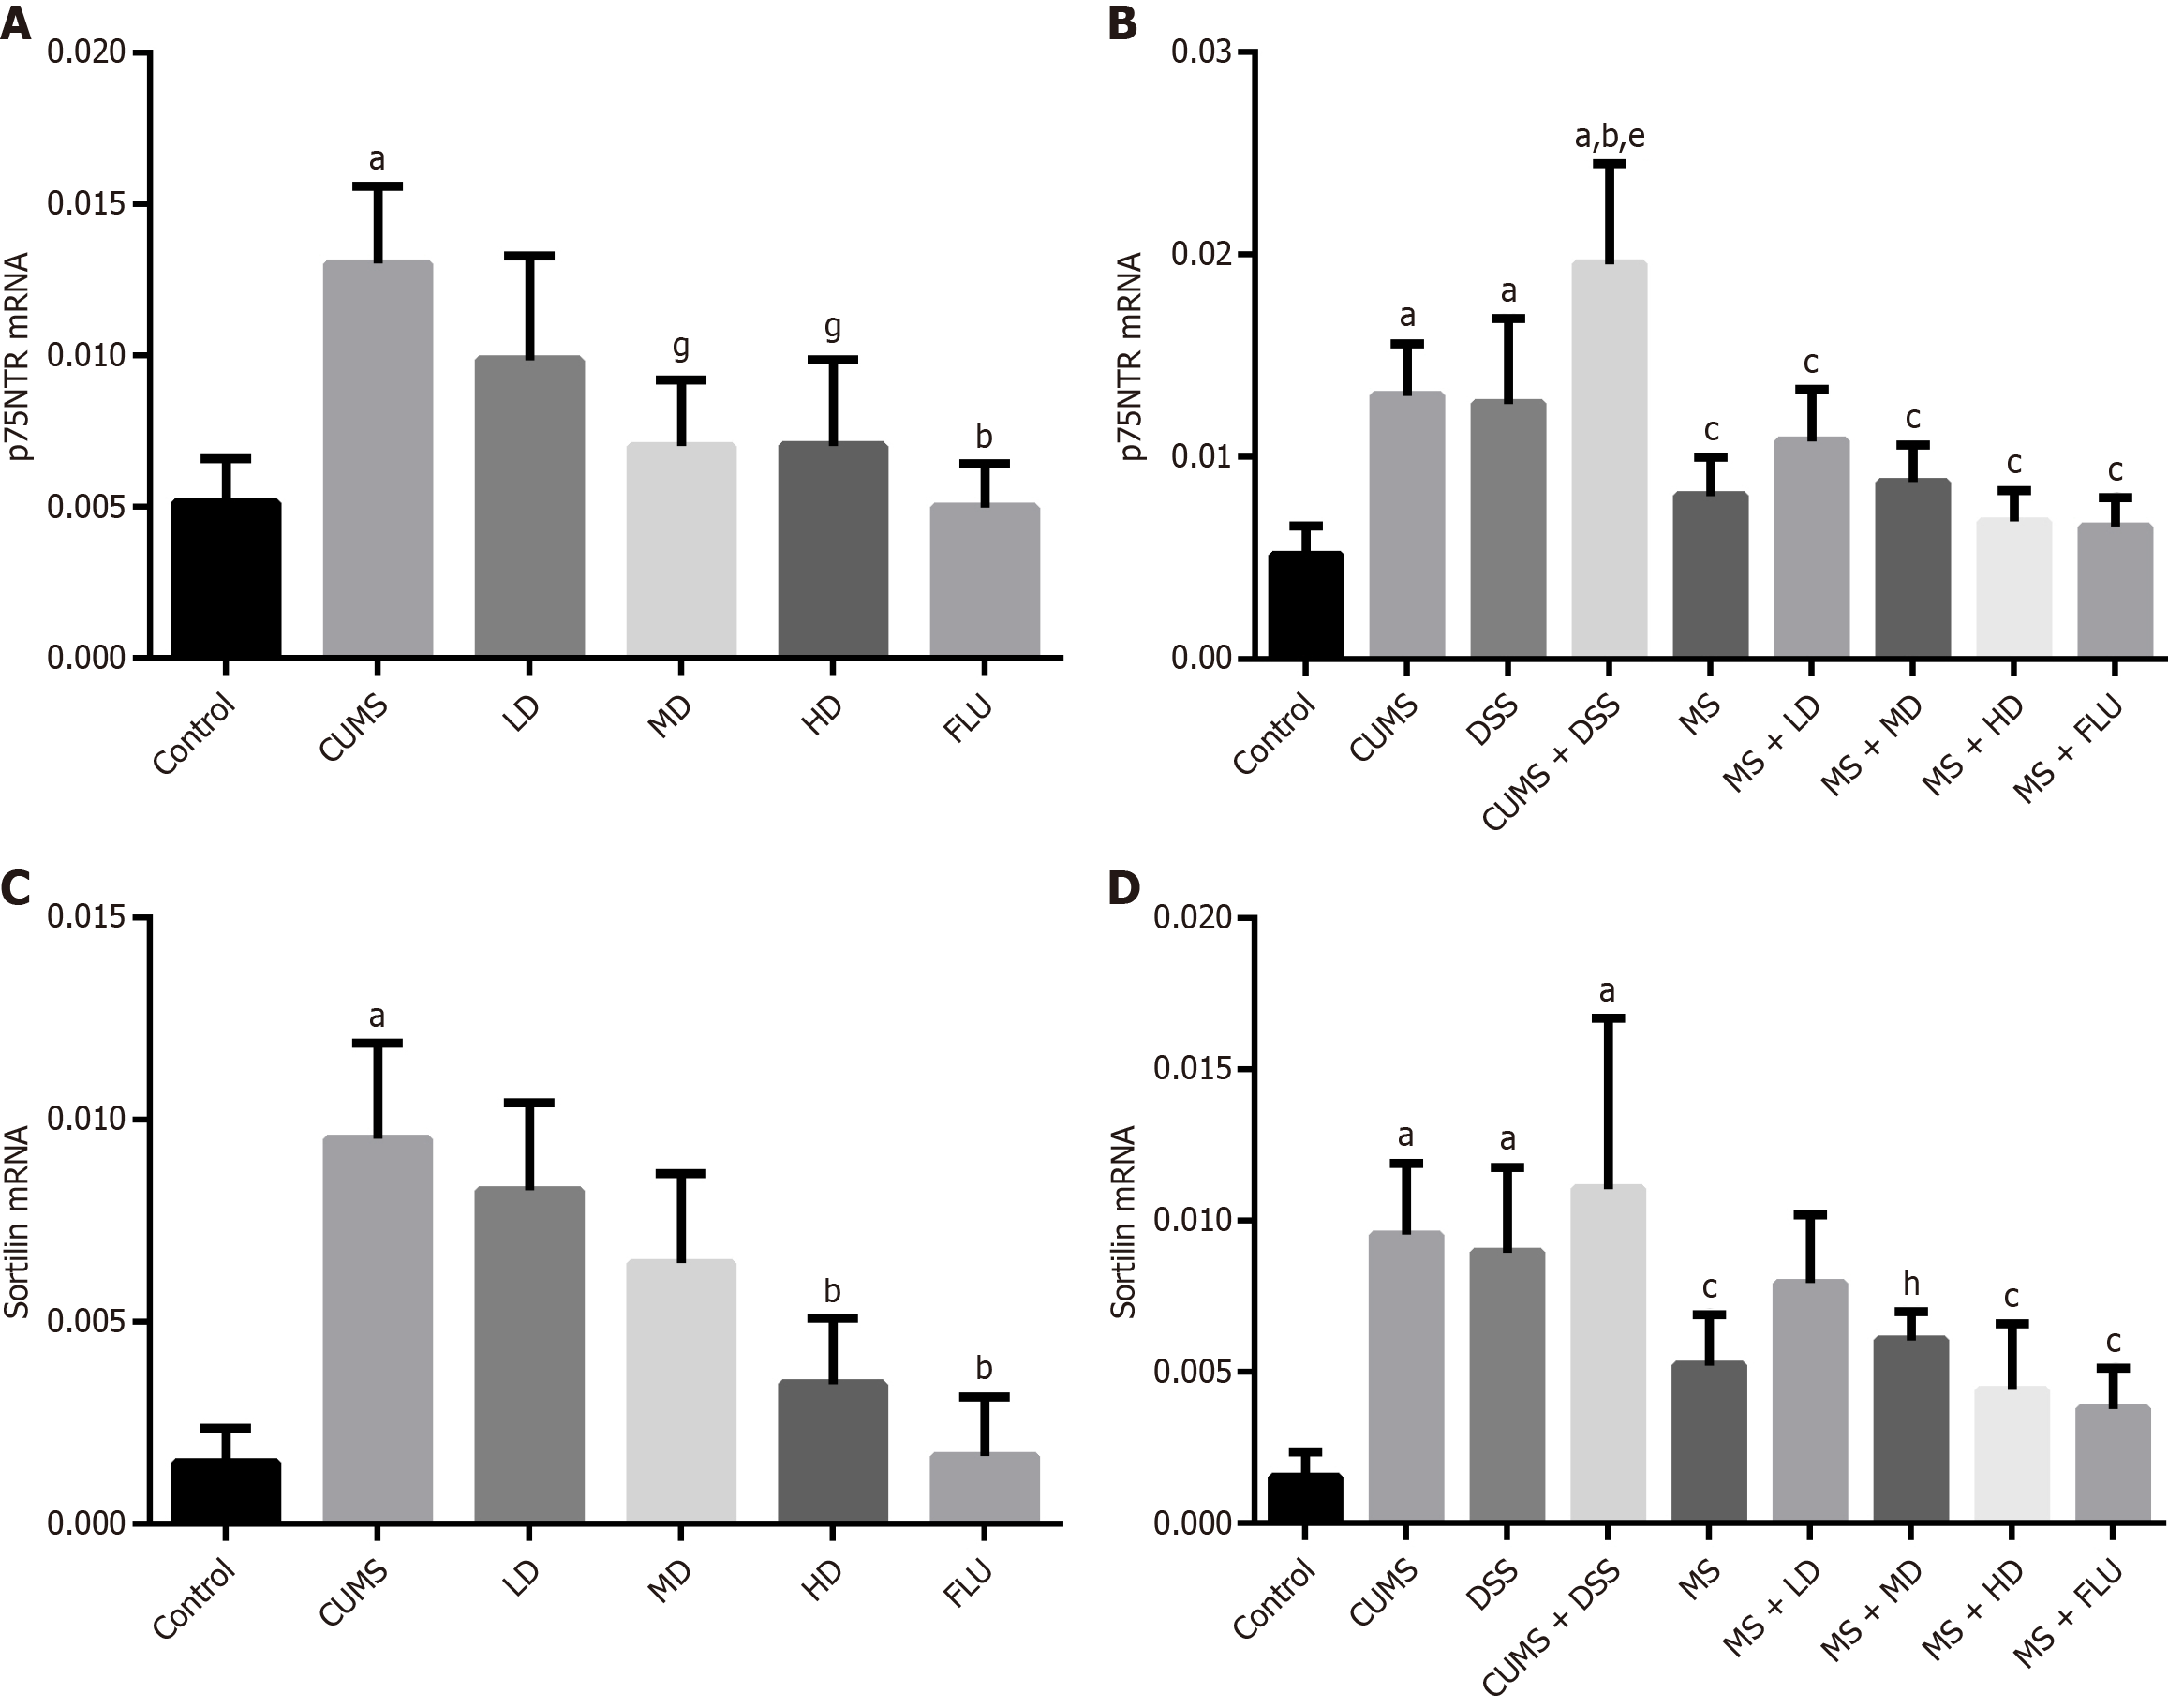
Figure 9 Expression of p75 neurotrophin receptor and sortilin mRNA in the hippocampus.
A: Expression of p75 neurotrophin receptor mRNA in depression groups; B: Expression of p75 neurotrophin receptor mRNA in chronic restraint stress, dextran sodium sulfate and compound model groups; C: Expression of sortilin mRNA in depression groups; D: Expression of sortilin mRNA in chronic restraint stress, dextran sodium sulfate and compound model groups. aP < 0.01 vs control group; bP < 0.01 vs chronic restraint stress group; cP < 0.01 vs chronic restraint stress + dextran sodium sulfate group; eP< 0.01 vs dextran sodium sulfate group; gP < 0.05 vs chronic restraint stress group; hP< 0.05 vs chronic restraint stress + dextran sodium sulfate group. CUMS: Chronic restraint stress; DSS: Dextran sodium sulfate; LD: Low-dose Wuling powder; MD: Medium-dose Wuling powder; HD: High-dose Wuling powder; FLU: Fluoxetine; MS: Mesalazine; p75NTR: P75 neurotrophin receptor.
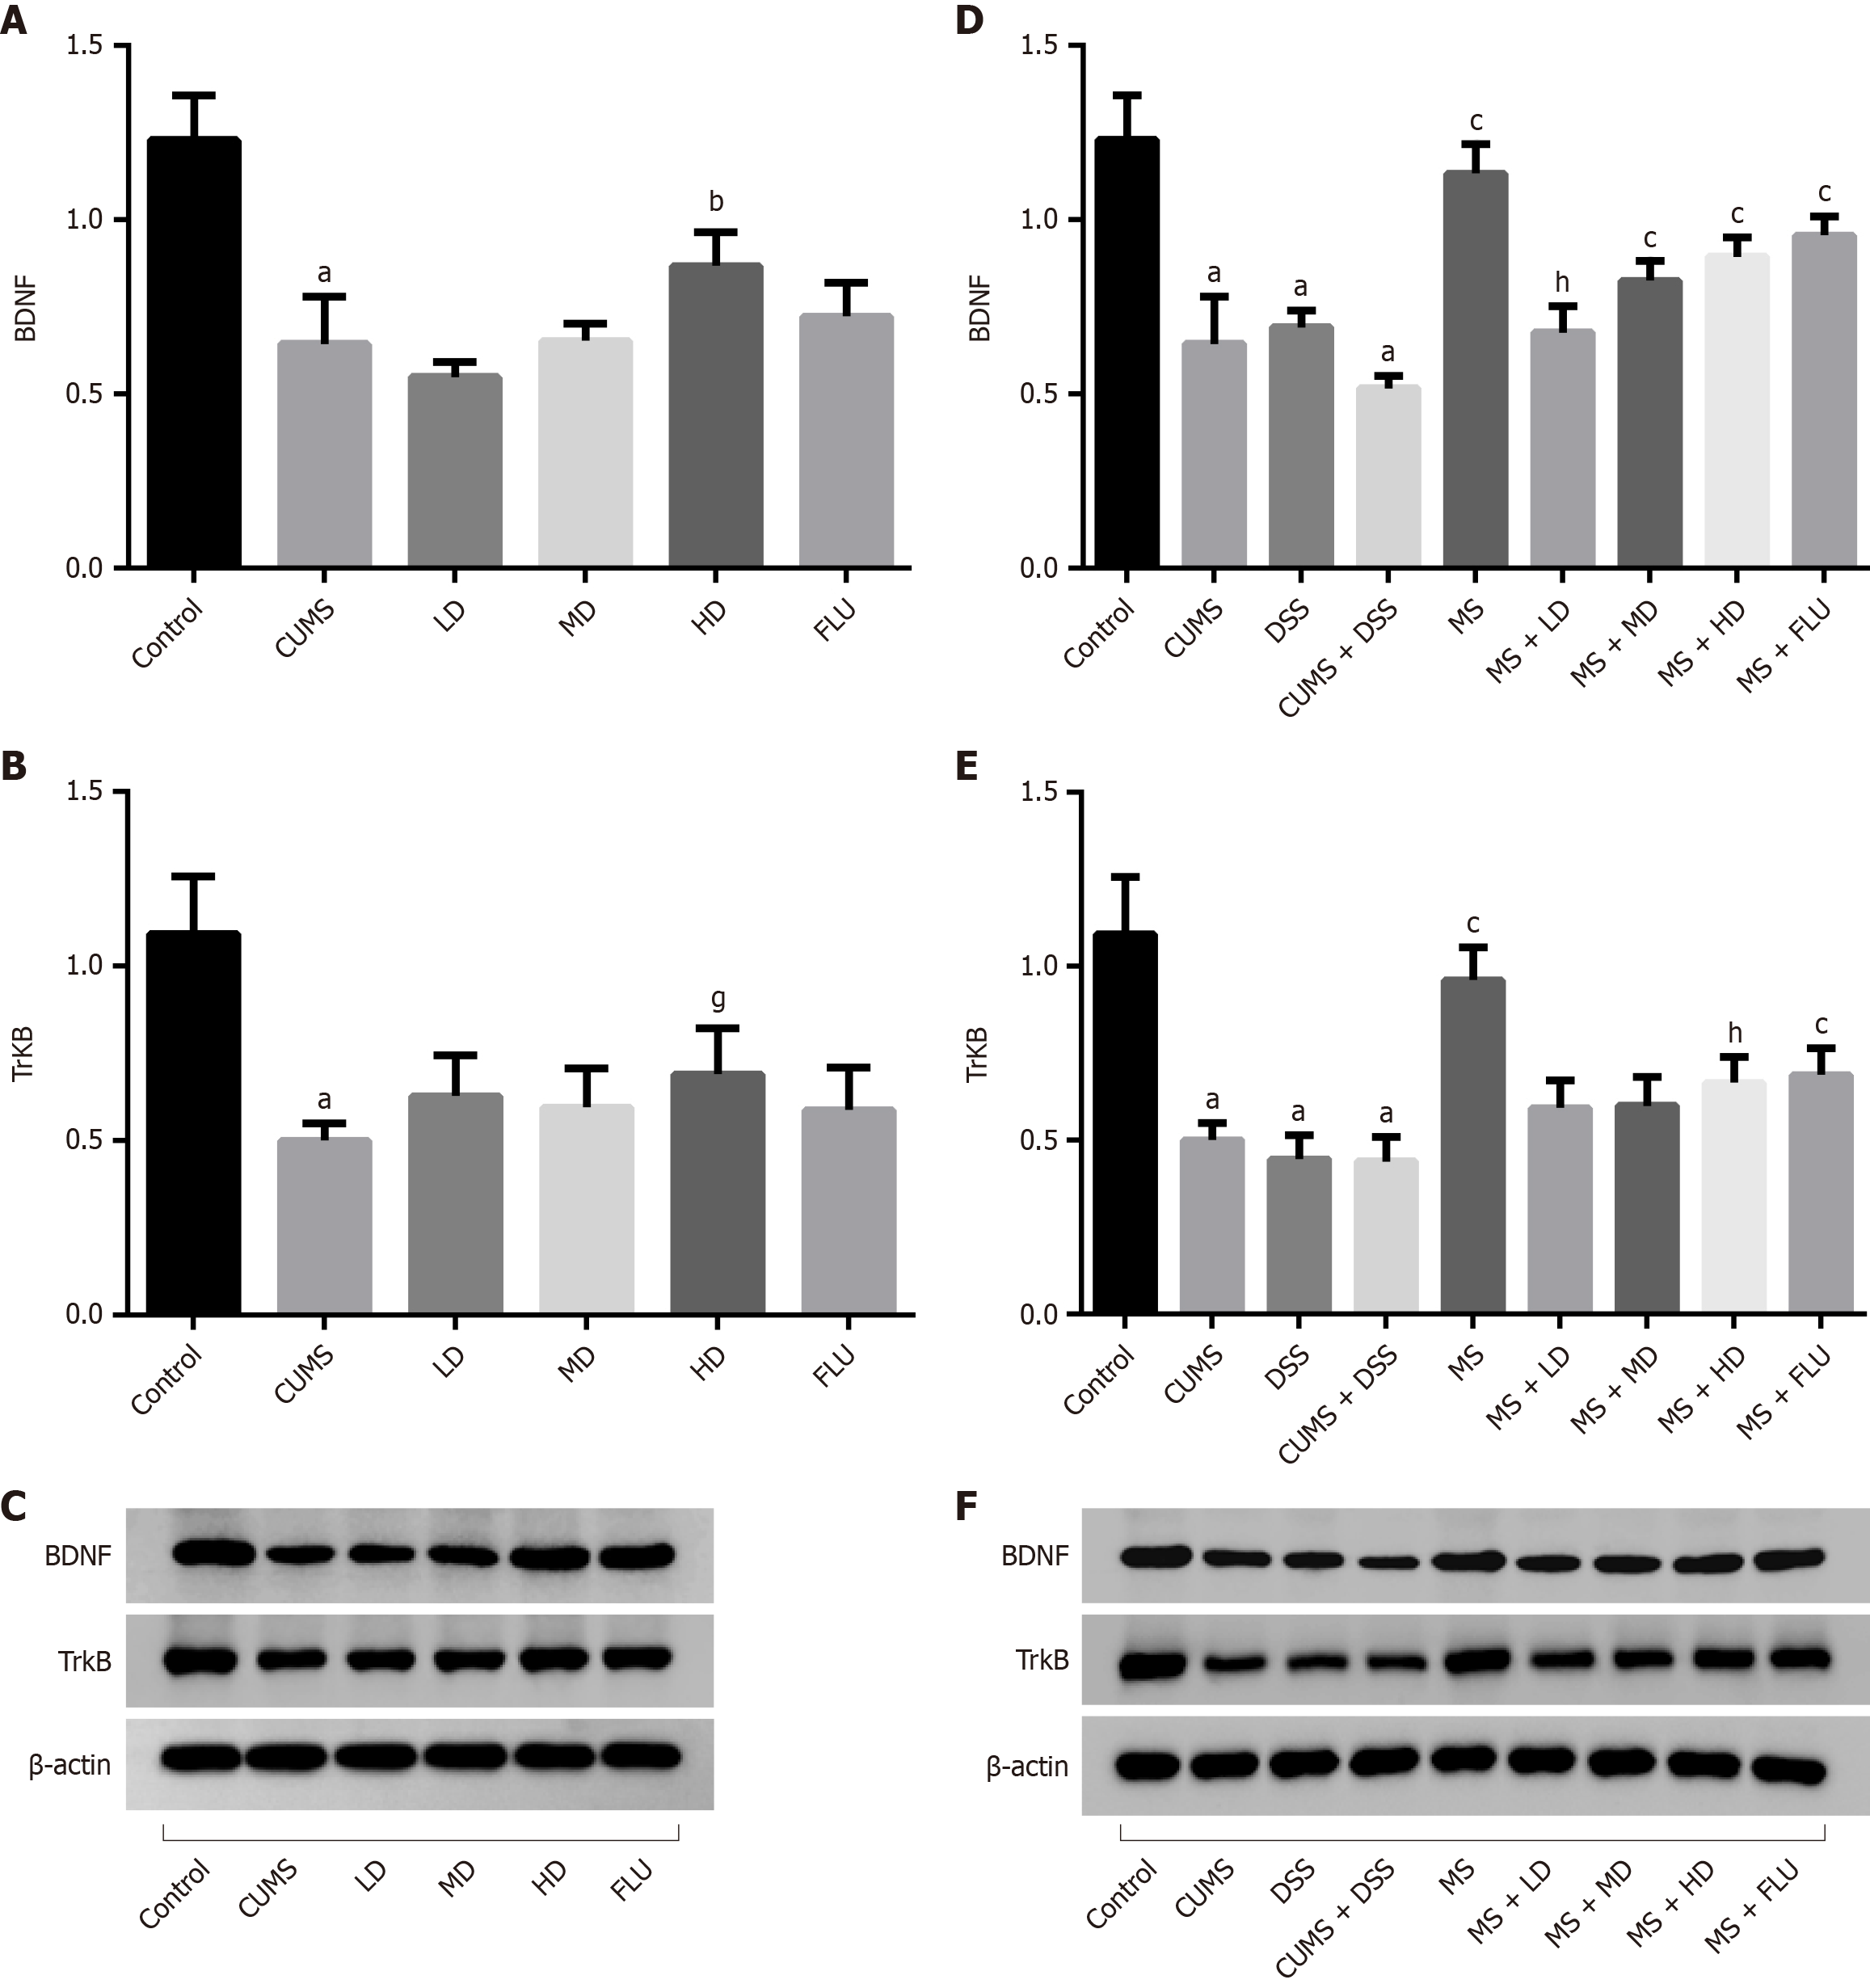
Figure 10 Expression of brain-derived neurotrophic factor and tropomyosin receptor kinase B proteins in the hippocampus.
A: Expression of brain-derived neurotrophic factor (BDNF) protein in depression groups; B: Expression of tropomyosin receptor kinase B (TrkB) protein in depression groups; C: Density analysis of BDNF and TrkB protein expressions in depression groups; D: Expression of BDNF protein in chronic restraint stress (CUMS), dextran sodium sulfate (DSS) and compound model groups; E: Expression of TrkB protein in CUMS, DSS and compound model groups; F: Density analysis of BDNF and TrkB protein expressions in CUMS, DSS and compound model groups. aP < 0.01 vs control group; bP < 0.01 vs chronic restraint stress group; cP < 0.01 vs chronic restraint stress + dextran sodium sulfate group; gP < 0.05 vs chronic restraint stress group; hP < 0.05 vs chronic restraint stress + dextran sodium sulfate group. CUMS: Chronic restraint stress; DSS: Dextran sodium sulfate; LD: Low-dose Wuling powder; MD: Medium-dose Wuling powder; HD: High-dose Wuling powder; FLU: Fluoxetine; MS: Mesalazine; BDNF: Brain-derived neurotrophic factor; TrkB: Tropomyosin receptor kinase B.
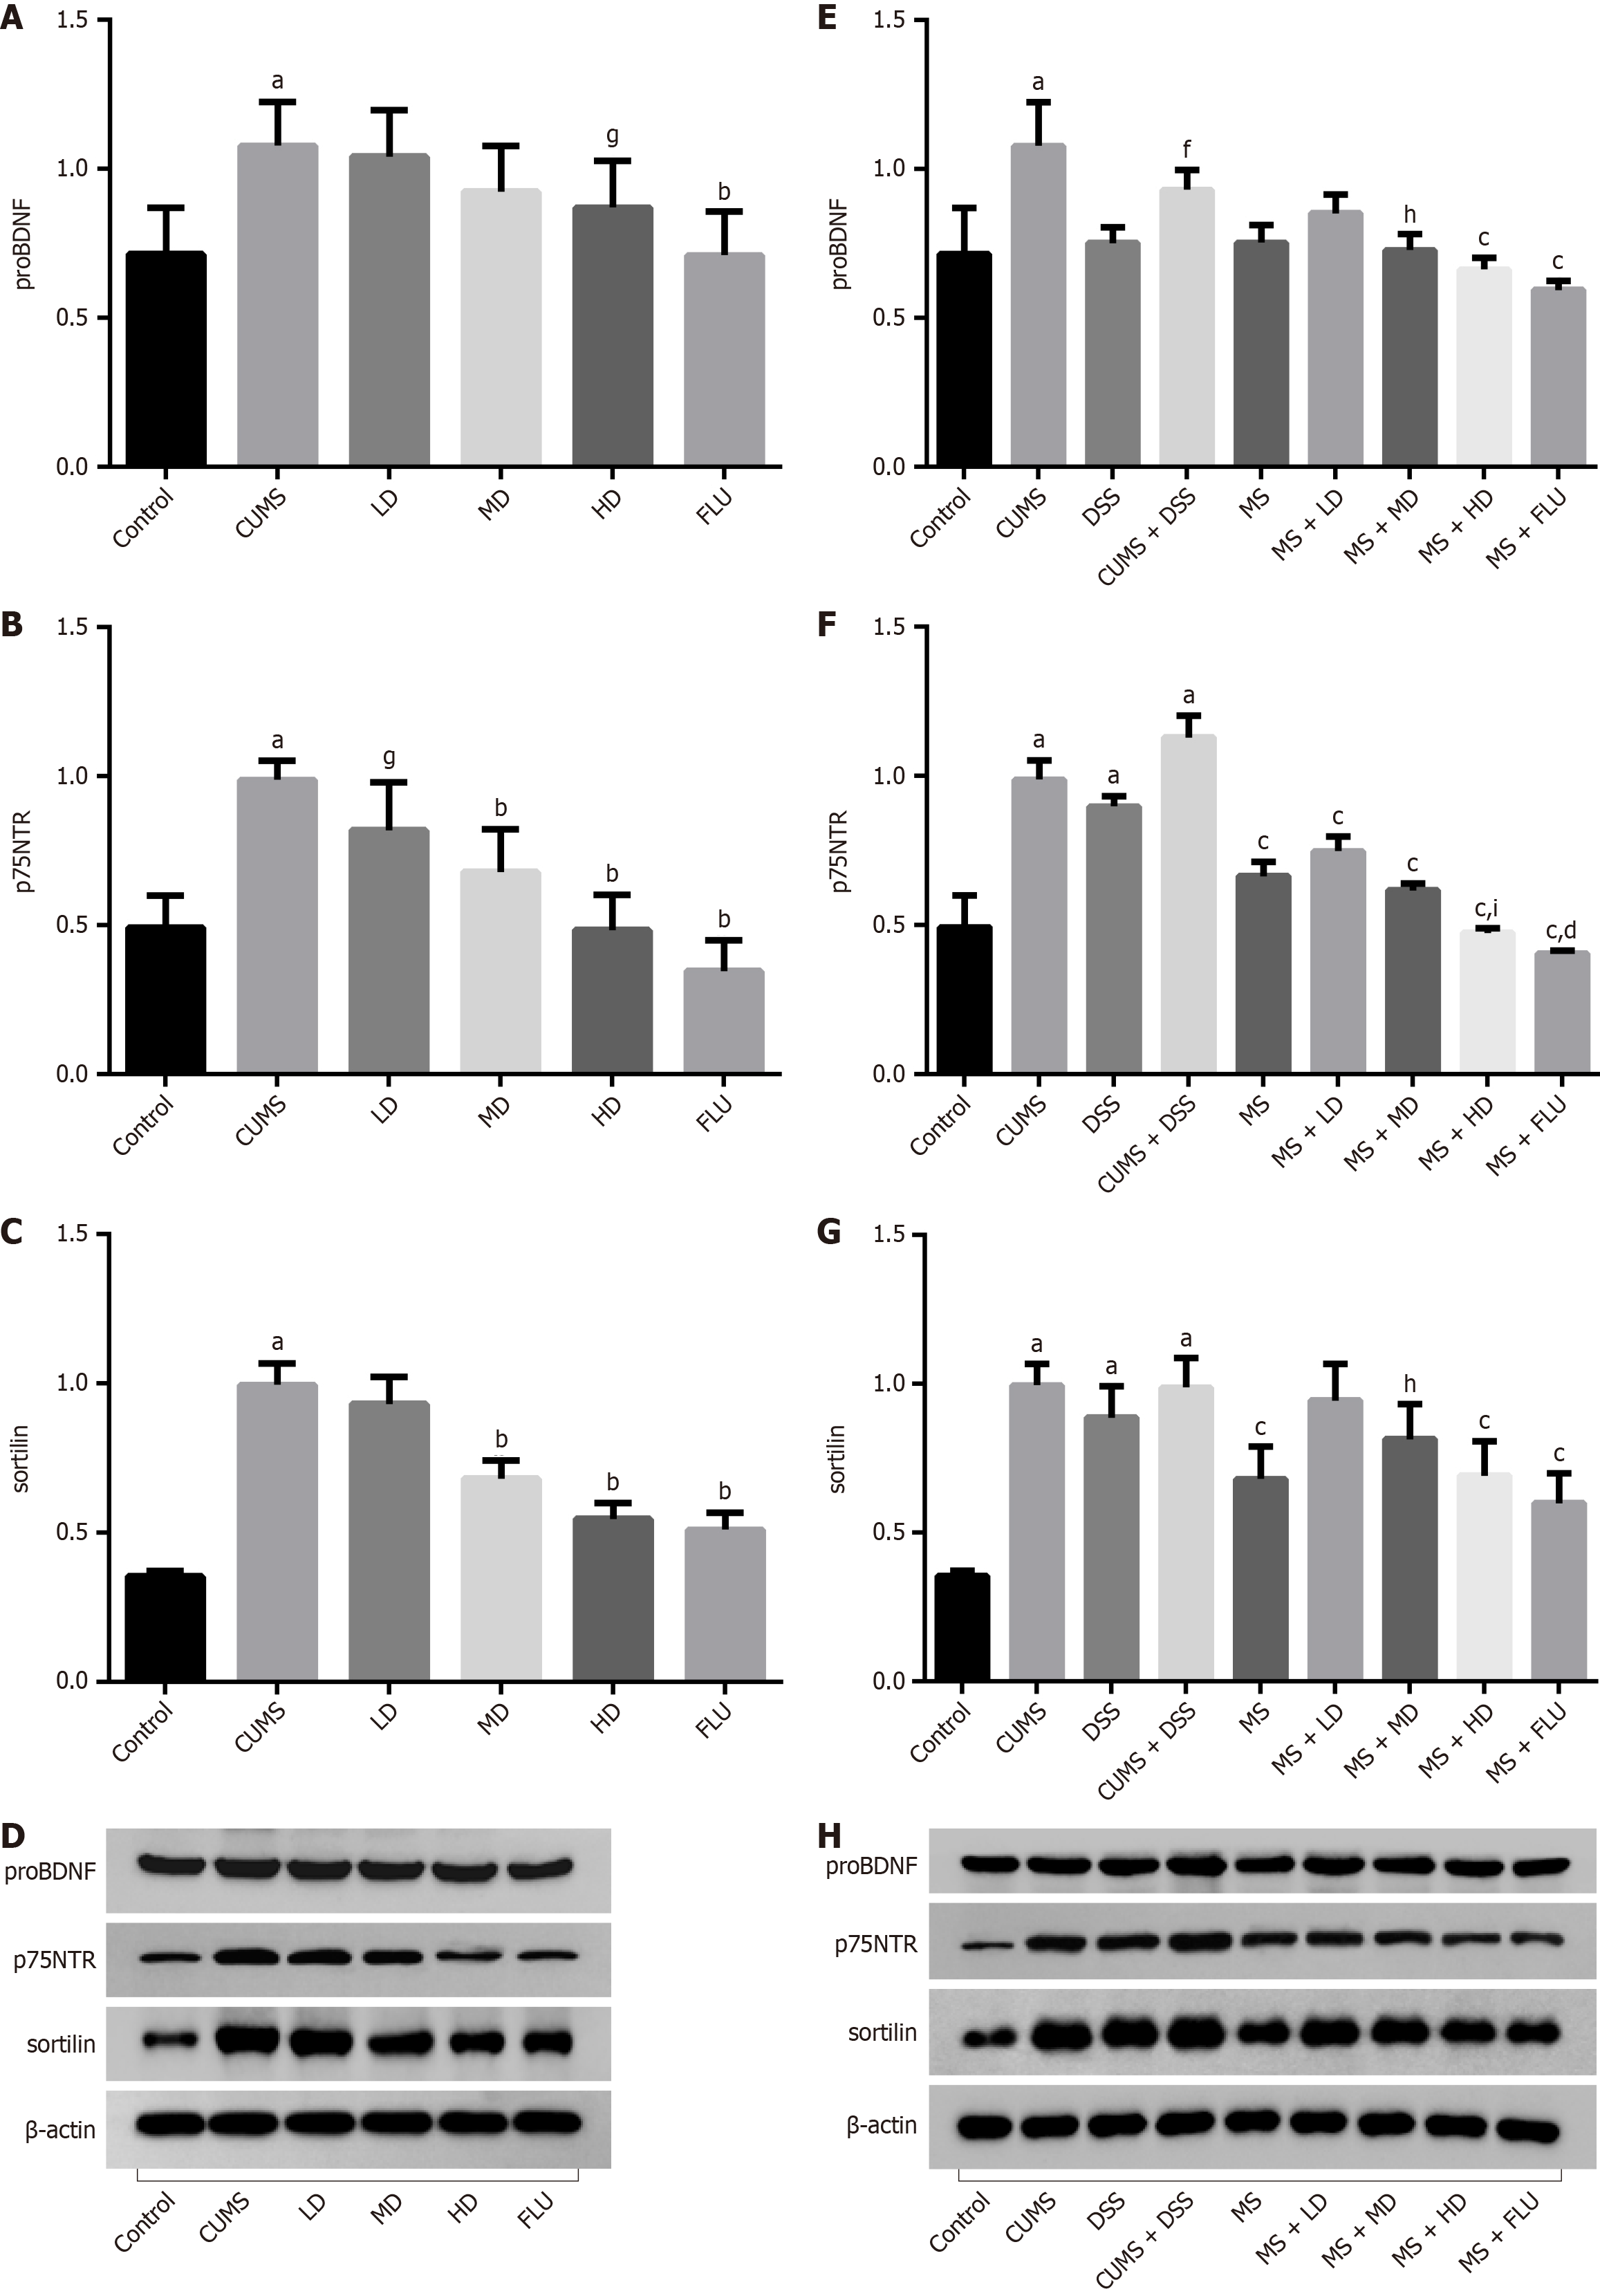
Figure 11 Expression of the brain-derived neurotrophic factor precursor, p75 neurotrophin receptor and sortilin proteins in the hippocampus.
A: Expression of brain-derived neurotrophic factor precursor (proBDNF) protein in depression groups; B: Expression of p75 neurotrophin receptor (p75NTR) protein in depression groups; C: Expression of sortilin protein in depression groups; D: Density analysis of proBDNF, p75NTR, and sortilin protein expressions in depression groups; E: Expression of proBDNF protein in chronic restraint stress (CUMS), dextran sodium sulfate (DSS) and compound model groups; F: Expression of p75NTR protein in CUMS, DSS, and compound model groups; G: Expression of sortilin protein in CUMS, DSS, and compound model groups; H: Density analysis of proBDNF, p75NTR, and sortilin protein expressions. aP < 0.01 vs control group; bP < 0.01 vs chronic restraint stress group; cP < 0.01 vs chronic restraint stress + dextran sodium sulfate group; dP < 0.01 vs mesalazine group; fP < 0.05 vs control group; gP < 0.05 vs chronic restraint stress group; hP < 0.05 vs chronic restraint stress + dextran sodium sulfate group; iP < 0.05 vs mesalazine group. CUMS: Chronic restraint stress; DSS: Dextran sodium sulfate; LD: Low-dose Wuling powder; MD: Medium-dose Wuling powder; HD: High-dose Wuling powder; FLU: Fluoxetine; MS: Mesalazine; proBDNF: Brain-derived neurotrophic factor precursor; p75NTR: P75 neurotrophin receptor.
- Citation: Wang JJ, Fan YH, Cao WT, Huang R, Yao XY, Li ML. Mechanism of Wuling powder modulating proBDNF/p75NTR/sortilin and BDNF/TrkB pathways in the treatment of ulcerative colitis complicated with depression. World J Gastroenterol 2025; 31(8): 100227
- URL: https://www.wjgnet.com/1007-9327/full/v31/i8/100227.htm
- DOI: https://dx.doi.org/10.3748/wjg.v31.i8.100227


