©The Author(s) 2025.
World J Gastroenterol. Jul 28, 2025; 31(28): 107361
Published online Jul 28, 2025. doi: 10.3748/wjg.v31.i28.107361
Published online Jul 28, 2025. doi: 10.3748/wjg.v31.i28.107361
Figure 1 Transcriptomics analysis of differential gene expression.
A: Principal component analysis (PCA) of normalized counts PCA showing gene expression variance among normal, carbon tetrachloride (CCl4), and PF562271 (PF) conditions. The first principal component (PC1) explains 59% of the variance, and PC2 explains 8%; B: Volcano plot showing differentially expressed genes (DEGs) between the normal and CCl4 groups. Significant genes (log2 fold change > 1 or < -1, P < 0.05) are highlighted; C: Volcano plot comparing gene expression between the CCl4 and PF groups. Significant genes are marked similarly; D: Mfuzz clustering of gene expression. Six gene clusters showing expression changes across the normal, CCl4, and PF groups, highlighting condition-specific gene regulation; E: UpSet plot showing the overlap of DEGs between comparisons; F: Venn diagram showing unique and shared DEGs between the normal vs CCl4 and CCl4vs PF groups.
Figure 2 Proteomics analysis of differential protein expression.
A: Principal component analysis (PCA) of normalized protein counts PCA of protein expression across normal, carbon tetrachloride (CCl₄) and PF562271 (PF) conditions. The first principal component (PC1) explains 39.3% of variance, while PC2 explains 9.5%. The three conditions show clear separation; B: Volcano plot showing differentially expressed proteins between the normal and CCl₄ groups. Significant proteins (P < 0.05, log2 fold change > 1 or < -1) are highlighted; C: Volcano plot comparing the CCl₄ and PF groups. Significant proteins are marked, indicating differential expression between these two conditions (P < 0.05); D: Mfuzz clustering of protein expression profiles. Clusters 1, 3, and 4 are shown, highlighting distinct expression trends in normal, CCl₄, and PF conditions; E: UpSet plot showing overlaps of differentially expressed proteins between comparisons (normal vs CCl₄, CCl₄ vs PF) and clusters from Mfuzz analysis; F: Venn diagram showing overlap of differentially expressed proteins between the normal vs CCl₄ and CCl₄ vs PF groups. The diagram indicates unique and shared proteins across the conditions.
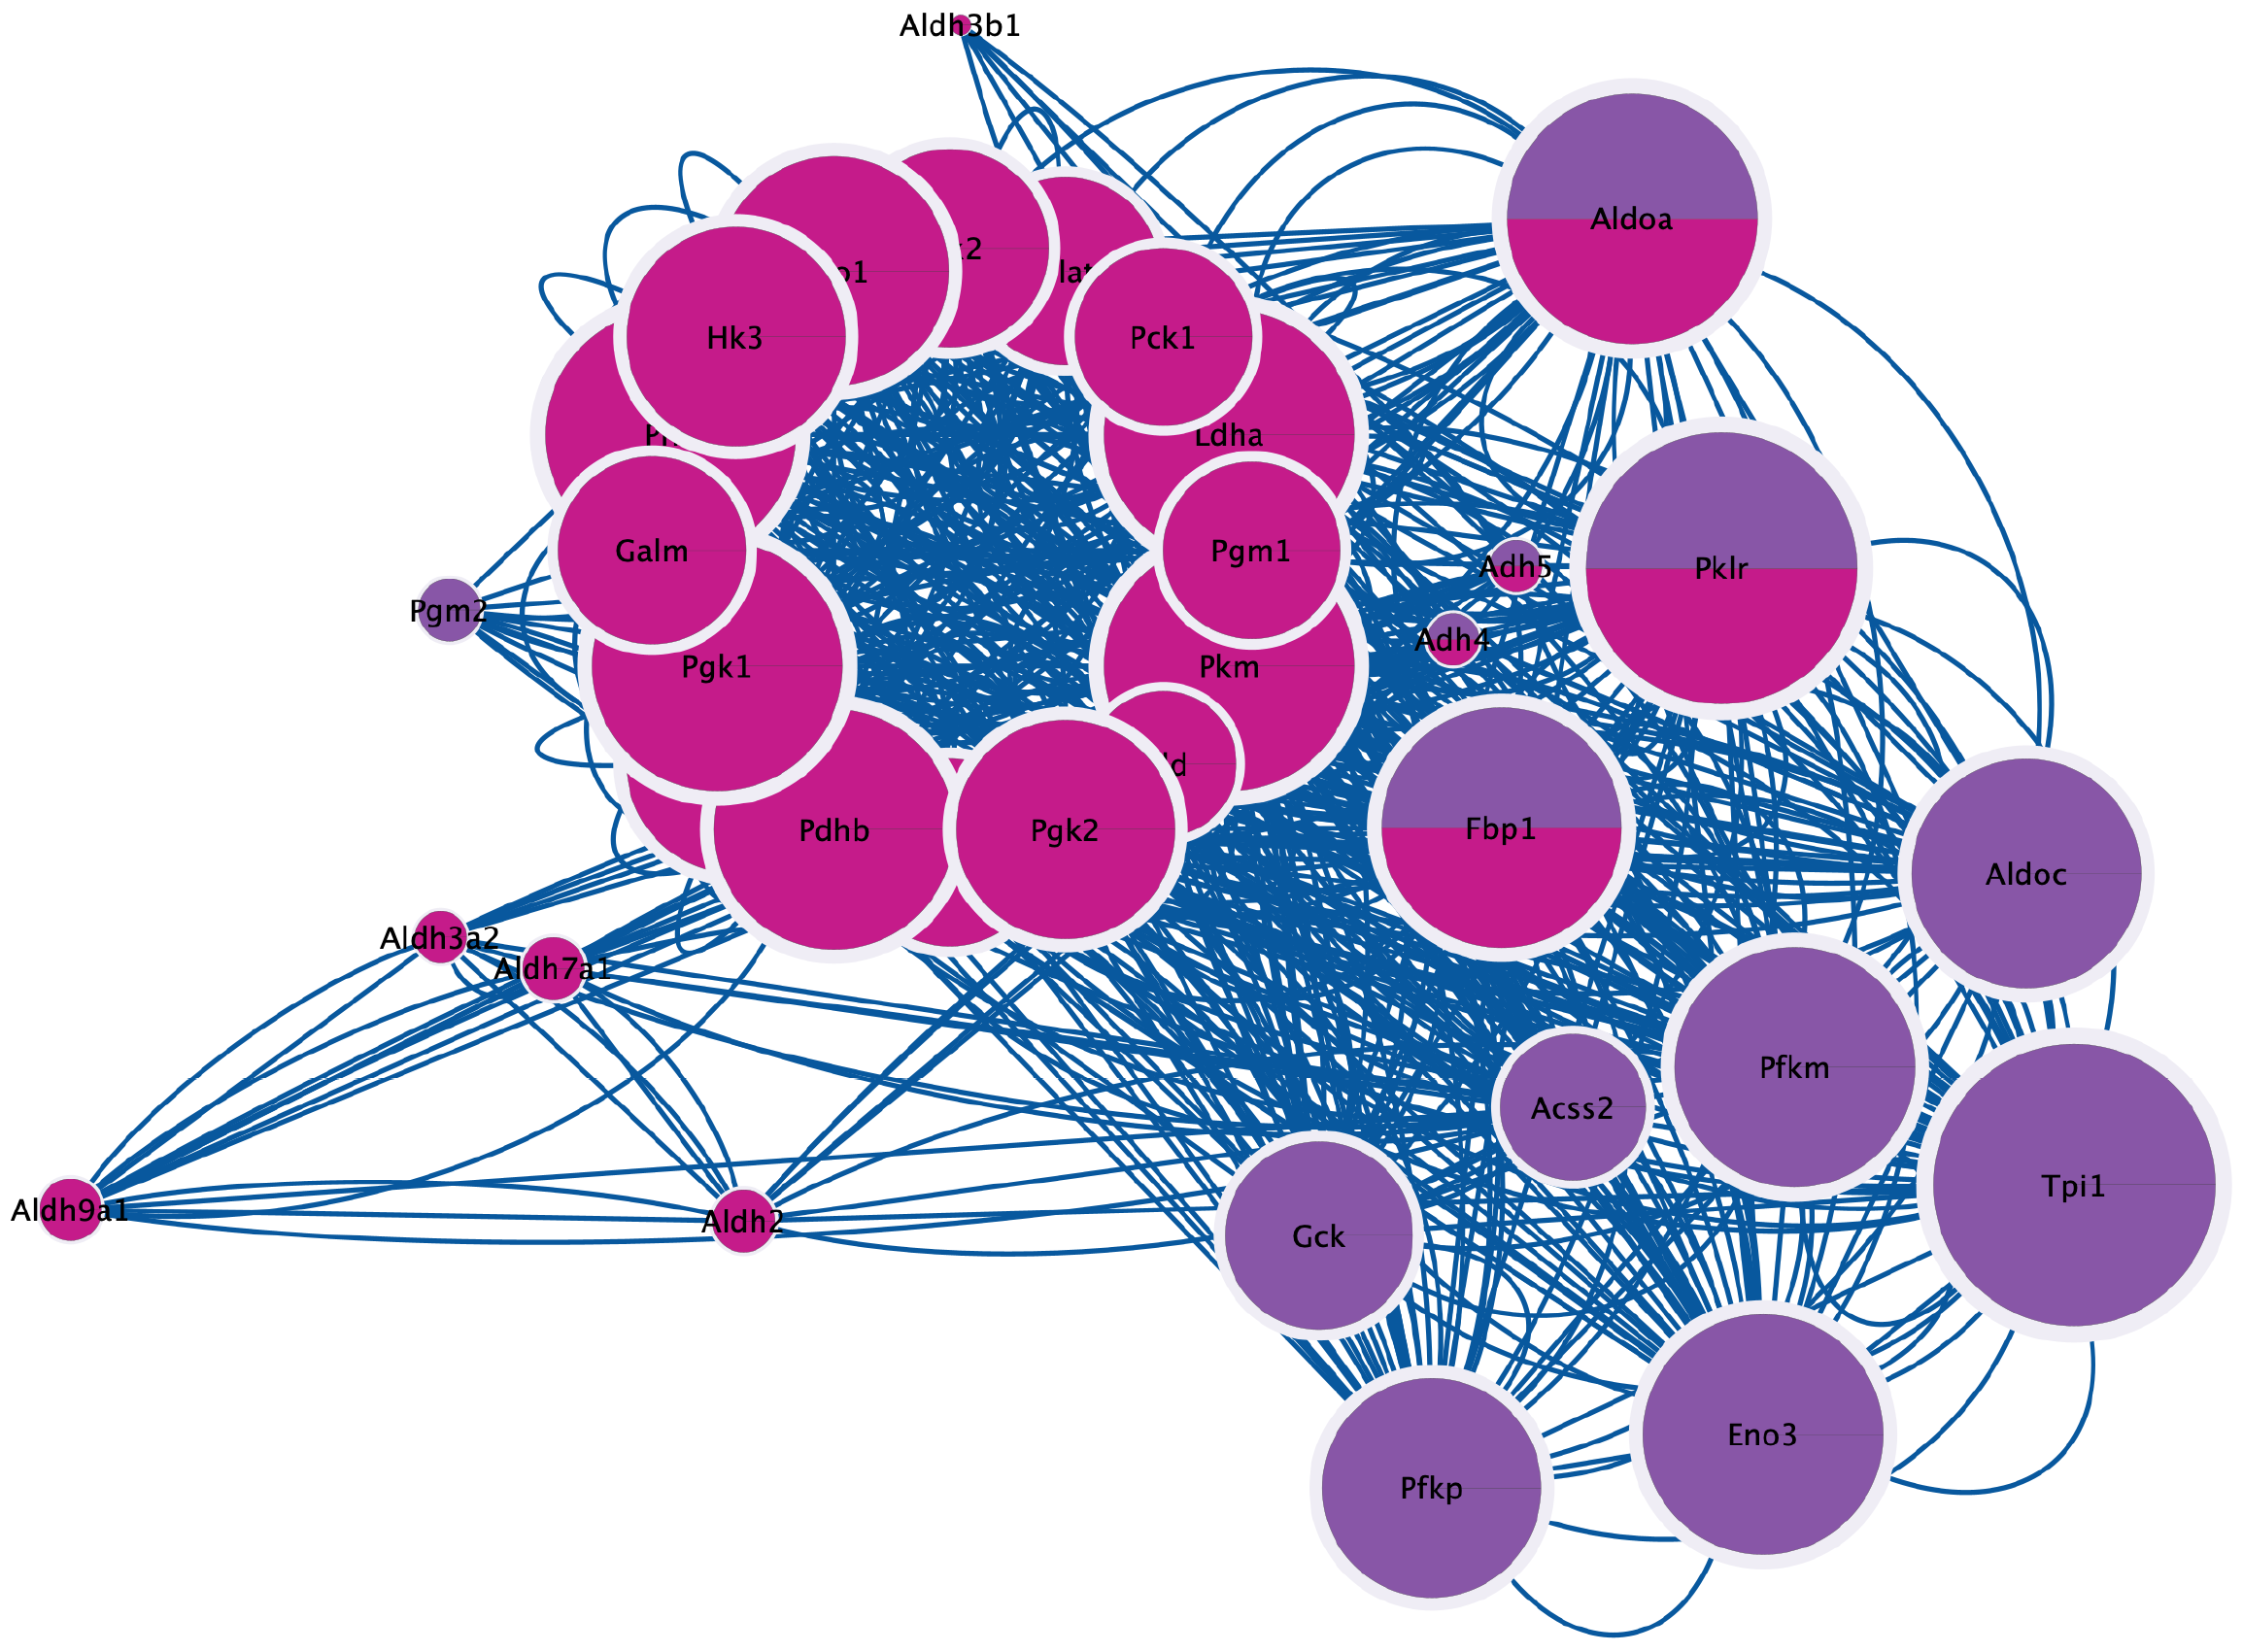
Figure 3 Identification of shared proteins between transcriptomics (purple) and proteomics (red) data.
Nodes represent genes or proteins and the size of the node reflects the importance or centrality of each protein/gene in the network.
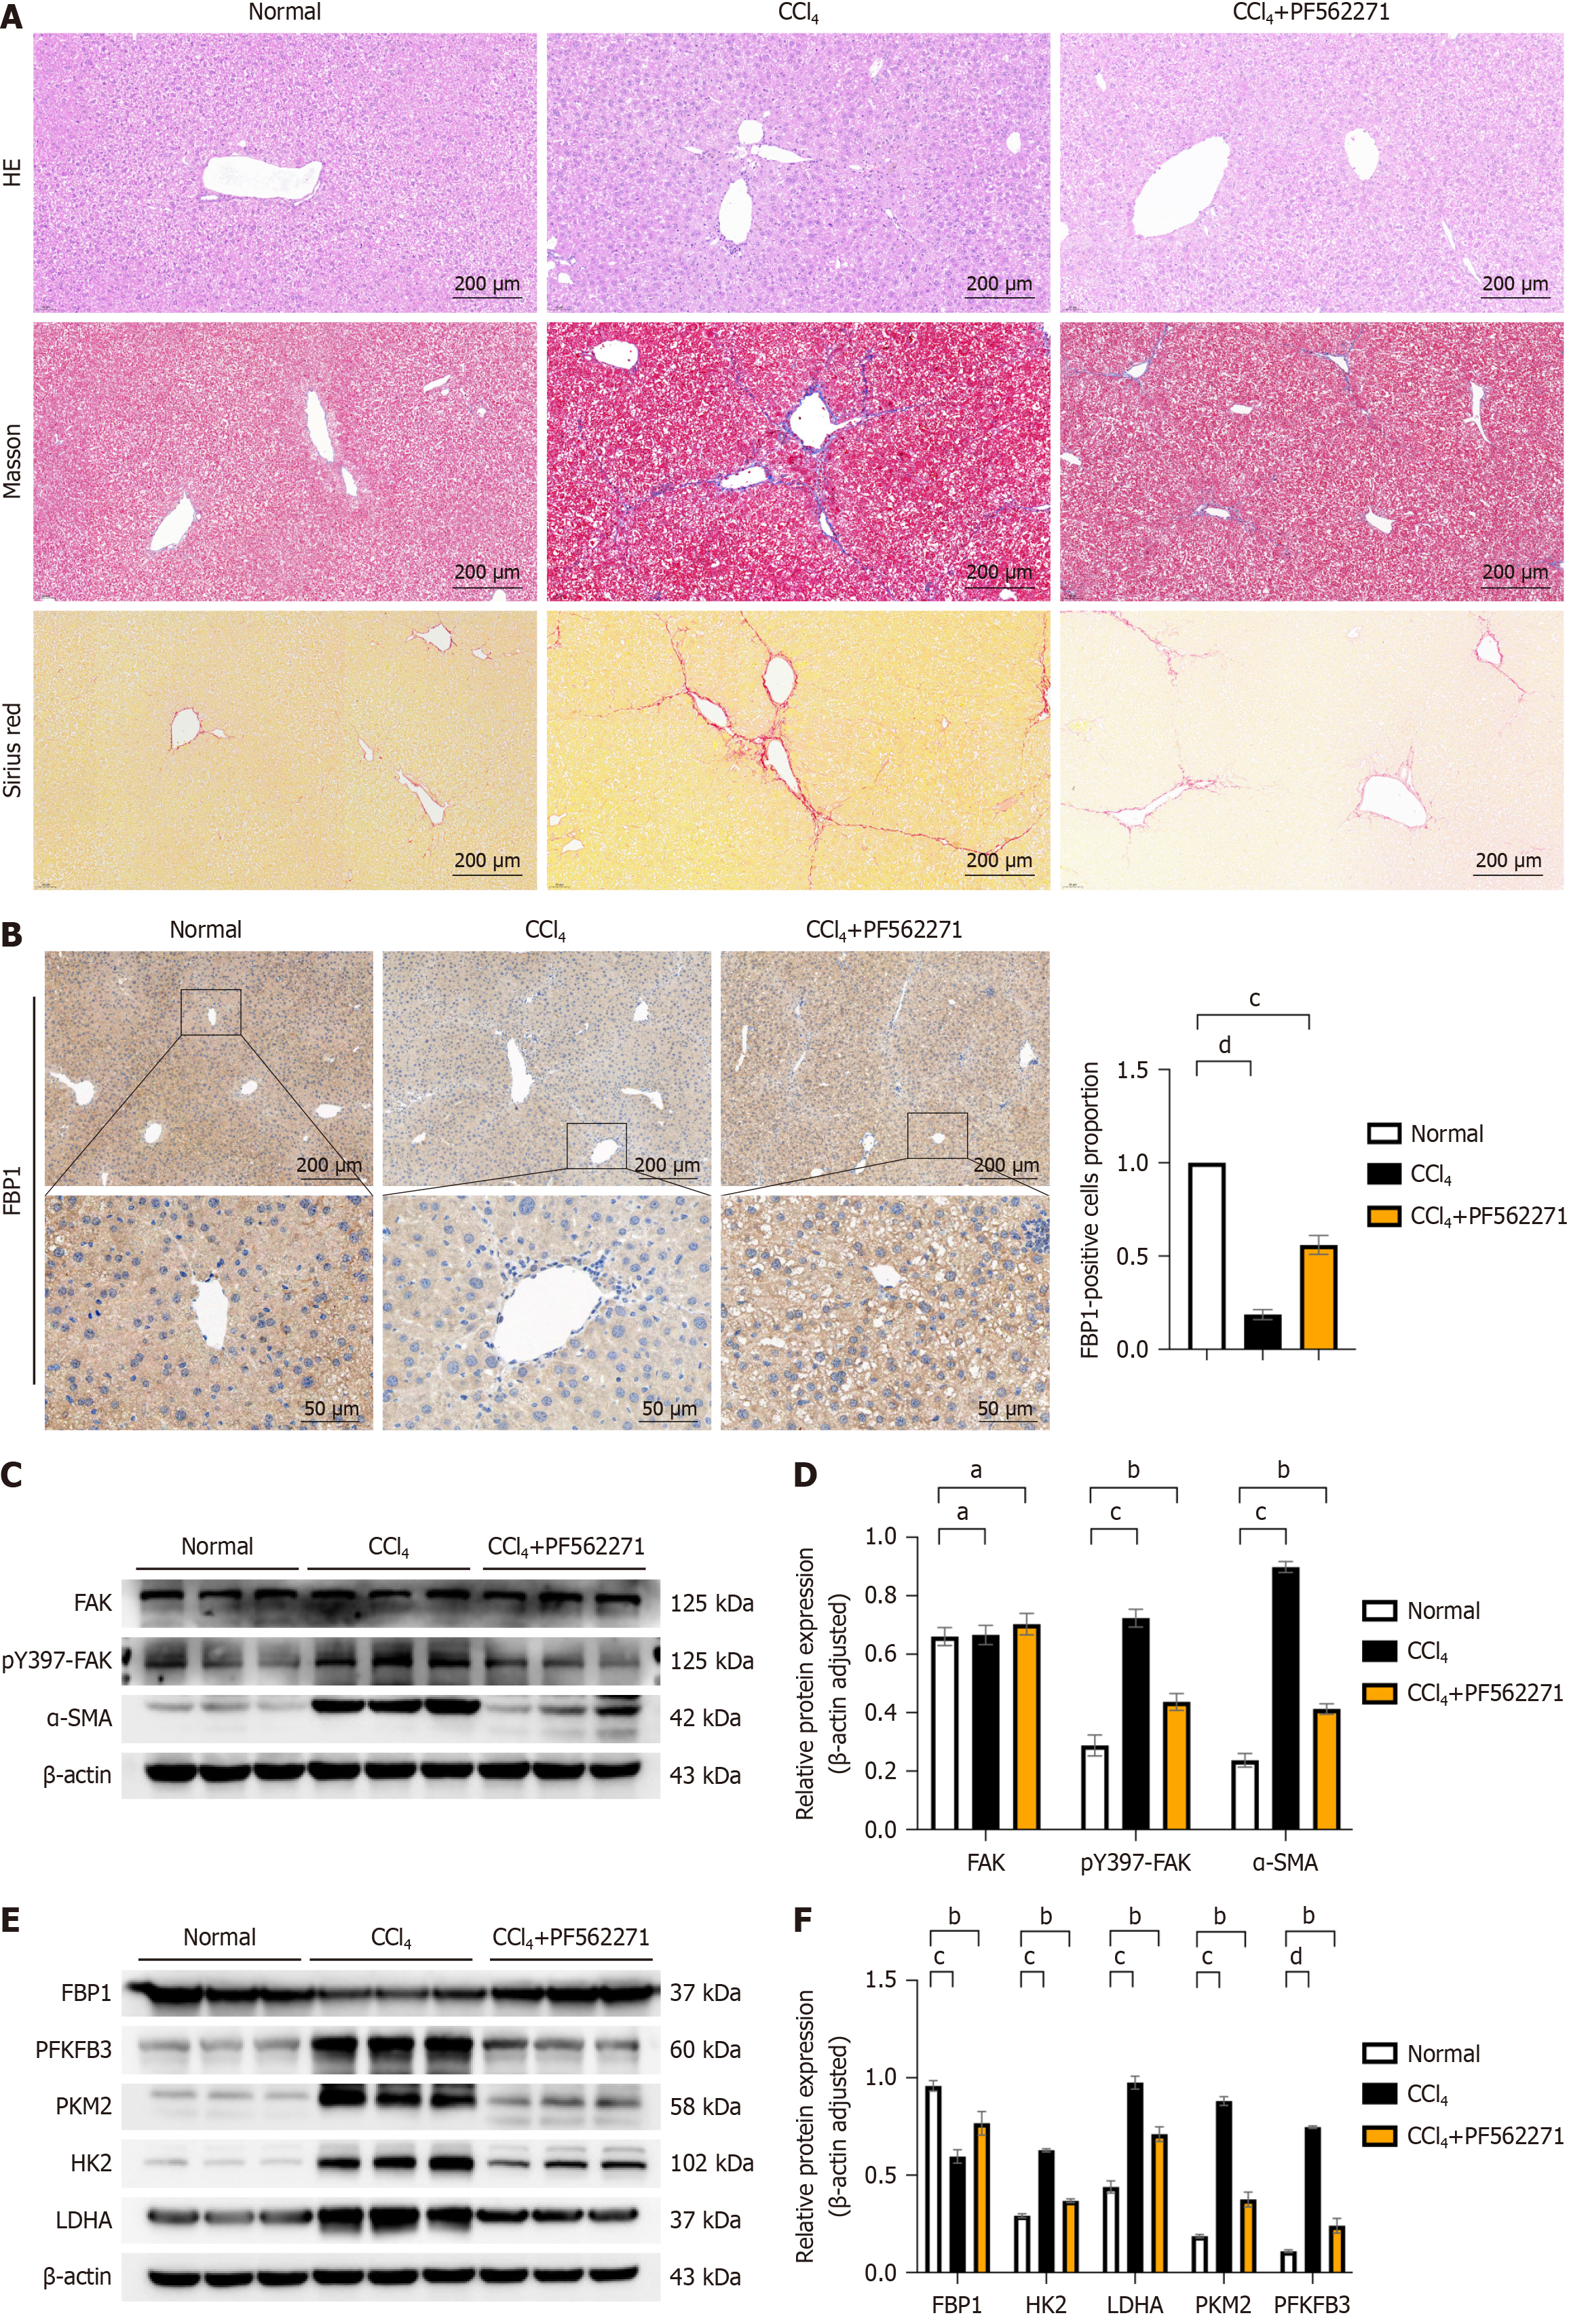
Figure 4 In mouse models of liver fibrosis, focal adhesion kinase inhibition ameliorates hepatic fibrosis.
A: Liver tissues from mice in each group were stained with hematoxylin and eosin (HE) to observe inflammatory cell infiltration, cellular morphology, and lobular architecture; Masson’s trichrome staining and Sirius red staining were performed to assess fiber deposition; B: Immunohistochemical analysis was conducted to detect the expression of fructose-1,6-bisphosphatase 1 (FBP1) protein in the livers of mice from each group, and the number of positive cells in each group was statistically analyzed. Scale bar: 200 μm, 50 μm; C: Western blot (WB) analysis was used to detect the expression of liver fibrosis marker alpha smooth muscle actin (α-SMA), as well as focal adhesion kinase (FAK) and phosphorylated FAK (p-FAK) proteins, with β-actin as the internal control; D: Grayscale value analysis was performed, and statistical significance relative to the normal group or carbon tetrachloride (CCl4) group was assessed; E: WB analysis was employed to detect the protein expression of aerobic glycolysis enzymes, including lactate dehydrogenase A (LDHA), hexokinase 2 (HK2), phosphofructo-2-kinase/fructose-2,6-biphosphatase 3 (PFKFB3), pyruvate kinase M2 (PKM2), and FBP1, with β-actin as the internal control; F: Grayscale value analysis was conducted, and statistical significance relative to the normal group or CCl4 group was evaluated. All data are from three independent samples. Data are represented as the mean ± SD. aNot significant; bP < 0.01, cP < 0.001, dP < 0.0001.
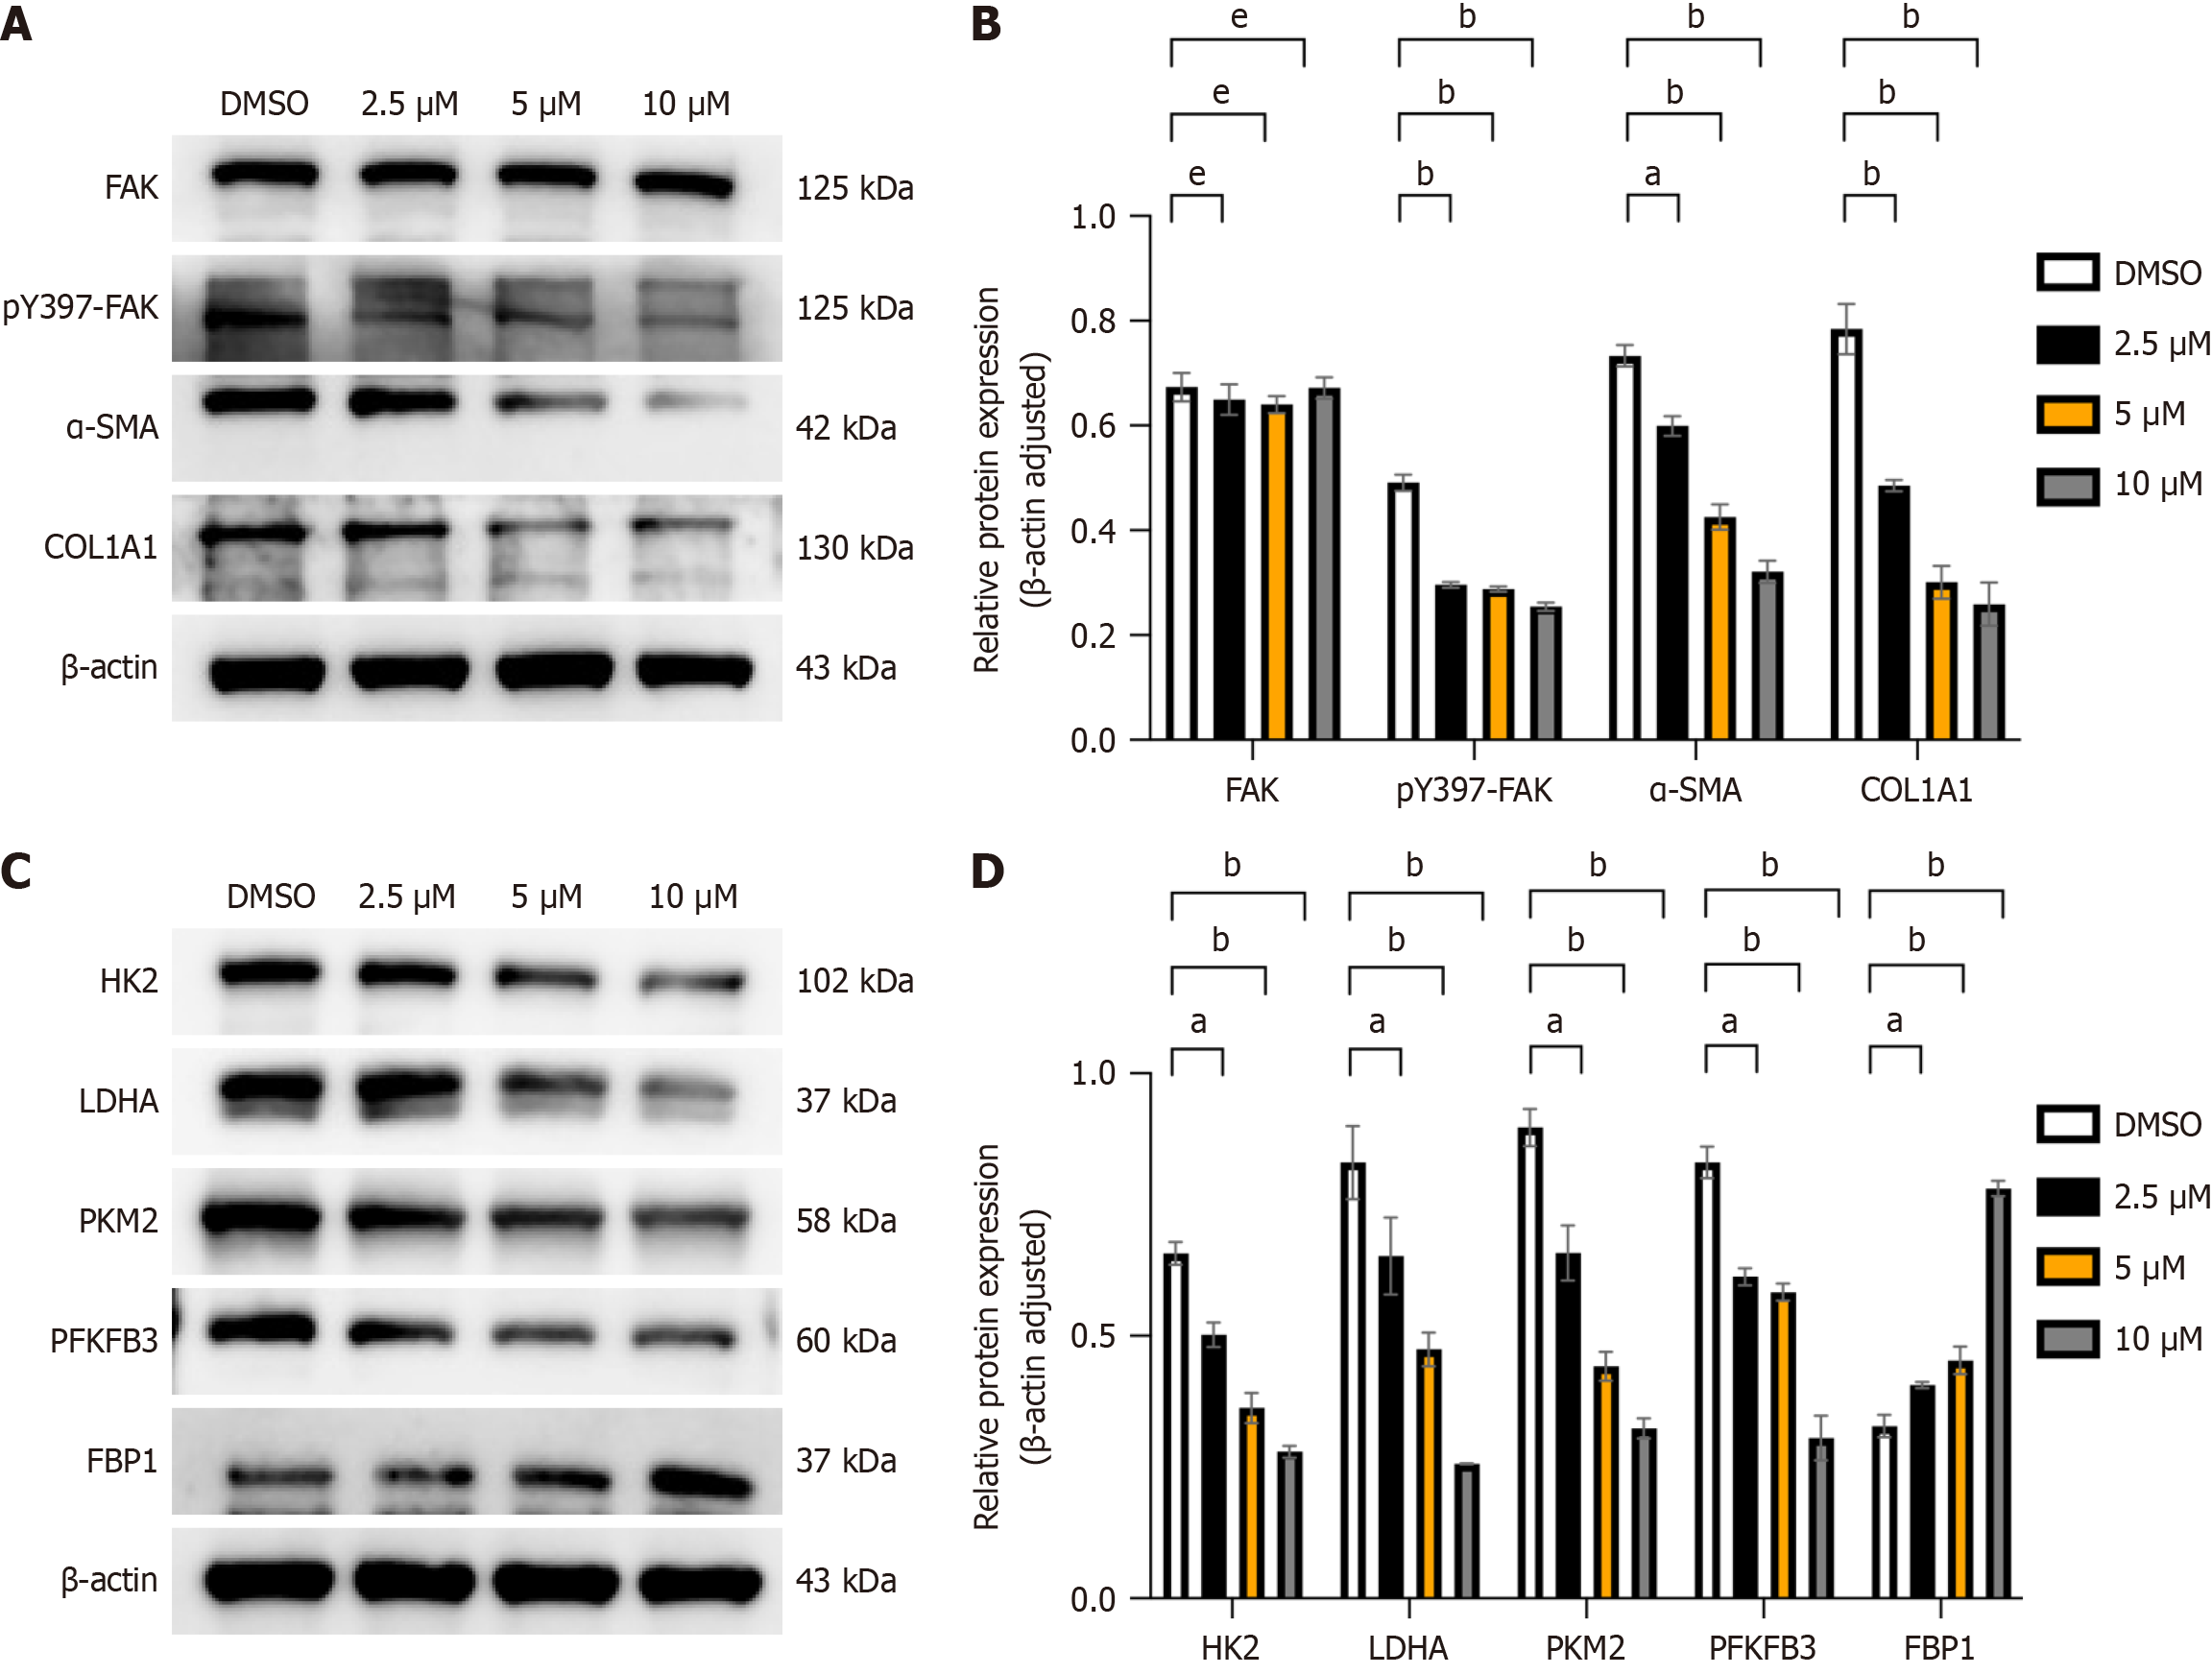
Figure 5 Focal adhesion kinase inhibitors can modulate the activation, migration, and aerobic glycolysis of hepatic stellate cells.
A: After adding focal adhesion kinase (FAK) inhibitor at different concentrations (2.5 μM, 5 μM, 10 μM), proteins were extracted, and Western blot (WB) analysis was performed to detect the expression of liver fibrosis markers collagen type 1, alpha 1 (COL1A1) and alpha smooth muscle actin (α-SMA), as well as FAK and phosphorylated FAK (p-FAK) proteins, with β-actin serving as the internal control; B: Grayscale value analysis was conducted, and statistical significance relative to the control (dimethyl sulfoxide [DMSO]) group was assessed; C: WB analysis was employed to detect the protein expression of lactate dehydrogenase A (LDHA), hexokinase 2 (HK2), phosphofructo-2-kinase/fructose-2,6-biphosphatase 3 (PFKFB3), pyruvate kinase M2 (PKM2), and fructose-1,6-bisphosphatase 1 (FBP1) in each group; D: Grayscale value analysis was performed for each proteome, and statistical significance relative to the control (DMSO) group was evaluated. All data are from three independent samples. Data are represented as the mean ± SD. aP < 0.05; bP < 0.01; cP < 0.001; dP < 0.0001; eNot significant.
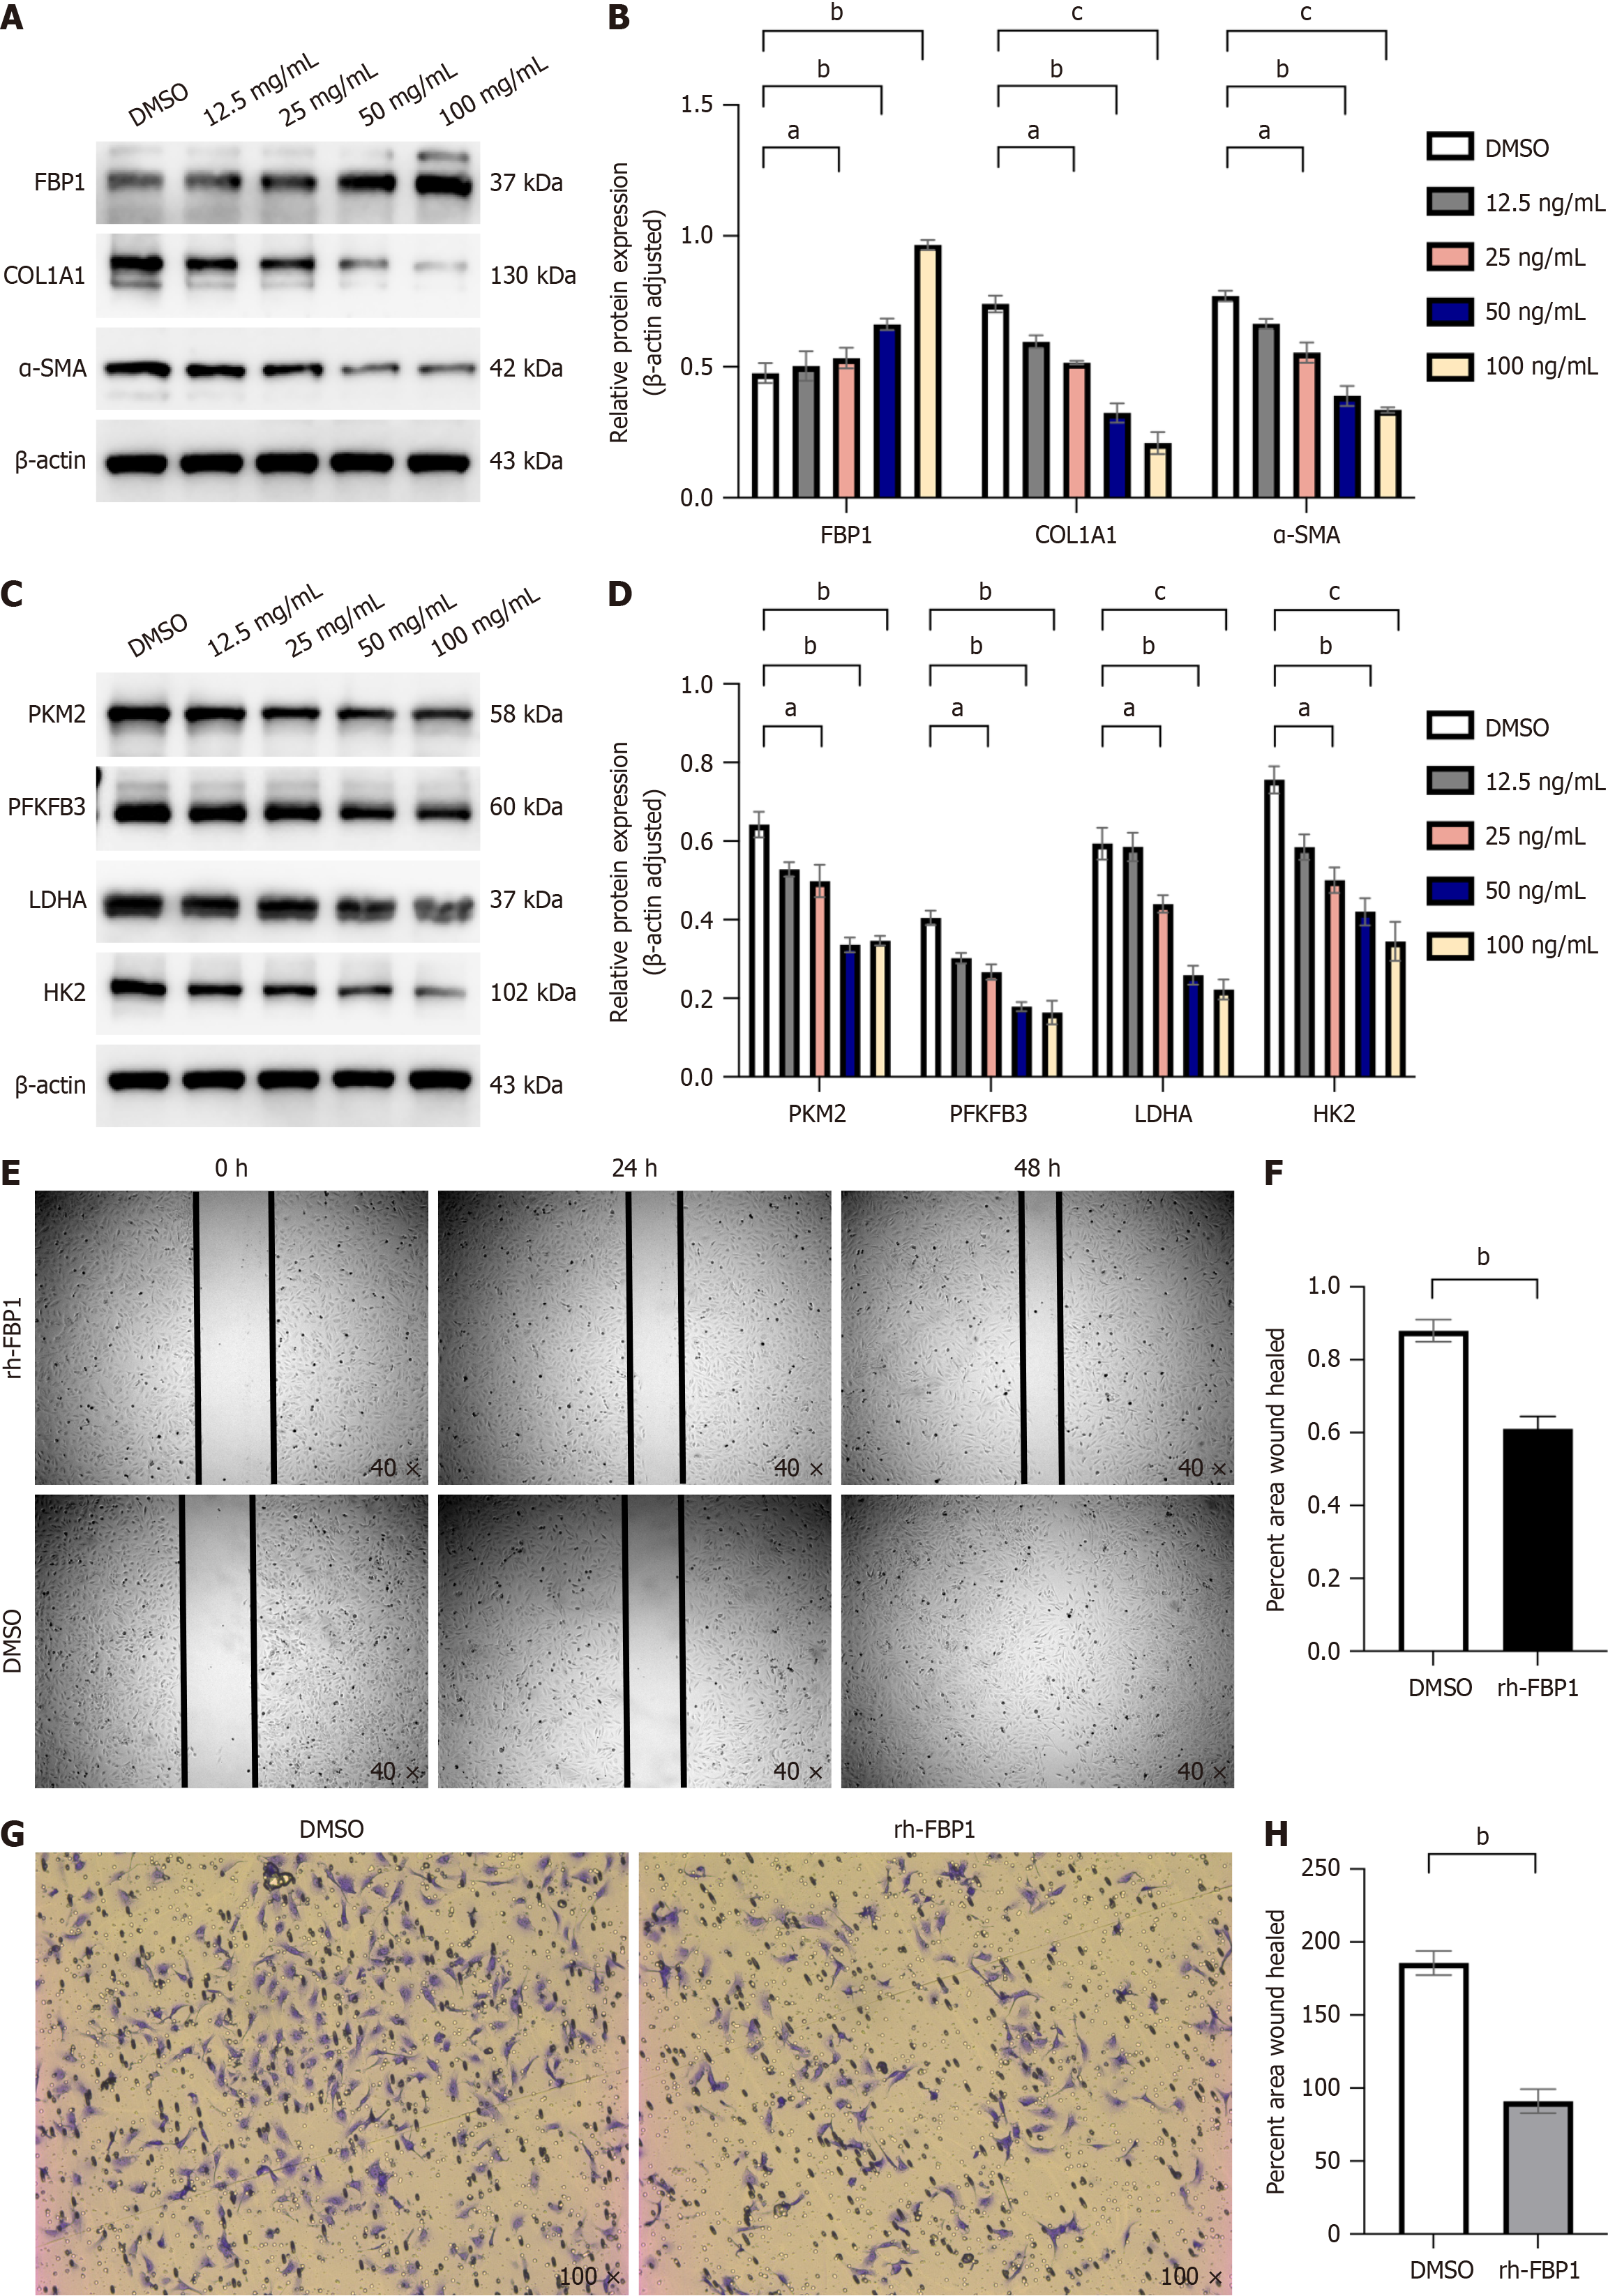
Figure 6 Fructose-1,6-bisphosphatase 1 recombinant protein (HY-P70275) inhibits the activation, migration, and aerobic glycolysis of hepatic stellate cells.
A: At concentrations of 12.5 ng/mL, 25 ng/mL, 50 ng/mL, and 100 ng/mL of fructose-1,6-bisphosphatase 1 (FBP1) recombinant protein, Western blot (WB) analysis was conducted to detect the expression of FBP1, collagen type 1, alpha 1 (COL1A1), and alpha smooth muscle actin (α-SMA) proteins, which are markers of liver fibrosis, with β-actin serving as the internal control; B: Grayscale value statistics were performed for each protein group, and statistical significance relative to the control (dimethyl sulfoxide [DMSO]) group was evaluated; C: At the same concentrations of FBP1 recombinant protein, WB analysis was used to detect the expression of aerobic glycolysis enzymes, including lactate dehydrogenase A (LDHA), hexokinase 2 (HK2), phosphofructo-2-kinase/fructose-2,6-biphosphatase 3 (PFKFB3), and pyruvate kinase M2 (PKM2), with β-actin as the internal control; D: Grayscale value analysis was conducted for each proteome, and statistical significance relative to the control (DMSO) group was evaluated; E: At a concentration of 100 ng/mL of FBP1 recombinant protein, the migration ability of LX-2 cells in each group was assessed using a wound healing assay; F: The cell migration area relative to the control (DMSO) group was evaluated; G: At a concentration of 100 ng/mL of FBP1 recombinant protein, the migration ability of LX-2 cells in each group was assessed using a Transwell migration assay, observed under a light microscope at 100 × magnification; H: The number of cells that migrated through the membrane of the Transwell chamber relative to the control (DMSO) group was assessed. All data are from three independent samples. Data are represented as the mean ± SD. aNot significant; bP < 0.01, cP < 0.001, dP < 0.0001.
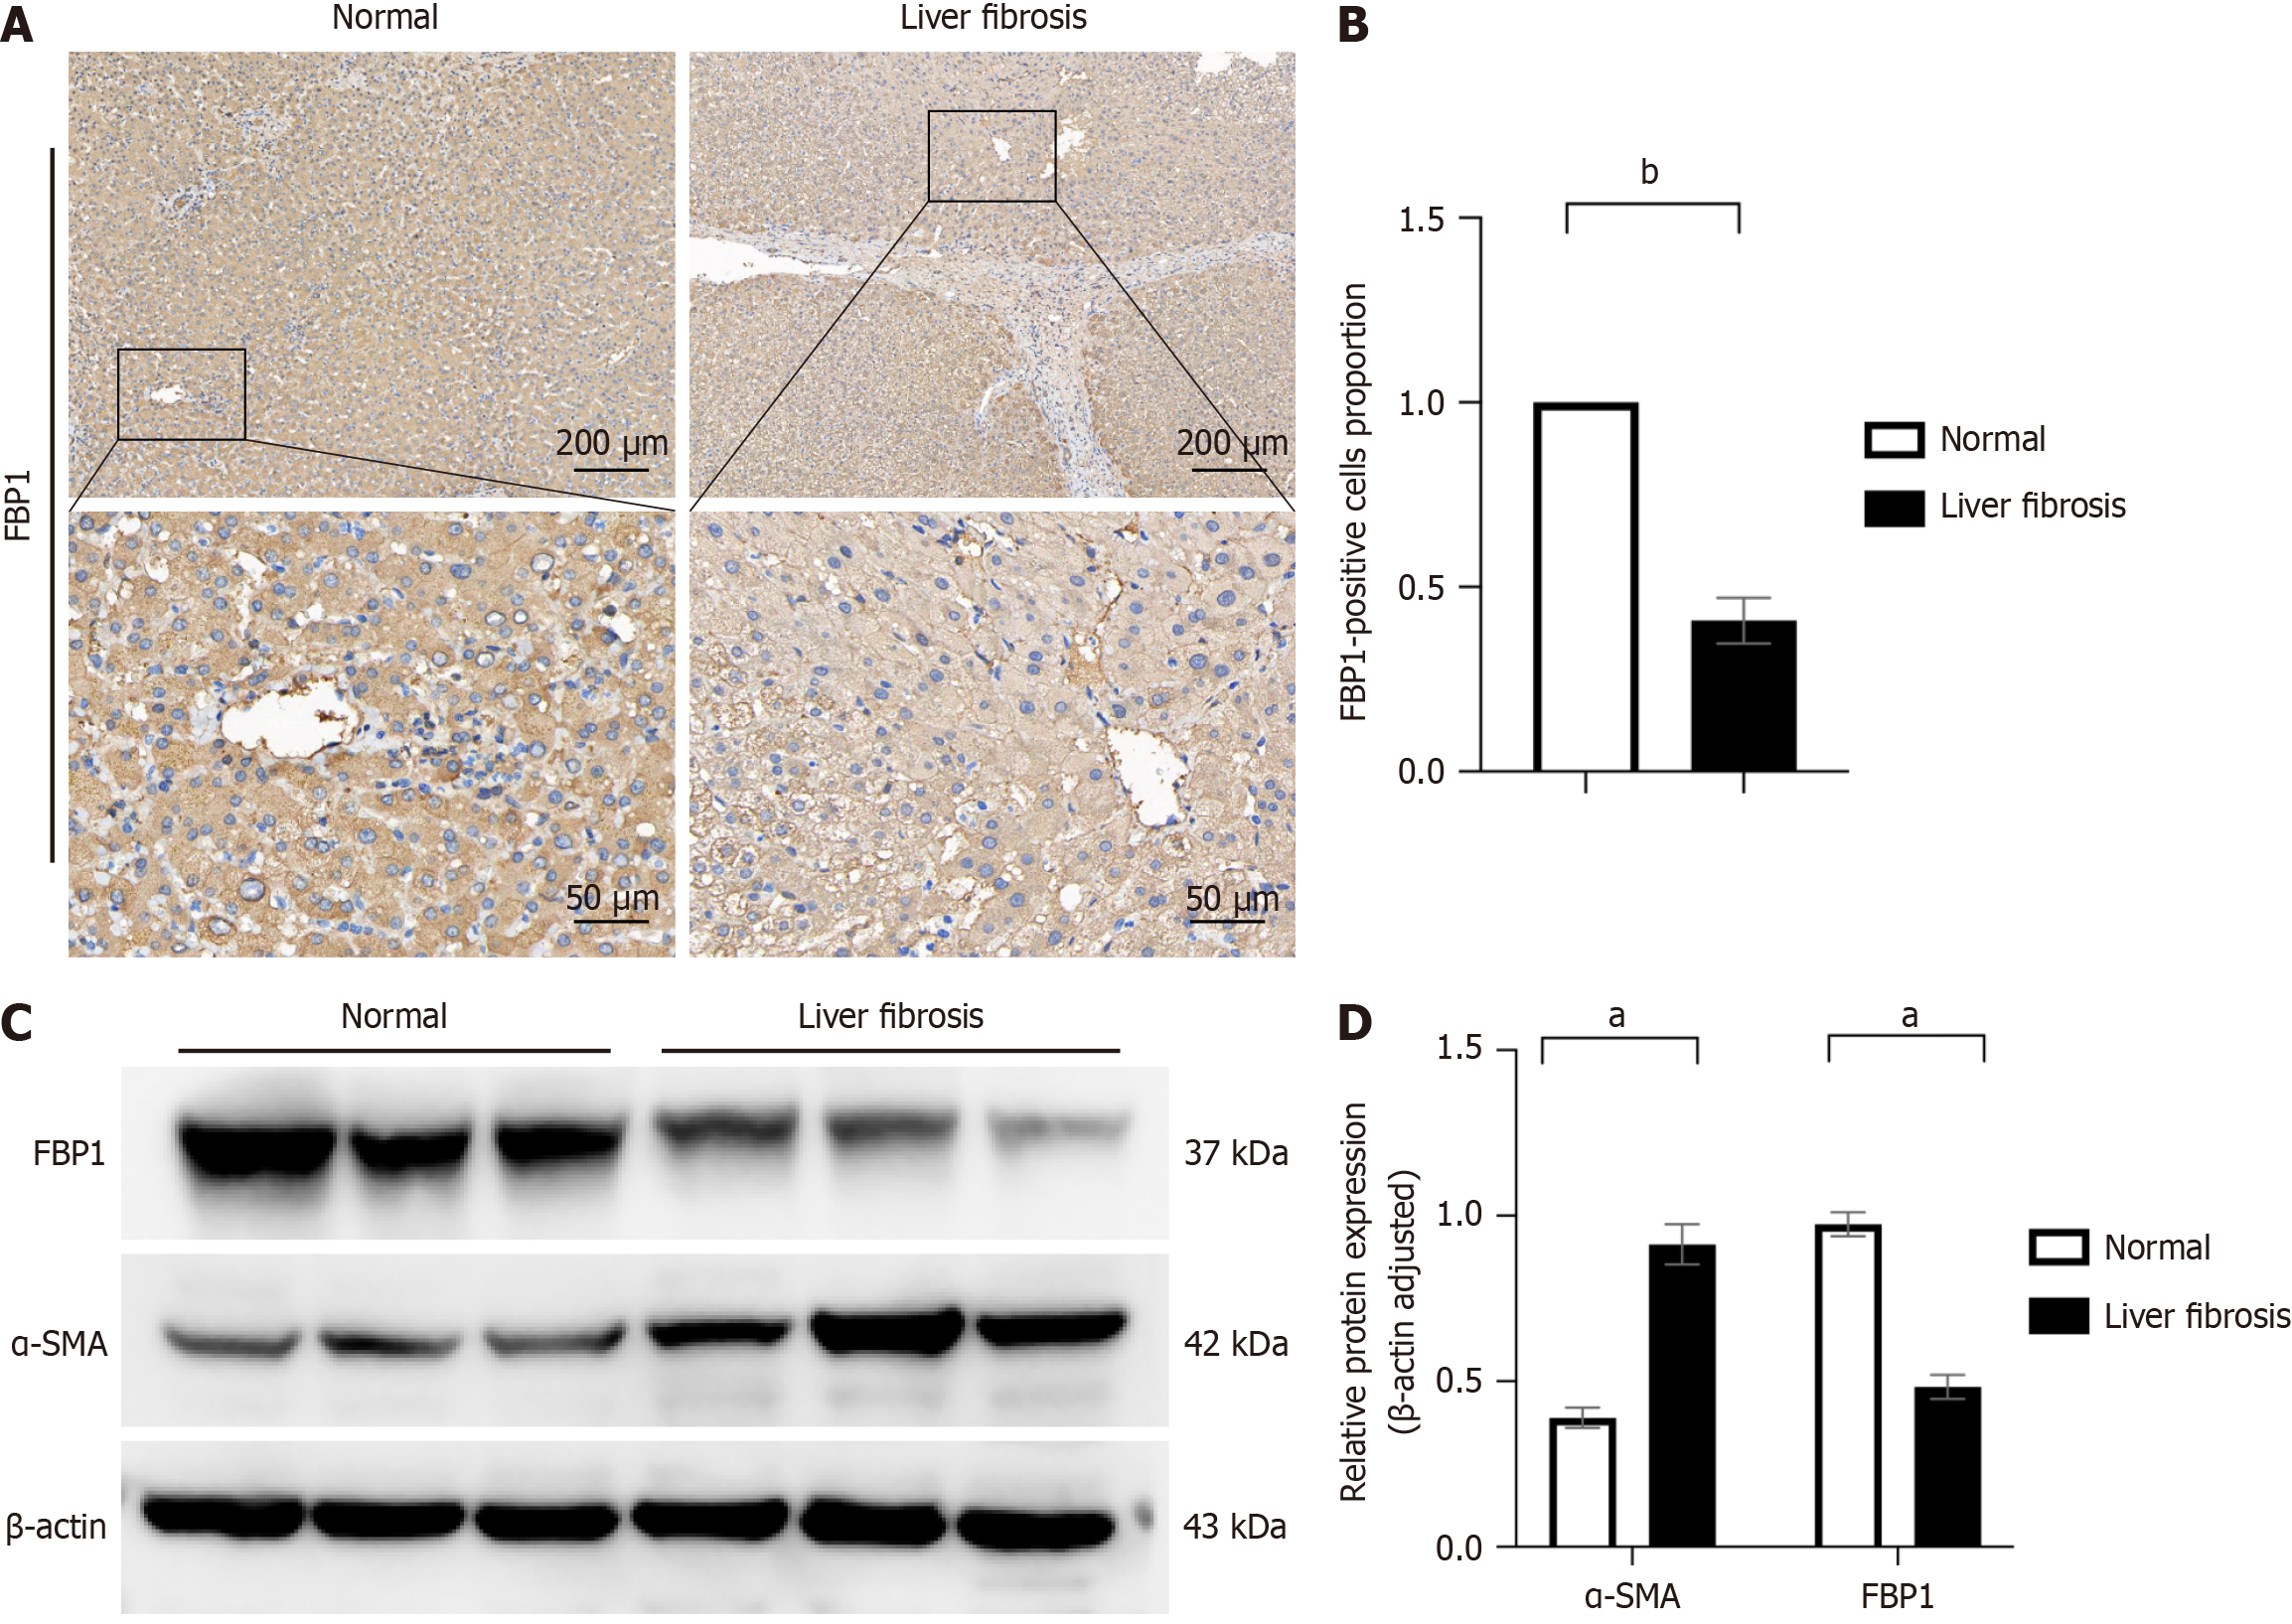
Figure 7 Decreased expression of fructose-1,6-bisphosphatase 1 in patients with liver fibrosis.
A: Hepatic fructose-1,6-bisphosphatase 1 (FBP1) expression was examined by immunohistochemistry in patients with liver fibrosis and controls; B: Immunohistochemical staining was statistically analyzed to quantify the number of positive cells in each group; C: Expression of hepatic fibrosis marker alpha smooth muscle actin (α-SMA) and FBP1 was detected by Western blot analysis in patients with liver fibrosis and controls; D: Grayscale values of the respective protein bands were analyzed, and statistical significance relative to the normal group was assessed. All data are from three independent samples. Data are represented as the mean ± SD. aP < 0.05; bP < 0.001.
- Citation: Wu HY, Han L, Ran T, Sun Y, Zhang QX, Huang T, Zou GL, Zhang Y, Zhou YM, Lin GY, Chen SJ, Wang JL, Pan C, Lu F, Pu HF, Zhao XK. FBP1 as a key regulator of focal adhesion kinase-mediated hepatic stellate cell activation: Multi-omics and experimental validation. World J Gastroenterol 2025; 31(28): 107361
- URL: https://www.wjgnet.com/1007-9327/full/v31/i28/107361.htm
- DOI: https://dx.doi.org/10.3748/wjg.v31.i28.107361


