©The Author(s) 2025.
World J Gastroenterol. Jul 21, 2025; 31(27): 109459
Published online Jul 21, 2025. doi: 10.3748/wjg.v31.i27.109459
Published online Jul 21, 2025. doi: 10.3748/wjg.v31.i27.109459
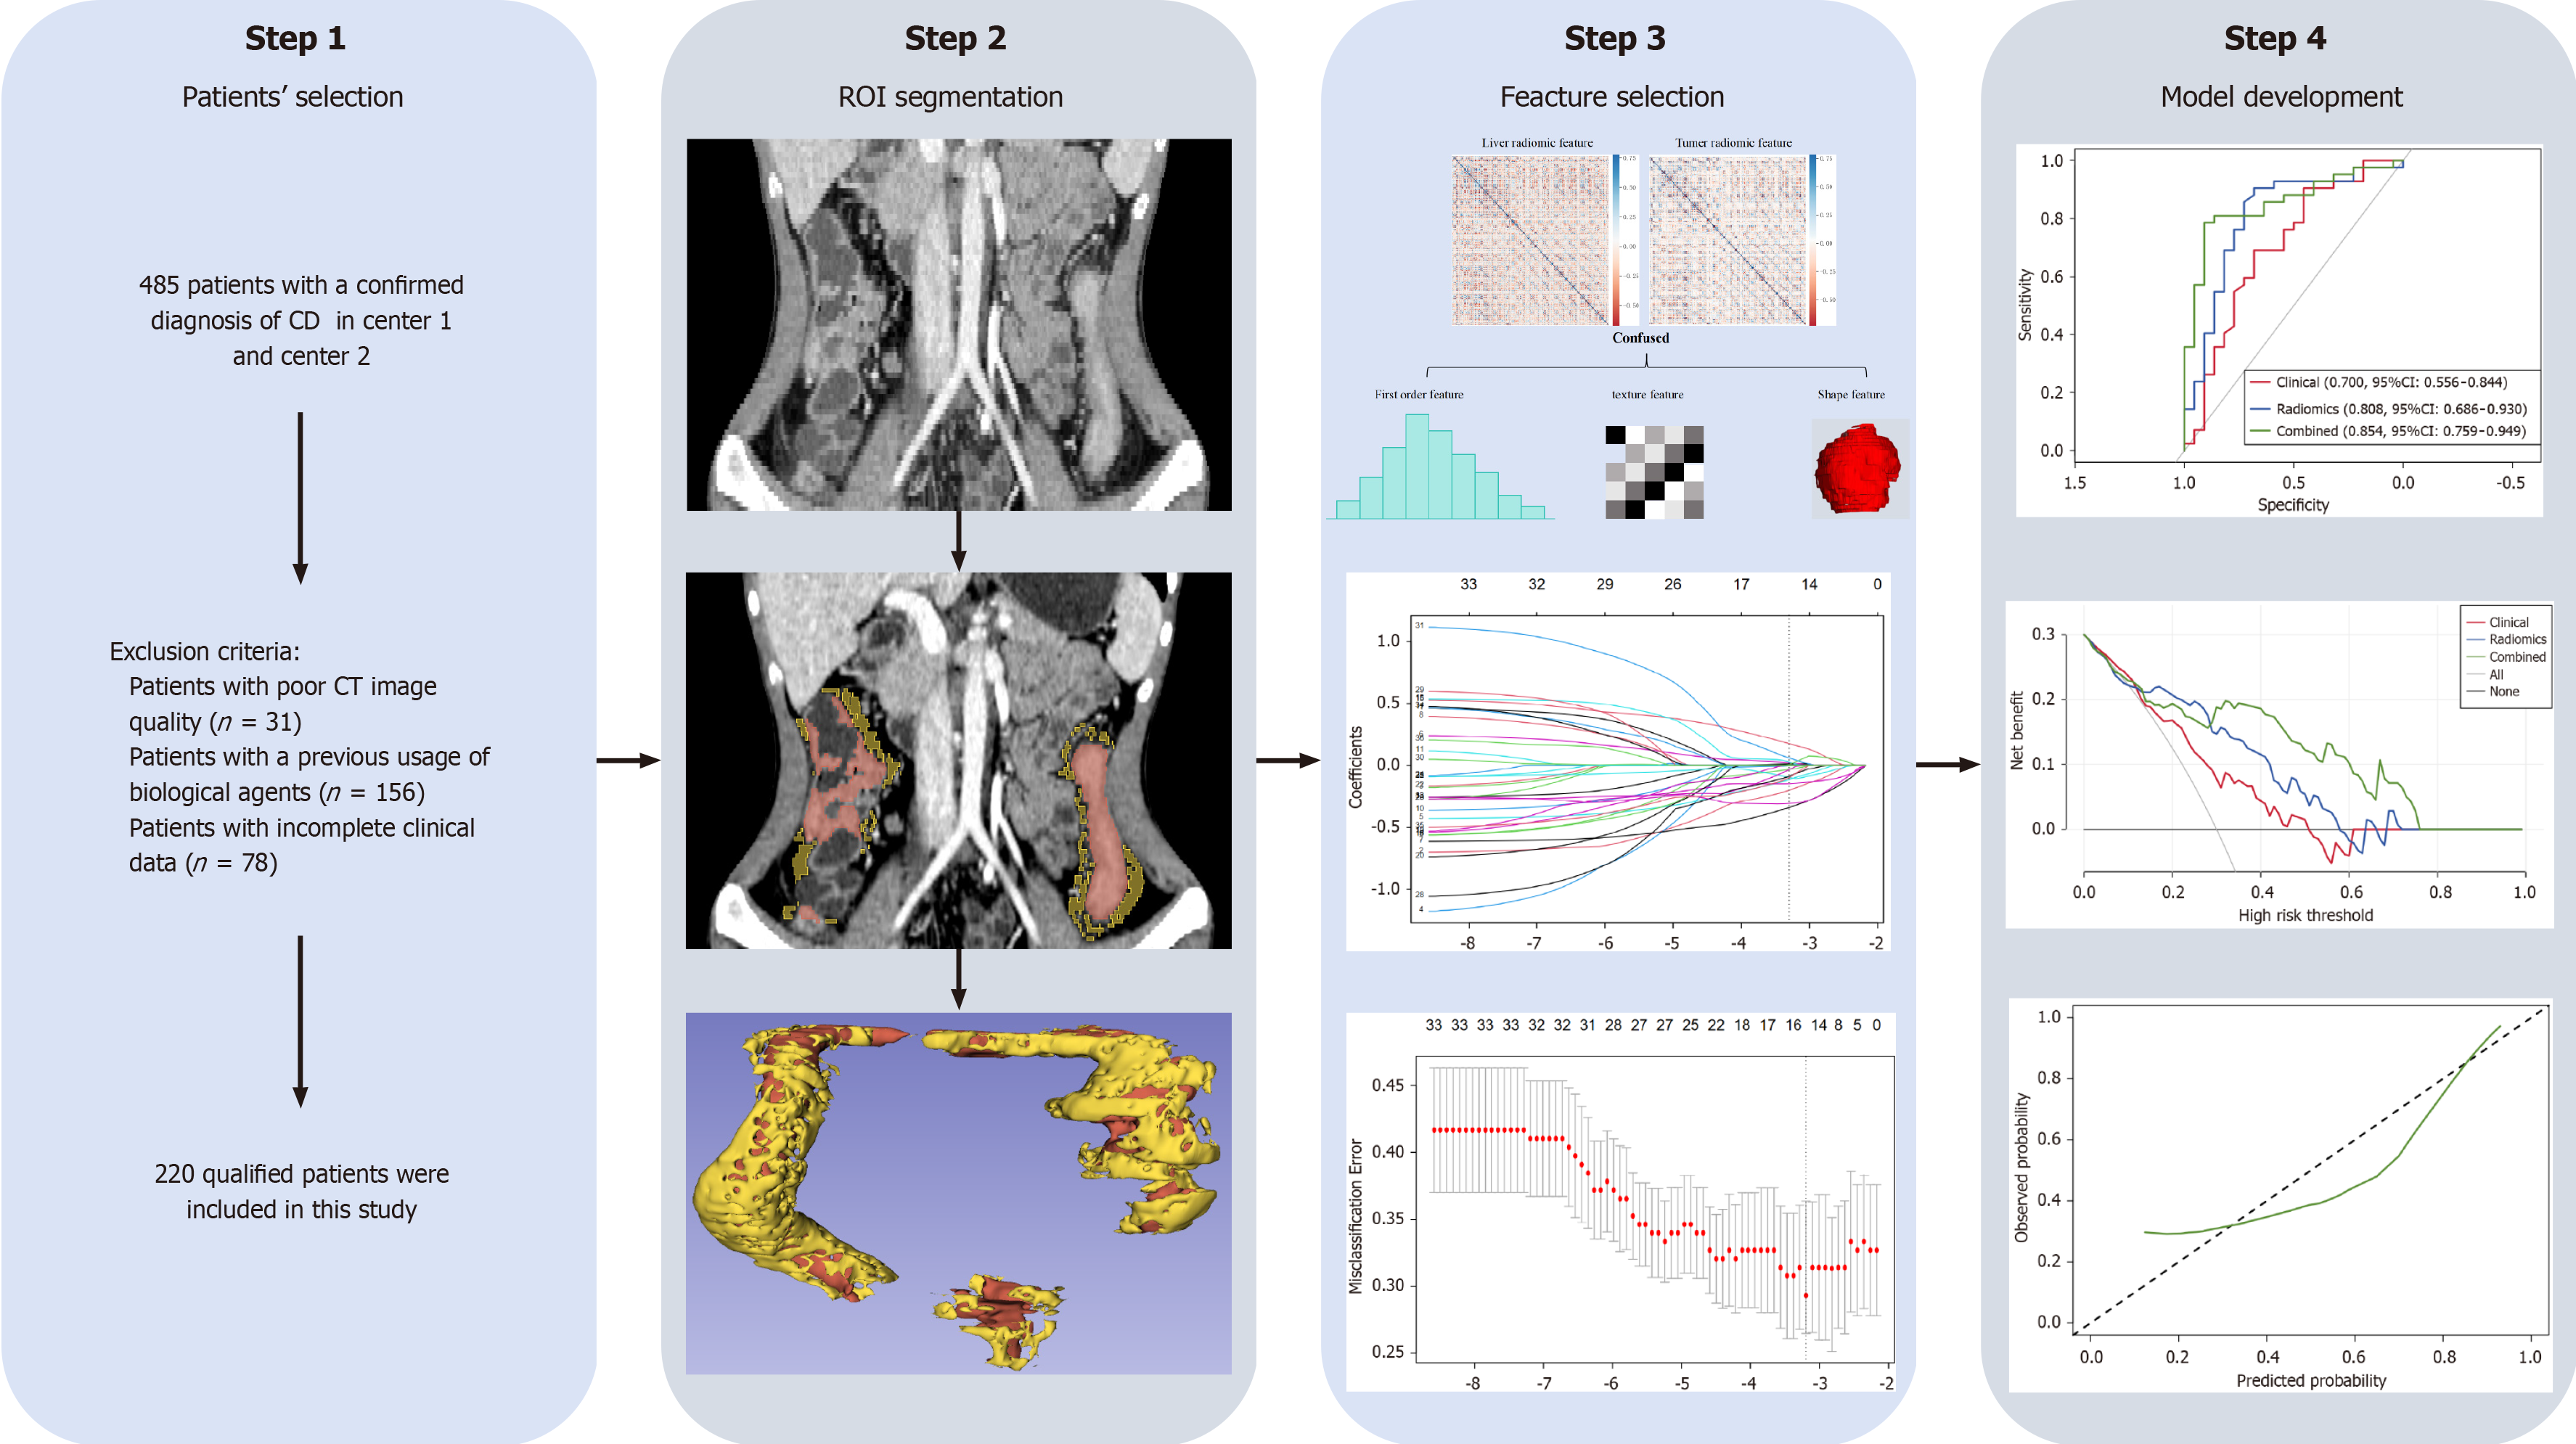
Figure 1 Flowchart of this study.
CD: Crohn's disease; CT: Computed tomography; ROI: Region of interest.
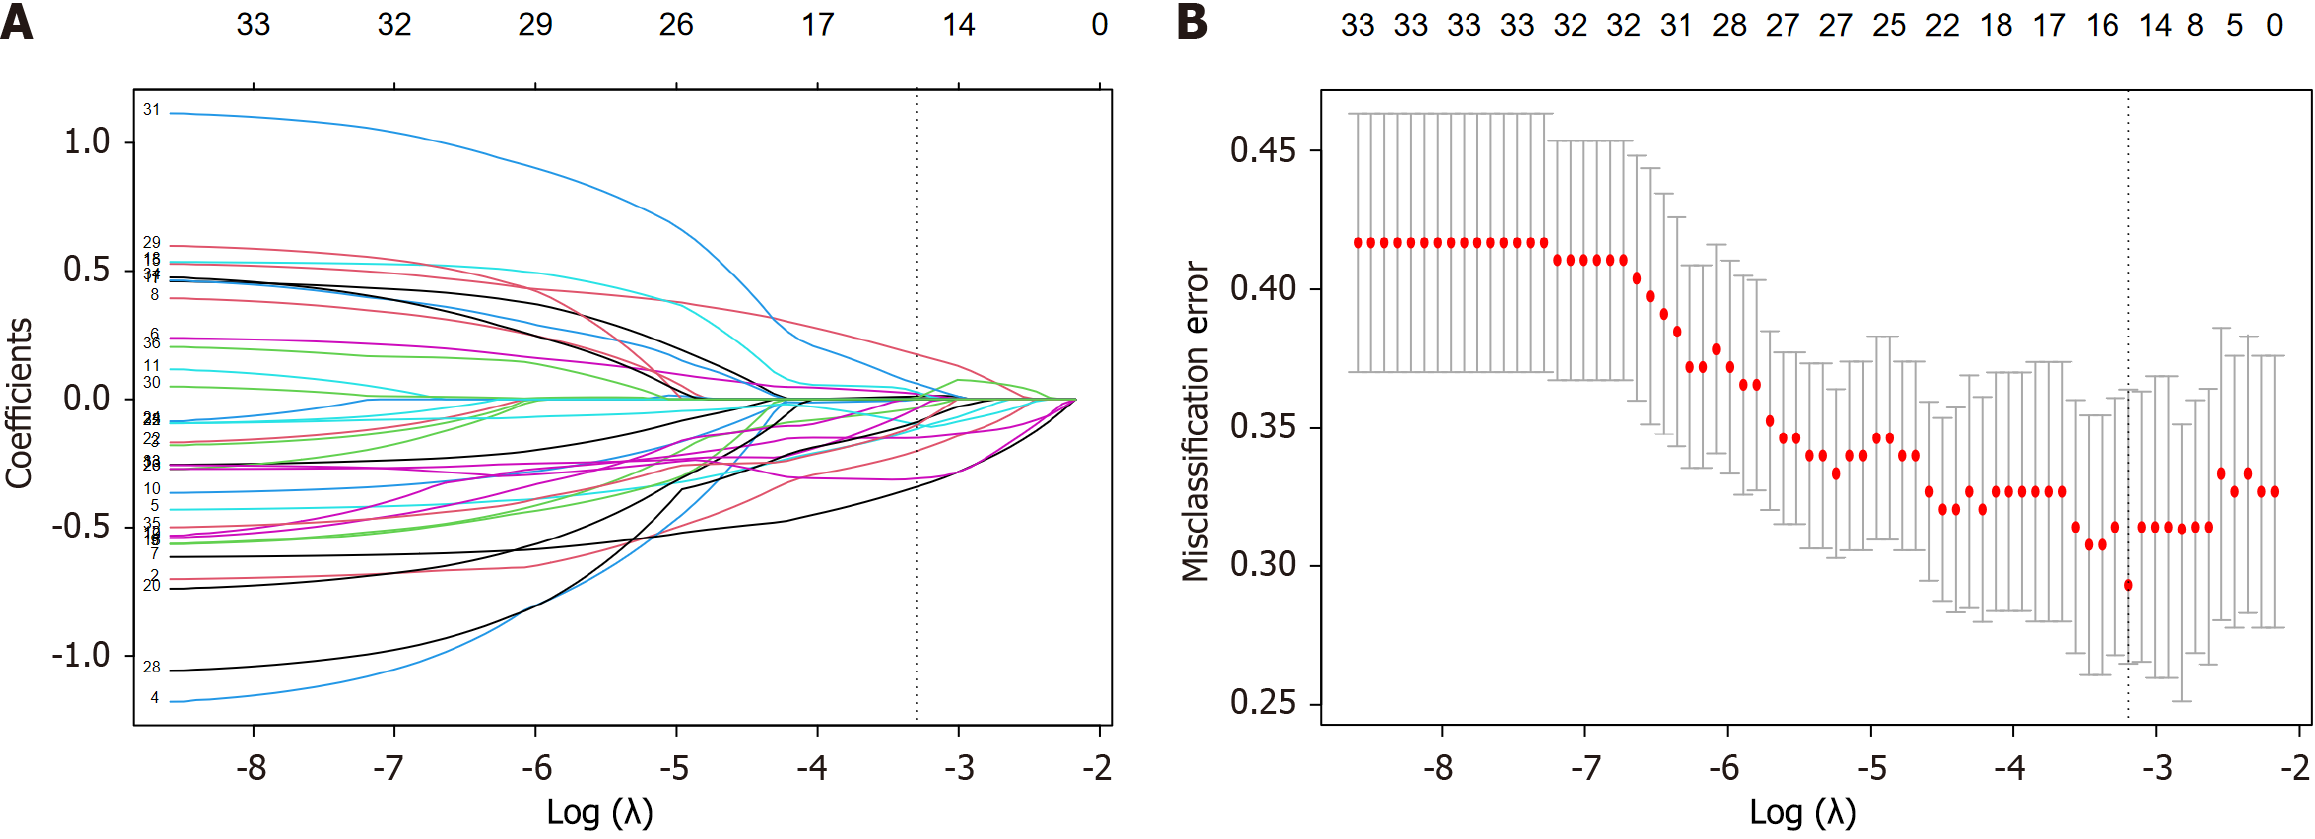
Figure 2 Least absolute shrinkage and selection operator regression feature selection.
A: Least absolute shrinkage and selection operator path; B: 10-fold cross-validation curve.
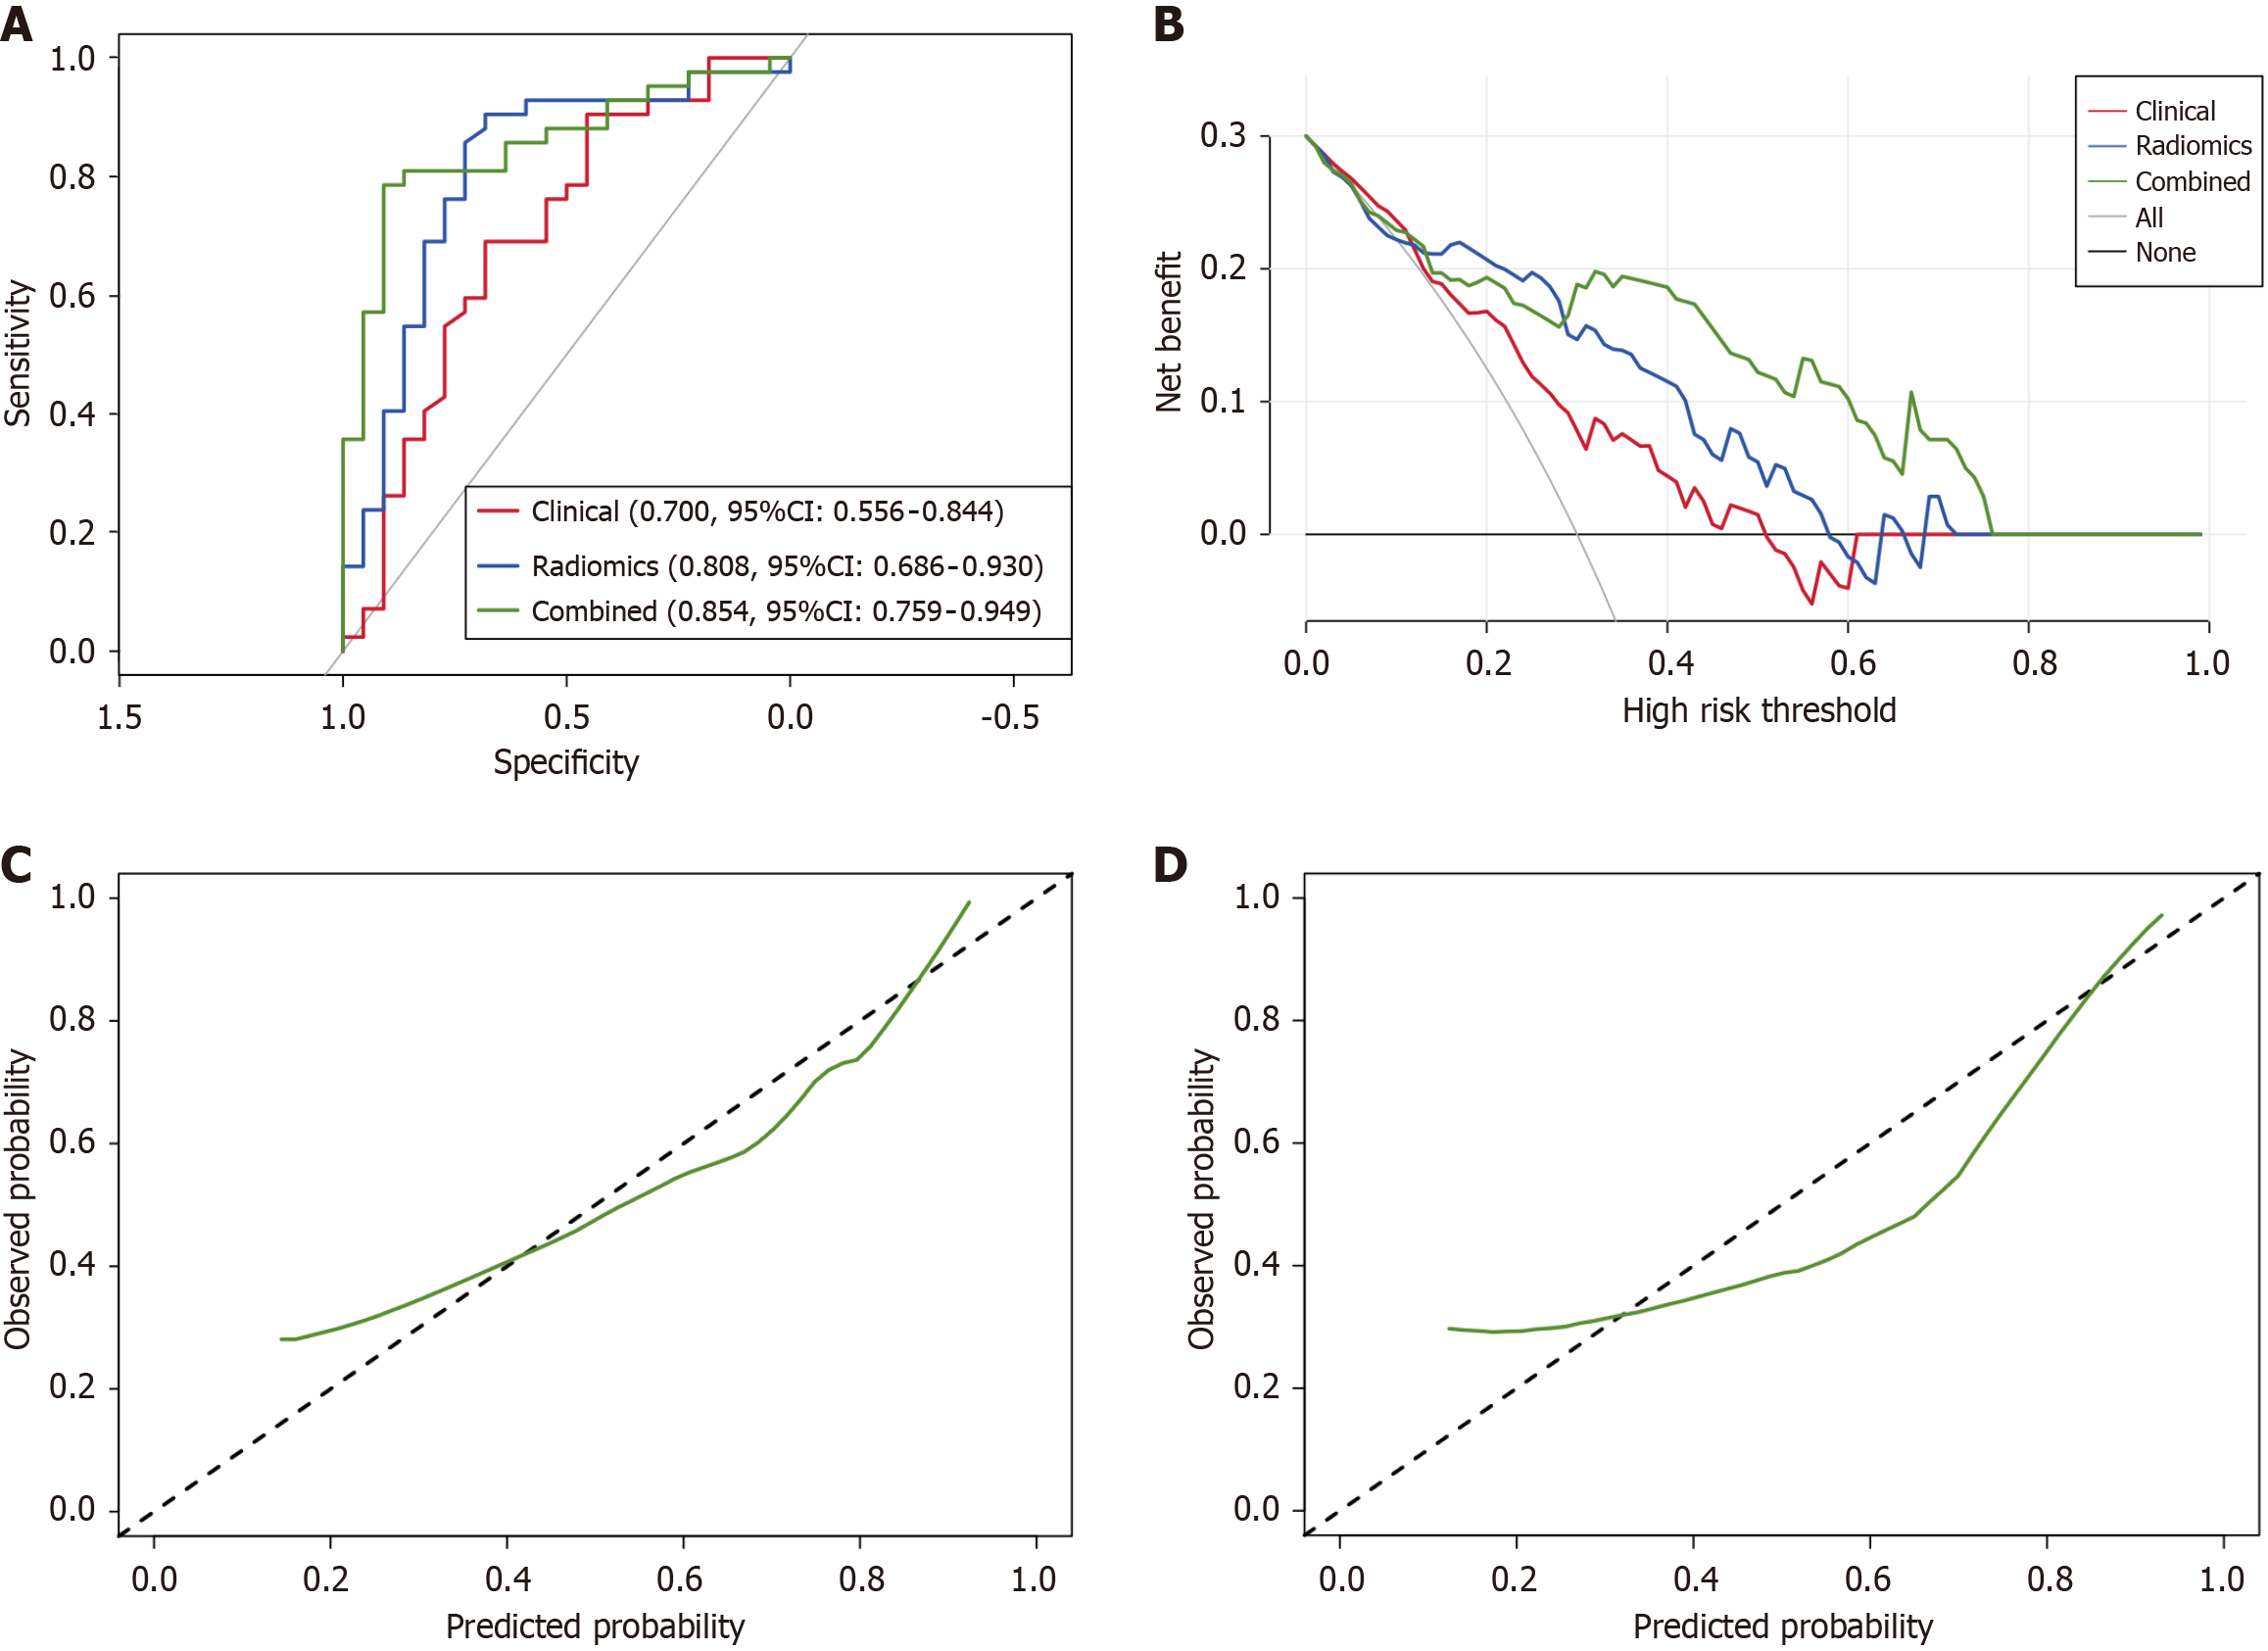
Figure 3 Model performance.
A: Receiver operating characteristic of the three predictive models in the validation cohort; B: Decision curve analysis of the three predictive models in the validation cohort; C: Calibration curve of the combined model in the training cohort; D: Calibration curve of the combined model in the validation cohort.
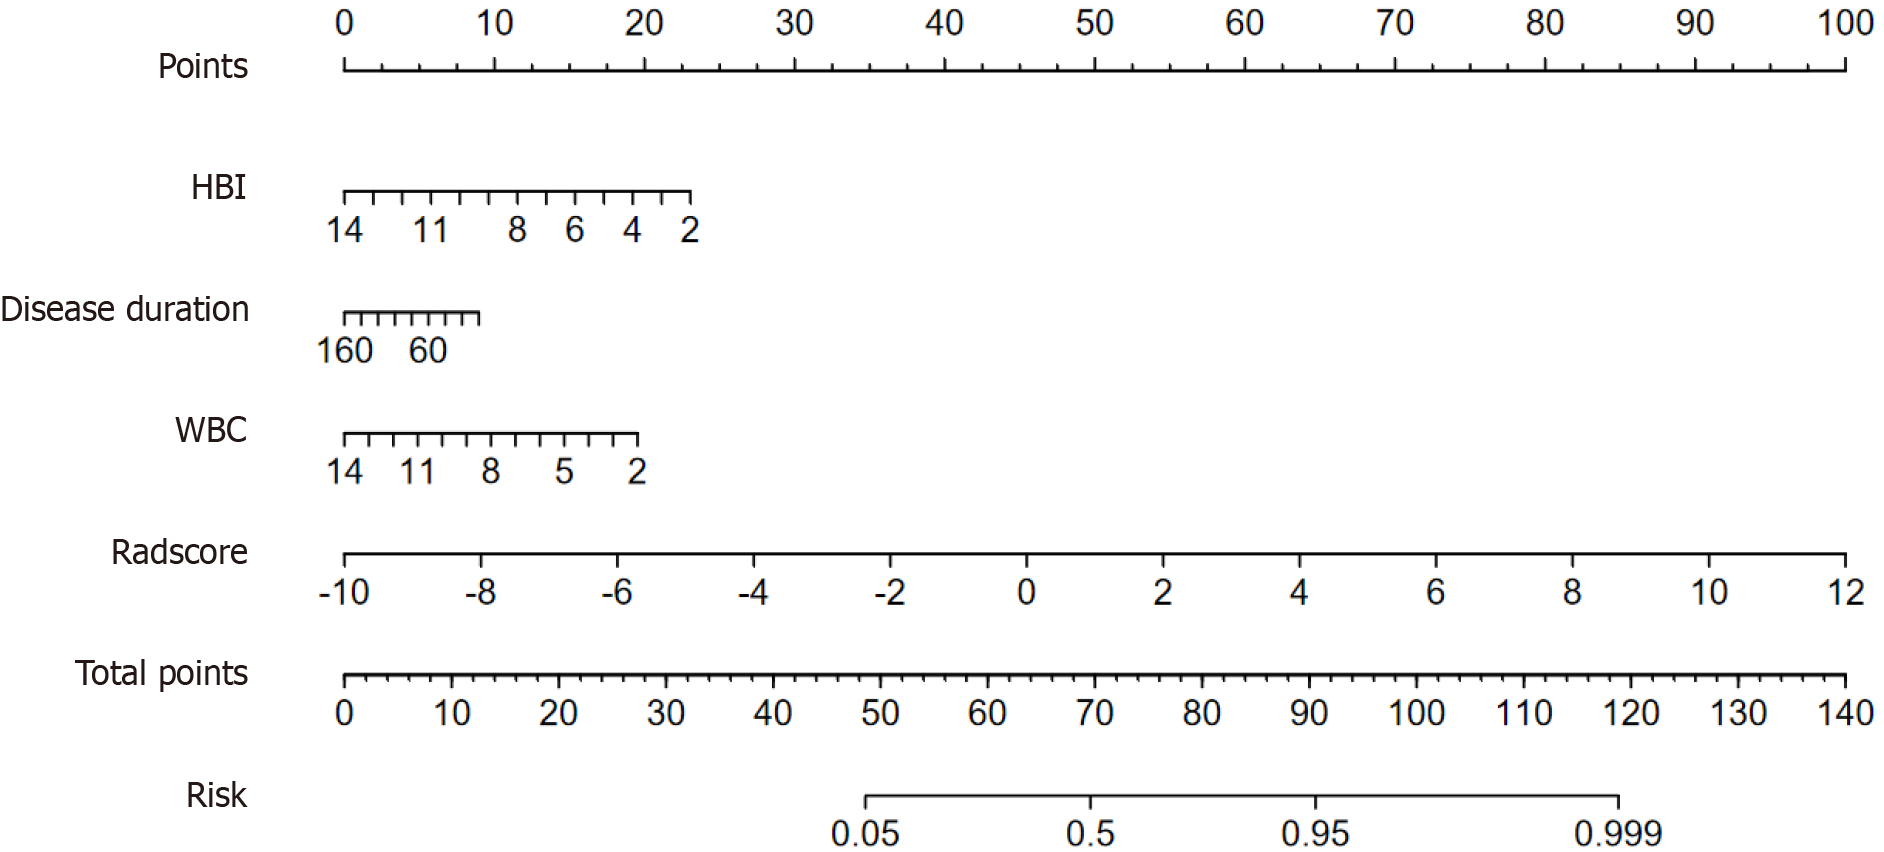
Figure 4 Clinical-Radiomics nomogram.
HBI: Harvey-Bradshaw Index; WBC: White blood cell.
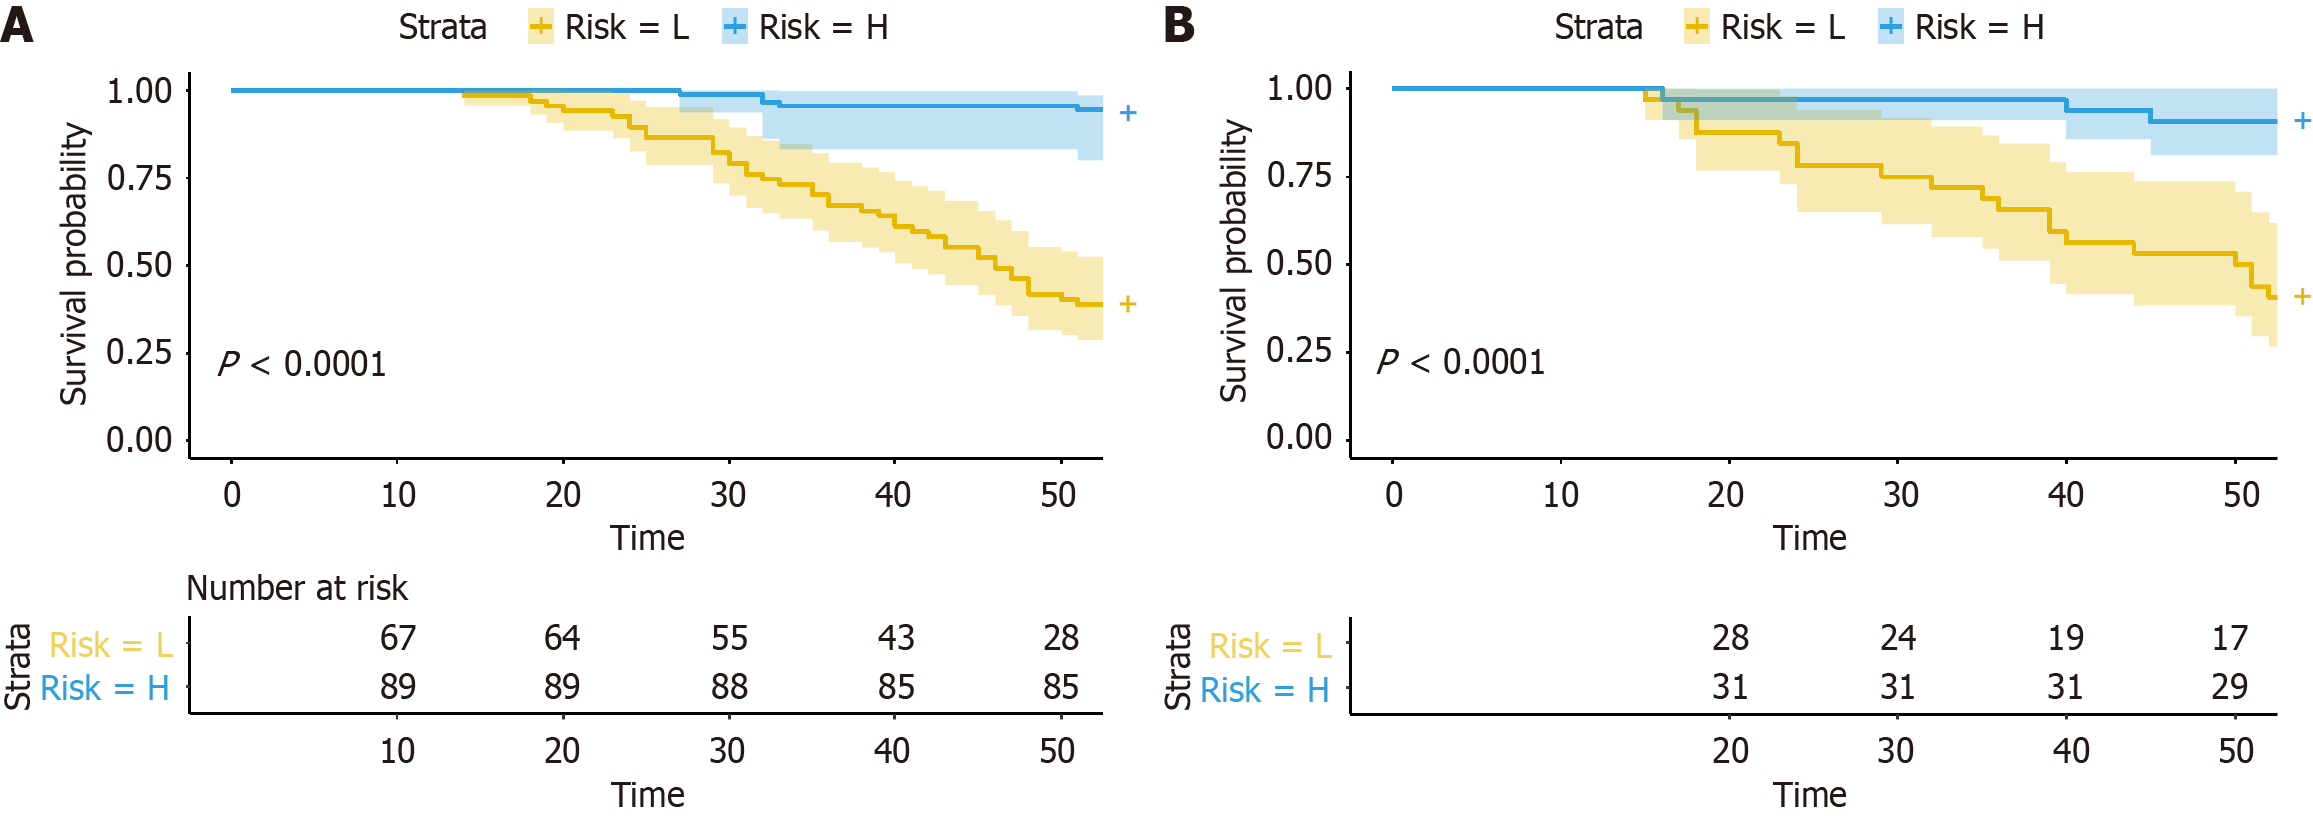
Figure 5 Kaplan-Meier progression-free remission curves of patients at different risks stratified by the predictive probability of the combined nomogram.
A: Training cohort; B: Validation cohort.
- Citation: Li S, Zhu C, Tong L, Zheng XM, Rong C, Gao YK, Yuan DC, Wu XW. Correlation between radiomic features of Crohn's disease and secondary loss of response to infliximab. World J Gastroenterol 2025; 31(27): 109459
- URL: https://www.wjgnet.com/1007-9327/full/v31/i27/109459.htm
- DOI: https://dx.doi.org/10.3748/wjg.v31.i27.109459


