©The Author(s) 2025.
World J Gastroenterol. Jul 14, 2025; 31(26): 108662
Published online Jul 14, 2025. doi: 10.3748/wjg.v31.i26.108662
Published online Jul 14, 2025. doi: 10.3748/wjg.v31.i26.108662
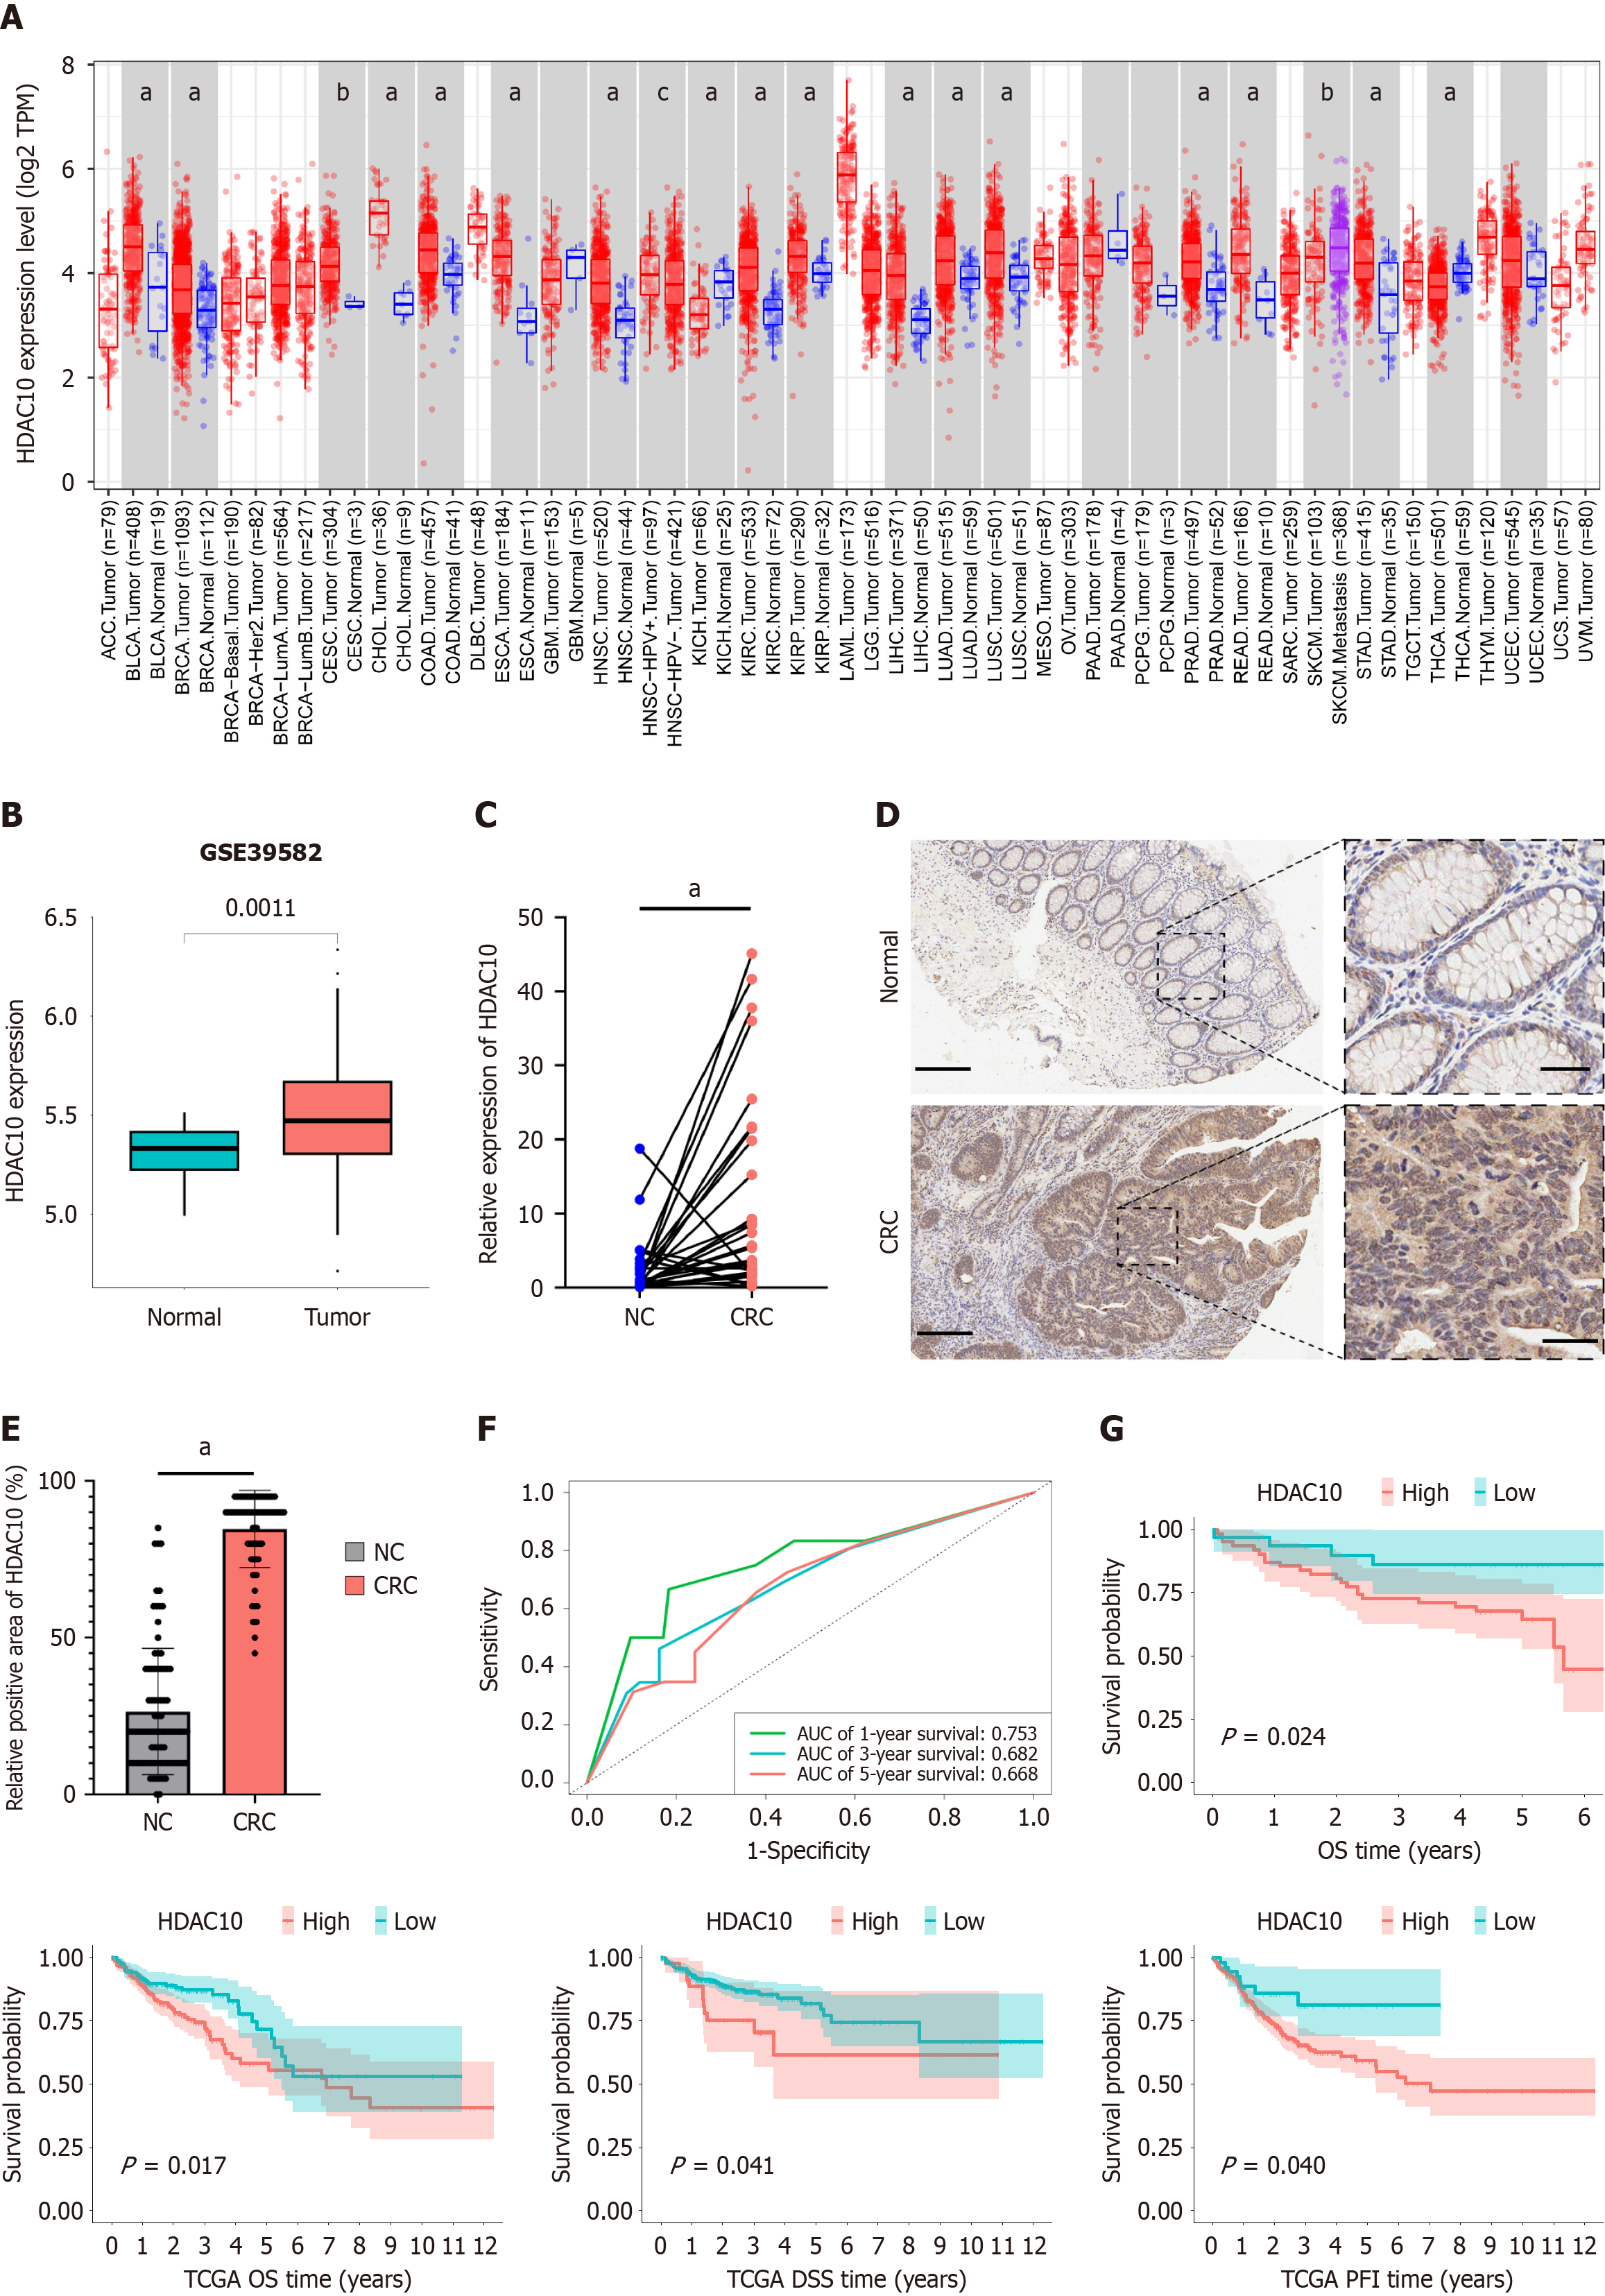
Figure 1 Higher histone deacetylases 10 expression in colorectal cancer and was associated with poor prognosis.
A: Higher histone deacetylases 10 (HDAC10) expression in normal and tumor tissues in pan-cancer data from the TIMER website; B: HDAC10 expression analysis in paired colorectal cancer (CRC) samples from TCGA-COAD showed high expression in tumor; C: Quantitative real-time polymerase chain reaction (qRT-PCR) analysis from thirty patients tissues indicated HDAC10 upregulated in CRC; D: Representative cases in normal tissues and CRC showed high HDAC10 expression in CRC. Scale bar, 100 μm and 20 μm; E: Quantification of immunohistochemistry (IHC) positive areas in normal and CRC indicated high levels of HDAC10 in CRC; F: Receiver operating characteristic curve based on HDAC10 for predicting 1-, 3- , 5-year overall survival; G: Kaplan-Meier survival analysis of HDAC10 expression in CRC tissue microarray and TCGA-COAD datasets showed patients with expressing higher levels of HDAC10 had poor prognosis. aP < 0.001, bP < 0.01, cP < 0.05 vs the NC group. The statistical power for comparing the rates between NC group and CRC group in qRT-PCR and IHC experiments using PASS software, and the results were 71% and 73%, respectively. CRC: Colorectal cancer; OS: Overall survival; TCGA: The Cancer Genome Atlas; HDAC10: Histone deacetylases 10; AUC: Area under the curve.
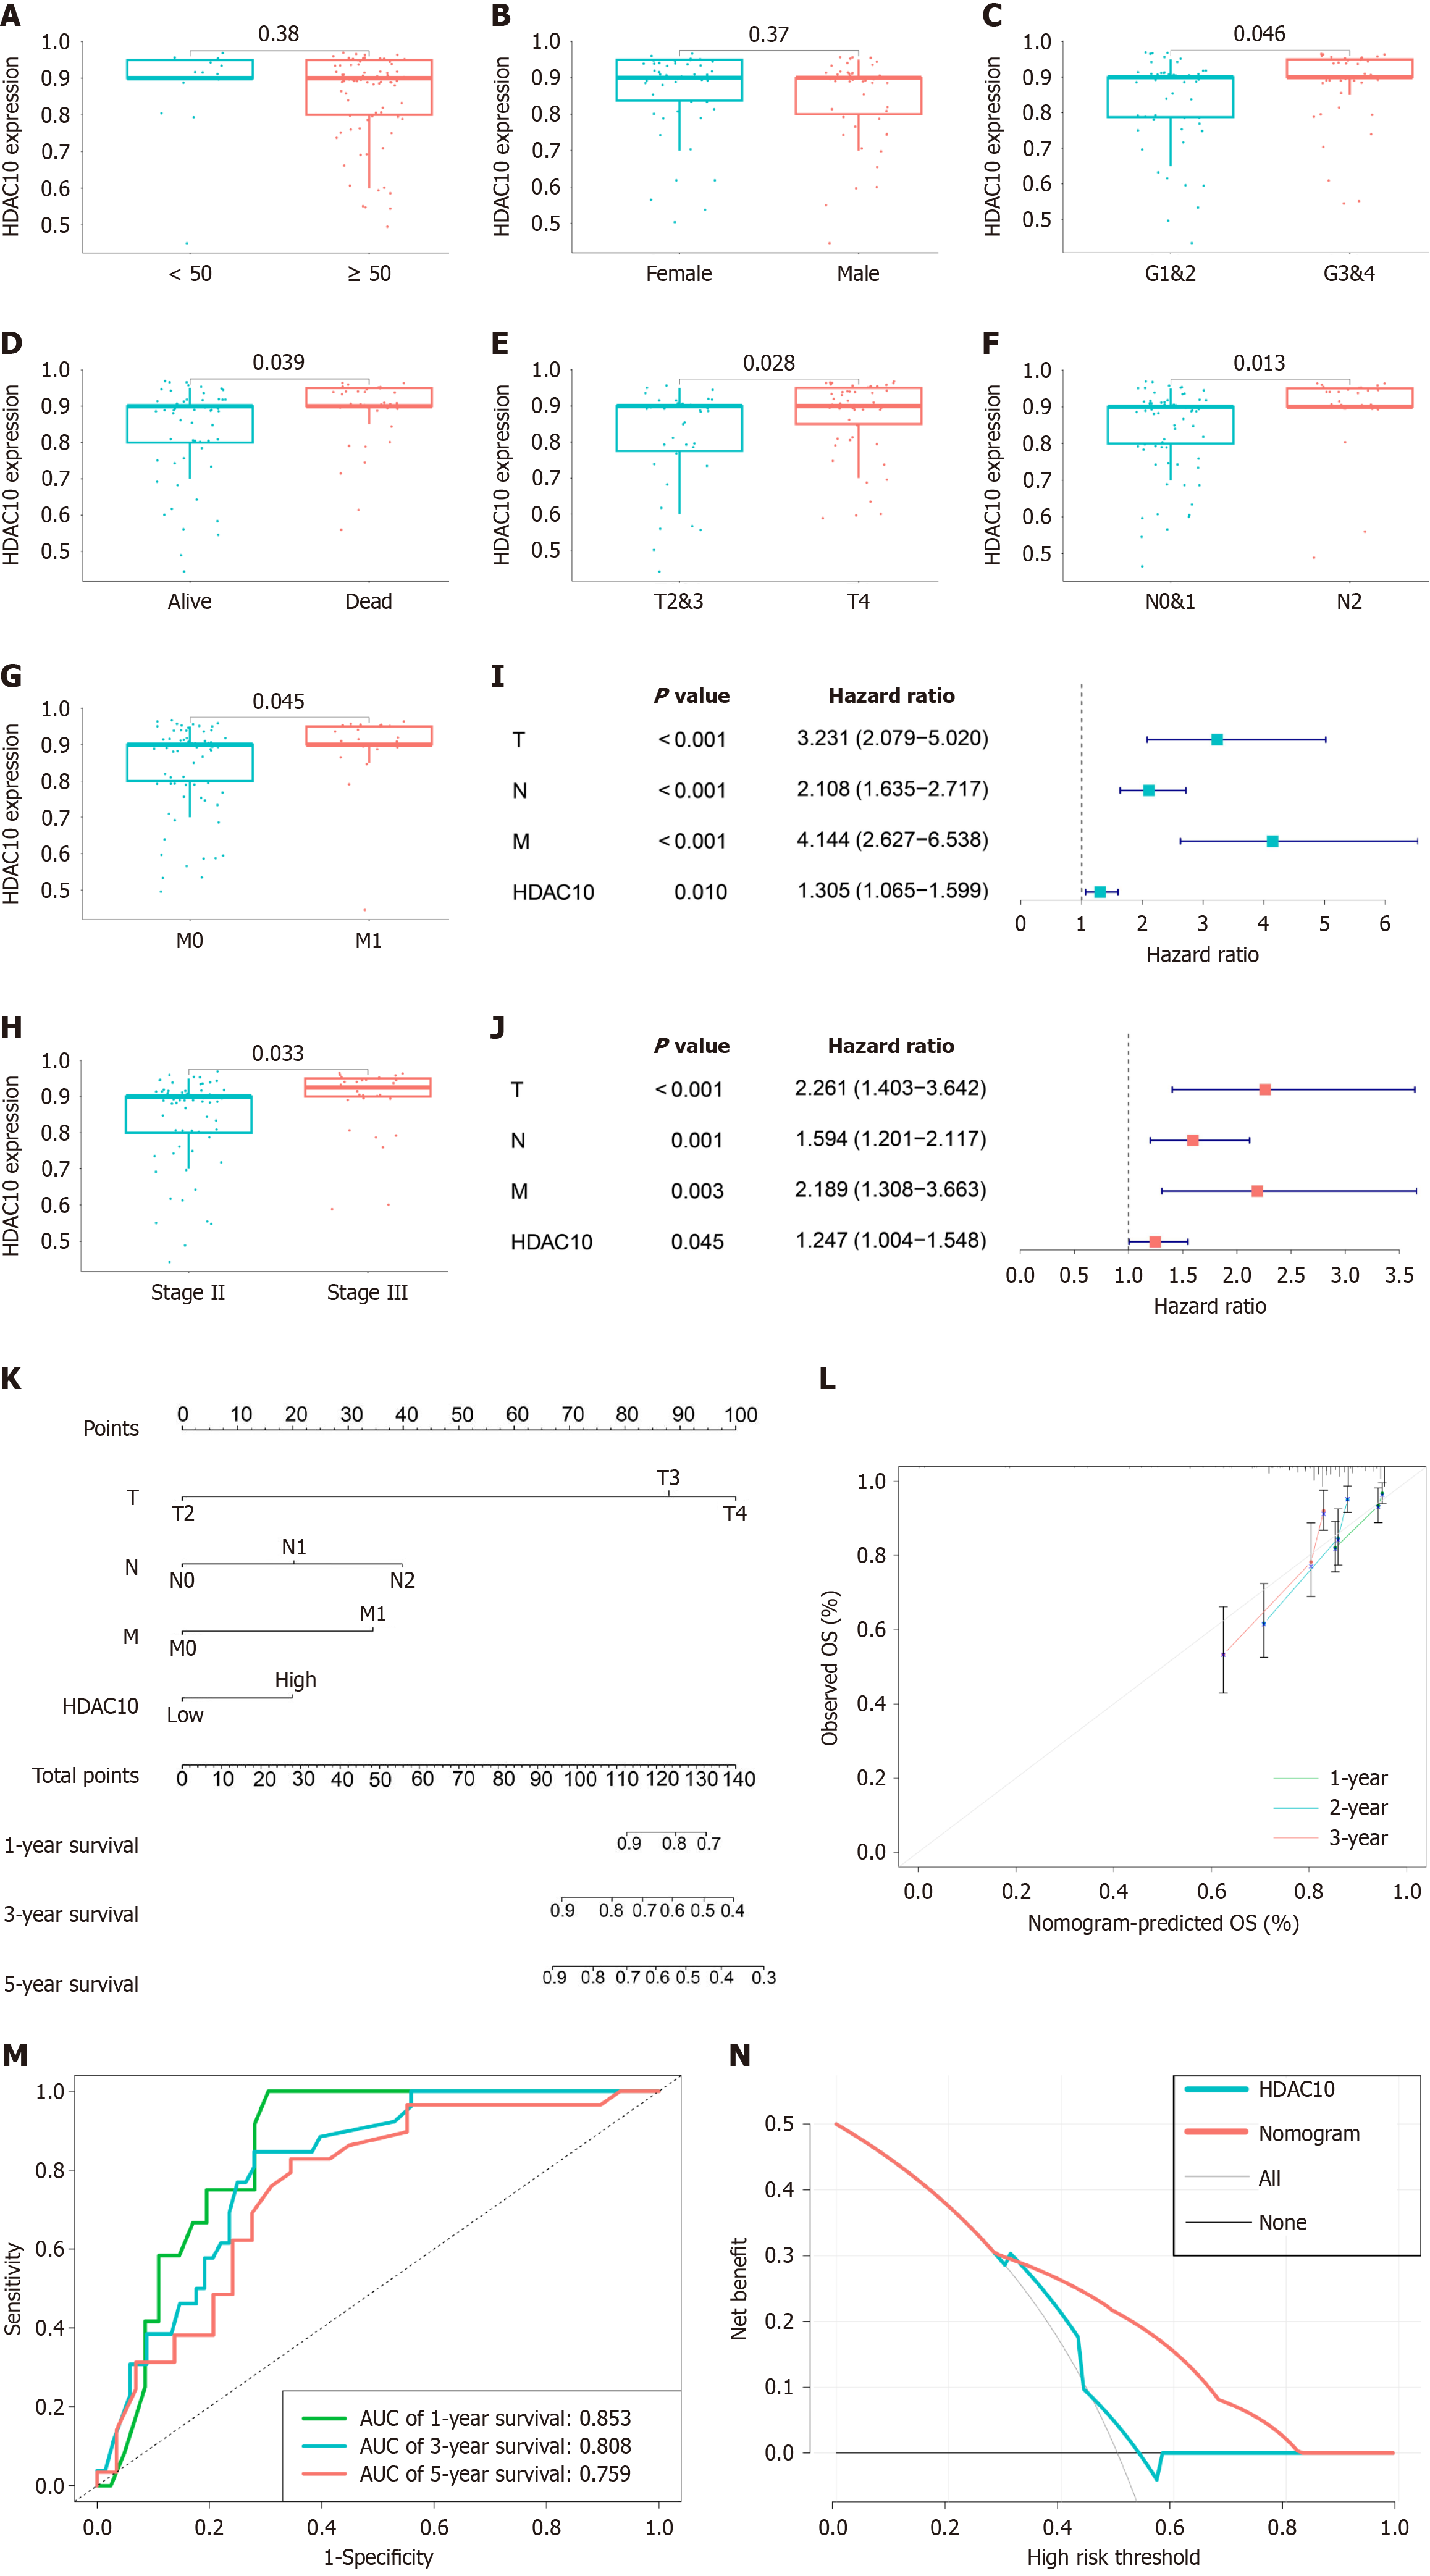
Figure 2 Histone deacetylases 10 was associated with clinicopathological characteristics and nomogram model construction.
A: Differential analysis for histone deacetylases 10 (HDAC10) expression in patients with different age; B: Gender; C: High HDAC10 expression in high grade; D: Status; E: High levels of HDAC10 in advanced T stage; F: High HDAC10 expression in advanced N stage; G: High HDAC10 expression in advanced M stage; H: High levels of HDAC10 in advanced pathologic stage; I and J: Univariate Cox and multivariate Cox regression analysis for clinical factors and HDAC10 expression with overall survival (OS). Hazard ratio > 1 represented risk factors for survival and hazard ratio < 1 represented protective factors; K: Nomogram for predicting the 1-, 3-, and 5-year OS from CRC tissue microarray; L: Calibration curves for predicting 1-, 3-, and 5-year OS; M: Receiver operating characteristic curve for predicting 1-, 3-, and 5-year OS; N: Decision curve analysis based on nomogram better determine survival than only HDAC10. OS: Overall survival; HDAC10: Histone deacetylases 10; AUC: Area under the curve.
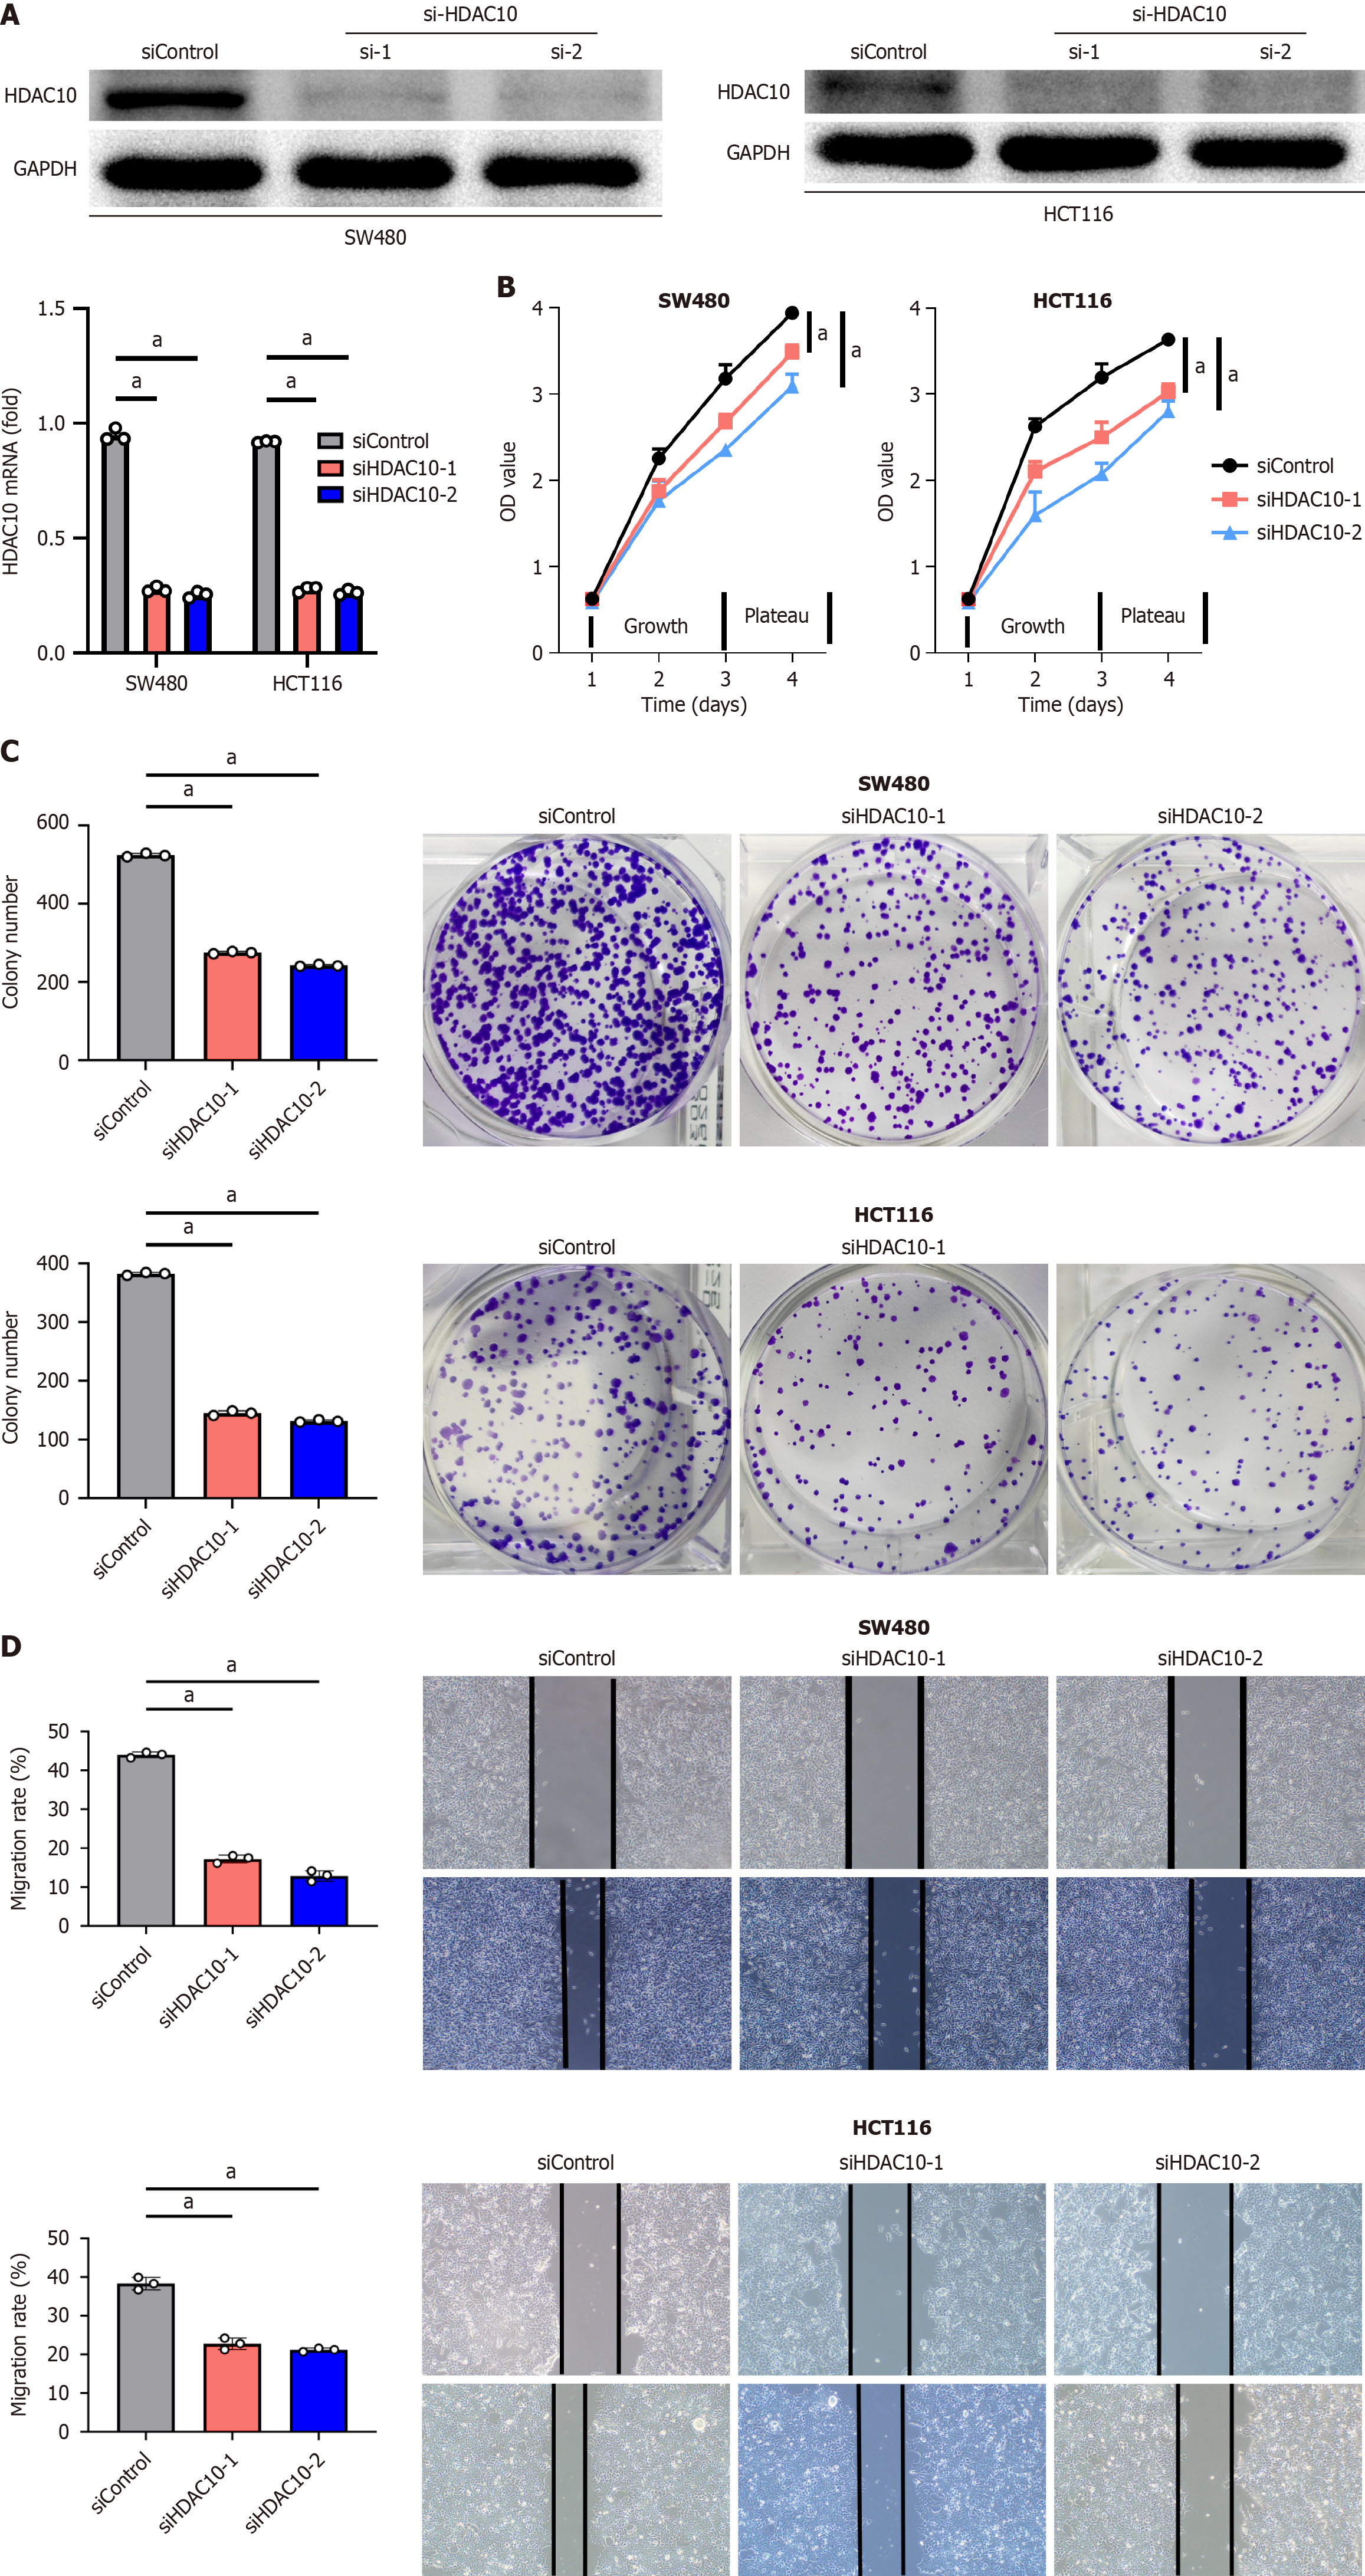
Figure 3 Histone deacetylases 10 promote tumor proliferation and migration.
A: Knockdown of histone deacetylases 10 (HDAC10) expression in SW480 and HCT116 cells at mRNA and protein levels; B: Cell counting kit-8 assay showed HDAC10 depletion inhibited cell proliferation; C: Colony formation analysis indicated HDAC10 knockdown suppressed colony formation; D: Wound-healing assay showed HDAC10 depletion inhibited cell migration. Compared with the siControl group, aP < 0.001. Data were represented as mean ± SD of biological triplicates. HDAC10: Histone deacetylases 10.
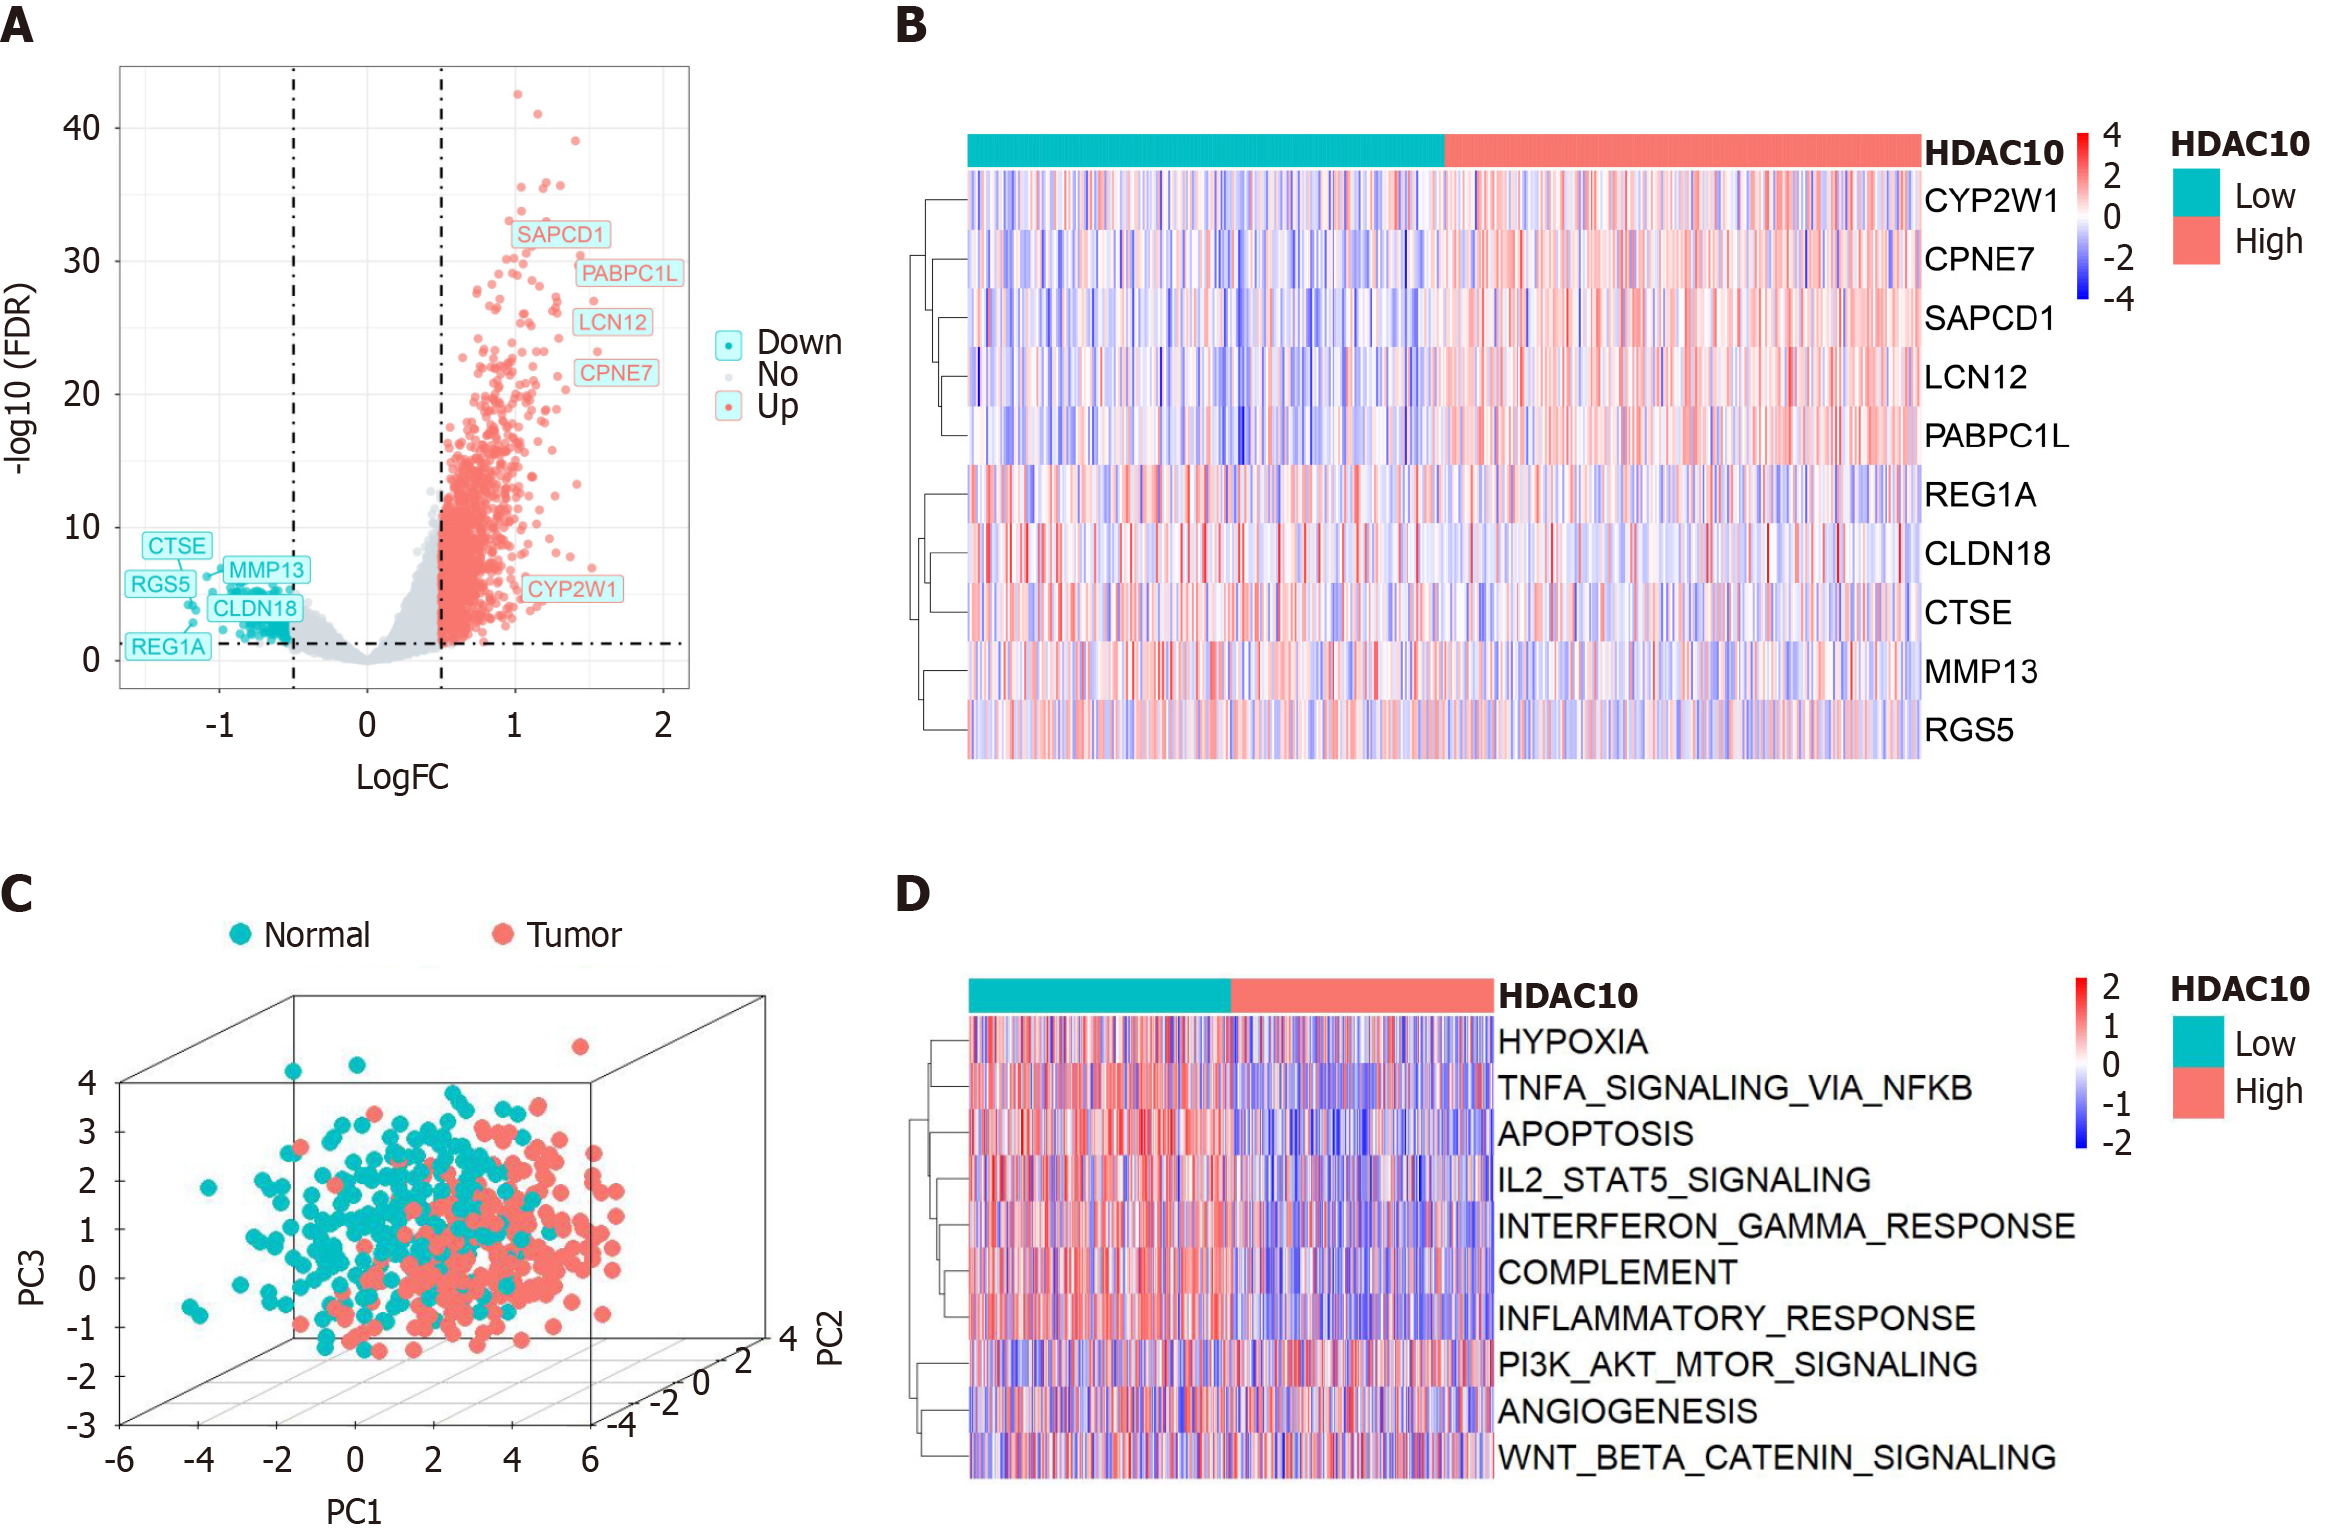
Figure 4 Differential analysis and functional enrichment analysis.
A: Volcano plot from the top five upregulated and downregulated differentially expressed genes (DEGs) between high and low-histone deacetylases 10 group; B: Heat map showed the top five genes in both upregulated and downregulated DEGs; C: Different expression levels of DEGs between normal colon and colorectal cancer; D: Gene set variation analysis showed the activation status of biological pathways in two groups. HDAC10: Histone deacetylases 10.
Figure 5 Correlation between histone deacetylases 10 and tumor microenvironment in The Cancer Genome Atlas database.
A: Low expression of 4 immunomodulators (MHC, immunostimulators, chemokines and receptors) in high and low-histone deacetylases 10 (HDAC10) groups; B: Low stromal, immune, and ESTIMATE scores in high HDAC10 groups; C: HDAC10 expression positively correlated with tumor purity; D: Low infiltration level of common immune cells in high HDAC10 group; E: Correlation between HDAC10 expression and infiltration levels of tumor-infiltrating immune cells calculated by seven independent algorithms; F: Immunohistochemistry analysis showed that low expression of CD8a, CXCL9 and CXCL10 in high HDAC10 group. Scale bar, 100 μm; G: HDAC10 expression was negatively associated with critical steps in cancer-immunity cycle. aP < 0.001, bP < 0.01, cP < 0.05. NS: No significance; HDAC10: Histone deacetylases 10.
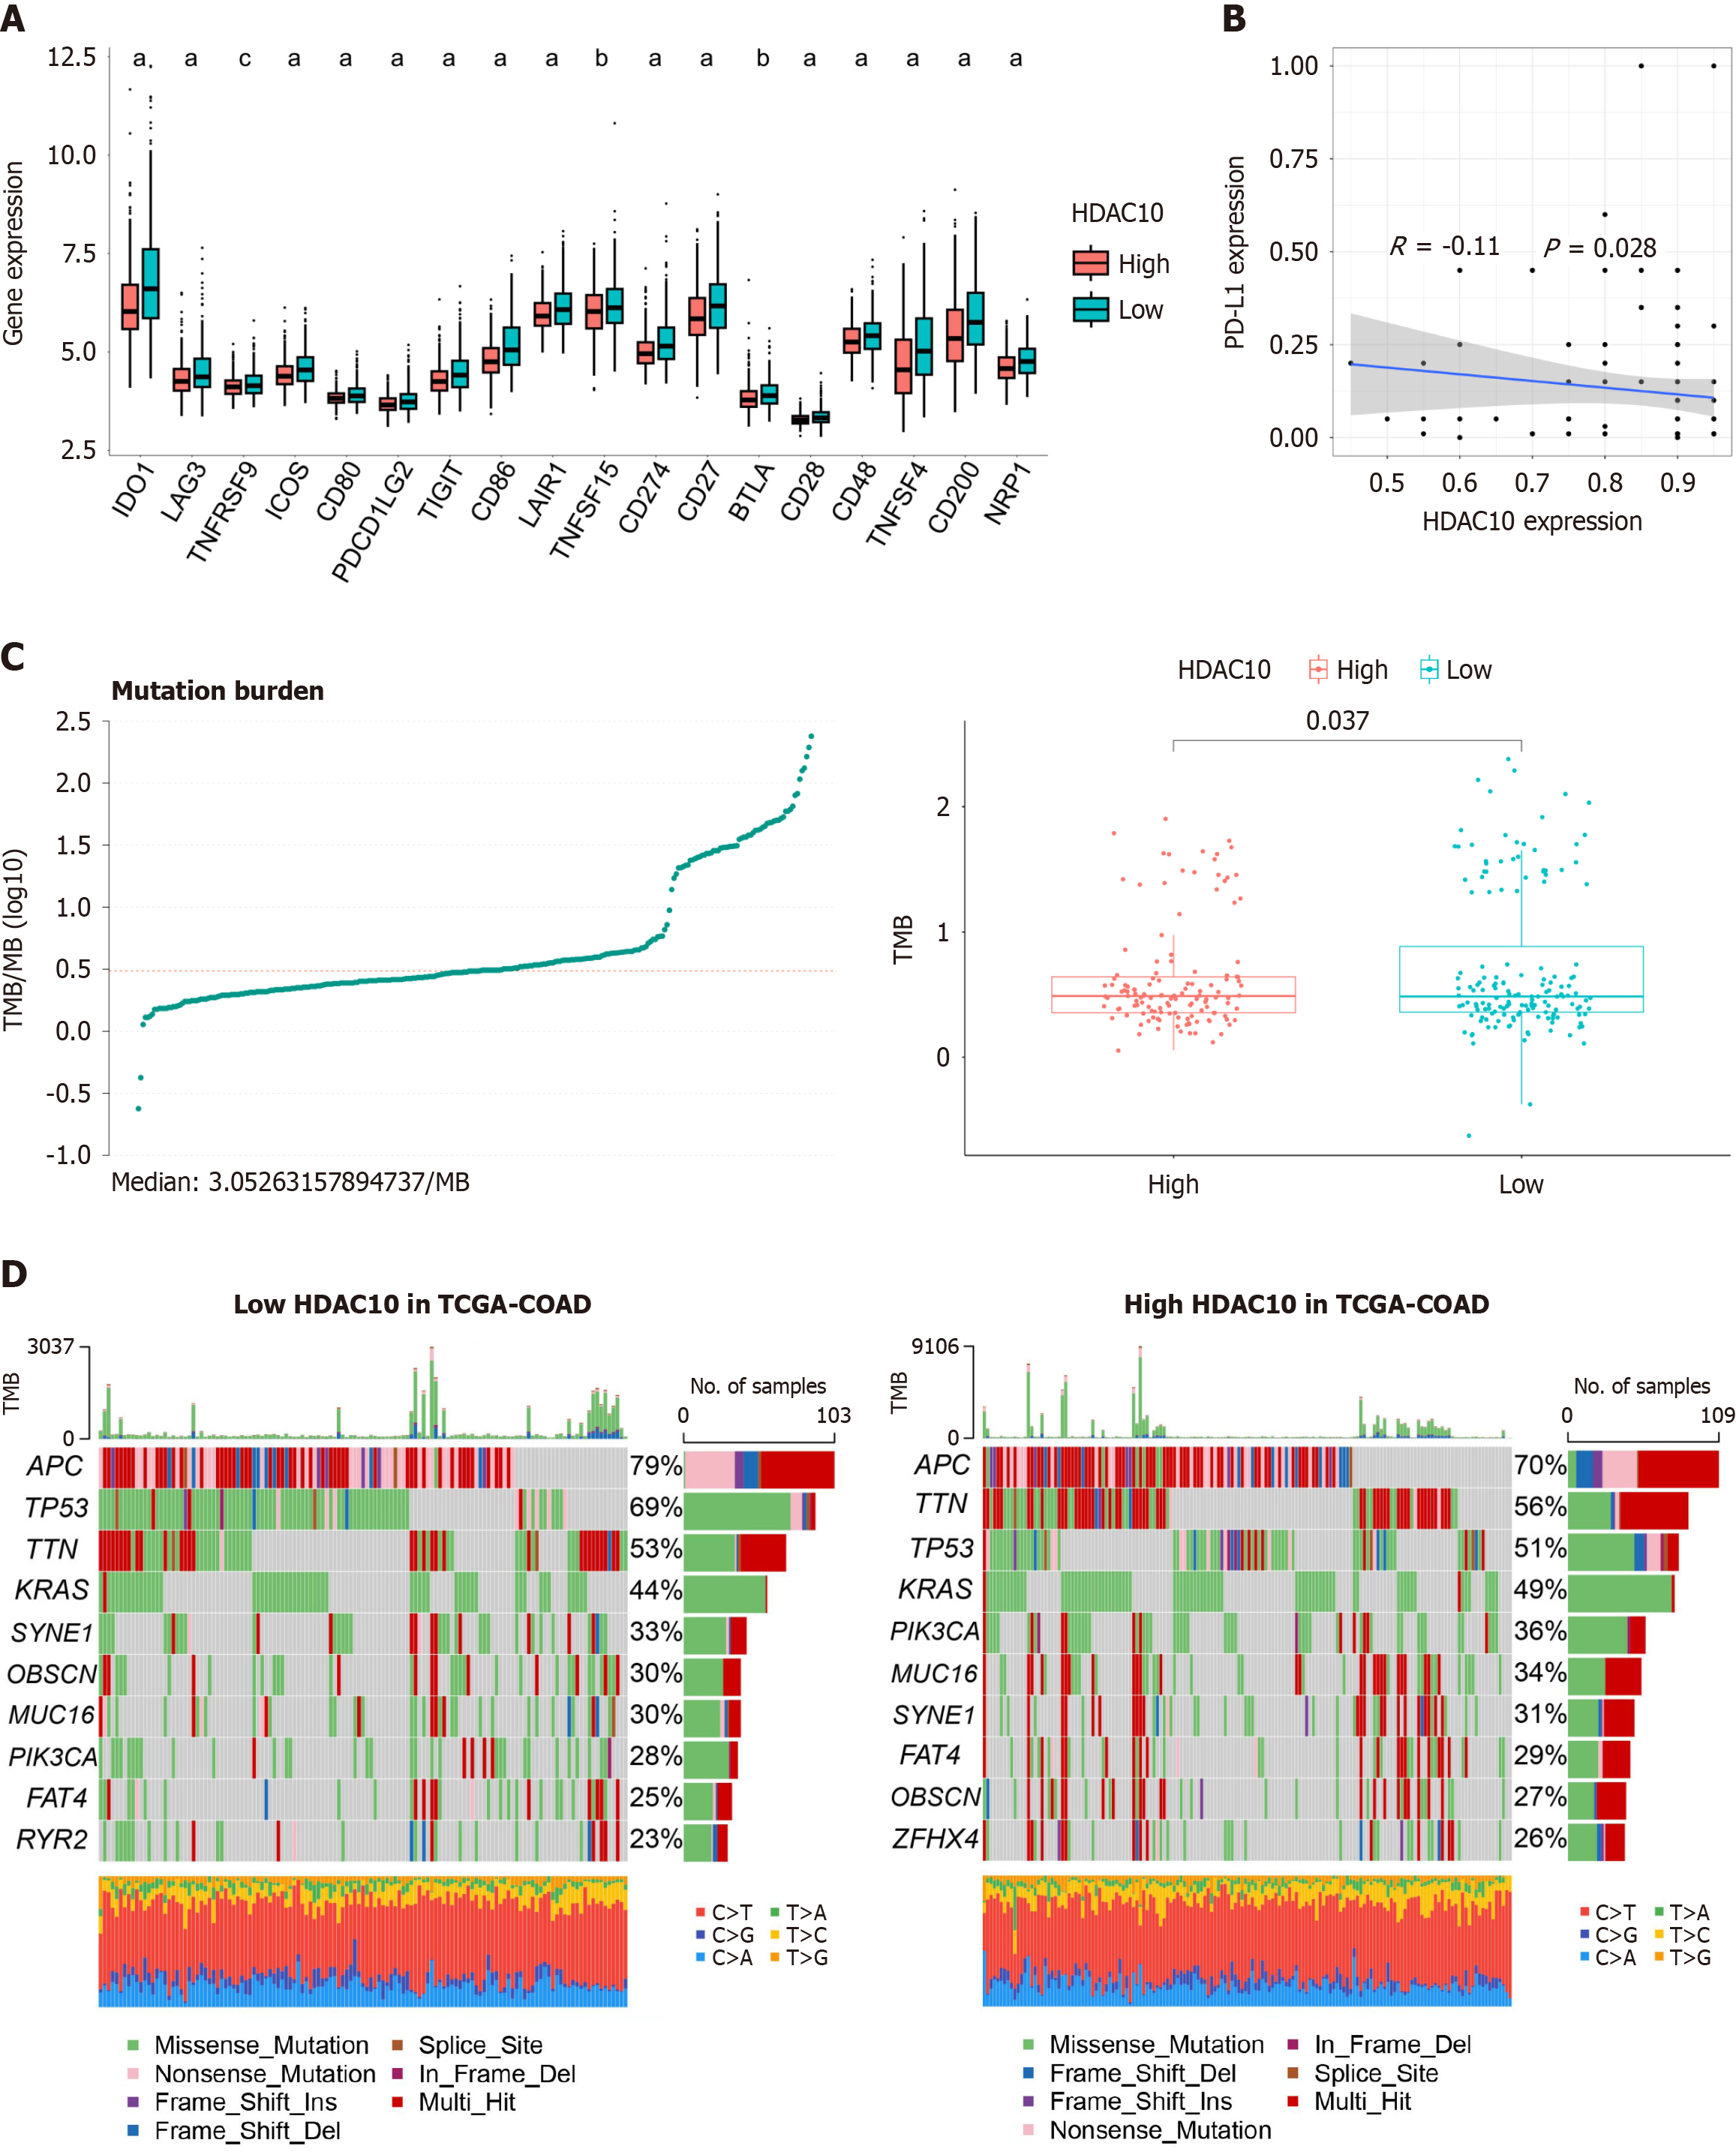
Figure 6 Effect on immune checkpoints and tumor burden mutation.
A: Low expression of immune checkpoints in high histone deacetylases 10 (HDAC10) group; B: HDAC10 expression negatively correlated with PD-L1 in colorectal cancer tissue microarray; C: Low tumor burden mutation score in high HDAC10 group; D: Waterfall plot for somatic mutations in different HDAC10 groups. aP < 0.001, bP < 0.01, cP < 0.05. HDAC10: Histone deacetylases 10.
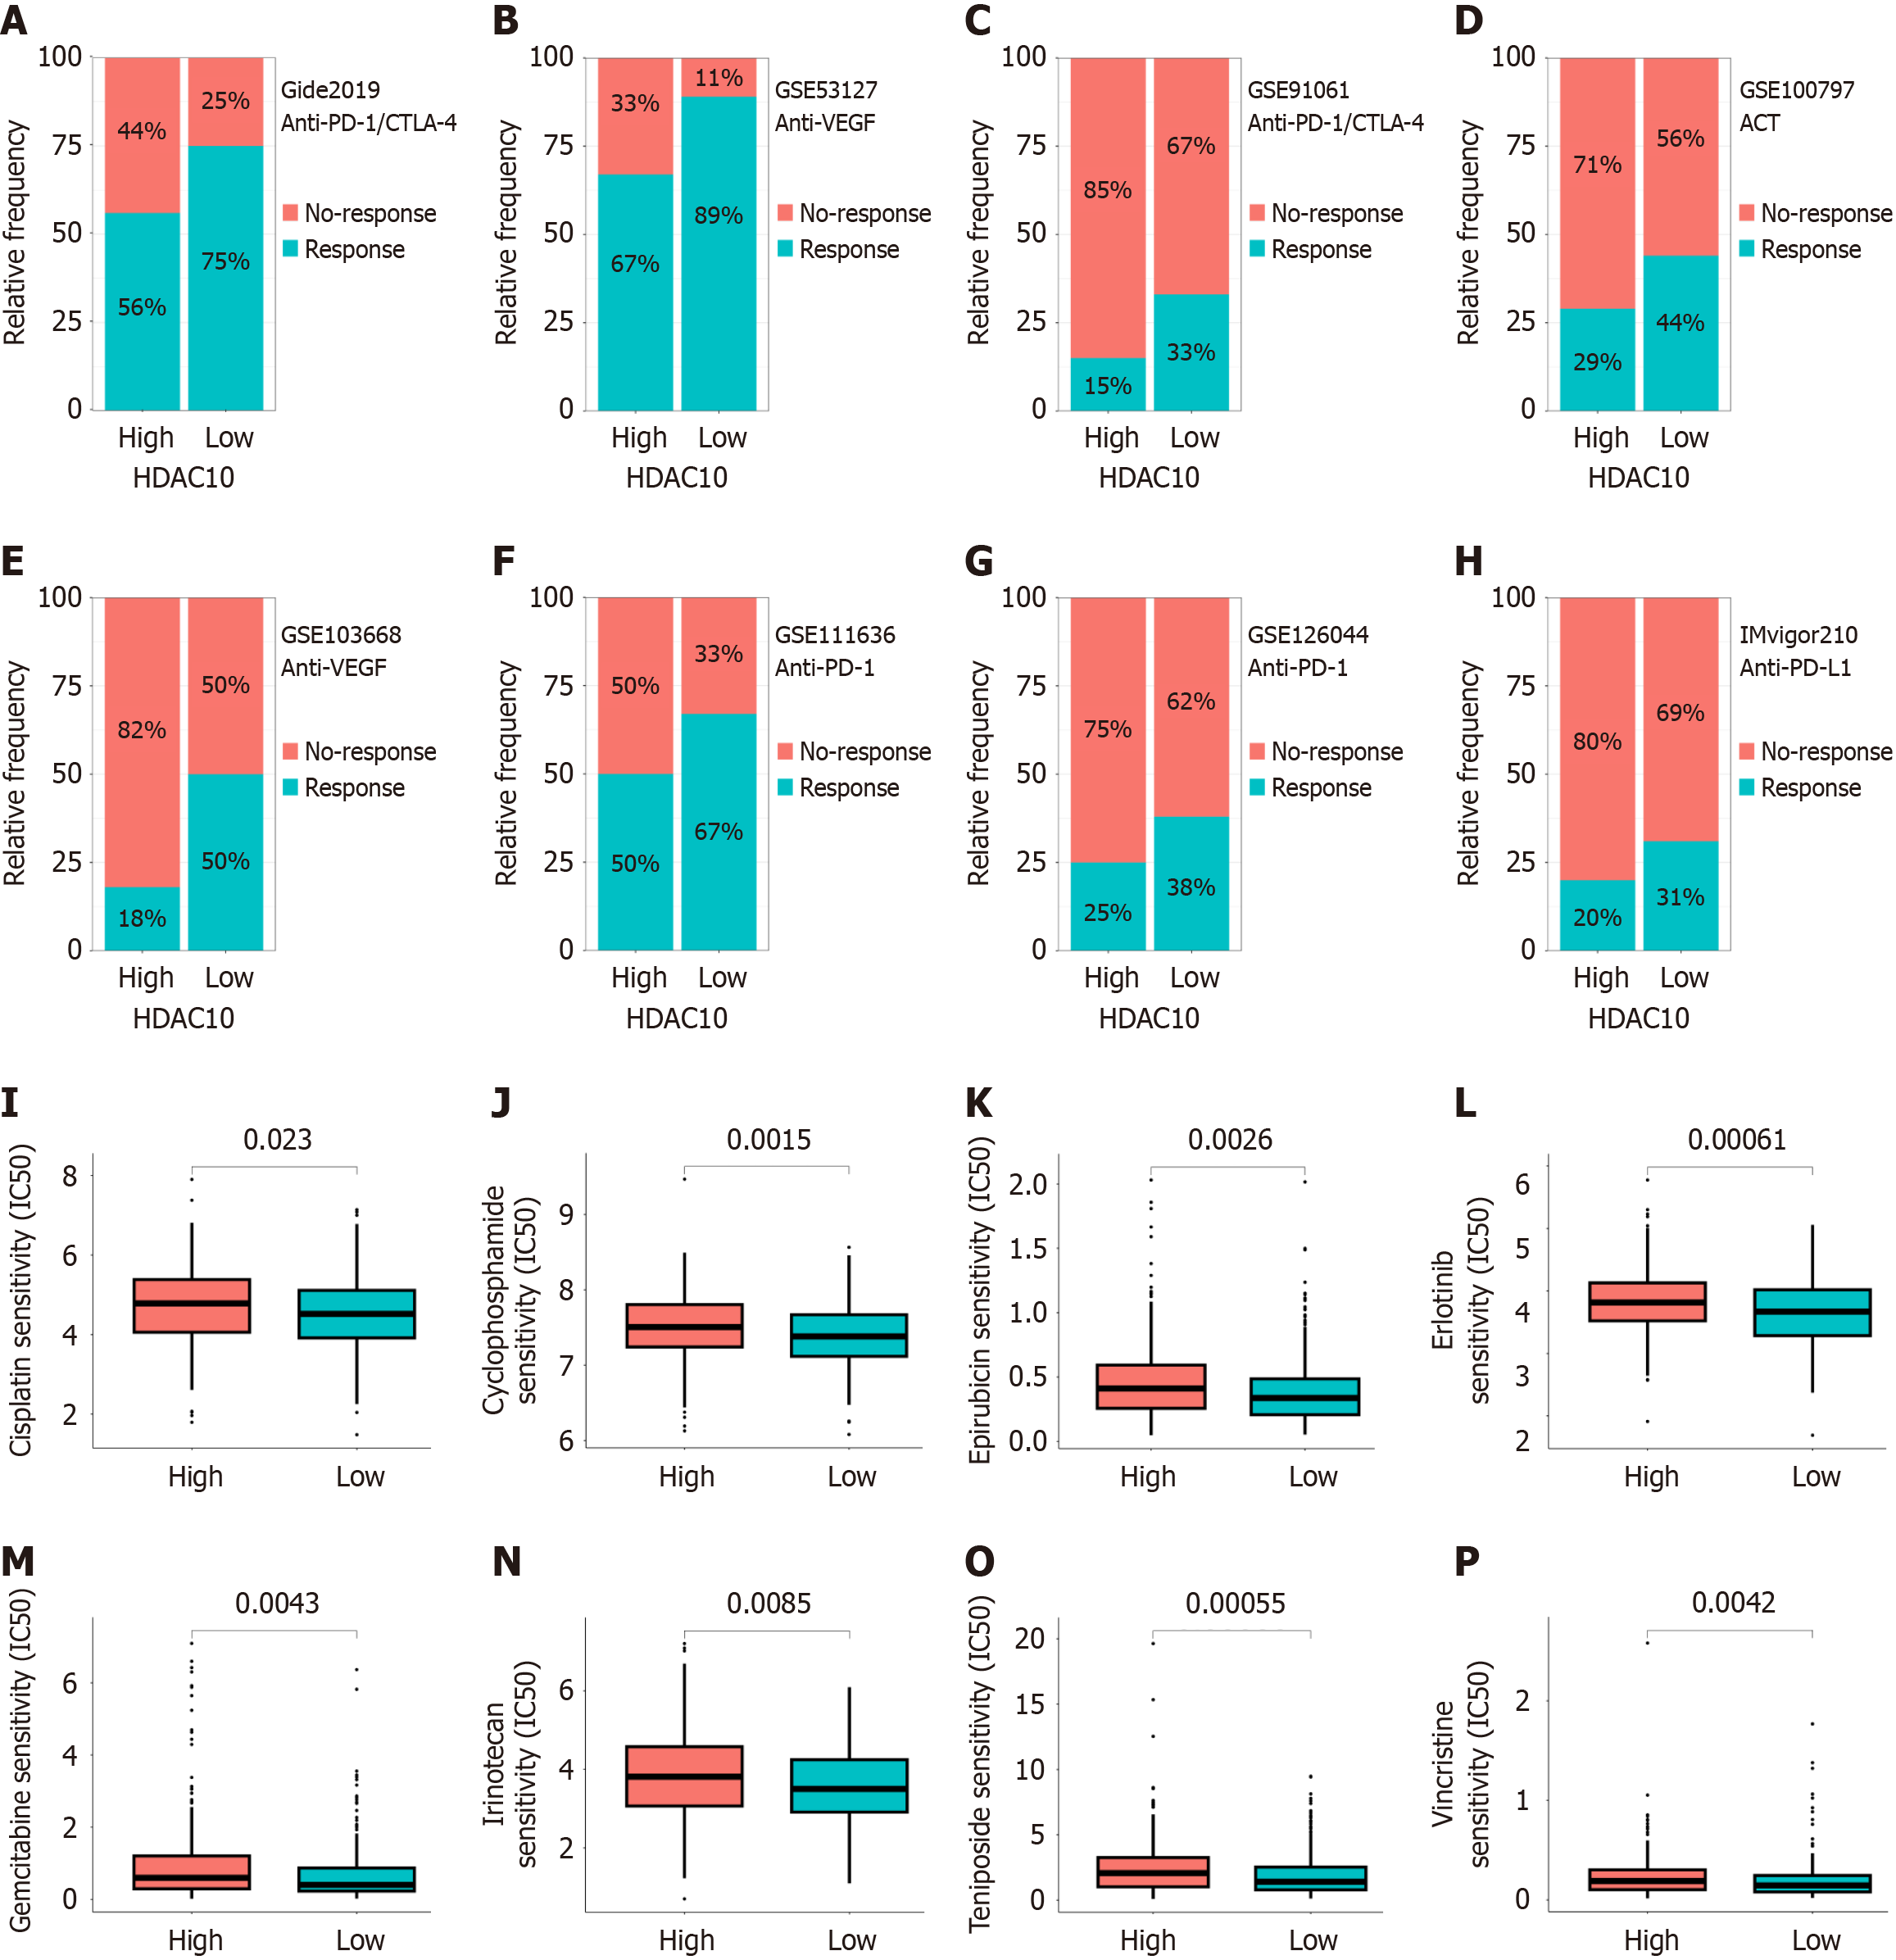
Figure 7 Immunotherapy and drug sensitivity analysis.
A-H: Low immunotherapy response in high histone deacetylases 10 (HDAC10) group from Gide 2019, GSE53127, GSE91061, GSE100797, GSE103668, GSE111636, GSE126044, and IMvigor210 cohorts; I-P: Low common chemotherapy drug sensitivity in high HDAC10 group. HDAC10: Histone deacetylases 10.
- Citation: Nie HH, Yang XY, Zhou JK, Gao GL, Ding L, Hong YT, Yu YL, Qiu PS, Zeng ZY, Lai J, Zheng T, Wang HZ, Zhao Q, Wang F. Histone deacetylases 10 as a prognostic biomarker correlates with tumor microenvironment and therapy response in colorectal cancer. World J Gastroenterol 2025; 31(26): 108662
- URL: https://www.wjgnet.com/1007-9327/full/v31/i26/108662.htm
- DOI: https://dx.doi.org/10.3748/wjg.v31.i26.108662


