Copyright
©The Author(s) 2025.
World J Gastroenterol. Jul 14, 2025; 31(26): 107044
Published online Jul 14, 2025. doi: 10.3748/wjg.v31.i26.107044
Published online Jul 14, 2025. doi: 10.3748/wjg.v31.i26.107044
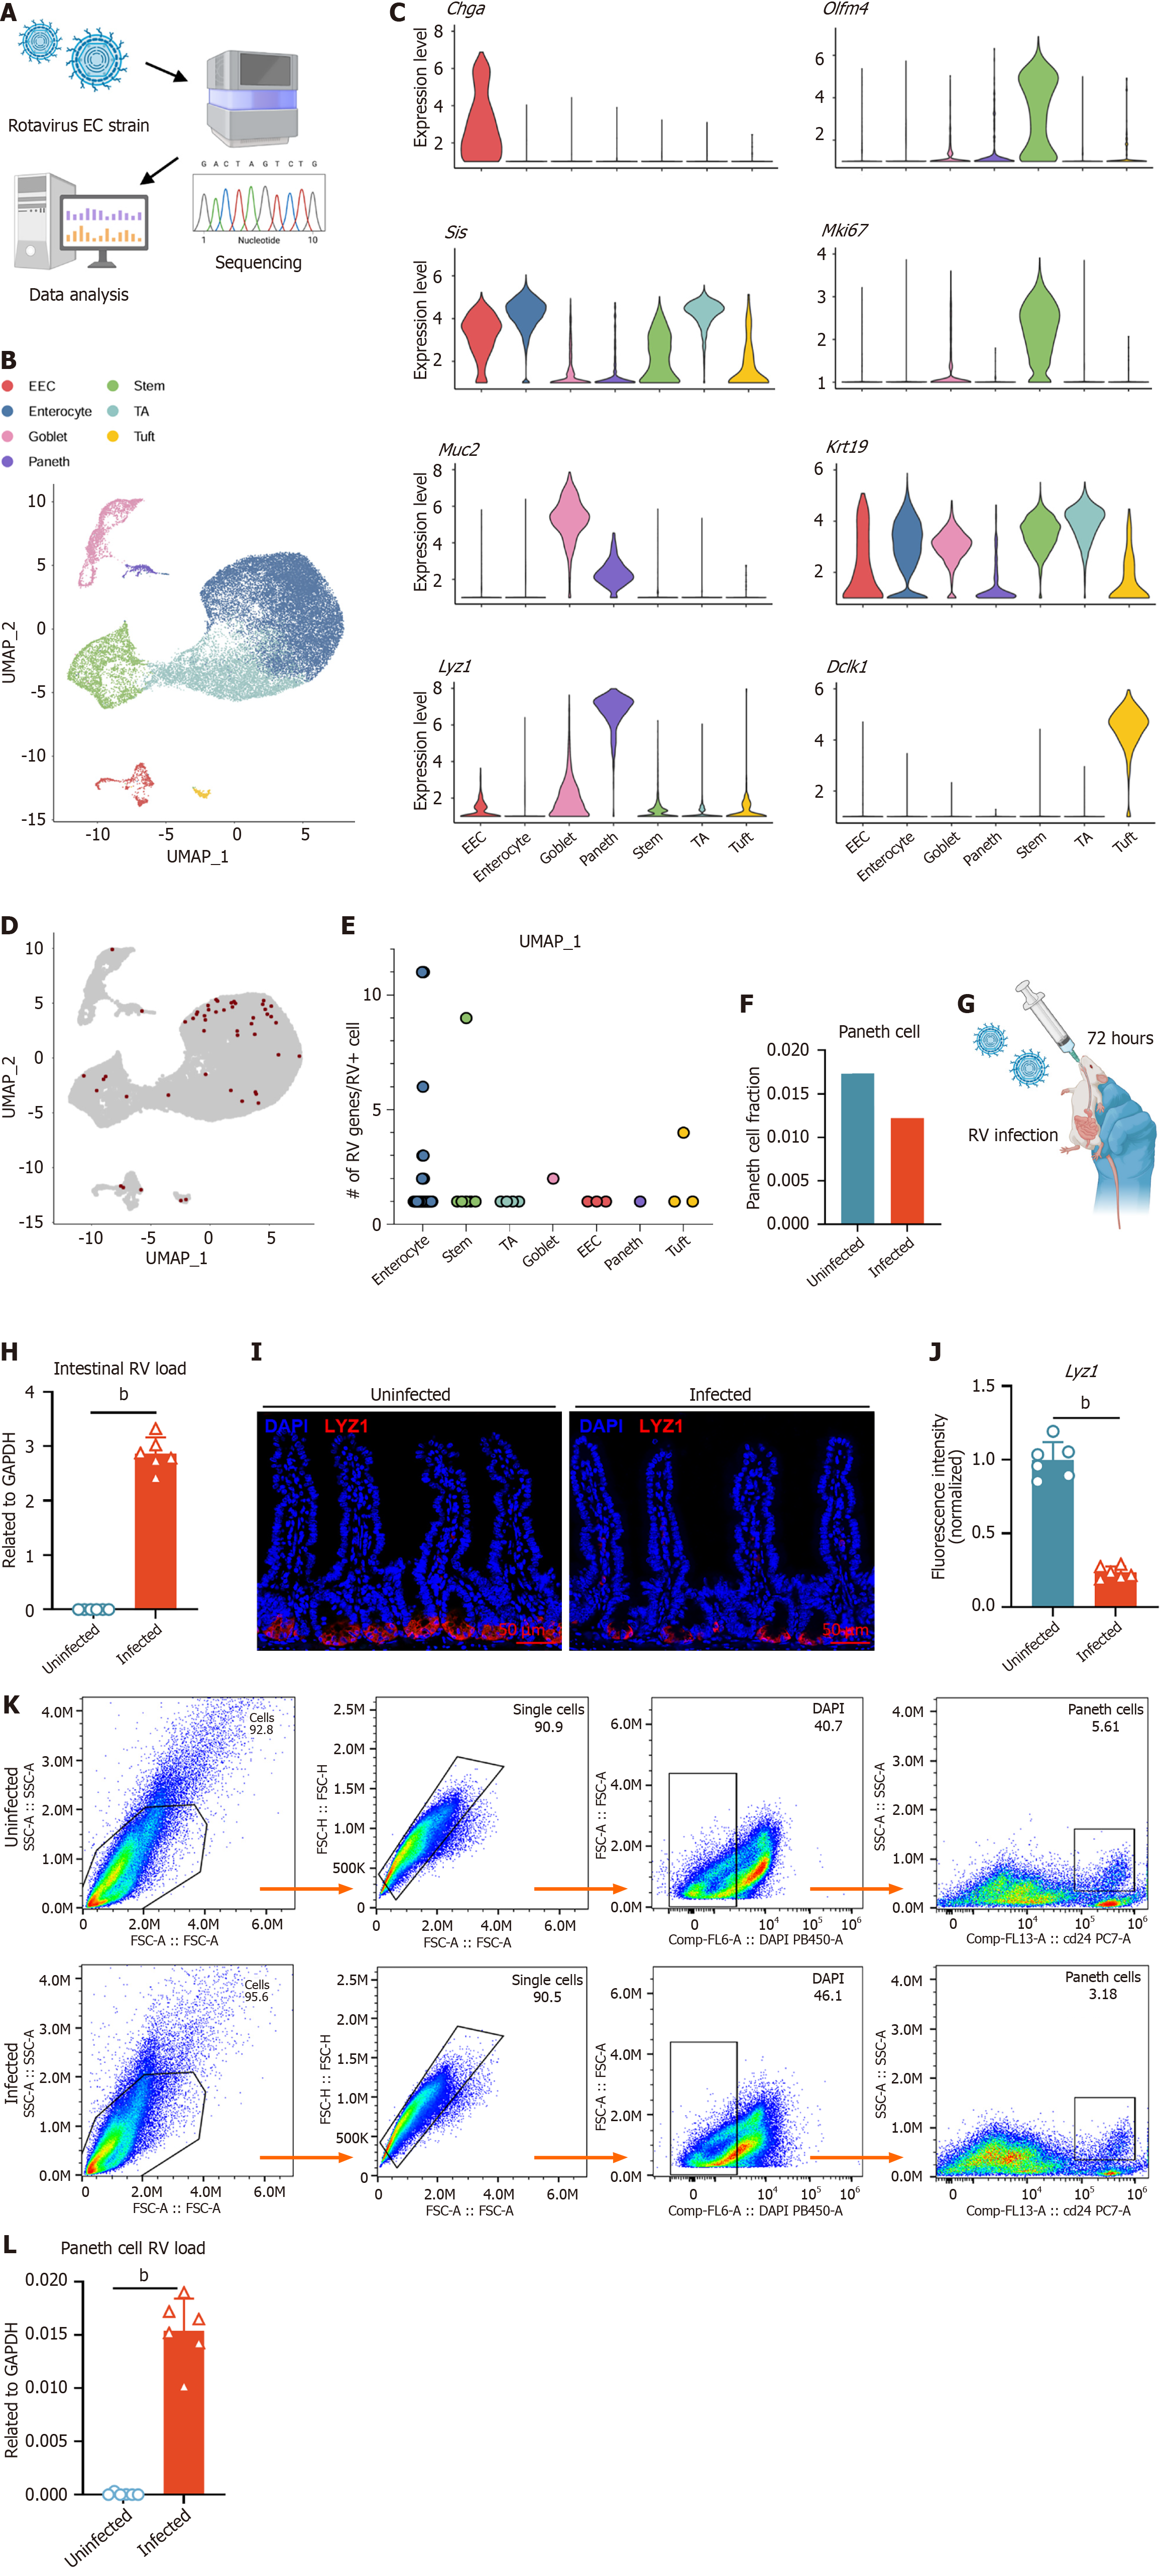
Figure 1 Rotavirus infection has been detected in Paneth cells.
A: Schematic representation of genome sequencing of the rotavirus (RV) enteric cytopathogenic human orphan virus strain; B: Uniform manifold approximation and projection of intestinal epithelial cells from uninfected and infected mice; C: Expression of representative genes in clusters from B; D: Distribution of cells containing RV genes; E: Number of RV genes per RV+ cell grouped by cell type; F: Comparison of the proportions of Paneth cells in uninfected and infected mice; G: C57BL/6J mice aged 5 weeks were orally gavaged with the RV enteric cytopathogenic human orphan virus strain and sacrificed 72 hours post-infection; H: RV load in uninfected and infected mice (n = 6, mean ± SD). Viral RNA levels were measured by reverse transcription quantitative polymerase chain reaction and normalized to glyceraldehyde-3-phosphate dehydrogenase; I: Immunofluorescence staining of Paneth cells (lysozyme 1, red) in uninfected and infected mice. Nuclei were counterstained with 4’,6-diamidino-2-phenylindole (blue). Scale bar = 50 μm; J: Quantification of lysozyme 1 fluorescence intensity in Paneth cells from uninfected and infected mice. Fluorescence intensity was normalized to the uninfected group (set to 1); K: Flow cytometric analysis of Paneth cells in uninfected and infected mice. Representative fluorescence-activated cell sorting plots showing the percentage of Paneth cells in both conditions; L: RV load in sorted Paneth cells from uninfected and infected mice (n = 6, mean ± SD), measured by quantitative real-time polymerase chain reaction and normalized to glyceraldehyde-3-phosphate dehydrogenase. Statistical significance was determined using the non-parametric Mann-Whitney test between groups. bP < 0.01. EC: Enteric cytopathogenic human orphan virus; UMAP: Uniform manifold approximation and projection; EEC: Enteroendocrine cell; TA: Transit-amplifying cell; Olfm: Olfactomedin; Mki67: Marker of proliferation Ki-67; Lyz: Lysozyme; RV: Rotavirus; DAPI: 4’,6-diamidino-2-phenylindole; GAPDH: Glyceraldehyde-3-phosphate dehydrogenase.
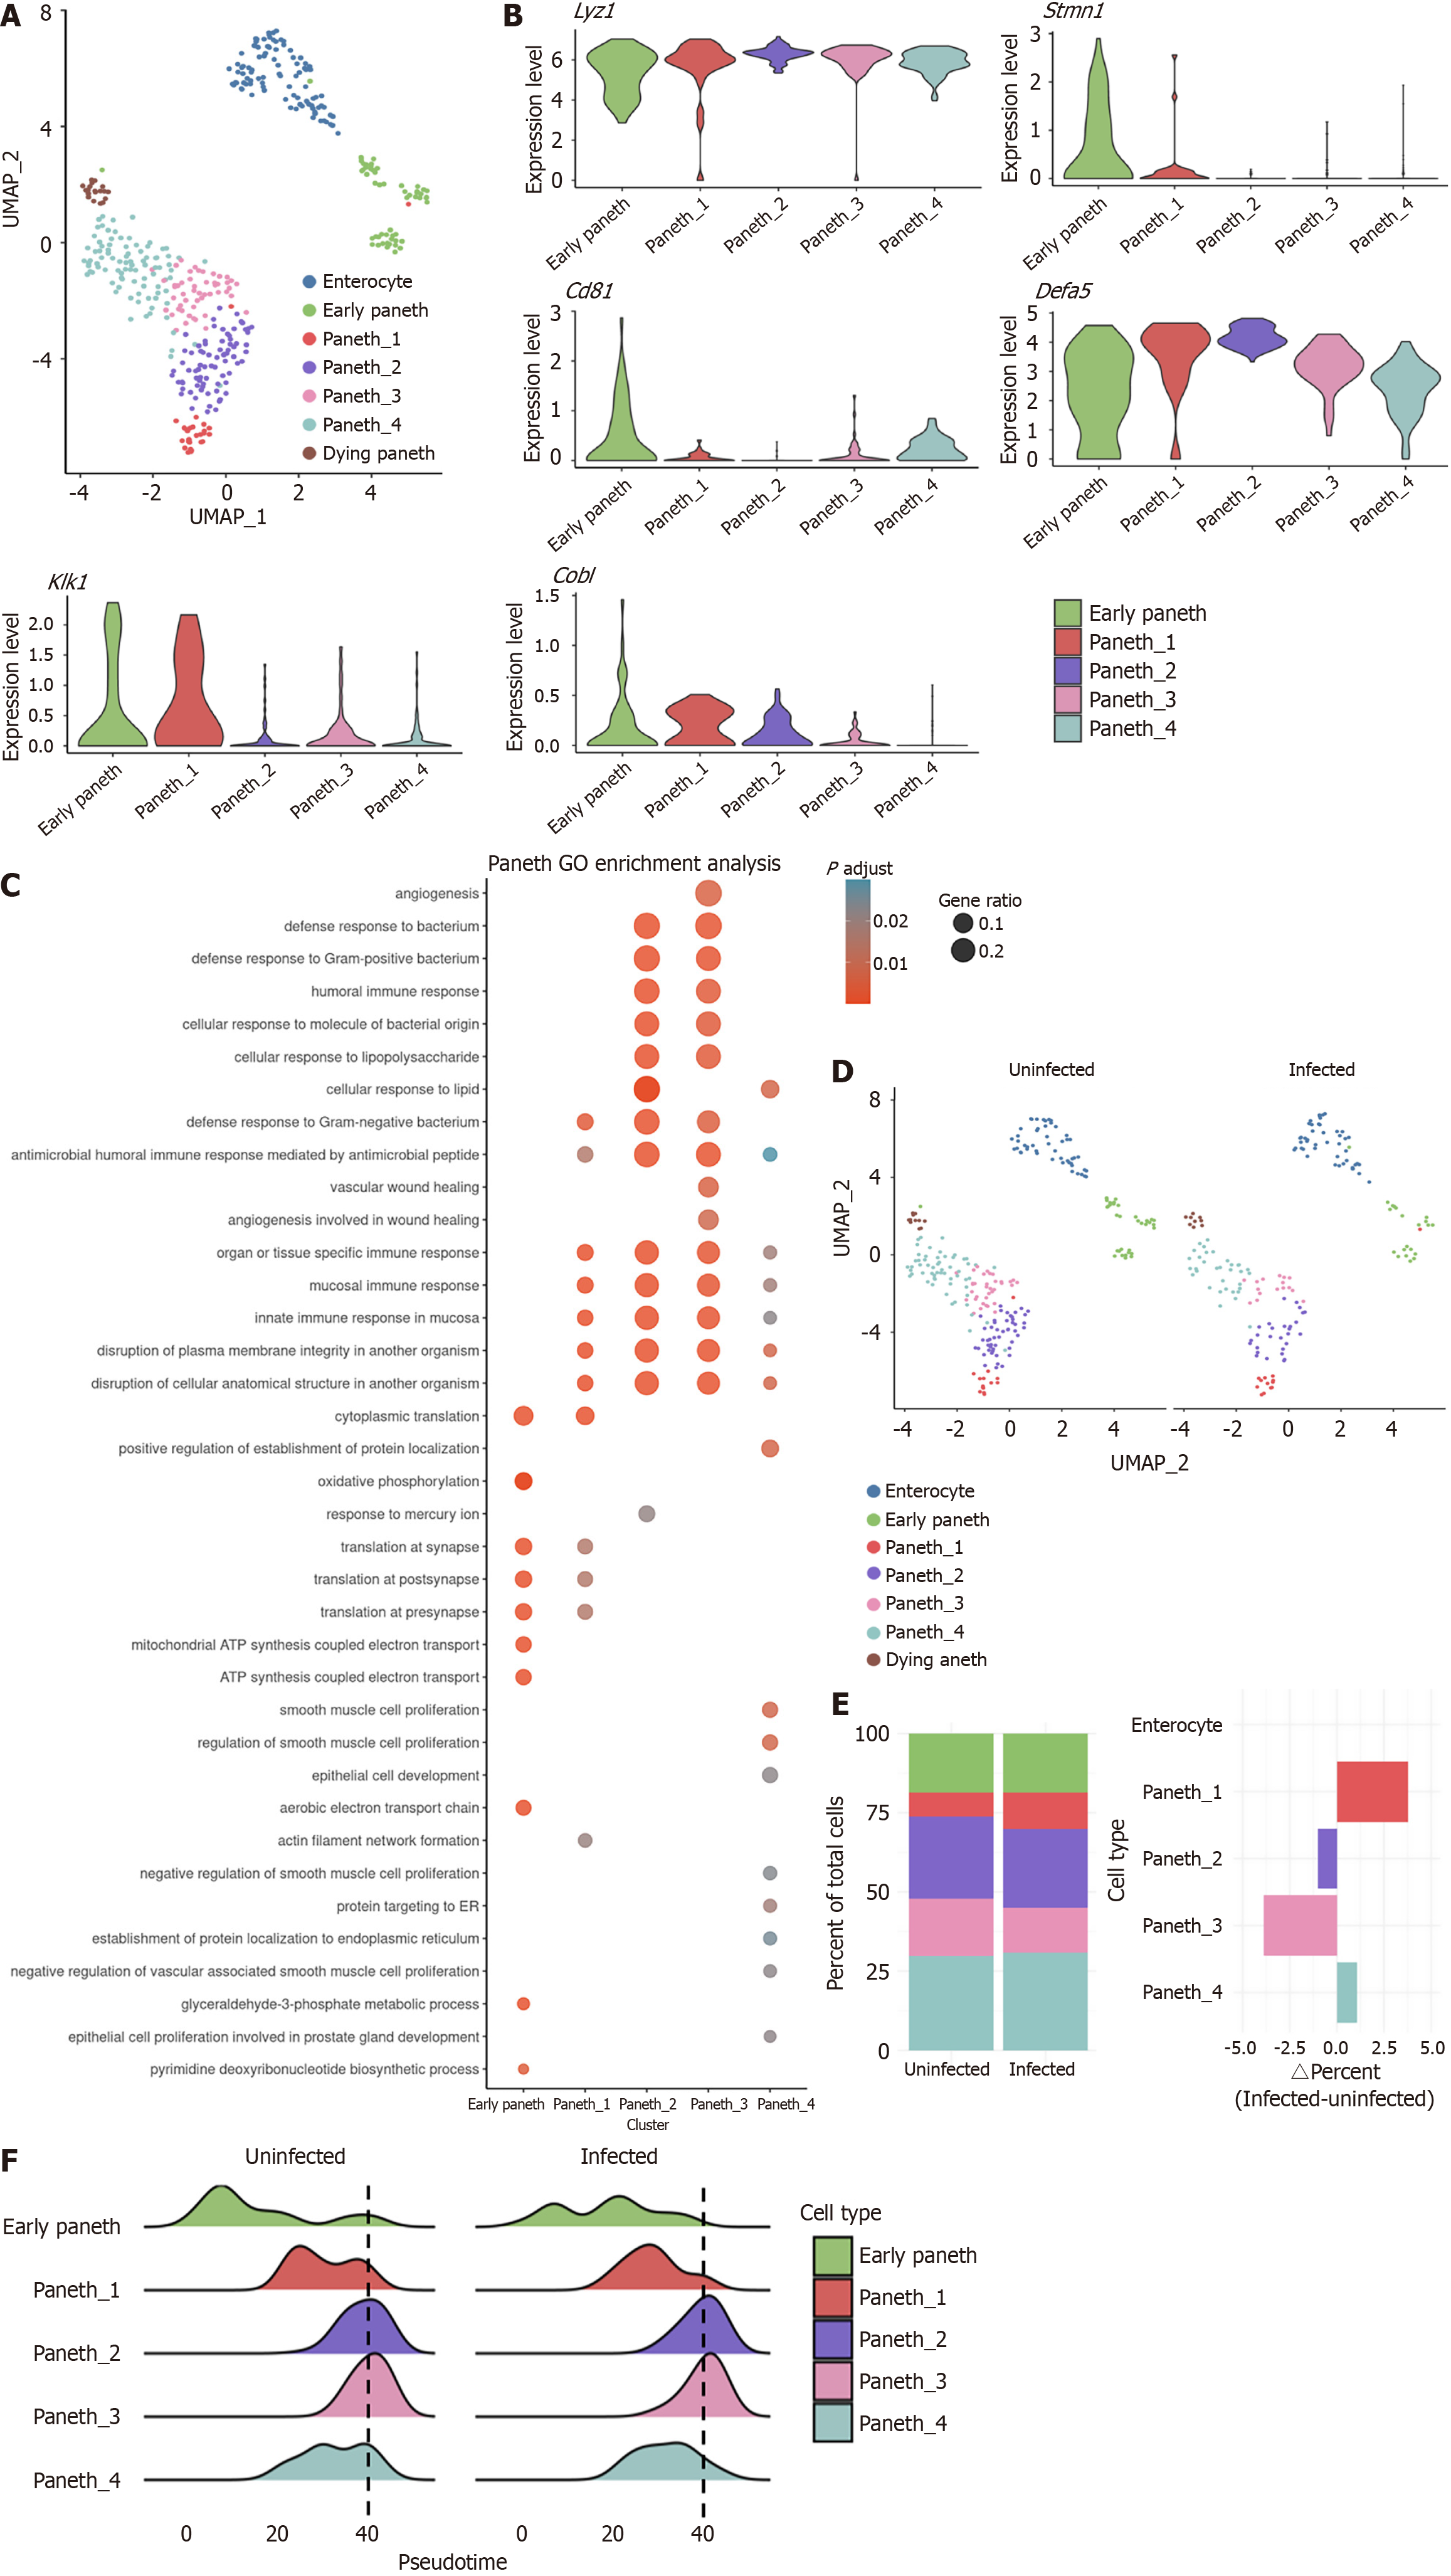
Figure 2 Reduction of mature Paneth cells with an increased proportion of the kallikrein 1 cluster.
A: The Paneth cell cluster in Figure 1B were re-clustered. Uniform manifold approximation and projection of combined subclustered Paneth cells from uninfected and infected mice; B: Expression of representative marker genes of subclustered Paneth cells; C: Enriched Gene Ontology terms for main clusters in Paneth cells; D: Uniform manifold approximation and projections of uninfected Paneth cells (left) vs infected Paneth cells (right); E: Quantification of percent cells per cluster (left) and difference in percent of uninfected and infected cells (right); F: Pseudotime trajectory analysis of uninfected Paneth cells (left) vs infected Paneth cells (right). UMAP: Uniform manifold approximation and projection; Lyz: Lysozyme; Klk: Kallikrein; GO: Gene Ontology.
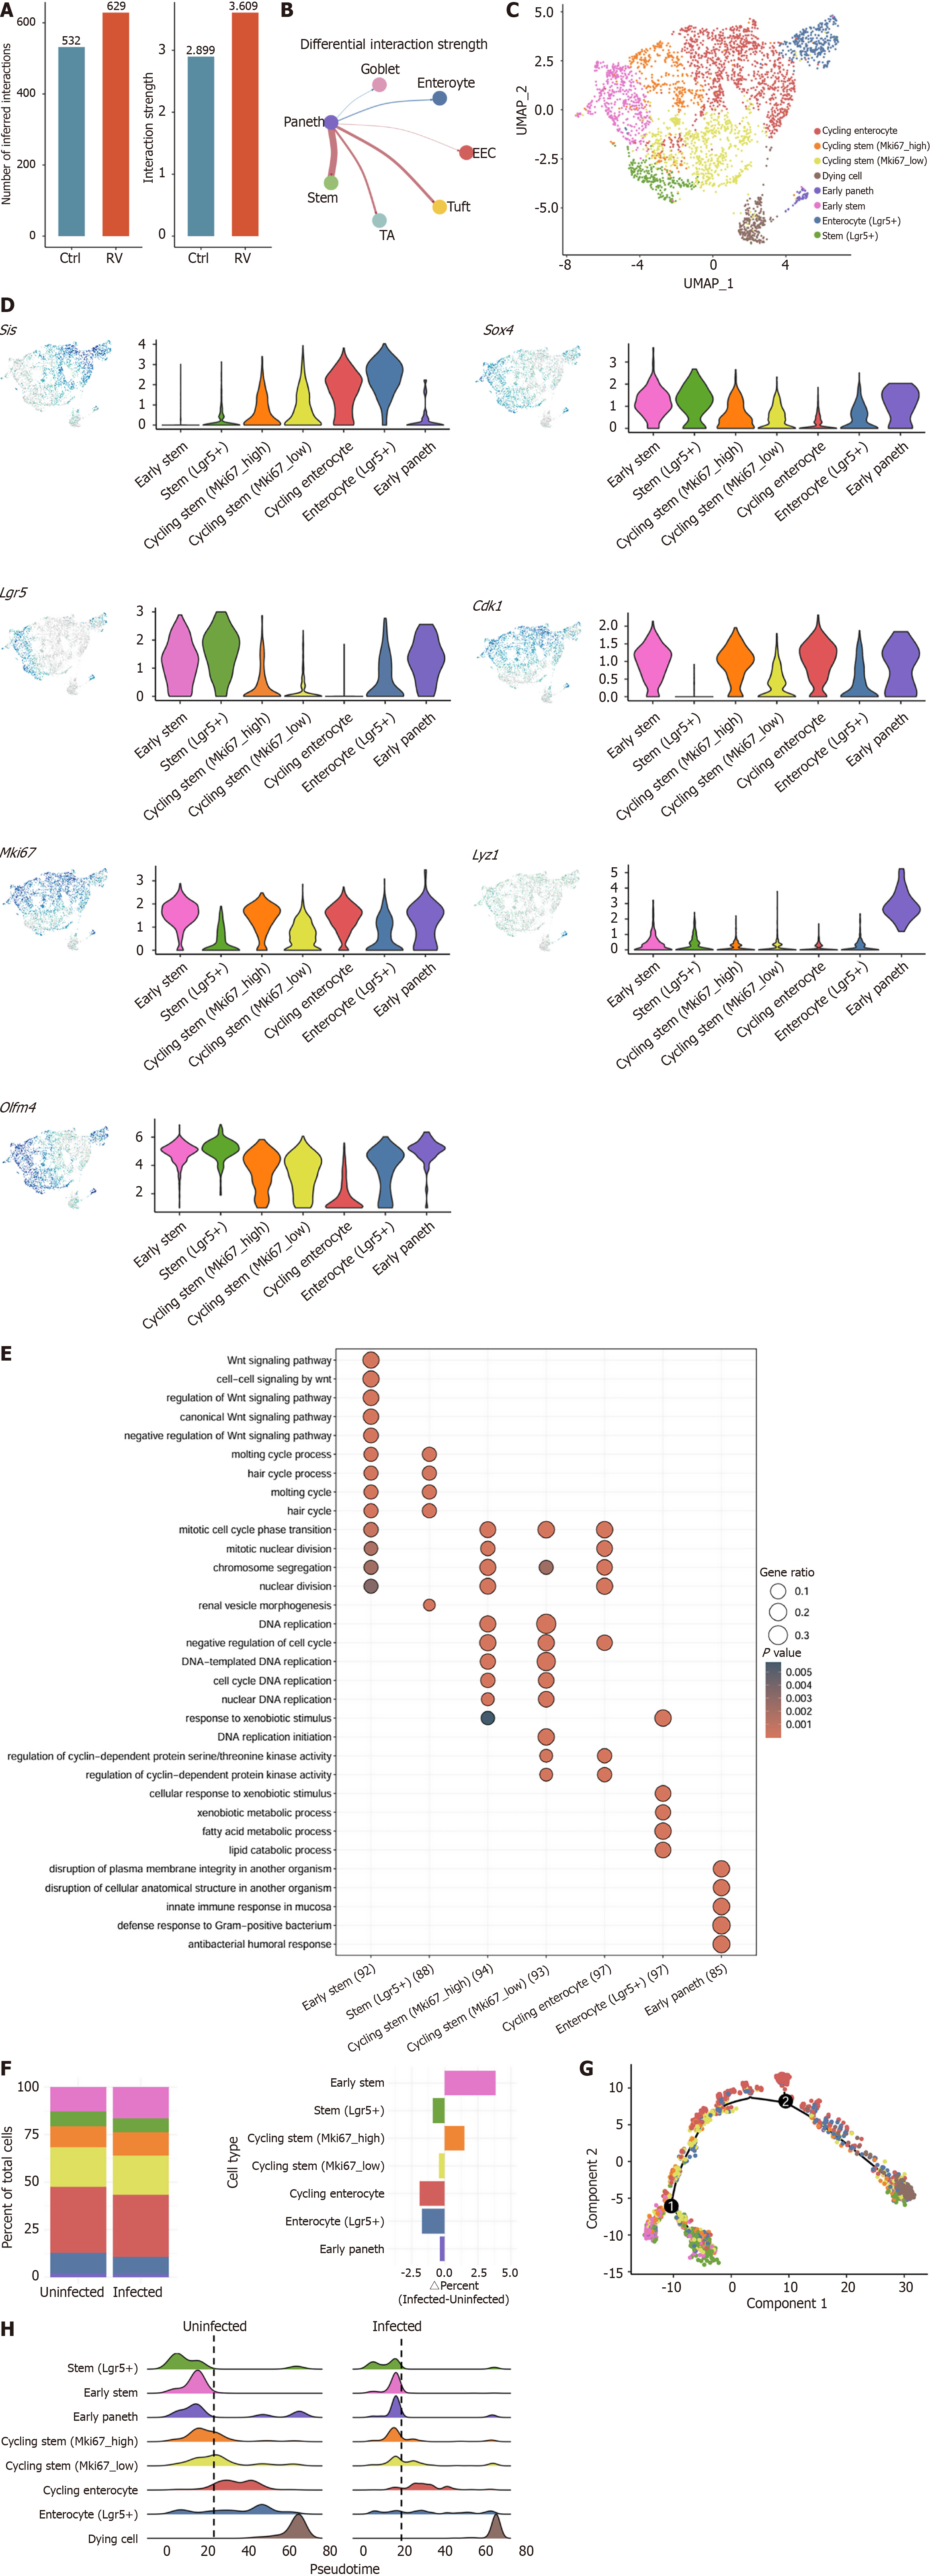
Figure 3 Rotavirus infection enhances Paneth-intestinal stem cells communication.
A: Quantification of total inferred cell-cell interactions number and strength between intestinal stem cells in uninfected and infected conditions; B: Differential interaction strength analysis of Paneth cells; C: The stem cell cluster in Figure 1B were re-clustered. Uniform manifold approximation and projection of combined subclustered stem cells from uninfected and infected mice; D: Feature plots (left) and violin plots (right) of the expression of representative marker genes of subclustered stem cells; E: Kyoto Encyclopedia of Genes and Genomes pathway enrichment analysis of subclustered stem cells; F: Quantification of percent cells per cluster (left) and difference in percent of uninfected and infected cells (right); G: Pseudotime trajectory analysis of stem cells differentiation; H: Ridge plots comparing the differentiation trajectories of stem cells in uninfected (left) and infected (right) conditions. Ctrl: Control; RV: Rotavirus; EEC: Enteroendocrine cell; TA: Transit-amplifying cell; UMAP: Uniform manifold approximation and projection; Lgr5: Leucine-rich repeat-containing G protein-coupled receptor 5; Mki67: Marker of proliferation Ki-67; Olfm4: Olfactomedin 4; Sox4: SRY-related high-mobility-group box 4; Cdk1: Cyclin-dependent kinase 1; Lyz1: Lysozyme 1.
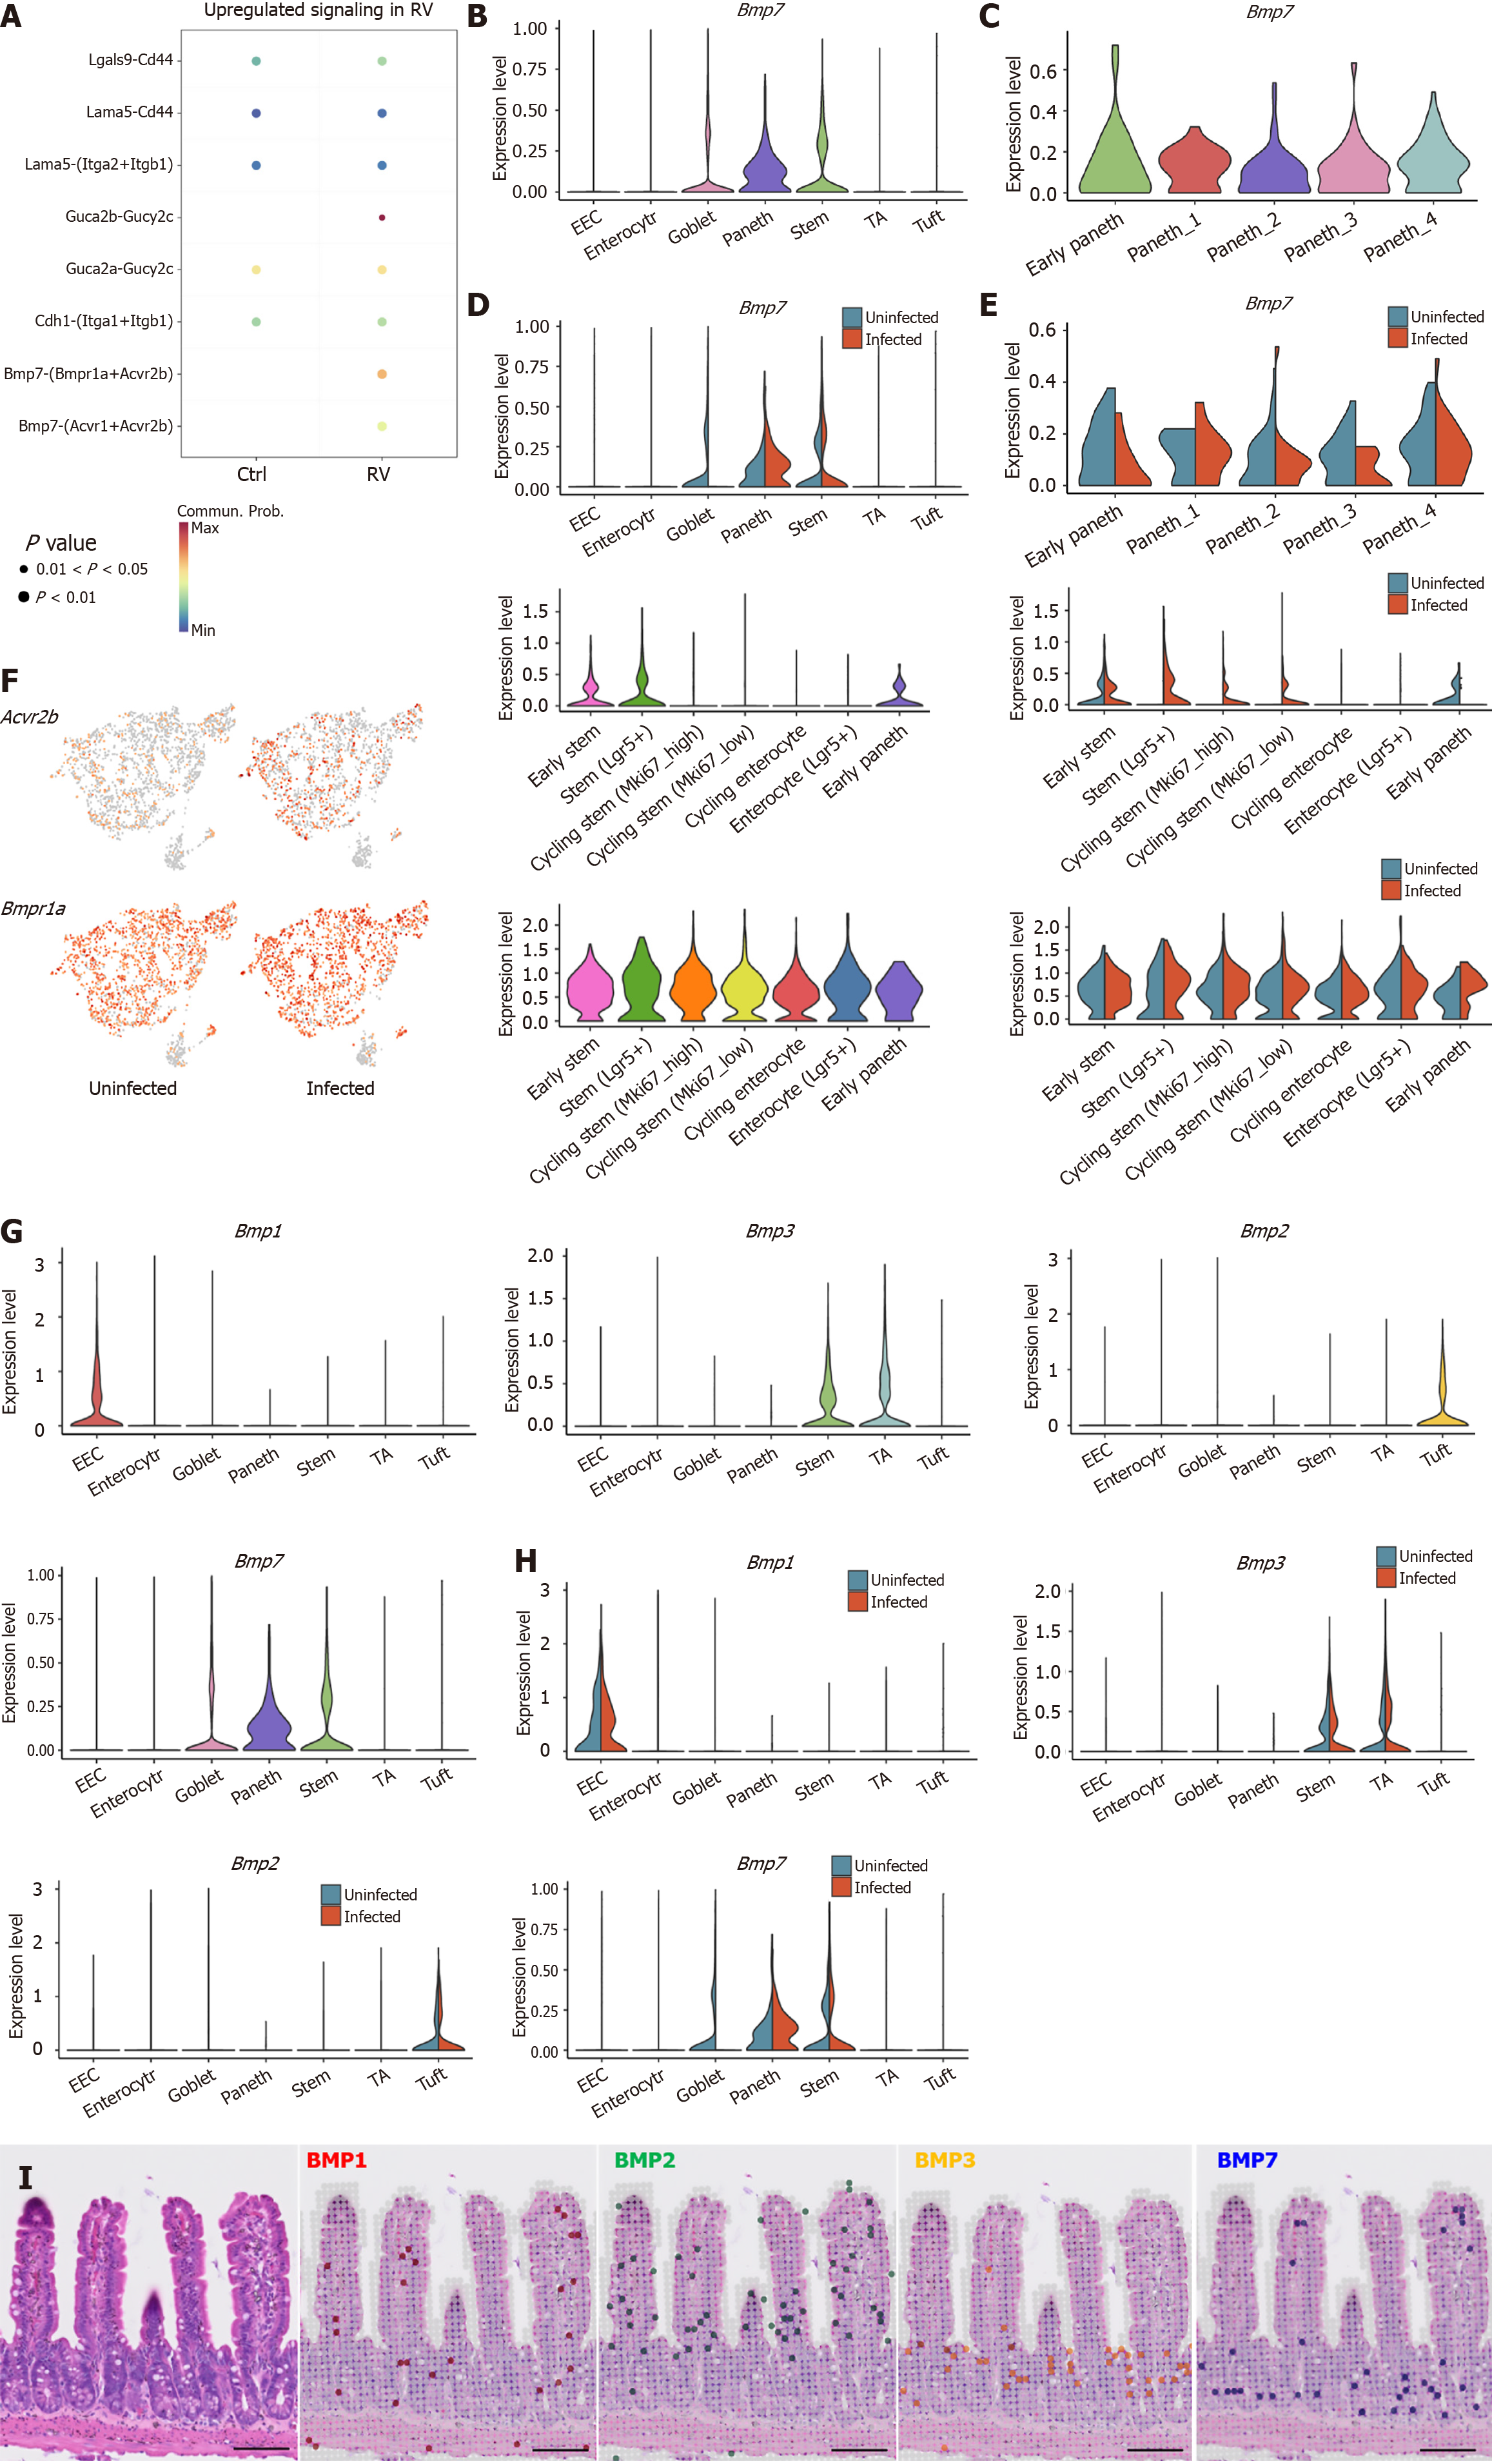
Figure 4 Paneth cells inhibit leucine-rich repeat-containing G protein-coupled receptor 5+ intestinal stem cells proliferation by the bone morphogenic protein 7-activin A receptor type 2B/bone morphogenic protein receptor type 1A pathway.
A: CellChat analysis of Paneth-intestinal stem cells communication reveals upregulation of the bone morphogenic protein 7 (BMP7)-activin A receptor type 2B signaling pathway under rotavirus infection; B: Violin plot of the expression of Bmp7 in Paneth cells; C: Bmp7 expression of subclustered Paneth cells; D and E: Comparison of Bmp7 expression in uninfected and infected Paneth cells; F: Feature plots (left) and violin plots (right) of the expression of activin A receptor type 2B and BMP receptor type 1A pathway of uninfected and infected stem cells; G: The expression patterns of various BMP family members across intestinal epithelial cells subclusters; H: Comparison of BMP expression in uninfected and infected intestinal epithelial cells subclusters; I: Spatial transcriptomic analysis of BMP localization in intestinal epithelial tissue. RV: Rotavirus; BMP: Bone morphogenic protein; EEC: Enteroendocrine cell; TA: Transit-amplifying cells; Acvr2b: Activin A receptor type 2B; Bmpr1a: Bone morphogenic protein receptor type 1A.
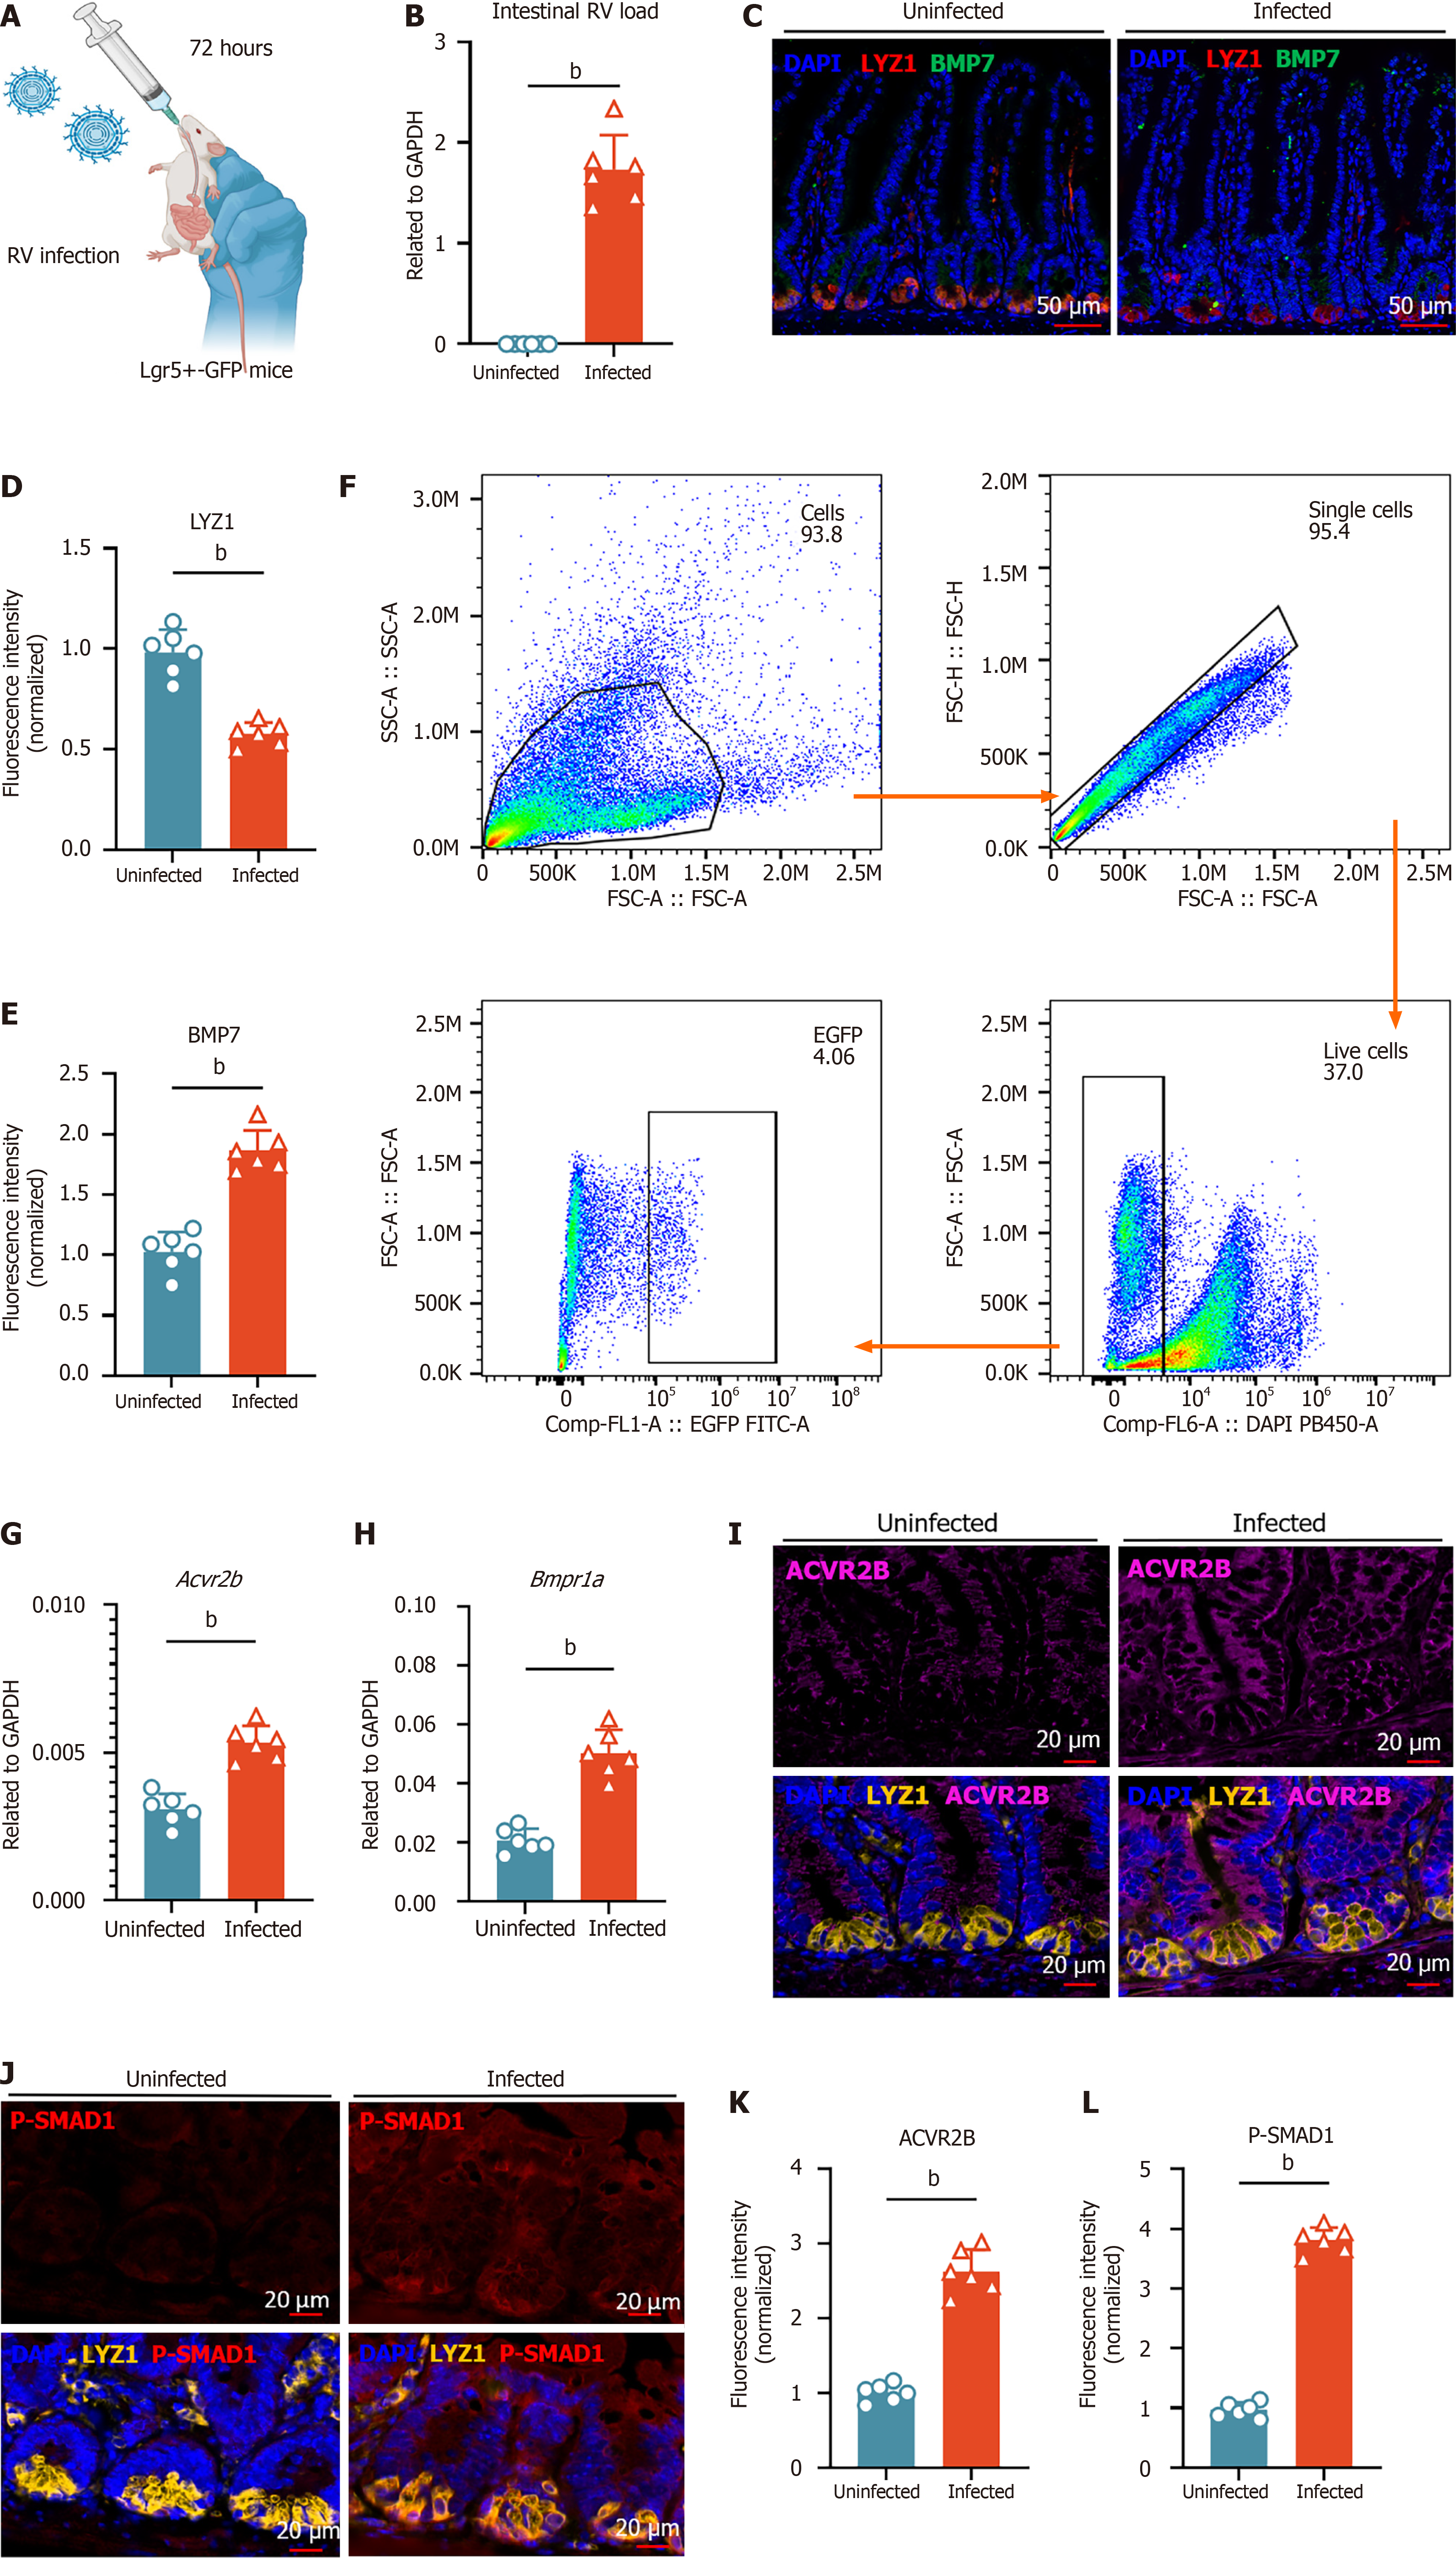
Figure 5 Functional validation of Paneth-intestinal stem cells bone morphogenic protein 7 pathway upregulation under rotavirus infection.
A: Leucine-rich repeat-containing G protein-coupled receptor 5+(Lgr5+)-green fluorescent protein mice aged 8 weeks were orally gavaged with the rotavirus enteric cytopathogenic human orphan virus strain and sacrificed 72 hours post-infection; B: Quantification of intestinal rotavirus load in uninfected and infected mice (n = 6, mean ± SD), measured by reverse transcription quantitative polymerase chain reaction and normalized to glyceraldehyde-3-phosphate dehydrogenase; C: Immunofluorescence (IF) staining of bone morphogenic protein 7 (BMP7) (green) and Paneth cell marker lysozyme 1 (LYZ1) (red) in uninfected and infected mice. Nuclei were counterstained with 4’,6-diamidino-2-phenylindole (DAPI) (blue). Scale bar = 50 μm; D and E: Quantification of LYZ1 and BMP7 fluorescence intensity in stem cells from uninfected and infected mice. Fluorescence intensity was normalized to the uninfected group (set to 1); F: Flow cytometric analysis for isolating Lgr5+ intestinal stem cells from uninfected and infected mice; G and H: Activin A receptor type 2B (Acvr2b) and BMP receptor type 1A expression in sorted Lgr5+ intestinal stem cells from uninfected and infected mice (n = 6, mean ± SD), measured by quantitative real-time polymerase chain reaction and normalized to glyceraldehyde-3-phosphate dehydrogenase; I: IF staining of ACVR2B (magenta) in uninfected and infected mice. Bottom panels show merged images of ACVR2B (magenta) with Paneth cell marker LYZ1 (yellow) and DAPI (blue). Scale bar = 20 μm; J: IF staining of phosphorylation of SMAD1 (red) in uninfected and infected mice. Right panels show merged images of phosphorylation of SMAD1 (red) with LYZ1 (yellow) and DAPI (blue). Scale bar = 20 μm; K and L: Quantification of ACVR2B and phosphorylation of Smad1 fluorescence intensity in stem cells from uninfected and infected mice. Fluorescence intensity was normalized to the uninfected group (set to 1). Statistical significance was determined using the non-parametric Mann-Whitney test between groups. bP < 0.01. RV: Rotavirus; Lgr5+: Leucine-rich repeat-containing G protein-coupled receptor 5+; GFP: Green fluorescent protein; GAPDH: Glyceraldehyde-3-phosphate dehydrogenase; DAPI: 4’,6-diamidino-2-phenylindole; Lyz: Lysozyme; BMP: Bone morphogenic protein; Acvr2b: Activin A receptor type 2B; Bmpr1a: Bone morphogenic protein receptor type 1A; P-SMAD1: Phosphorylation of SMAD1.
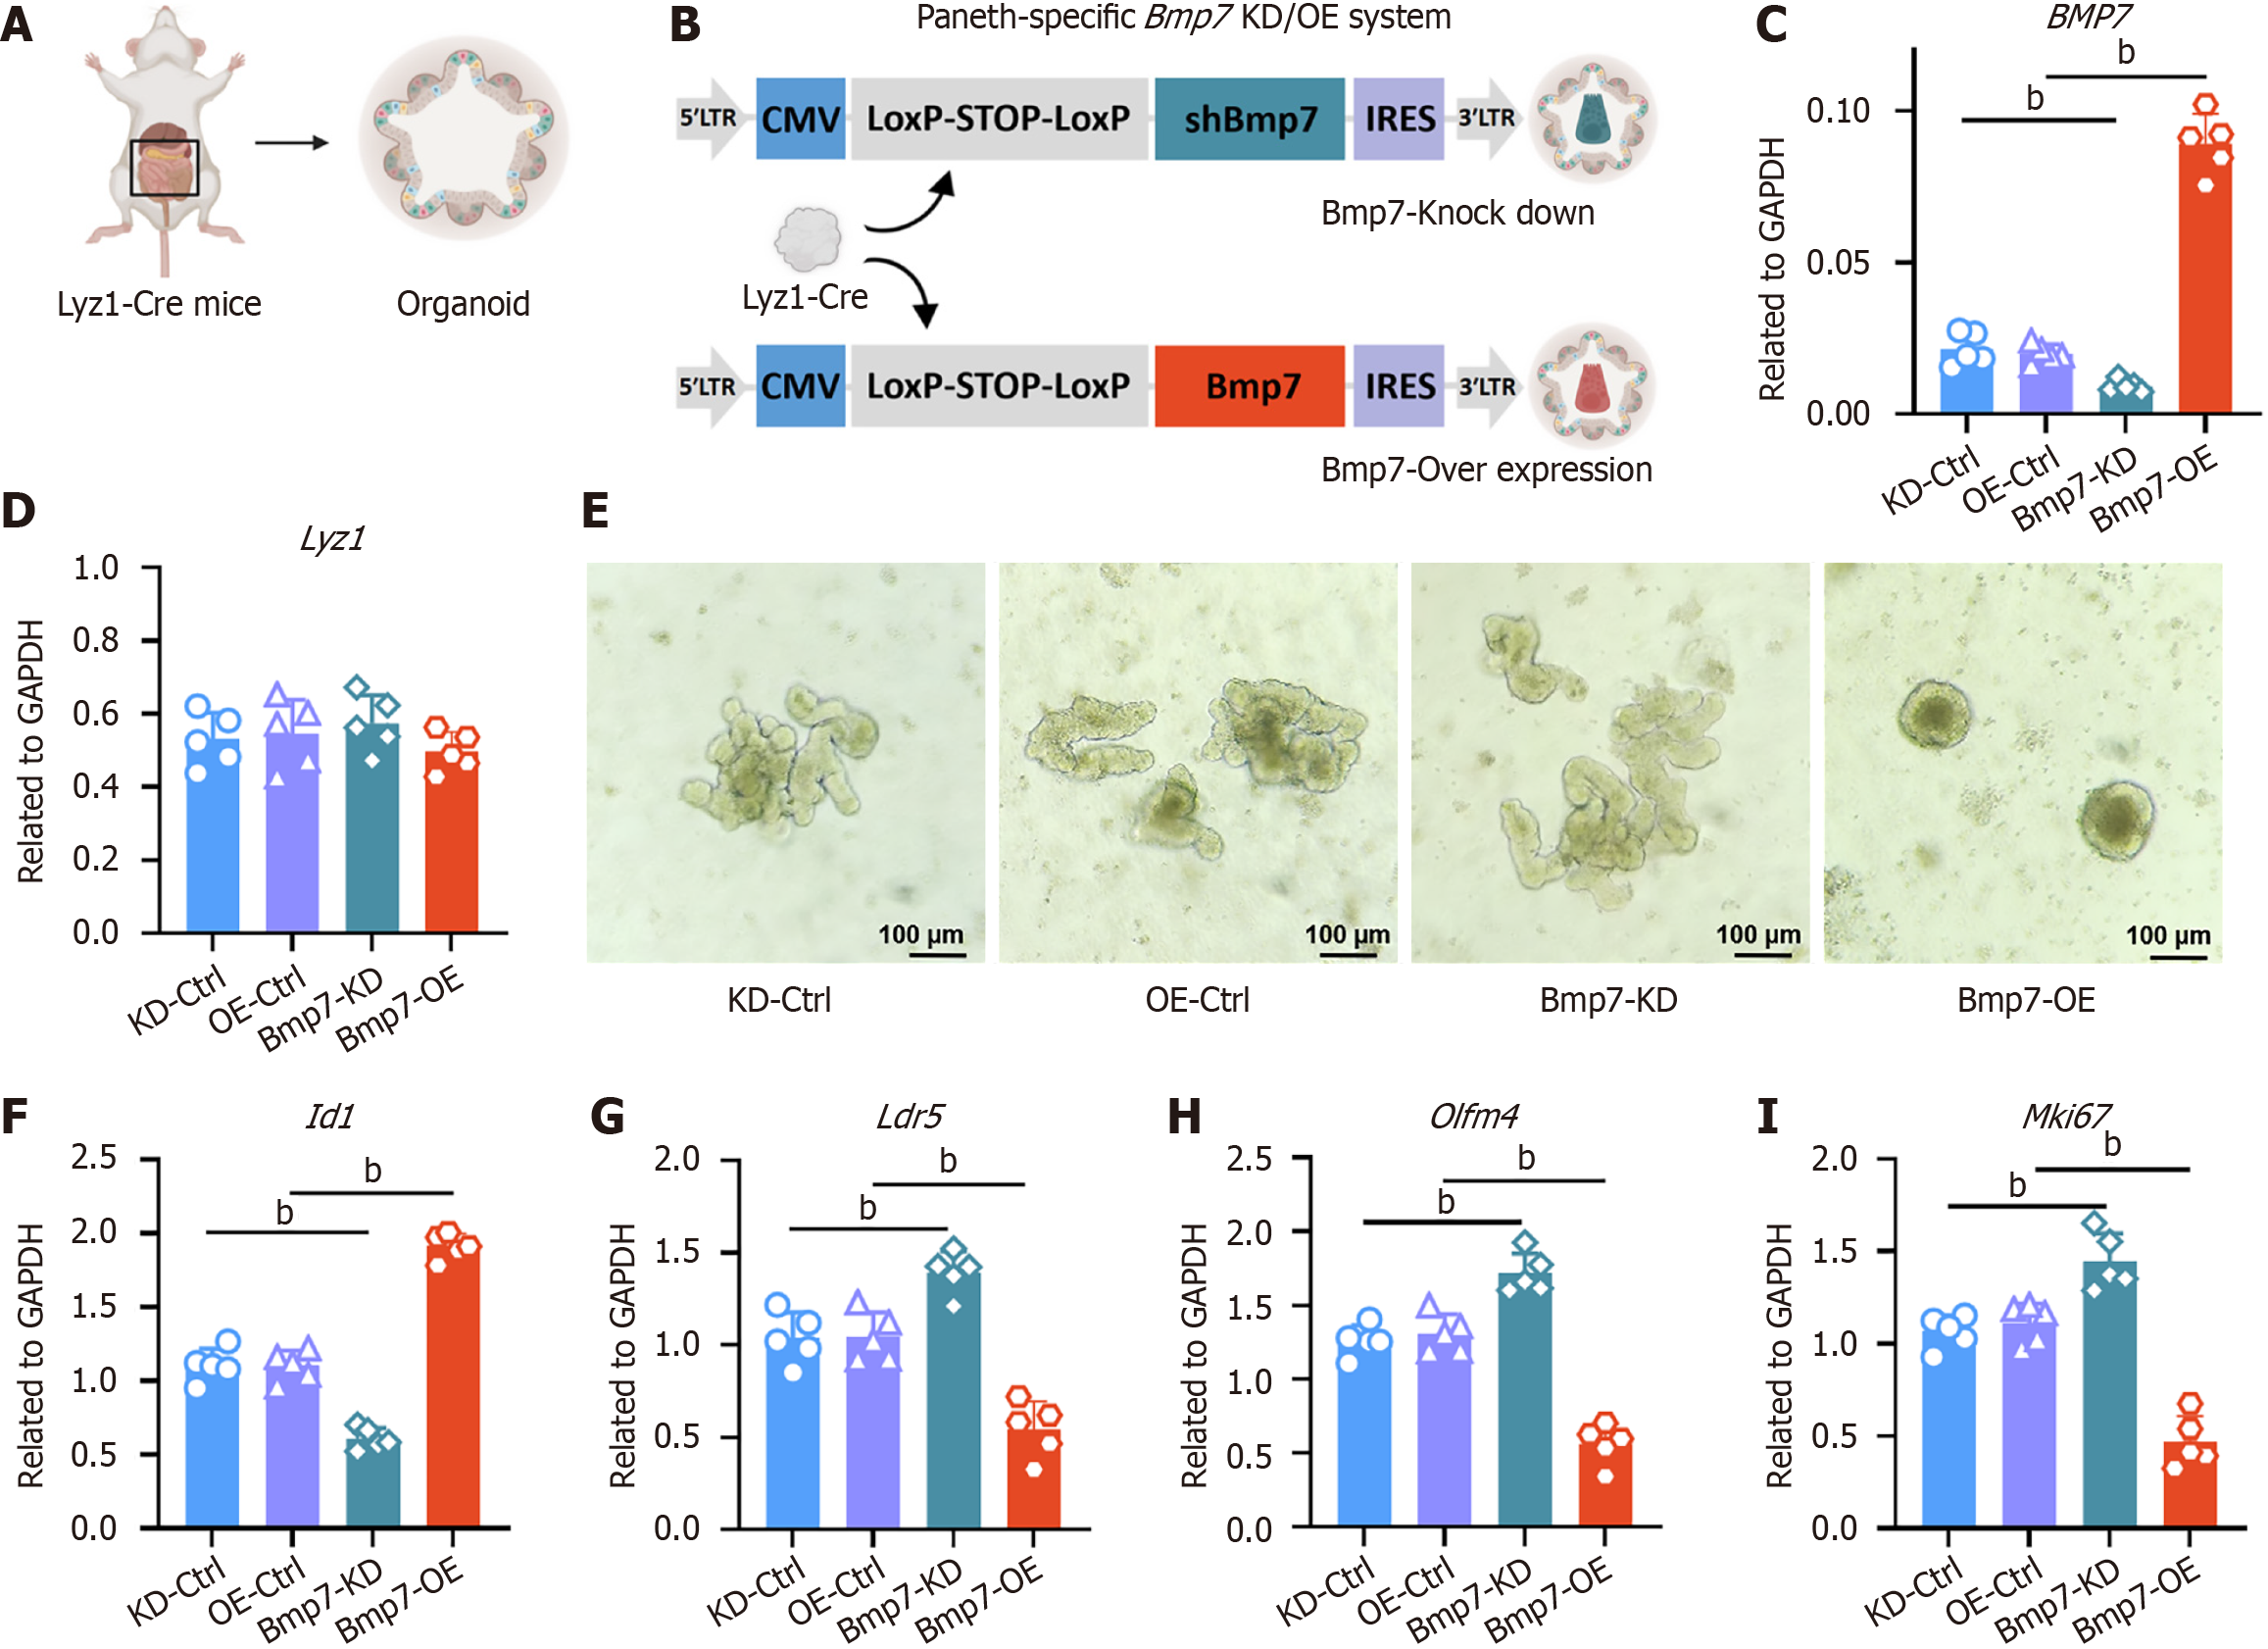
Figure 6 Paneth cell-specific modulation of bone morphogenic protein 7 regulates intestinal stem cell activity in organoids.
A: Schematic workflow illustrating the generation of intestinal organoids. Crypts were isolated from lysozyme 1-Cre mice and embedded in Matrigel to establish three-dimensional organoid cultures; B: Design of conditional lentiviral vectors enabling Paneth cell-specific knockdown (KD) or overexpression (OE) of bone morphogenic protein 7 (Bmp7). Both vectors contain a cytomegalovirus promoter driving a LoxP-STOP-LoxP cassette, followed by either a short hairpin RNA targeting Bmp7 (blue) or Bmp7 open reading frame (red) linked to an internal ribosome entry site-fluorescent reporter. Cre-mediated recombination in Paneth cells excises the stop cassette, permitting expression of the short hairpin RNA or transgene; C: Reverse transcription quantitative polymerase chain reaction analysis of Bmp7 mRNA levels in organoids from four groups (KD-Ctrl, OE-Ctrl, Bmp7-KD, Bmp7-OE; n = 5 organoid lines per group). Expression is normalized to glyceraldehyde-3-phosphate dehydrogenase and presented as mean ± SD; D: Lysozyme 1 expression is comparable across all groups, indicating that Bmp7 manipulation does not affect Paneth cell abundance; E: Representative bright-field images of organoids. Bmp7-KD organoids exhibit enlarged, highly branched morphologies, whereas Bmp7-OE organoids appear compact and spherical with markedly reduced budding; F: Quantitative polymerase chain reaction analysis of Id1; G: Quantitative polymerase chain reaction analysis of intestinal stem cell-associated markers leucine-rich repeat-containing G protein-coupled receptor 5; H: Quantitative polymerase chain reaction analysis of olfactomedin 4; I: Quantitative polymerase chain reaction analysis of marker of proliferation Ki-67. Statistical significance was determined using the non-parametric Mann-Whitney test between groups. bP < 0.01. Lyz: Lysozyme; Bmp: Bone morphogenic protein; KD: Knockdown; OE: Overexpression; CMV: Cytomegalovirus; IRES: Internal ribosome entry site; GAPDH: Glyceraldehyde-3-phosphate dehydrogenase; Lgr5: Leucine-rich repeat-containing G protein-coupled receptor 5; Olfm4: Olfactomedin 4; Mki67: Marker of proliferation Ki-67.
- Citation: Bu XY, Tan HY, Wang AM, Wei MT, Pan S, Gao JZ, Li YH, Qian GX, Chen ZH, Ye C, Jia WD. Paneth cells inhibit intestinal stem cell proliferation through the bone morphogenic protein 7 pathway under rotavirus-mediated intestinal injury. World J Gastroenterol 2025; 31(26): 107044
- URL: https://www.wjgnet.com/1007-9327/full/v31/i26/107044.htm
- DOI: https://dx.doi.org/10.3748/wjg.v31.i26.107044


